


There is abundant evidence that humans regularly prioritize negative information (e.g., Baumeister et al. Reference Baumeister, Bratslavsky, Finkenauer and Vohs2001; Rozin and Royzmann Reference Rozin and Royzman2001). On average, people tend to focus more on negative information than on positive information, and, on average, people tend to be more affected by negative information. This bias has consequences for politics. While studies find that negativity biases are widespread, there also are significant individual differences (Soroka, Fournier, and Nir Reference Soroka, Fournier and Nir2019). Some people are more reactive to negative information than others are, and those people are different politically. Indeed, some existing work suggests that individuals exhibiting larger negativity biases tend to be on the right side of the ideological spectrum (Hibbing, Smith, and Alford Reference Hibbing, Smith and Alford2014). The differences between conservatives and liberals in sensitivity to negative information are observed for cognitive behaviors, expressions of attitudes, and psychophysiological reactions. This paper focuses on the latter.
The seminal research examining psychophysiological negativity biases and political ideology was for the most part restricted to small samples of Americans (e.g., Dodd et al. Reference Dodd, Balzer, Jacobs, Gruszczynski, Smith and Hibbing2012; Oxley et al. Reference Oxley, Smith, Alford, Hibbing, Miller, Scalora, Hatemi and Hibbing2008; Smith et al. Reference Smith, Oxley, Hibbing, Alford and Hibbing2011). Is the American finding present elsewhere? Are right-leaning citizens more sensitive to negative information across the globe? Recent work has suggested that past US results do not easily replicate (Bakker et al. Reference Bakker, Schumacher, Gothreau and Arceneaux2020; Osmundsen et al. Reference Osmundsen, Hendry, Laustsen, Smith and PetersenForthcoming). In this paper, we examine the relationship between political ideology and negativity biases in physiological reactions with massive cross-national experimental data. We conduct the same pair of psychophysiological experiments in 17 countries on six continents. These places differ in terms of cultural attributes, economic development, media environments, and political institutions. Participants are exposed to both negative and positive video and photographic stimuli while their electrodermal activity is measured by sensors. Political ideology is assessed in a postexperimental survey. We use these data to test whether the difference in physiological reactions between negative and positive stimuli is larger among conservatives than among liberals across these various cross-national settings.
We view this research not as an exact replication of prior work, but rather a conceptual replication, testing the same idea with different stimuli, procedures, and measures. Results suggest a good deal of complexity in the connection between negativity biases and political ideology. Indeed, even as we find strong evidence of negativity biases generally, we find little to no evidence that biases are systematically associated with ideology, in the United States or elsewhere. Our results are thus, in part, a reminder of the importance of replication of small-sample, American findings. They are a warning against sometimes-polarizing claims about ideology and biology in the popular press.Footnote 1 However, they also serve to highlight individual-level differences in information processing, and in so doing they encourage further work on the role of deep-seated predispositions or personality in political preference formation.
Background
Negativity biases have been encountered in many disciplines. In political science, for example, when citizens develop assessments of governments and politicians, they tend to be swayed more by negative elements than by positive ones (Goren Reference Goren2002; Kernell Reference Kernell1977; Kinder Reference Kinder1978; Klein Reference Klein1991, Reference Klein1996; Lau Reference Lau1982; Soroka Reference Soroka2014). In political communication, news readers demonstrate a systematic preference for negative news content, and they are more attentive to and affected by that content (e.g., Ju Reference Ju2008; Sheafer and Dvir-Gvirtzman Reference Sheafer and Dvir-Gvirsman2010; Trussler and Soroka Reference Trussler and Soroka2014). In economics, prospect theory is built upon an asymmetric response to negative and positive information: people are risk-averse facing gains and risk-seeking facing losses (Bowman, Minehart, and Rabin Reference Bowman, Minehart and Rabin1999; Kahneman and Tversky Reference Kahneman and Tversky1979; Tversky and Kahneman Reference Tversky and Kahneman1991). In psychology, various opinions and behaviors from everyday life are more strongly determined by negative emotions and negative experiences (for reviews, see Baumeister et al. Reference Baumeister, Bratslavsky, Finkenauer and Vohs2001; Cacioppo and Gardner Reference Cacioppo and Gardner1999; Rozin and Royzman Reference Rozin and Royzman2001). The preferential treatment of negativity is even evident in neurological functioning (Smith et al. Reference Smith, Cacioppo, Larsen and Chartrand2003). In sum, across many domains, people appear to react more strongly to negative information than to positive information.
Where does the negativity bias come from? One dominant account rooted in evolutionary theory suggests that attention to negativity was advantageous for survival (Bebbington et al. Reference Bebbington, Colin, Mark Ellison and Fay2017; Brosnan et al. Reference Brosnan, Jones, Lambeth, Mareno, Richardson and Schapiro2007; Öhman, Flykt, and Esteves Reference Öhman, Flykt and Esteves2001; Öhman and Mineka Reference Öhman and Mineka2001; Shoemaker Reference Shoemaker1996). Using a colorful oversimplification, early humans who ignored the rustling noise in the bushes near the watering hole were more likely to be devoured by the predator hiding there, while those who ran away from the noise out of caution were more likely to survive. The process of natural selection may therefore have resulted in a human race with the propensity to prioritize negative information over positive information. Such an account leads to the expectation that the negativity bias should be present across the world, and recent work provides evidence that, on average, people are more sensitive to negativity across multiple diverse cultures (Soroka, Fournier, and Nir Reference Soroka, Fournier and Nir2019).
While the overall tendency to prioritize negative information is pervasive cross-culturally, there is also a great deal of individual-level variation around that mean tendency; some people are less influenced by negativity than others are (Soroka, Fournier, and Nir Reference Soroka, Fournier and Nir2019). Most importantly, given the focus of the current paper, individual variation in the negativity bias has been linked to political ideology (Hibbing et al. Reference Hibbing, Smith and Alford2014). Conservatives appear to exhibit more pronounced asymmetries in cognitive behavior: they tend to interpret ambiguous stimuli more negatively (Vigil Reference Vigil2010), to pay greater attention to negative information than to positive information (Carraro, Castelli, and Macchiella Reference Carraro, Castelli and Macchiella2011; Dodd et al. Reference Dodd, Balzer, Jacobs, Gruszczynski, Smith and Hibbing2012; McLean et al. Reference McLean, Garza, Wiebe, Dodd, Smith, Hibbing and Espy2014), to learn about negative elements rather than positive elements (Shook and Fazio Reference Shook and Fazio2009), to remember negative stimuli better than positive stimuli (Mills et al. Reference Mills, Gonzalez, Giuseffi, Sievert, Smith, Hibbing and Dodd2016), and to assign more weight to negative information when forming attitudes (Castelli and Carraro Reference Castelli and Carraro2011). Individuals who hold conservative political beliefs are also more likely to express disgust, a negatively valenced emotion (Aarøe, Petersen, and Arceneaux Reference Aarøe, Petersen and Arceneaux2017; Inbar et al. Reference Inbar, Pizarro and Bloom2009, Reference Inbar, Pizarro, Iyer and Haidt2012; Kam and Estes Reference Kam and Estes2016; Smith et al. Reference Smith, Oxley, Hibbing, Alford and Hibbing2011; Terrizzi, Shook, and McDaniel Reference Terrizzi, Shook and McDaniel2013; Tybur et al. Reference Tybur, Inbar, Aarøe, Barclay, Barlow, De Barra and Vaughn Becker2016).
This link between ideology and negativity biases has been evident in psychophysiological reactions as well. Past work suggests that conservatives have stronger electrodermal reactions than liberals do to threatening images (Oxley et al. Reference Oxley, Smith, Alford, Hibbing, Miller, Scalora, Hatemi and Hibbing2008), to disgusting images (Aarøe, Petersen, and Arceneaux Reference Aarøe, Petersen and Arceneaux2017; Smith et al. Reference Smith, Oxley, Hibbing, Alford and Hibbing2011), to aversive images (Dodd et al. Reference Dodd, Balzer, Jacobs, Gruszczynski, Smith and Hibbing2012), and to photos of politicians of opposing ideological stripes (Dodd et al. Reference Dodd, Balzer, Jacobs, Gruszczynski, Smith and Hibbing2012). Right-wing persons have also been shown to manifest stronger muscular blink amplitudes in response to startling noises (Oxley et al. Reference Oxley, Smith, Alford, Hibbing, Miller, Scalora, Hatemi and Hibbing2008). Recent research has extended these results from citizens to policymakers. For example, among a sample of state legislators and their staff, the level of skin conductance during exposition to threatening images predicted the degree of conservatism of spending preferences, even when controlling for partisan affiliation (Arceneaux, Dunaway, and Soroka Reference Arceneaux, Dunaway and Soroka2018).
These studies about political ideology and negativity biases in physiological reactions are illustrative of an increasing body of work documenting the associations between biology and political attitudes and behaviors over the past 15 years (e.g., Hatemi and McDermott Reference Hatemi and McDermott2011; Hibbing, Smith, and Alford Reference Hibbing, Smith and Alford2013). Going beyond correlations to survey self-reports, ideological orientations have been linked to a variety of biological processes including genetic hereditability in twin studies (Alford, Funk, and Hibbing Reference Alford, Funk and Hibbing2005; Cranmer and Dawes Reference Cranmer and Dawes2012), variation in the sequencing of actual genes (Hatemi et al. Reference Hatemi, Gillespie, Eaves, Maher, Webb, Heath and Medland2011; Settle et al. Reference Settle, Dawes, Christakis and Fowler2010), the level of hunger and sugar deprivation (Aarøe and Petersen Reference Aarøe and Petersen2013; Petersen et al. Reference Petersen, Aarøe, Jensen and Curry2014), the amount of muscular mass (Petersen et al. Reference Petersen, Sznycer, Sell, Cosmides and Tooby2013; Petersen and Laustsen Reference Petersen and Laustsen2019), the sensitivity to certain odors (Friesen et al. Reference Friesen, Gruszczynski, Smith and AlfordForthcoming; McDermott, Tingley, and Hatemi Reference McDermott, Tingley and Hatemi2014), and the activation of different brain regions (Ahn et al. Reference Ahn, Kishida, Xiaosi, Lohrenz, Harvey, Alford and Smith2014; Amodio et al. Reference Amodio, Jost, Master and Yee2007; Kanai et al. Reference Kanai, Feilden, Firth and Rees2011; Schreiber et al. Reference Schreiber, Fonzo, Simmons, Dawes, Flagan, Fowler and Paulus2013).
It is nevertheless the case that some studies have failed to find a connection between political ideology and physiological reactions. Knoll, O’Daniel, and Cusato (Reference Knoll, O’Daniel and Cusato2015) could not reproduce prior findings (Dodd et al. Reference Dodd, Balzer, Jacobs, Gruszczynski, Smith and Hibbing2012; Oxley et al. Reference Oxley, Smith, Alford, Hibbing, Miller, Scalora, Hatemi and Hibbing2008; Smith et al. Reference Smith, Oxley, Hibbing, Alford and Hibbing2011). They uncovered no significant gap in skin conductance between conservatives and liberals in response to disgusting and threatening images in a sample of university students. Concerns have been raised about the comparability of this study to previous work (Peterson, Smith, and Hibbing Reference Peterson, Smith and Hibbing2016). That said, two forthcoming papers are also largely unable to replicate the link between electrodermal responses to disgusting/threatening images and conservative political beliefs with samples of American, Danish, and Dutch individuals (Bakker et al. Reference Bakker, Schumacher, Gothreau and Arceneaux2020; Osmundsen et al. Reference Osmundsen, Hendry, Laustsen, Smith and PetersenForthcoming).
There clearly is a need both for replications and for more comparative research on the relationship between political ideology and negativity biases in physiological responses. Thus far, most of the empirical support for the link between right-wing ideology and heightened physiological negativity biases comes from relatively small samples in the United States. Intuitively, there are many reasons to expect that the dynamic is the same worldwide. A greater sensitivity to negative information among conservatives would go a long way towards explaining seemingly recurring patterns such as the tendency of right-wing political parties and voters to be concerned with issues such as crime, defense, and immigration. However, the incessant fear (for us, at least) is that the American political system is exceptional. The strong, simple two-party system, the degree to which partisanship permeates numerous aspects of public life, the growing party polarization, and the escalating affective animosity across party lines in the United States—all of these factors—should make us circumspect about generalizing US findings to other contexts.
To what extent is the link between psychophysiological negativity biases and political ideology a generalizable explanation of political preferences? This paper examines whether or not the negativity bias in physiological responses is related to conservatism cross-nationally in many different settings. It relies on two experimental studies: one focused on reactions to real-world television news stories and another focused on reactions to more tightly controlled photos from the International Affective Picture System (IAPS). As we shall see, both have difficulty supporting a relationship between psychophysiological negativity biases and political ideology.
Study 1: A Cross-National Video Experiment
Our analyses are based on lab experiments conducted in 17 countries on six continents: Brazil, Canada, Chile, China, Denmark, France, Ghana, India, Israel, Italy, Japan, New Zealand, Russia, Senegal, Sweden, the UK, and the US. Although we have 17 countries, we refer to 19 samples, because we ran separate samples of both Anglophones and Francophones in Canada and both Jews and Palestinians in Israel. In total, we collected data on over 1,100 respondents. This is, to our knowledge, the most broadly comparative psychophysiological study to date.
Our objective in each country was to find a sample of 40+ participants, evenly divided by gender and with variation in terms of age, education, income, and ideology.Footnote 2 We sought access to non-student samples whenever possible. That said, there are several countries for which only student samples were available to us. More details on sample recruitment can be found in the Online Appendix. Figure 1 shows three panels: (1) the total number of respondents by country and gender, (2) the mean (squares) and interquartile range (whiskers) in age, and (3) the mean (squares) and interquartile range (whiskers) in self-described English-language proficiency. More details about the samples are shown in Table A1 in the Online Appendix.
Sample Characteristics

We used an identical protocol in every country, and all experiments were fielded personally by the authors, alongside local research assistants (with local language skills where necessary). Experiments were typically conducted in a room—often, but not necessarily a purpose-built lab—at a local university. In Brazil, Russia, and Senegal, we used a hotel conference room; in India, some experiments were run in a shed near a building complex. In every instance, we looked for quiet locations in rooms where nothing was happening but our experiment. We always placed respondents towards a wall or blank space so that there were no visual distractions during the experiment. We also always used noise-canceling headphones to reduce the influence of noise from outside the room.
Study 1 examines negativity biases in individuals’ physiological reactions to real network news content. We are attracted to the use of actual news coverage because it is a realistic, “real-world” stimulus. We regard our video-experimental results as having high external validity as a result. Whether we should expect results that are identical to past work focused on photo stimuli is not clear, but prior research finds a moderate correlation between negativity biases measured using skin conductance in response to photo and video stimuli (Soroka et al. Reference Soroka, Fournier and Nir2019). Accordingly, it seems reasonable to expect that ideological differences in negativity biases in reactions to photos will be evident with videos as well.
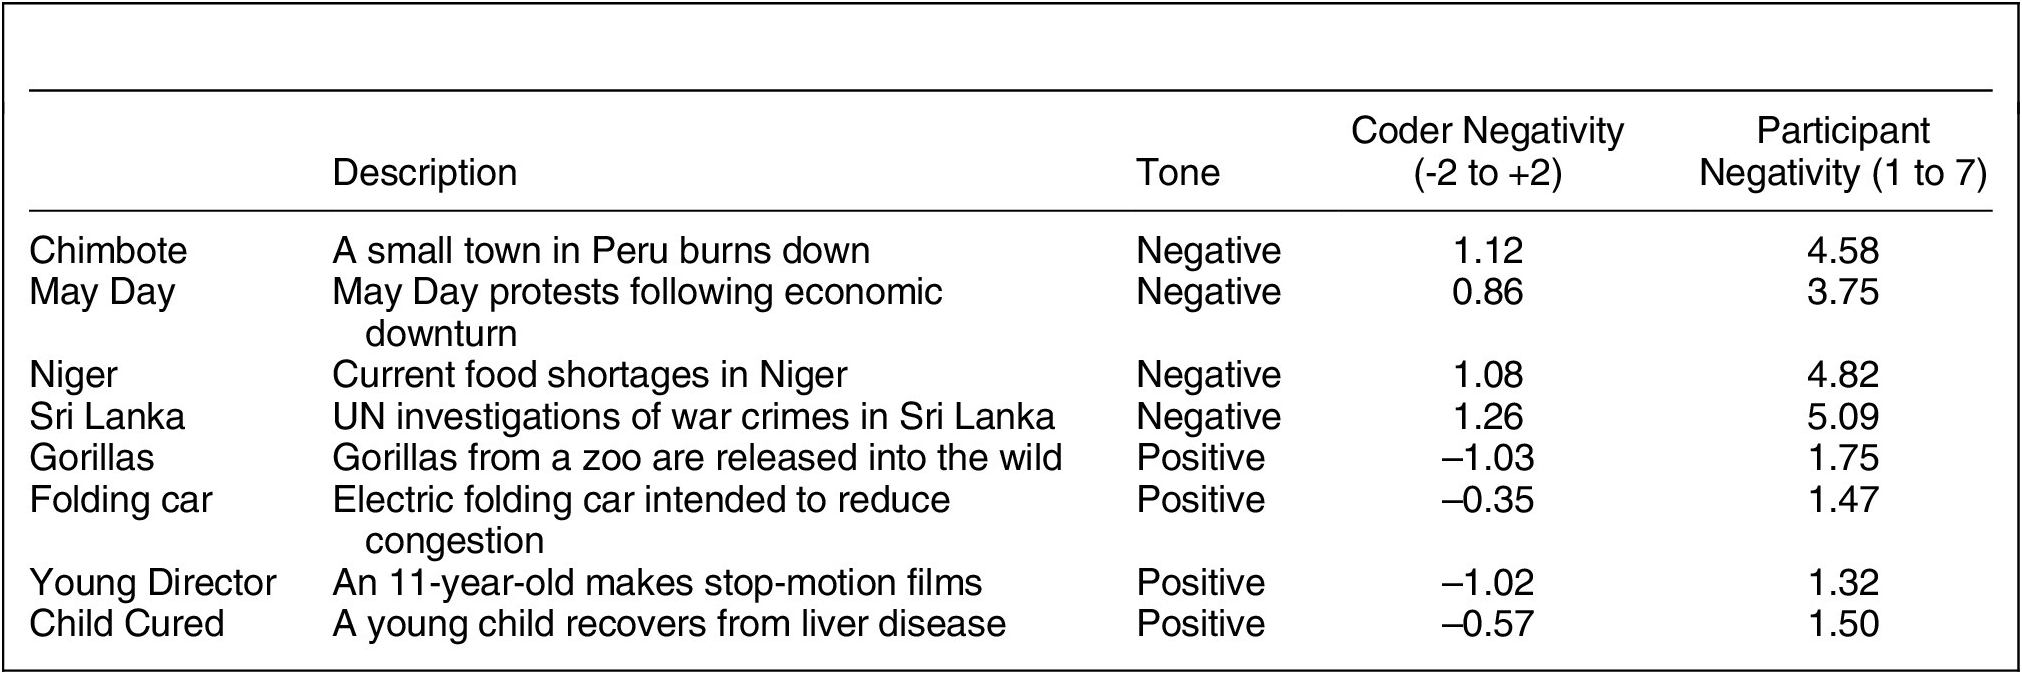
Participants watch a news program on their own on a computer screen. The news content experiment lasts roughly 25 minutes, during which participants view seven randomly-ordered news stories, selected on a variety of topics, and across a range of tone, from very positive to very negative.Footnote 3 Stories are preceded by a two-minute gray screen, and then they are separated by 40 seconds of gray screen thereafter. Of the seven stories presented to each participant, one is domestic and negative while one is domestic and positive. The remaining five stories are drawn from a sample of eight international stories, four positive and four negative. In this paper, we focus on the international stories that constitute identical stimuli across all countries (though we do consider the domestic stories in the robustness checks below). The stories are briefly described in Table 1.
The Video Stimuli

News stories are a carefully selected (nonrandom) sample of real news stories from BBC World News. Stories are selected by the authors, drawing on all the BBC news stories available online. Story selection is guided by several criteria: (1) stories should be relatively timeless, since experiments would be run over a number of years; (2) stories should be ‘international’ for all samples, that is, news stories should not focus on countries that would be part of the study (with some exceptions for stories that are located in the UK but do not focus on the UK per se, e.g., a story about a child recovering from liver disease); (3) stories should be very clearly positive or negative (initially assessed by the authors, but confirmed by expert coders); (4) stories should last between two and three minutes; and (5) the final selection of stories should include a broad range of different topics.
The advantage of using BBC World News is that the content is directed at a worldwide audience, so stories accordingly focus on themes that are of relevance across the countries we examine. BBC World News is regularly aired in many of the countries we study—it is as close as we can come to “regular” news across a wide range of countries. The decision to use identical stimuli across all countries comes with some complications, admittedly. One complication arising from using BBC World News is that the news source is in English. Our participants must thus understand English, or we must translate the content. Subtitles are used in the following countries: Brazil, Canada (with French sample), Chile, China, France, India, Israel, Italy, Japan, Russia, and Senegal. All subtitles are embedded in videos by the authors.Footnote 4
The tone of news stories is assessed in several ways. Here, we rely on averaged second-by-second coding of each story by three expert coders, using a 5-point scale. While the negative stories tend to be consistently negative and the positive stories tend to be consistently positive, there is some within-story variation as well. It is for this reason that we rely on an average of second-by-second coding rather than a simple binary positive/negative coding of stories. These coder scores are presented in the fourth column of Table 1. The negativity manipulation check, shown in the last column of Table 1, confirms that experimental participants have similar perceptions of the stimuli. They also rate the positive stories more positively and the negative stories more negatively (on a 7-point scale). Furthermore, participants’ scores should alleviate concerns that the stimuli’s negativity is not perceived the same way across our various countries: among every sample the average ratings of negative stories are significantly more negative than ratings of positive stories (see Table A2 in the Online Appendix).
We capture negativity biases using psychophysiological measures. There already is a considerable body of work examining negativity biases in psychophysiology (see references above). There is a growing literature on psychophysiological reactions to political news content as well (e.g., Grabe et al. Reference Grabe, Lang, Zhou and Bolls2000; Soroka, Fournier, and Nir Reference Soroka, Fournier and Nir2019). Physiological measures have the advantage of capturing real-time, quite possibly subconscious, reactions to news content. We focus here on skin conductance, the measure that is the center of attention in prior work (Aarøe, Petersen, and Arceneaux Reference Aarøe, Petersen and Arceneaux2017; Arceneaux, Dunaway, and Soroka Reference Arceneaux, Dunaway and Soroka2018; Dodd et al. Reference Dodd, Balzer, Jacobs, Gruszczynski, Smith and Hibbing2012; Oxley et al. Reference Oxley, Smith, Alford, Hibbing, Miller, Scalora, Hatemi and Hibbing2008; Smith et al. Reference Smith, Oxley, Hibbing, Alford and Hibbing2011). Skin conductance is measured using biosensors connected to participants’ first and third fingers on their nondominant hand. Variations in skin conductance, controlled by the sympathetic nervous system, are considered to indicate arousal and emotional activation (Bolls, Lang, and Potter Reference Bolls, Lang and Potter2001; Lang et al. Reference Lang, Bolls, Potter and Kawahara1999, Reference Lang, Zhou, Schwartz, Bolls and Potter2000; Simons et al. Reference Simons, Detenber, Roedema and Reiss1999; see review in Ravaja Reference Ravaja2004). (Note that skin conductance indicates activation only, and not valence, which is typically inferred from the valence of stimuli rather than skin conductance itself.) Galvanic skin levels (GSL) are originally sampled 256 times per second, and that raw GSL signal is smoothed slightly for analysis. In addition, as is common in the literature, we use normalized measures of GSL that rescale results as deviations from the baseline, captured during the blank screen that preceded each stimulus. The measure thus takes into account the fact that different people will have different baseline GSLs. As is typical in work relying on skin conductance measures, the signal for each respondent was checked manually to identify respondents who are nonresponders (i.e., show no variance in skin conductance) or for whom there was an error with the skin conductance sensors (producing abnormally low skin conductance levels with little to no over-time variation). These respondents are excluded from analyses. Details regarding this process as well as data processing more generally can be found in the Online Appendix.
Previous research on the connection between political orientations and physiological reactions has relied on different conceptions of conservatism: social conservatism (Oxley et al. Reference Oxley, Smith, Alford, Hibbing, Miller, Scalora, Hatemi and Hibbing2008), specific policy preferences (Aarøe, Petersen, and Arceneaux Reference Aarøe, Petersen and Arceneaux2017; Smith et al. Reference Smith, Oxley, Hibbing, Alford and Hibbing2011), spending preferences (Arceneaux, Dunaway, and Soroka Reference Arceneaux, Dunaway and Soroka2018), and combinations of ideology, party identification, and policy positions (Dodd et al. Reference Dodd, Balzer, Jacobs, Gruszczynski, Smith and Hibbing2012). In this paper, we concentrate on political ideology, a long-term and relatively stable orientation that has a stronger chance of being linked to biological processes than short-term opinions. That said, we also test specific policy preferences in secondary analyses below. Our project required an ideological measure that would work across a very diverse set of countries. We consequently could not use common American measures such as the self-reported liberal-conservative scale. Instead, we used a shortened variant of the Wilson–Patterson Conservatism scale (Wilson and Patterson Reference Wilson and Patterson1968).Footnote 5 A common instrument in psychophysiological studies (Alford, Funk, and Hibbing Reference Alford, Funk and Hibbing2005; Dodd et al. Reference Dodd, Balzer, Jacobs, Gruszczynski, Smith and Hibbing2012; Hatemi et al. Reference Hatemi, Funk, Medland, Maes, Silberg, Martin and Eaves2009; Oxley et al. Reference Oxley, Smith, Alford, Hibbing, Miller, Scalora, Hatemi and Hibbing2008), this index captures “resistance to change and adherence to tradition” (Hibbing, Smith, and Alford Reference Hibbing, Smith and Alford2013, 101–2). Rather than being asked whether or not they consider themselves conservative, respondents indicate whether or not they “agree” with various issues. Very American issues such as the Patriot Act and school prayer were dropped. We selected 14 issues that we felt could be meaningful across the various countries of our study: abortion, capitalism, censorship, death penalty, gay marriage, gun control, immigration, military spending, obedience, patriotism, pollution control, socialism, tax cuts, and women’s equality. A total of 12 of these 14 issues were used by prior studies of the link between conservatism and psychophysiological reactions (Dodd et al. Reference Dodd, Balzer, Jacobs, Gruszczynski, Smith and Hibbing2012; Oxley et al. Reference Oxley, Smith, Alford, Hibbing, Miller, Scalora, Hatemi and Hibbing2008; Smith et al. Reference Smith, Oxley, Hibbing, Alford and Hibbing2011), the exceptions being capitalism and censorship. So our item selection is broadly compatible with a focus on attitudes toward “social protection” (Oxley et al. Reference Oxley, Smith, Alford, Hibbing, Miller, Scalora, Hatemi and Hibbing2008, 1668), rather than economic conservatism.
Despite our efforts to select Wilson–Patterson items that would work across our diverse countries, the structure of opinions—as revealed by factor analysis and reliability analysis—differs considerably from country to country. Some of these issues simply do not resonate and discriminate respondents in some countries. Consequently, our ideological measure is based on different subsets of the 14 items for each sample. For instance, in two countries (i.e., France and the US), 12 of the 14 items work as a unified ideological construct; elsewhere (like in China, Ghana and Senegal), only 4 to 5 items coalesce. Our average alpha reliability score is 0.66. Full details on the construction of the sample-specific ideological measure are included in the Online Appendix.
The strength of this approach to measuring ideology is that it allows for the “content” of left and right to differ from one country to the next. One weakness is that it cannot on its own be used to ensure that our samples include participants on the left and the right of the political spectrum because our measure has no obvious midpoint. We cannot easily know whether the measure divides our participants across the left and right, or just across the left and less left, for instance. We accordingly also rely on a measure asking participants to place themselves on a standard 11-point Left–Right scale. This measure also allows the “content” of left and right to differ across countries, although it does assume that participants have an understanding of left and right, and it does not specify whether it refers to economic or social conservatism. Regardless, the measure has a clear midpoint. Figure A1 in the Online Appendix, using a categorical version of these Left–Right self-placements, confirms that our country samples include a sufficient number of respondents on both ends of the ideological continuum. The Wilson–Patterson and the Left–Right measures are moderately correlated (0.40), and conducting our analyses with one measure or the other does not change our results (see the robustness checks below).
Because we rely on different experimental procedures, use televised news stories as stimuli, and measure both electrodermal activity and ideology somewhat differently from past work, our study does not constitute an exact replication of prior research accomplished in the US (e.g., Dodd et al. Reference Dodd, Balzer, Jacobs, Gruszczynski, Smith and Hibbing2012; Oxley et al. Reference Oxley, Smith, Alford, Hibbing, Miller, Scalora, Hatemi and Hibbing2008; Smith et al. Reference Smith, Oxley, Hibbing, Alford and Hibbing2011). It should be viewed as a conceptual replication, insofar as it tests hypotheses from previous studies using a different combination of stimuli, procedures, and measures. This means our paper cannot assess the validity of the findings from earlier work. Rather, we examine the robustness and generalizability of the ideas across various cross-national settings.
To conduct systematic tests on the data, our analyses proceed at three different levels: individual-level data, stimulus-level data, and time-series data. First, with individual-level data, each of our 933 cases is a participant, and we examine their average physiological reaction across all stimuli. This is the type of evidence used in influential prior work (e.g., Dodd et al. Reference Dodd, Balzer, Jacobs, Gruszczynski, Smith and Hibbing2012; Oxley et al. Reference Oxley, Smith, Alford, Hibbing, Miller, Scalora, Hatemi and Hibbing2008; Smith et al. Reference Smith, Oxley, Hibbing, Alford and Hibbing2011). Second, in the stimulus-level data, each case is a participant’s mean reaction to a single news story. Rather than 933 cases, we have 4,665 cases (933 respondents × 5 stories). Though a panel estimation ensures that standard errors take into account within-respondent correlated errors, it also means that we can better leverage within-respondent variation across news stories with different degrees of negativity or positivity. While the negative stories are all negative, some are more negative than others, and the same applies to positive stories. Finally, since the tone of news stories was coded second-by-second and physiology was measured continuously, we can take advantage of a third level of analysis: time-series panel data. Here, we leverage not just across- but within-story variation in tone. Such analyses contain over 650,000 data points.
Note that we present power analyses in the Online Appendix, focused mainly on the individual-level data for which our sample sizes are smaller. Suffice it to say here that the analyses we present below are not underpowered. We consider a Bayesian approach to our analyses in the Online Appendix as well to better identify the likelihood of H0 versus H1, which we discuss further below.
Results: Physiology and Videos
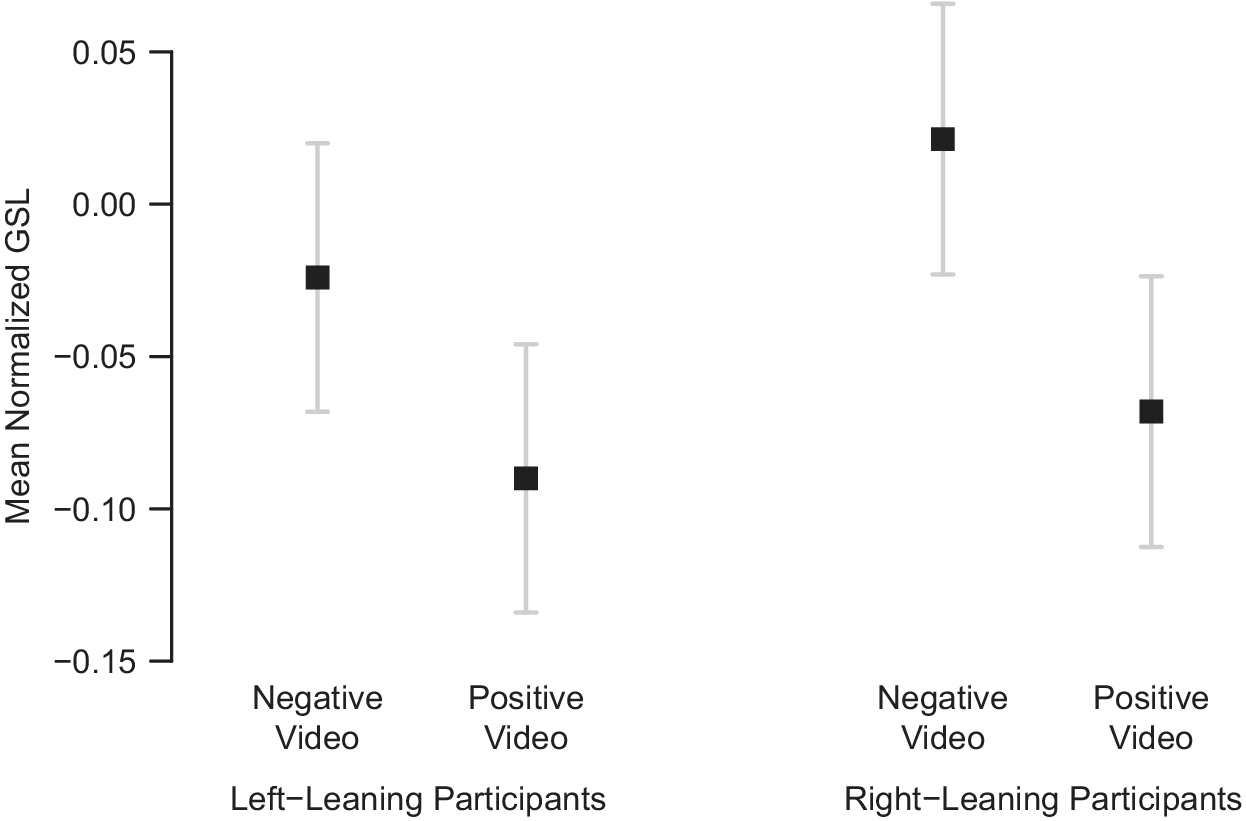
We start with the simplest level of analysis: individual-level data. Figure 2 reports mean normalized GSL in response to all negative and all positive news stories in the pooled data (all 19 samples combined).Footnote 6 Respondents are split according to each country’s median score on the Wilson–Patterson ideological scale. A negativity bias is clearly evident among both groups: normalized GSL is higher for negative videos than for positive videos, and this is the case for both liberals and conservatives. The significance of the gaps is confirmed by difference-in-means tests. Results in Figure 2 also suggest that right-leaning participants may be more activated by negative information. The gap in conservatives’ GSL during negative versus positive videos is slightly larger than the gap exhibited by left-leaning participants. However, this difference between the gaps for the two ideological groups is not statistically significant (p = 0.57).
The Effect of Story Tone on Skin Conductance by Ideology

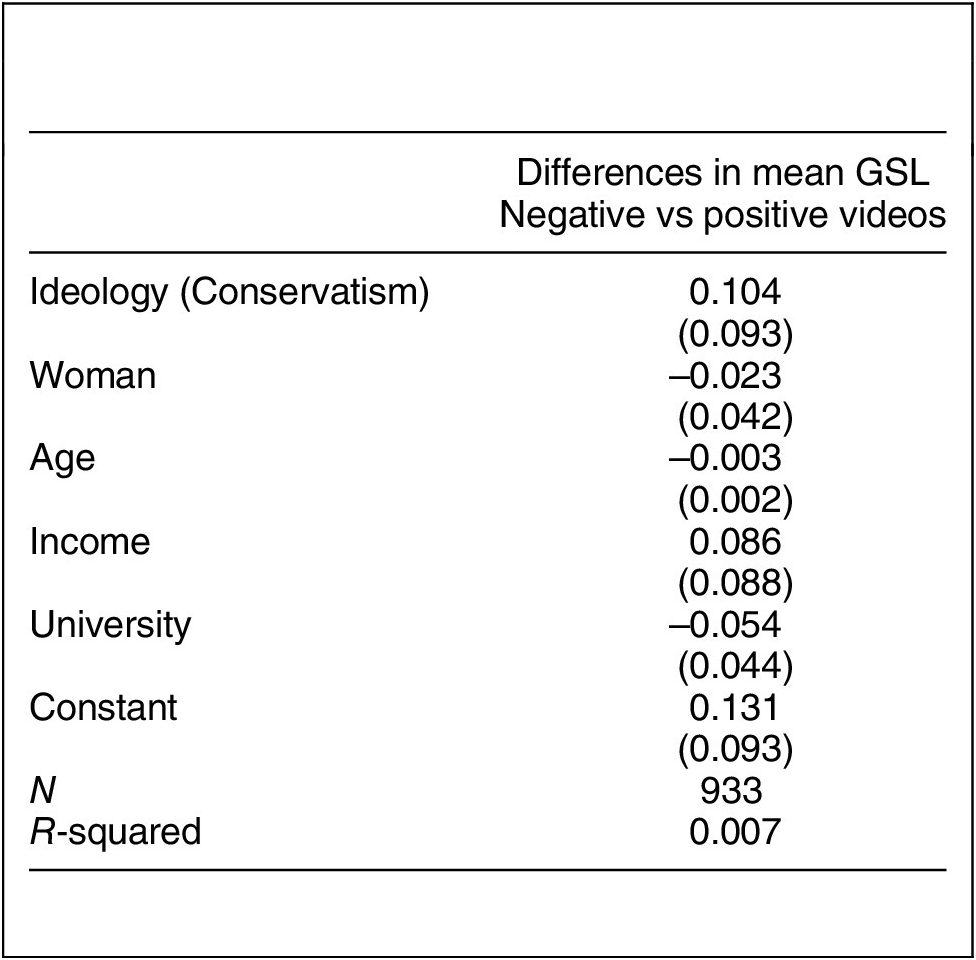
To conduct a more systematic test of the individual data, we regress the difference between mean GSL during negative videos and mean GSL during positive videos on the full scale of the Wilson–Patterson index in the pooled data, controlling for demographics (Table 2). The dependent variable ranges from -3.9 to +3.7; a score above 0 means that reactions to the negative news stories are stronger, while a score below 0 means that people are more affected physiologically by positive news. Ideology ranges from 0 to 1; higher scores correspond to a more right-wing orientation. While prior work using individual-level data often regresses ideology on physiology (e.g., Dodd et al. Reference Dodd, Balzer, Jacobs, Gruszczynski, Smith and Hibbing2012; Oxley et al. Reference Oxley, Smith, Alford, Hibbing, Miller, Scalora, Hatemi and Hibbing2008), here we do the reverse, regressing physiology on ideology. This approach is not due to our presumptions about the causal ordering of these variables, on which we remain agnostic. Rather, we do this to keep the results of individual-level analyses consistent with those of stimulus-level and time-series analyses, which both require physiology to be the dependent variable. If we reproduce all individual-level analyses presented here with ideology regressed on physiology, the conclusions remain intact.Footnote 7
The Effect of Ideology on Negativity Bias (Pooled Individual-Level Data)

Note: ***p < .001, **p < .01, *p < .05.
Ordinary least squares (OLS) results in Table 2 include a positive coefficient for ideology, suggesting that conservatives may be more affected by negative information, but the relationship is substantively small (4% of a standard deviation according to the standardized coefficient, which is about a tenth of the magnitude reported in Oxley et al. Reference Oxley, Smith, Alford, Hibbing, Miller, Scalora, Hatemi and Hibbing2008), and not statistically significant. A nonsignificant coefficient does not necessarily mean that our results are incompatible with the findings of prior work (Harms and Lakens Reference Harms and Lakens2018; Rainey Reference Rainey2014), but our standardized coefficient’s confidence interval not only spans 0 (-0.03–0.10), it fails to cover the value of the standardized coefficient presented in Oxley et al. (Reference Oxley, Smith, Alford, Hibbing, Miller, Scalora, Hatemi and Hibbing2008; 0.38 in Table 1), or even a third of that value. Model fit statistics also indicate that ideology offers little explanatory power of physiological reactions to video news reports.
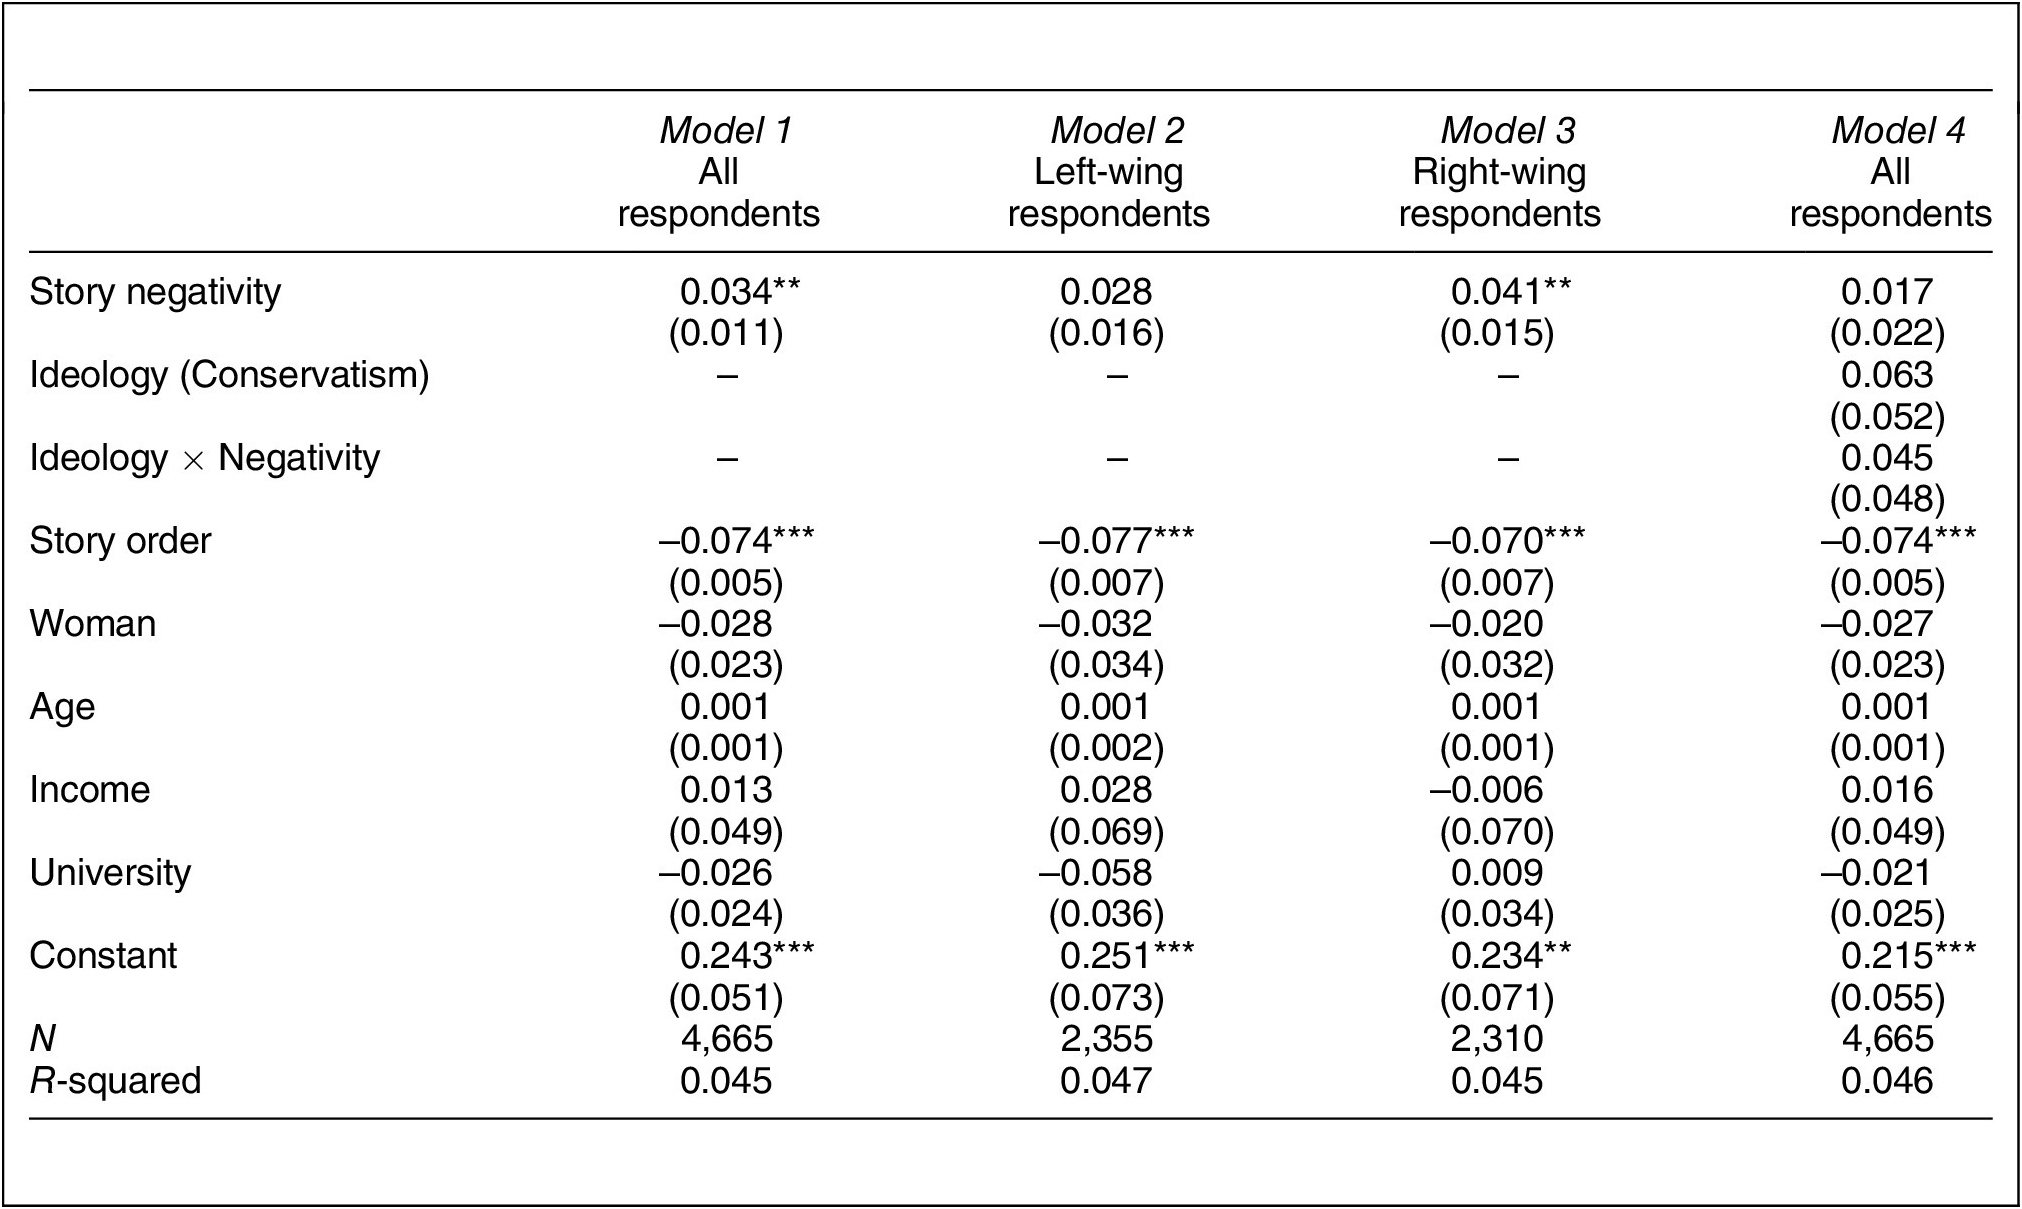
Our second level of analysis relies on stimulus-level data. Table 3 presents results using pooled analyses, where all countries are combined. The specification of the random-effects GLS models in the first three columns of Table 3 focuses on the direct effect of story tone on physiology; a negativity bias should produce a positive coefficient. Mean physiological reactions range from -5.6 to +5.5, where a higher score indicates stronger galvanic skin activity. Story negativity ranges from -1.03 to +1.26, with a higher score indicating greater negativity. We control for demographic characteristics and the order of appearance of each story, since GSL measures tend to decrease over time during the experiment (as is common in past work, e.g., Soroka and McAdams Reference Soroka and McAdams2015).
The Effect of Tone by Ideology (Pooled Stimulus-Level Data)

Note: ***p < .001, **p < .01, *p < .05.
Table 3 suggests the existence of a negativity bias in the pooled data; negative stories generate significantly greater physiological reactions among all respondents (Model 1). When we split participants according to the median score on ideology (a median that is country-specific), differences appear in the strength of the relationship between tone and GSL; conservatives (Model 3) exhibit a slightly larger effect of tone than liberals (Model 2). In fact, the effect of negativity on skin conductance is only significant among right-leaning participants (Model 3). Is the effect of negativity significantly greater among right-leaning individuals? To ascertain whether tone has a significantly larger effect on skin conductance among conservatives in comparison with liberals, two variables are added to the specification: the full scale of ideology and—most importantly—an interaction between story negativity and ideology. In this estimation (Model 4), the interaction is not significant.Footnote 8
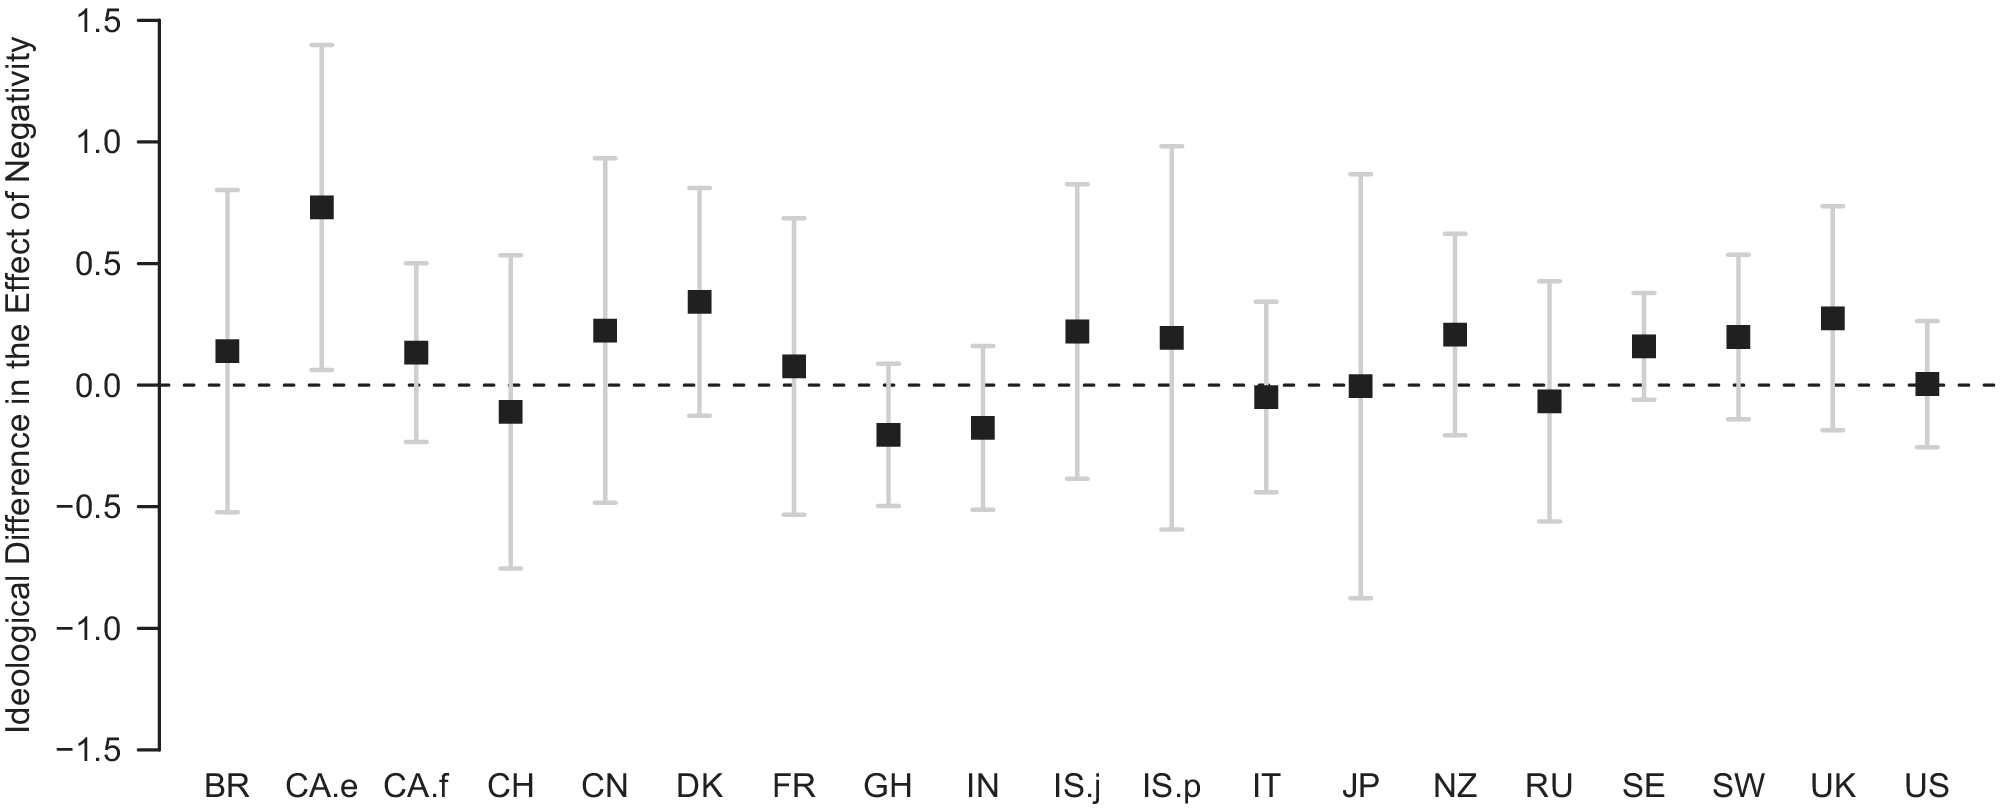
This null finding in the pooled data could mask divergent patterns among different samples, of course. To test this idea, Figure 3 reports the crucial interactive coefficient in models identical to the one in the last column of Table 3 from estimations performed on each sample separately.Footnote 9 The interaction between negativity and ideology is positive among 13 of the 19 samples, somewhat consistent with a larger negativity bias among right-wing partisans. However, the interaction is only significant in a single sample (English Canadians). Since we are performing multiple hypothesis tests in these sample-specific analyses, it is worth considering the family-wise error rate. Applying either the Bonferroni, Holm–Bonferroni, or Sidak correction procedures, we fail to reject the null hypothesis in any of the samples. The link between ideology and the negativity bias is not robust across these 17 countries.
The Interaction between Tone and Ideology by Country (Stimulus-Level Data)

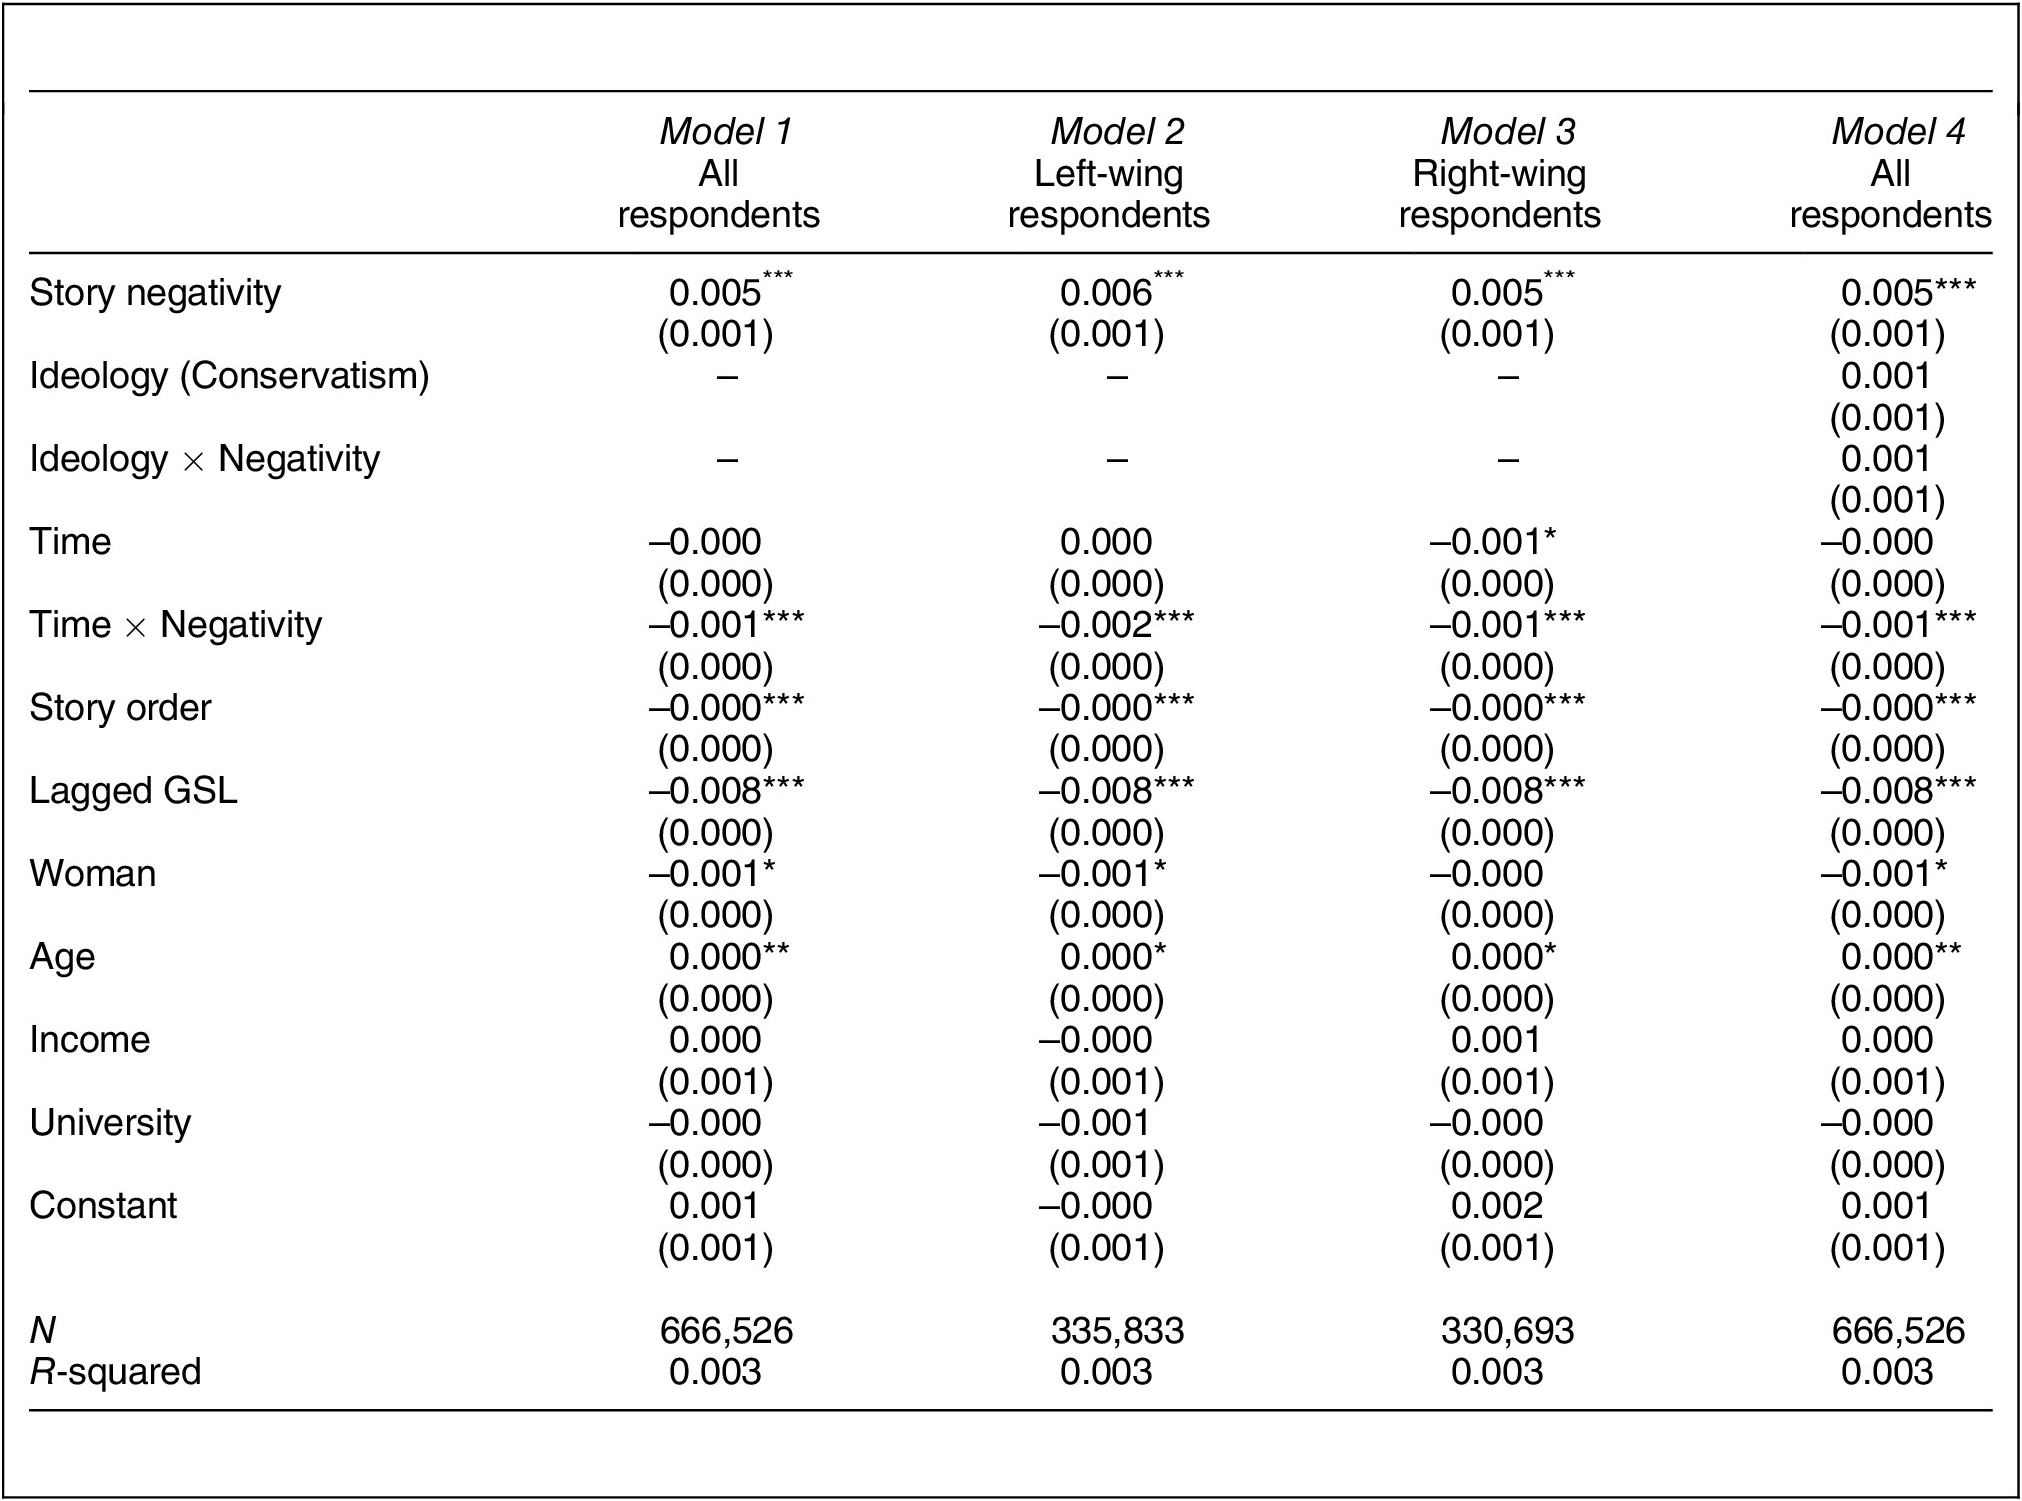
Our third level of analysis focuses on time-series data. In Table 4, we present the results of random-effects auto-regressive models to assess the effect of changes in negativity while controlling for lagged physiology during the previous second. Besides the decline in galvanic skin responses over successive stories (captured by story order), the specification also takes into account the tendency for skin conductance to drop during the course of a news report (using an interaction between time and tone, as in past work, e.g., Soroka and McAdams Reference Soroka and McAdams2015). The dependent variable (GSL) ranges from -9.0 to +10.0, while the key independent variable (negativity) ranges from -1.8 to +2.0.
The Effect of Tone by Ideology (Pooled Time-Series Data)

Note: ***p < .001, **p < .01, *p < .05.
Table 4 indicates that levels of negativity are associated with heightened GSL in the pooled data among all participants (Model 1), among left-wing individuals (Model 2), and among right-wing individuals (Model 3). This is in line with the widespread finding that humans exhibit, on average, negativity biases in information processing. Is ideology connected to individual-level variation in negativity biases in these time-series data? Conservative and liberal subsamples produce very similar coefficients for tone (Models 2 and 3). To directly test whether there is a statistically significant difference between the two ideological groups, we again add an interaction between negativity and the continuous measure of ideology to the specification (Model 4). In this estimation, the interactive coefficient is positive, consistent with a more pronounced effect of negativity among conservatives, but it is no larger than its standard error (i.e., not significant).
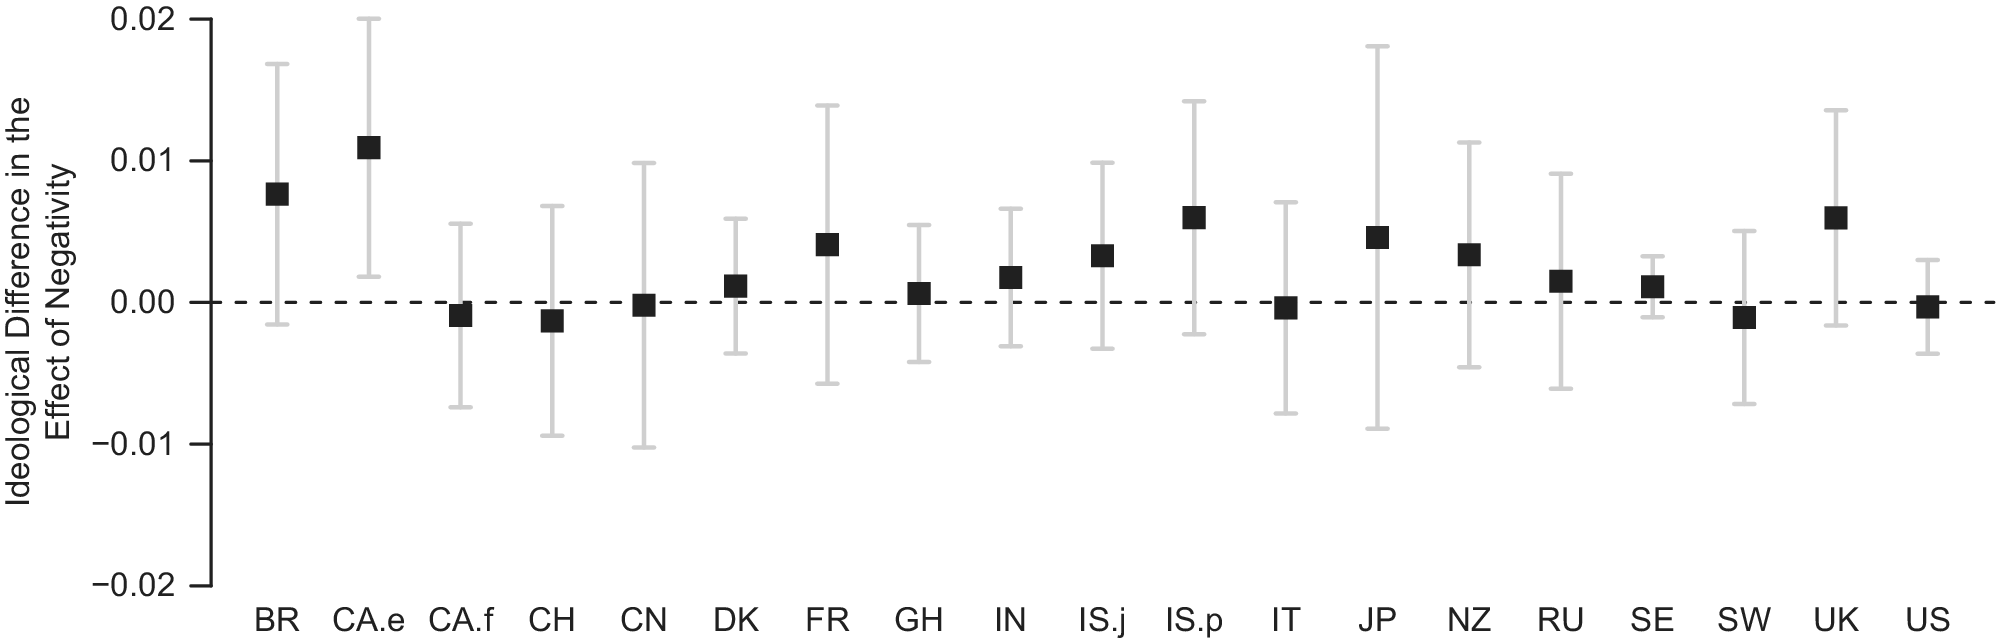
Figure 4 displays sample-specific results, using the same approach as Model 4 in Table 4. The interaction is positive among 13 of the 19 samples, in line with a larger negativity bias among right-leaning persons. However, even as we leverage second-to-second changes in news tone and skin conductance, only one sample manifests a significant interaction between tone and ideology (again, English Canadians). Also, when we apply stricter standards to take into account the family-wise error rate of multiple tests (either Bonferroni or Holm–Bonferroni or Sidak), not a single sample displays significant results.
The Interaction between Tone and Ideology by Country (Time-Series Data)

In sum, our broadly cross-national experiment using news stories fails to find support for the notion that political ideology is systematically linked to differential reactions to negative versus positive information. There are instances in the preceding analyses in which conservatives appear to be more influenced by negative information than liberals. However, our findings in this respect rarely meet standard criteria of statistical significance, whether we pool all the data together or examine the countries separately, in any of the three levels of analysis. We regard these findings as being fundamental for work focused on links between politics and biology. Before we address our broader concerns, however, we turn to a second experimental test.
Study 2: A Cross-National Photographic Experiment
Could our inability to find ideological differences in reactions to news reports be due to the nature of the stimuli? Much of the prior work on the link between political ideology and threat sensitivity or disgust sensitivity relies on physiological responses to photos (Aarøe, Petersen, and Arceneaux Reference Aarøe, Petersen and Arceneaux2017; Arceneaux, Dunaway, and Soroka Reference Arceneaux, Dunaway and Soroka2018; Dodd et al. Reference Dodd, Balzer, Jacobs, Gruszczynski, Smith and Hibbing2012; Oxley et al. Reference Oxley, Smith, Alford, Hibbing, Miller, Scalora, Hatemi and Hibbing2008; Smith et al. Reference Smith, Oxley, Hibbing, Alford and Hibbing2011). Perhaps the ways in which conservatives and liberals deal with pictures is not the same as their interface with news content. News reports possess the external validity of real-world stimuli, but their multiple dimensions (narration, movement, sound, etc.) could imply confounding signals and consequently muddled physiological reactions. Photos are much simpler and may be advantageous for revealing deep-seated predispositions. To assess this possibility, we turn to a second experiment, more consistent with past research, examining galvanic skin reactions to photographs.
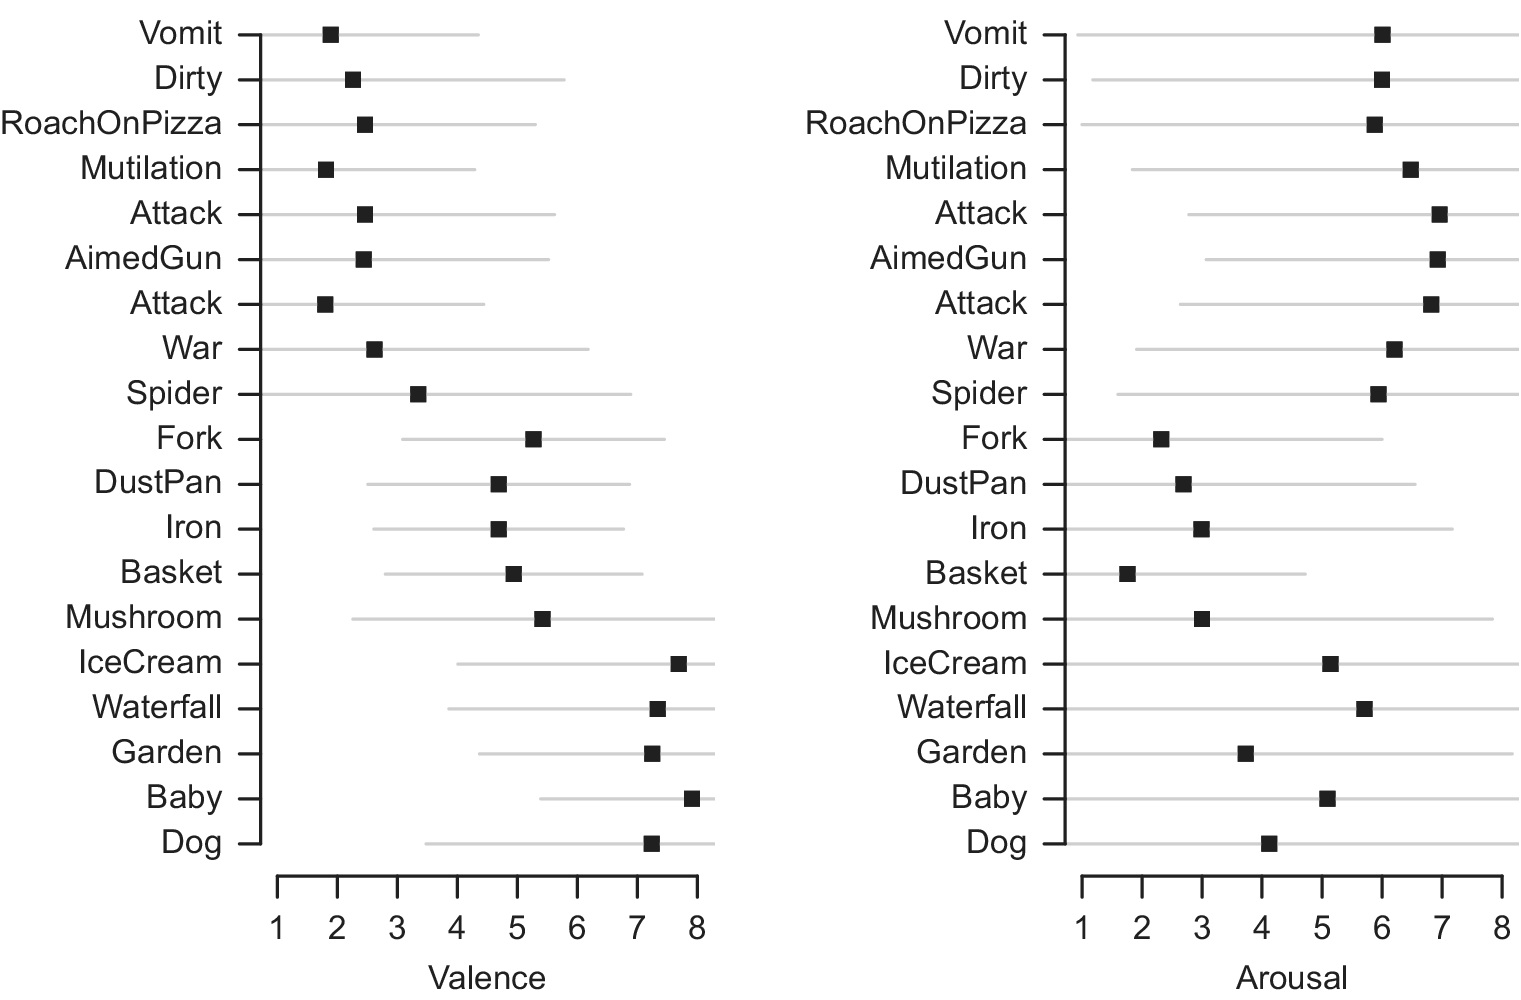
The second experiment is conducted immediately after the video experiment among all our samples except for one (English Canada).Footnote 10 The same participants, sitting in the same chair, watching the same computer screen, and wearing the same sensors, are exposed to a one-minute gray screen, followed by a randomly-ordered set of photos. Each photo is shown for 10 seconds, and then there is a 10-second gray screen. The process is repeated until they have seen all 25 photos. A total of 19 of those photos are drawn from the International Affective Picture System database (IAPS). The IAPS is a large battery of still photos coded on several dimensions by expert coders and used in a wide range of psychological and psychophysiological experiments (see, e.g., Codispoti, Bradley, and Lang Reference Codispoti, Bradley and Lang2001; Dodd et al. Reference Dodd, Balzer, Jacobs, Gruszczynski, Smith and Hibbing2012; Lang and Bradley Reference Lang, Bradley, Coan and Allen2007; Lang et al. Reference Lang, Greenwald, Bradley and Hamm1993; Mikels et al. Reference Mikels, Fredrickson, Larkin, Lindberg, Maglio and Reuter-Lorenz2005; Ribeiro, Pompéia, and Bueno Reference Ribeiro, Pompéia and Bueno2005). We selected 19 images with the following objectives in mind: (a) we need photos that are paradigmatic examples of each of four categories (disgusting, threatening, neutral, and positive), and (b) we need photos that are not deeply violent or potentially offensive, given that we were running our experiment across wildly different cultures. Figure 5 offers a brief description of the IAPS photos we use and ratings of both valence and arousal. The squares show mean ratings, while whiskers show the 95% confidence intervals. The top four items are disgusting images, the next five are threatening, followed by five neutral and five positive photos. Note that while there is rough agreement on the valence of photos using the values assigned by IAPS coders, there is a large degree of variation in self-reported arousal.
Description, Valence, and Arousal of IAPS Photos

Previous studies sometimes combine different types of stimuli (e.g., images that generate anger, disgust, and fear in Dodd et al. Reference Dodd, Balzer, Jacobs, Gruszczynski, Smith and Hibbing2012), and they sometimes keep types separate (e.g., threatening versus disgusting images in Oxley et al. Reference Oxley, Smith, Alford, Hibbing, Miller, Scalora, Hatemi and Hibbing2008 and Smith et al. Reference Smith, Oxley, Hibbing, Alford and Hibbing2011). While we start by analyzing reactions to negative images (threatening and disgusting combined), we examine the distinctions between the two types in the robustness checks below. Since we do not use the same images or the same attitudinal measures as prior studies (Aarøe, Petersen, and Arceneaux Reference Aarøe, Petersen and Arceneaux2017; Arceneaux, Dunaway, and Soroka Reference Arceneaux, Dunaway and Soroka2018; Dodd et al. Reference Dodd, Balzer, Jacobs, Gruszczynski, Smith and Hibbing2012; Oxley et al. Reference Oxley, Smith, Alford, Hibbing, Miller, Scalora, Hatemi and Hibbing2008; Smith et al. Reference Smith, Oxley, Hibbing, Alford and Hibbing2011), this is not a strict replication of that prior work. That said, the stimuli in this experiment are closer to earlier research than are the videos in the first experiment.
Results: Physiology and Images
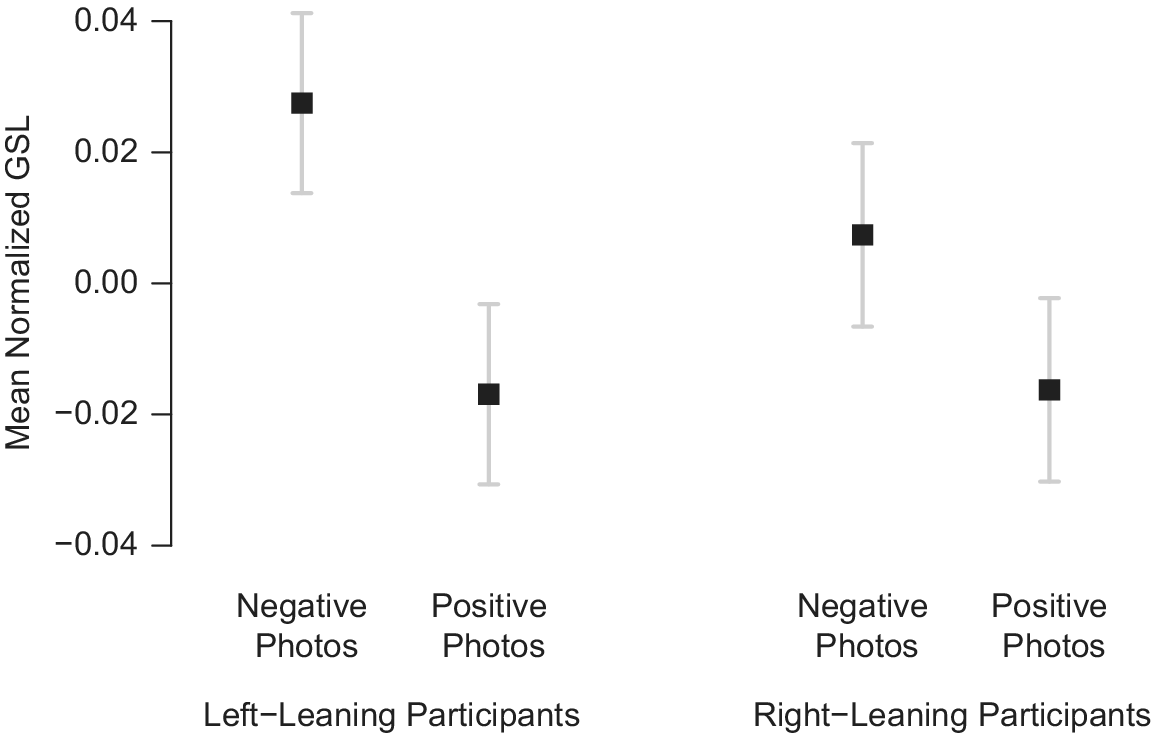
Figure 6 offers a simple introduction to the results. It shows average individual reactions to two types of photos. Negative images contain both disgusting and threatening photos, while the other category includes both neutral and positive photos.Footnote 11 Ideology is split according to the median value among each sample. Galvanic skin responses are larger for negative images than positive images among both ideological groups, and the gap is significant within both groups (as confirmed by t-tests). Thus, the photo experiment reveals the existence of an overall negativity bias in the psychophysiological reactions of participants across all 19 samples. Contrary to expectations, however, Figure 6 suggests that the negativity bias in responses to pictures is slightly wider among liberals than among conservatives, although the difference in gaps between the two ideological groups is not significant (p = 0.17).
The Effect of Photo Tone on Skin Conductance by Ideology

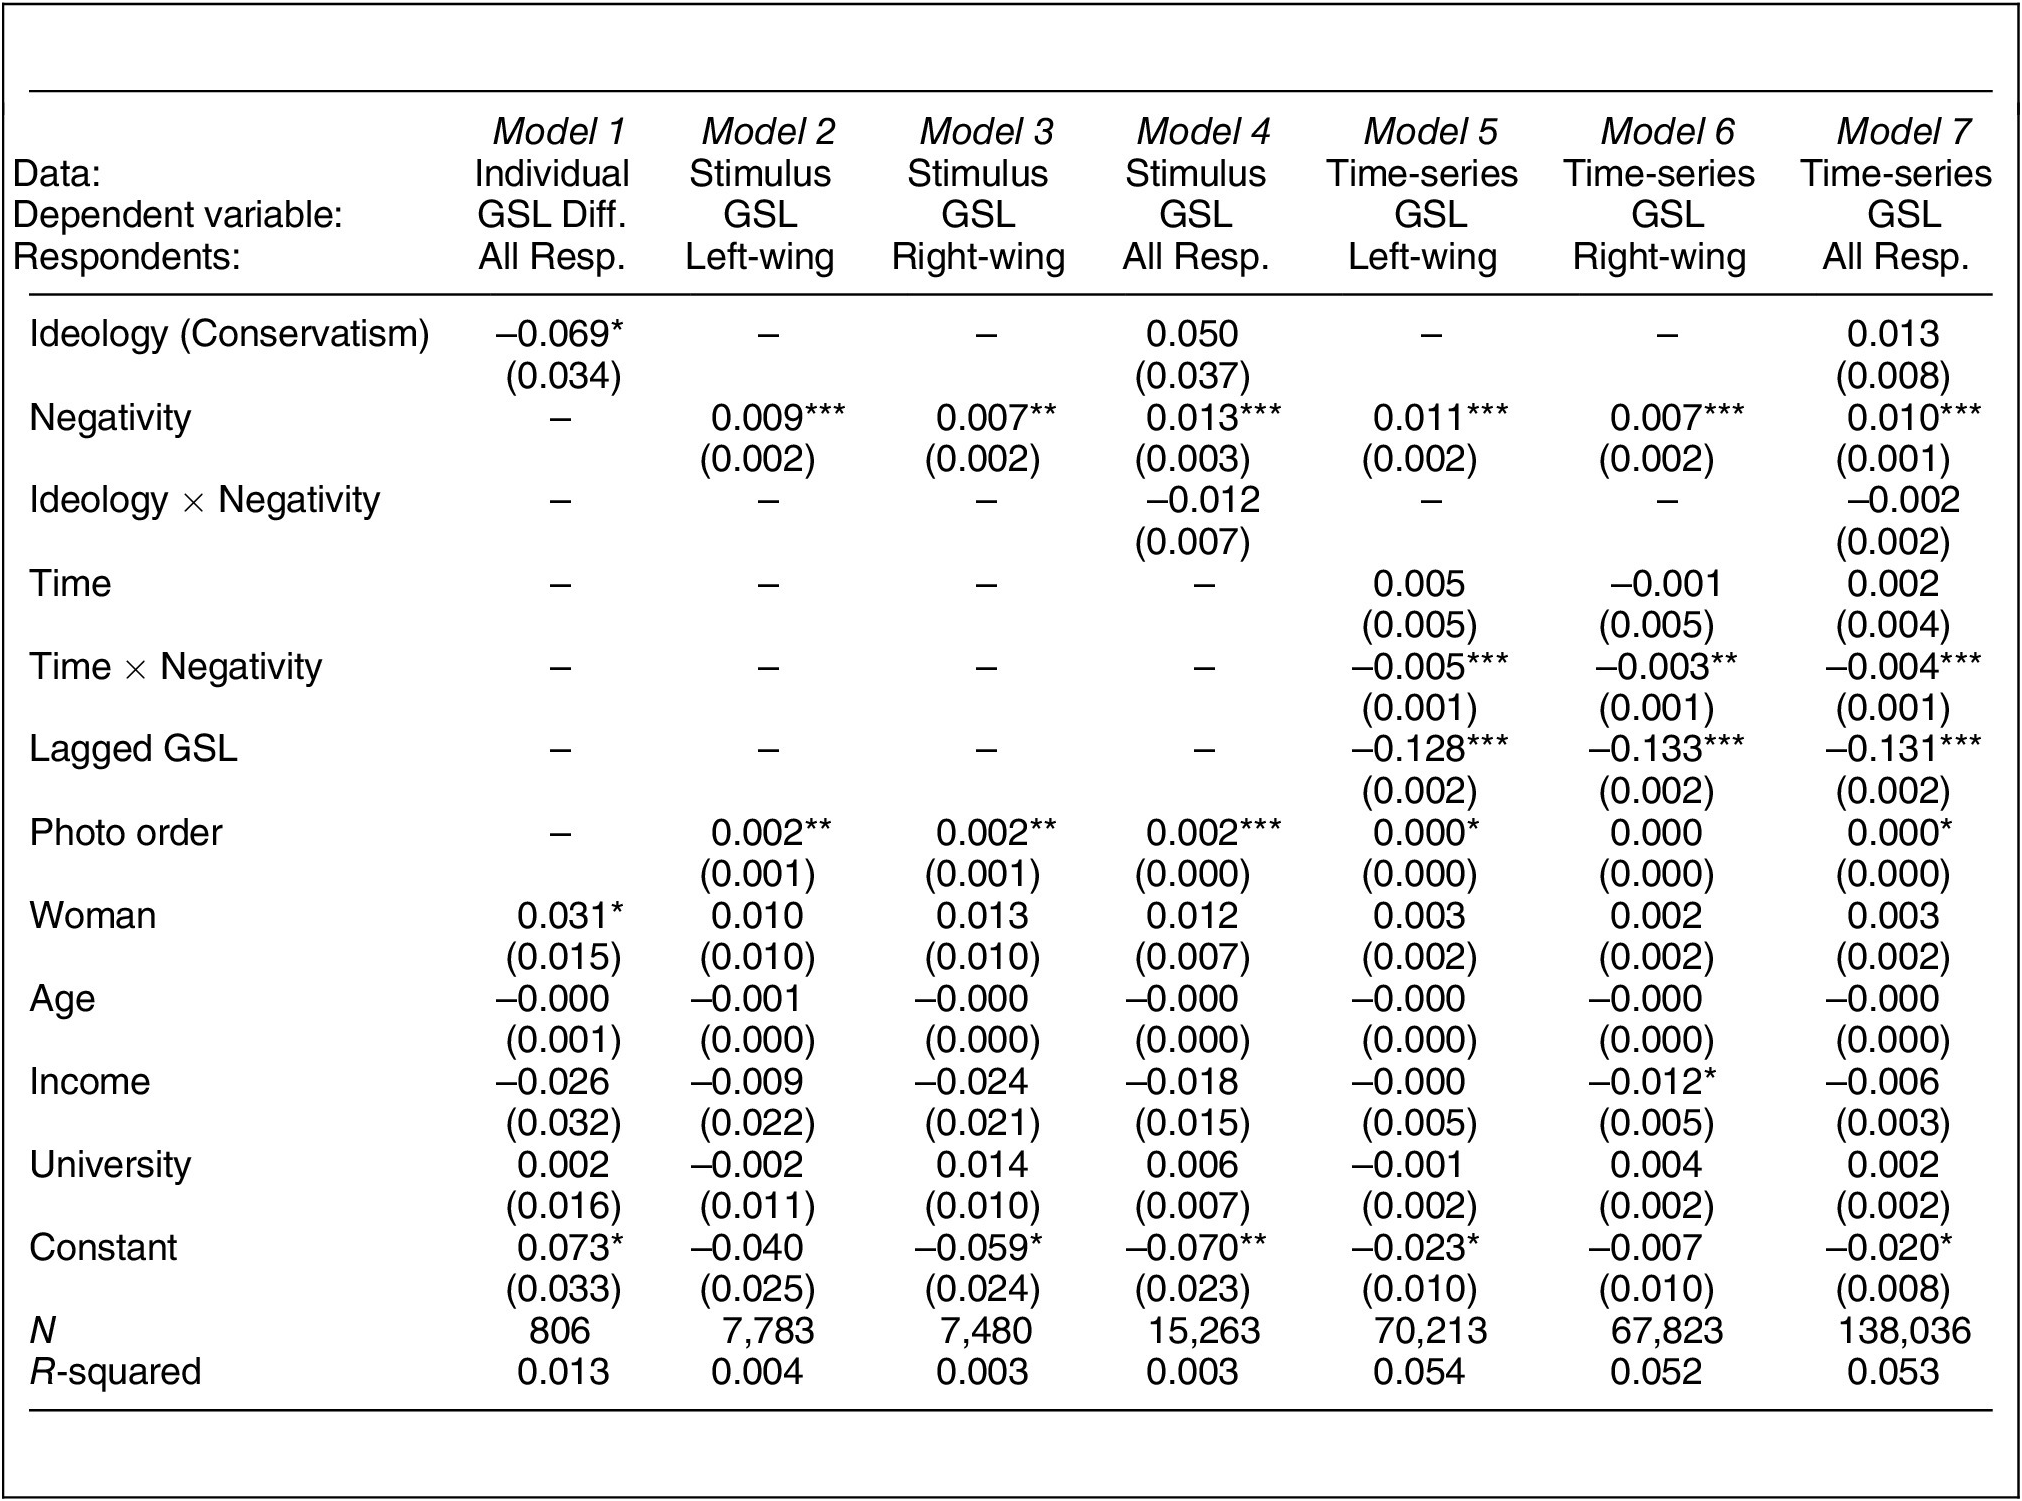
This first impression is echoed across all three levels of analysis in the pooled data, shown in Table 5. In the individual-level data (Model 1), ideology (measured continuously) is negatively and significantly correlated to the gap in average GSL between the negative and the positive pictures; so right-wing people appear to be less reactive to negativity, though again the effect is substantively small (7% of a standard deviation according to the standardized coefficient).Footnote 12 Similarly, in both the stimulus-level data and the time-series data, image negativity is a slightly stronger predictor of skin conductance among liberals (Models 2 and 5) than among conservatives (Models 3 and 6).Footnote 13 To ascertain whether the difference between the two ideological groups is significant, we again add an interaction between photo tone and the full scale of ideology. This interaction is negative in both the stimulus-level data (Model 4) and the time-series data (Model 7), but it is not significant in either case. In the pooled data, there is no support for the idea that right-leaning individuals are more physiologically activated by negative images.
Ideology and Negativity Bias in Photographs, All Countries Pooled

Note: ***p < .001, **p < .01, *p < .05.
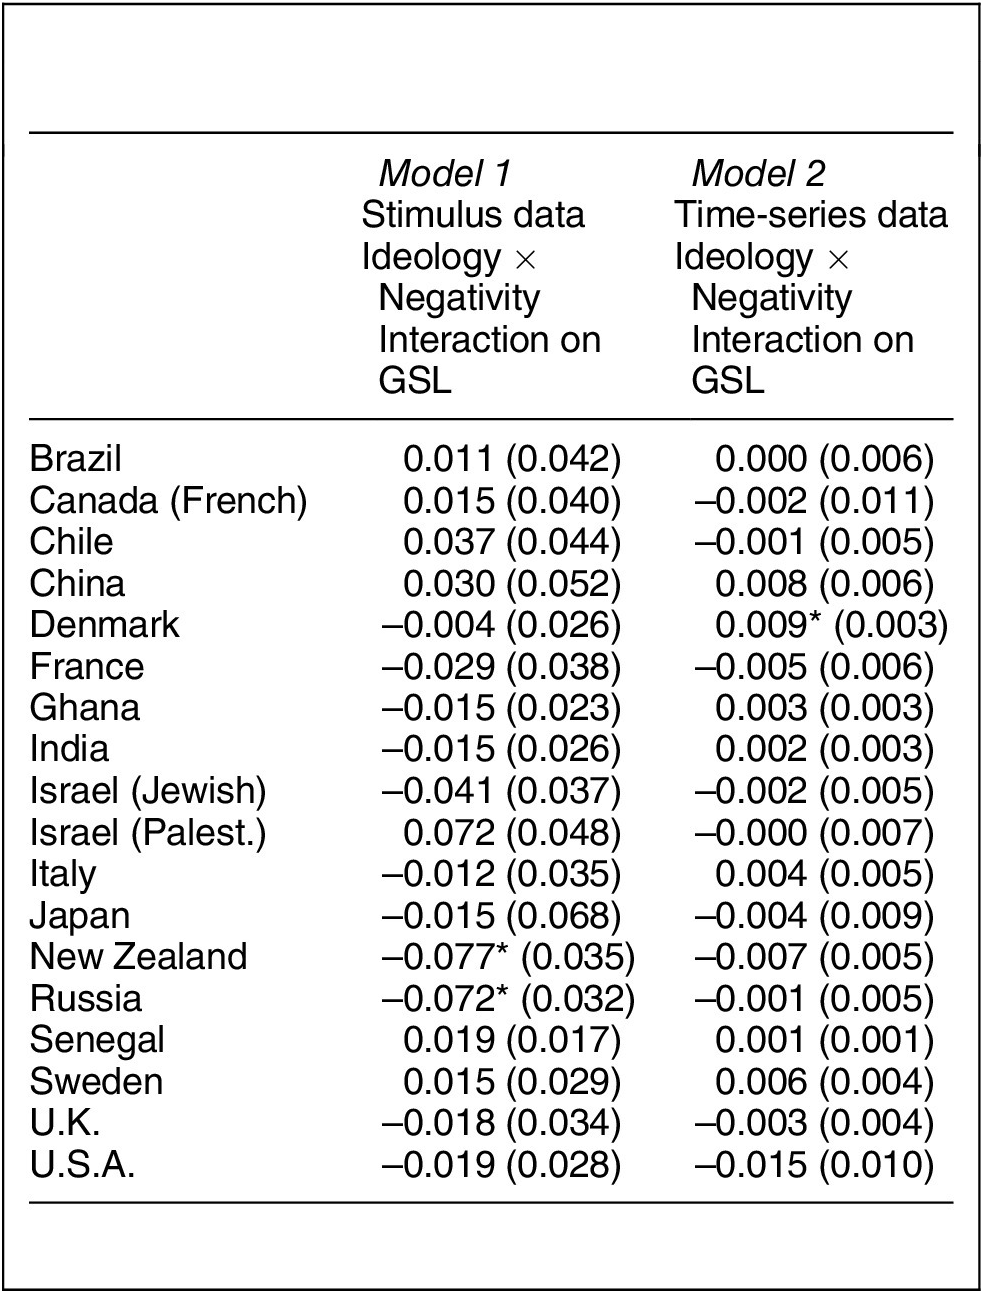
Table 6 reports the decisive tests for every sample across the two levels of analysis for which we produce country-specific results: the coefficient for the interaction between negativity and ideology (like Models 4 and 7 of Table 5). Of the 36 interactions in this table, 21 are negative and 15 are positive, suggesting the absence of any consistent pattern. Moreover, the coefficients rarely reach statistical significance across both columns. In fact, only one relationship meets the stricter criteria of Bonferroni or Holm–Bonferroni or Sidak corrections for multiple testing (i.e., Denmark in the time-series data).
Ideology and Negativity Bias in Photographs by Country

Note: ***p < 0.001, **p < 0.01, *p < 0.05.
So there is no systematic evidence of dependable differences in physiological reactions along ideological lines in the photographic experiment across all three levels of analysis among the diverse set of countries investigated here.
Robustness Checks
Are the analyses of Study 1 unable to uncover a link between ideology and the negativity bias because they focus on reactions to international news stories? We choose to maximize comparability across samples by using the stimuli that are common to all participants. Local news stories, since they deal with more familiar and more relevant material, could generate stronger physiological reactions. More importantly, reactions to local reports could differ along ideological lines; for instance, conservatives may be less interested in stories taking place in other countries and more engaged by domestic narratives than liberals. Table A3 in the Online Appendix compares the results pertaining to the international stories presented previously (first column) with the results using the two local stories (second column). Ideology is not a significant predictor of electrodermal activity in responses to local stimuli in any of the three levels of analysis, both in the pooled data and the sample-specific estimations. There is no indication that conservatives react more powerfully to negative local videos than liberals do.
Does Study 2 fail to find differences between conservatives and liberals because the specifications do not distinguish threatening images from disgusting images and treat both types as negative stimuli? Reactions to disgusting stimuli might be more closely linked to ideology (Hibbing et al. Reference Hibbing, Smith and Alford2013). In Table A4 in the Online Appendix, we analyze threatening and disgusting images separately.Footnote 14 Results are very similar. Across all three levels of analysis, physiological reactions to disgusting or threatening photos are not more pronounced among right-wing individuals. Again, we mostly uncover a lack of significant ideological differences in the negativity bias, both in the pooled data and among the 18 samples.
Do the results vary by specific stimuli? Do certain topics and certain threats activate conservatives and liberals differently? The bottom portion of Table A5 in the Online Appendix considers the effect of each negative image of Study 2 (in separate regressions). Again, results do not differ considerably. None of the five threatening images and none of the four disgusting images induces stronger galvanic skin responses among conservatives (or liberals) in any systematic fashion.Footnote 15 Similarly, the top portion of Table A5 shows that none of the four negative news reports produces robust ideological differences in skin conductance.
Is the lack of persuasive evidence attributable to the operationalization of political ideology? As noted above, we believe that, in a cross-national context, respondents’ opinions regarding a series of concrete political issues is the optimal strategy to identify where they are located on the ideological spectrum. Nevertheless, we consider alternatives and test their influence on the findings. We build seven different ideological indicators: the full scale of the Wilson–Patterson index (the variable used for all preceding regression analyses); Wilson–Patterson dichotomized according to the midpoint; Wilson–Patterson dichotomized according to the median; positions on an 11-point Left–Right scale; Left–Right dichotomized according to the median; an index combining Wilson–Patterson and Left–Right; and the combined index dichotomized according to the median. All variables are standardized to run from 0 to 1. Table A6 in the Online Appendix replicates the main results of both studies across all three levels of analysis for each operationalization of ideology. No matter how we construct ideology, the findings are similar. There is only negligible evidence of differences along ideological lines in galvanic skin responses. There are significant positive coefficients for the dichotomous combined measure in the pooled models of the video experiment, but the results are still substantively small, they are not common among the sample-specific estimations, and they are absent from the photo experiment.
Are liberal-conservative differences in the negativity bias evident when we consider opinions on specific issues? Prior work has occasionally found that some elements of the Wilson–Patterson scale were more connected to negativity than others (Smith et al. Reference Smith, Oxley, Hibbing, Alford and Hibbing2011). Table A7 in the Online Appendix shows the associations between each of the 14 Wilson–Patterson items and the physiological reactions to videos and photos in the pooled individual-level data (in separate regressions). None of the specific opinions is a strong predictor of negativity biases across the samples and stimuli.Footnote 16 For instance, the two social conservatism items which one could have expected to be particularly helpful based on past studies—attitudes regarding gay marriage and immigration—are not a source of divergent electrodermal responses.
Could the link between ideology and physiology be more robust among certain subgroups of individuals? We consider two subgroups in Table A8 in the Online Appendix: those with more extreme ideological positions and those who are more interested in politics. In Column 2, the analysis is limited to people in the bottom or the top quartiles of the Wilson–Patterson ideological scale, those with middling ideological scores are excluded. In Column 3, the model only contains people with levels of political interest above the median.Footnote 17 Column 1 simply repeats the paper’s main findings as a baseline for comparison. Focusing on more ideologically extreme participants does not produce significant results more frequently than does using the entire sample. Among the most interested participants, however, a significant positive coefficient emerges in the pooled estimations for the video experiment (with all three levels of analysis). These results provide an indication that political engagement may moderate the connection between conservatism and physiological reactions (as suggested by Federico, Johnston, and Lavine Reference Federico, Johnston and Lavine2014), something that no prior study has established empirically. This dynamic could partly explain why past work that screened potential participants according to their political interest uncovered positive findings (Dodd et al. Reference Dodd, Balzer, Jacobs, Gruszczynski, Smith and Hibbing2012; Oxley et al. Reference Oxley, Smith, Alford, Hibbing, Miller, Scalora, Hatemi and Hibbing2008; Smith et al. Reference Smith, Oxley, Hibbing, Alford and Hibbing2011). Nonetheless, one should not lose track of the fact that the relationship between ideology and electrodermal activity is inconsistent even among the most interested participants. It fails to manifest in the country-specific analyses and across all levels of analysis for the photo experiment.
Conclusion
Our cross-national experimental project does not find consistent evidence of a relationship between political ideology and physiological reactions to negative and positive stimuli. Across 17 countries, two separate experimental designs, and various modeling strategies, conservatives and liberals do not regularly differ in the ways in which they react to negative versus positive information.
The first experimental study deals with the effects of televised news reports on electrodermal activity, an indicator of emotional activation. There is evidence of a negativity bias in the pooled data—negative stories produce stronger galvanic skin responses than positive stories overall. We examine the relationship between ideology and the negativity bias across three levels of analysis: average physiological reactions to all news reports (individual-level data), average reactions to each story (stimulus-level data), and second-by-second reactions (time-series data). Results are equivalent across these levels of analysis. There are hints that conservatives may be somewhat more affected by negative stories than liberals, in line with expectations, but this difference between ideological groups is substantively small and rarely statistically significant. The gap between the two groups is never reliable in the pooled data, and it only reaches standard levels of significance in one of 19 samples.
The second experimental study focuses on the effects of static photographs on electrodermal activity. Again, we observe a negativity bias in the pooled data—negative images generate stronger galvanic skin responses than positive images overall. However, there is no support for the hypothesis that the negativity bias is more pronounced among right-wing individuals. If anything, there are very slight indications that conservatives’ physiological reactions are less—not more—sensitive to negative photos. Nevertheless, very few of the countries exhibit a significant link between ideology and the negativity bias (only one or two samples out of 18, depending on the level of analysis), and findings are similar for both disgusting and threatening images.
How much confidence should we attach to all these null results? In our view, a good deal. The results are based on the most extensive cross-national psychophysiological experiment ever conducted. If we cannot find systematic evidence of a connection between ideology and negativity bias among these 17 countries on six continents, it is difficult to believe that the relationship exists among a large portion of the rest of the world. Additionally, the null results are consistent across numerous choices: whether we look at reactions to videos or to images, at whichever level the data is analyzed (individuals, stimuli, or time-series), for every single video and image, whether we control for demographics or not, and no matter how we construct political ideology. As our power analyses in the Online Appendix confirm, the null findings reported here are not due to a lack of statistical power. There is a growing body of good work on how best to consider evidence in favor of the null hypothesis (e.g., Harms and Lakens Reference Harms and Lakens2018; Rainey Reference Rainey2014). Our results highlight the significance of this line of scholarship. Our own careful consideration of the null hypothesis includes a Bayesian analysis, also in the Online Appendix, which helps to make clearer still the high likelihood of the null hypothesis.
We add three caveats. First, note that even as we do not find a systematic association between negativity biases and political ideology, we do find considerable individual-level variation in activation by negative versus positive information, and that variation may well reflect differences in information processing that are fundamental to understanding heterogeneity in political information processing. To be clear, even if they do not fall cleanly on political-ideological lines, individual differences in information processing may be (and probably are) important drivers of a wide range of political attitudes.
Second, note that we do not interpret our findings as evidence that negativity biases cannot in any instance be related to ideology or policy attitudes. Work that focuses on attitudinally rather than physiologically captured negativity biases has identified connections that are not evident in our data. Indeed, some of the differences between our results and work by others (cited above) may be attributable to our focus on physiological negativity biases and ideology. Work that focuses on specific negativity biases (such as disgust sensitivity or threat sensitivity) and specific policy positions (such as immigration or redistribution) may well identify links between certain deep-seated predispositions and certain policy decisions in certain locations. Work that focuses on particular subgroups of individuals could uncover people whose left-right orientation is more closely associated with their electrodermal reactions (as is tentatively suggested for more interested respondents in Table A8). Work that focuses on other psychophysiological measures, including heart rate variability, capturing a combination of activation and attentiveness, might also reveal important ideological differences. Our current results nevertheless confirm that connections between negativity biases and ideology are, at a minimum, less generalizable and much more complex than some current accounts suggest.
Third, we readily acknowledge the possibility that the physiological variables examined here may or may not be indicative of deep-seated predispositions in information processing. There is at present some debate about whether physiological responses to photos should be regarded as predispositional (Bakker et al. Reference Bakker, Schumacher, Gothreau and Arceneaux2020; Osmundsen et al. Reference Osmundsen, Hendry, Laustsen, Smith and PetersenForthcoming). Recent work suggests that responses to video or photo stimuli capture some combination of deep-seated predispositional and more time- and context-varying responses (Soroka et al. Reference Soroka, Fournier and Nir2019), a suggestion echoed in work looking at headline selection tasks in panel survey experiments (Bachleda et al. Reference Bachleda, Neuner, Soroka, Fournier and Naurin2020). A correlation between negativity biases and ideology does not require a measure of negativity biases that is entirely predispositional, of course, but the strength and replicability of the correlation will be less robust if physiological measures capture responses that are highly context dependent. This work highlights the need for future research to consider in some detail the degree to which physiological measures can reliably identify predispositions.
We consequently view the preceding results as an invitation for further biopolitical work, with more diverse samples, and more narrowly-defined negativity biases and ideological/policy preferences. A debate about the robustness of US findings is already underway; but one fruitful avenue for future work is, in our view, less about whether negativity biases and ideology are connected and more about the specific individuals, attitudes, and contexts in which such a connection is more or less likely.
Supplementary Material
To view supplementary material for this article, please visit http://dx.doi.org/10.1017/S0003055420000131.
Replication materials can be found on Dataverse at: https://doi.org/10.7910/DVN/MCEFXL.





Comments
No Comments have been published for this article.