Introduction
Electoral systems belong to the most important institutions in representative democracy. They organize the transfer of power from the people to elected representatives. Precisely, electoral systems rule how voters can express their preferences and how these preferences are translated into parliamentary seats. In doing so, they impact the composition of parliaments, majority structures, and finally, policy outcomes.
As undisputed as the relevance of electoral systems is, so controversial is the question of which electoral system is “best” (see, e.g., Bowler et al., Reference Bowler, Farrell and Pettitt2005). This is mostly due to the fact that electoral systems have to fulfill multiple functions. While scholars agree that, typically, “electoral systems cannot satisfy the different demands at the same time in an absolute manner” (Nohlen, Reference Nohlen1996: 95), the question of which system is best still prevails in electoral system research and is addressed from normative as well as empirical perspectives (Gallagher and Mitchell, Reference Gallagher and Mitchell2005; Carey and Hix, Reference Carey and Hix2011; Farrell, Reference Farrell2011; Raabe and Linhart, Reference Raabe and Linhart2018). While the empirical strand of this literature finds some evidence that certain electoral systems perform particularly well by balancing out different demands in a successful way (e.g., Carey and Hix, Reference Carey and Hix2011; Raabe and Linhart, Reference Raabe and Linhart2018), normative preferences about the various functions still influence the evaluation of specific electoral systems.
Despite the practical relevance and empirical diversity of electoral systems, the debate about which demands on electoral systems are more or less important has remained largely a discussion among experts, i.e., scientists or politicians (cf. Blais et al., Reference Blais, Laslier, Poinas and Van Der Straeten2015). Among these actors, electoral systems and their consequences are well understood and thus subject to intensive debate. The preferences of the electorate, however, are largely ignored in debates about electoral systems. We argue that knowledge about the people’s electoral system preferences is crucial, since electoral systems without sufficient support in the public can destabilize political systems as a whole.
The question of how voters evaluate electoral systems is important and yet under-researched. Farrell (Reference Farrell2011: 195) notes that “in many cases, the voters influence electoral system design; in all cases the voters are the political actors actually using the electoral system.” However, except for some case studies in which the electoral reform was directly initiated or influenced by citizens (Reed and Thies, Reference Reed and Thies2001; Vowles et al., Reference Vowles, Banducci and Karp2006; Fournier et al., Reference Fournier, van der Kolk, Carty, Blais and Rose2011; Müller and Jankowski, Reference Müller and Jankowski2019), we lack systematic research on how citizens evaluate electoral systems. Surveys that ask citizens about the specific functions of an electoral system tend to focus on very few aspects of an electoral system, most prominently the value of proportionality (Blais et al., Reference Blais, Laslier, Poinas and Van Der Straeten2015, Reference Blais, Sevi and Plescia2022; Plescia et al., Reference Plescia, Blais and Högström2020; cf. “Citizens’ attitudes toward electoral systems: theory, empirical findings and expectations” for a more extensive overview). Attitudes toward other functions of an electoral system are not yet covered sufficiently by existing research and thus ignores the potentially multi-dimensional preferences of voters toward electoral systems.
Our paper addresses this research gap by contributing to the research questions of which electoral system functions are important for citizens and to what extent the preferences of different population groups do differ. Precisely, we present results from a large-scale conjoint experiment (cf. Hainmueller et al., Reference Hainmueller, Hopkins and Yamamoto2014) conducted in three countries (Netherlands, Germany, and UK). These three countries were chosen deliberately as they differ with regard to the electoral system they use in their general elections. The Netherlands use a full proportional representation (PR) system with a marginal legal threshold only and the option to cast specific candidate votes. Germany uses a mixed-member proportional (MMP) system with a 5% threshold, meaning that it is a predominantly proportional system but also has some features that foster party system concentration. Finally, the UK is one of the most prominent examples of countries which use a plurality electoral system. Thus, the three countries cover a wide range of electoral system types and allow to control for potential status quo bias.
Our conjoint experiment includes a broad set of electoral systems’ key functions. By using a conjoint experiment, our study overcomes the shortcoming of previous research that has focused on merely one of these dimensions. Instead, we analyze the preference toward these attitudes simultaneously which also allows us to analyze which features of an electoral system are considered particularly important. Moreover, the experiment allows us to analyze if preferences for certain electoral system attributes vary between specific voter groups and between countries.
Electoral systems’ functions and trade-offs
Electoral systems’ functions
When it comes to the evaluation of electoral systems, there is a broad agreement that the latter must meet some basic requirements. Riker (Reference Riker1982), for example, highlights that electoral systems have to be anonymous and neutral, which means that they may neither discriminate against voters nor electoral alternatives. More broadly, electoral laws as well as the practical execution of elections have to guarantee electoral integrity (see, e.g., Norris et al., Reference Norris, Coma and Frank2014; Norris and Nai, Reference Norris and Nai2017).
As important these aspects are, they are, so far, unproblematic as they can be fulfilled simultaneously without any difficulty. Debates about the design of electoral systems usually begin when it comes to demands that cannot generally be reached at the same time. Many researchers have formulated criteria for the evaluation of electoral systems (e.g., Mackenzie, Reference Mackenzie1958; Katz, Reference Katz1997; Sartori, Reference Sartori1997; Powell, Reference Powell2000; Shugart and Wattenberg, Reference Shugart and Wattenberg2001; for a comprehensive overview see Gallagher, Reference Gallagher2005: 569–570). We condense these catalogues to six demands on which we base our study.Footnote 1
Proportionality
One of the most prominent criteria for the evaluation of electoral systems is proportionality (Jenkins Report, 1998; ICPR, 2003). The demand for proportionality is a direct consequence of the wish that a parliament mirrors the preference structure of the voters (Mackenzie, Reference Mackenzie1958; Lakeman, Reference Lakeman1974; RCES, 1986; Katz, Reference Katz1997). If the distribution of preferences and opinions in a parliament reflects that of the electorate, so the argument goes, parliaments are most likely to make similar choices. The more preference structures in parliaments deviate from those in the population, on the other hand, the more likely there are gaps between the public opinion and policies (Freeman, Reference Freeman1995; Soroka and Wlezien, Reference Soroka and Wlezien2010).
Representation of minorities
Besides proportionality at the macro level, representation shall also be at hand on a micro level (ICPR, 2003). This demand can include the representation of local interests (RCES, 1986; Shugart and Wattenberg, Reference Shugart and Wattenberg2001; Childs and Cowley, Reference Childs and Cowley2011), an appropriate share of female MPsFootnote 2 (Carey et al., Reference Carey, Hix, Mozaffar and Reynolds2013) or of minorities in general (Nohlen, Reference Nohlen1996). More generally, electoral systems should “take into account views of as many voters as possible” (Powell, Reference Powell2000; Gallagher, Reference Gallagher2005: 570). While this demand is connected with proportionality – a perfectly proportional system by definition also mirrors minorities – both are not identical. PR systems with moderate thresholds, for example, might be largely proportional but exclude minorities from parliamentary representation. On the other side, plurality systems which provide seats for minorities, can fulfill the claim of minority representation but might be disproportional.
Party system concentration
A further core function of electoral systems is their ability to aggregate preferences in a way that clear majorities evolve. The demand for party system concentration is strongly connected with the wish for clearly identifiable government options (Katz, Reference Katz1997; Shugart and Wattenberg, Reference Shugart and Wattenberg2001) and, thus, an undistorted voter-government link (Duverger, Reference Duverger1984; Powell, Reference Powell2000; Raabe and Linhart, Reference Raabe and Linhart2018). In the words of Lakeman (Reference Lakeman1974), an electoral system should produce parliaments (directly) and lead to governments (indirectly) according to the wishes of the majority. The latter is only partially the case, if multiple parties negotiate on coalition formation and if it is finally their choice which party will be in or out of government. Additionally, less concentrated party systems with multi-party governments limit the possibility to vote parties out of office and therefore weakens the accountability of parties (ICPR, 2003). The wish for concentrated party systems also includes the claim for effective governments (Mackenzie, Reference Mackenzie1958; RCES, 1986; Katz, Reference Katz1997; Sartori, Reference Sartori1997) which are likely to be stable (Lakeman, Reference Lakeman1974; Katz, Reference Katz1997; Sartori, Reference Sartori1997; Jenkins Report, 1998; Shugart and Wattenberg, Reference Shugart and Wattenberg2001). Both are connected with less fragmented parliaments.
Personalization
The question of accountability does not only refer to governments or parties as a whole but also to single members of parliament (Katz, Reference Katz1997; Shugart and Wattenberg, Reference Shugart and Wattenberg2001). The voters’ power to directly influence also the personnel composition of legislatures is expected to positively influence the behavior of representatives (ICPR, 2003). While there might be some disagreement whether representatives’ general quality (Mackenzie, Reference Mackenzie1958; Sartori, Reference Sartori1997) or their suitability for government positions (Lakeman, Reference Lakeman1974) can be better guaranteed in party-centered or candidate-centered electoral systems, the demand for personalized electoral systems is largely agreed on (Nohlen, Reference Nohlen1996; Gallagher, Reference Gallagher2005). Means to fulfill this demand are not limited to certain types of electoral systems but can generally be combined with both plurality (e.g., via transferable votes) or PR systems (with the help of open lists).
Comprehensibility
A point which is neglected in most studies (see the overview in Gallagher, Reference Gallagher2005: 570–571) is the demand for an electoral system which the electorate is able to understand (Nohlen, Reference Nohlen1996; Bowler et al., Reference Bowler, Farrell and Pettitt2005; Grotz, Reference Grotz2017; Jankowski et al., Reference Jankowski, Linhart and Tepe2022). This includes the way of casting a vote, the modus operandi of the electoral system, and the understanding of which consequences a vote has for processes following the elections (like government formation and the legislative game). If electoral systems are misunderstood by many voters, misleading them to choices which are not in their best interest, such systems can reduce satisfaction not only with election results, but with the political system or even democracy as a whole.
Legitimacy
In a similar but broader vein, researchers highlight the importance of electoral systems’ legitimacy (Mackenzie, Reference Mackenzie1958; RCES, 1986). While, from an electoral system designer’s view, a system could be considered as most suitable and therefore legitimate, if it fulfills the above discussed demands as well as it is possible (Nohlen, Reference Nohlen1996: 96), legitimacy additionally refers to voters’ support of the electoral system (ICPR, 2003). While without any doubt the satisfaction of all other functions is expected to increase public support, legitimacy is more than just a conglomerate of the other demands. It includes also a subjective component of voters’ beliefs about electoral systems which need not necessarily be in line with expert judgments (Nohlen, Reference Nohlen1996: 97). This belief is crucial: Without a certain level of public support, election outcomes might be evaluated as unfair. As such, an electoral system that lacks the support of the public poses a threat to the stability of the political system as a whole. In particular, when it comes to electoral reforms, broad public support is seen as essential (Renwick, Reference Renwick2011). Finally, it is also possible that voters acknowledge broad public support of an electoral system as a desirable characteristic in itself, i.e., a voter might prefer an electoral system with large public support over a rather contested electoral system even when the latter has more characteristics that the voter finds desirable.
Trade-offs
There is consensus that different electoral systems fulfill different demands more or less well (Shugart, Reference Shugart2001; Farrell, Reference Farrell2011). An ideal electoral system that, under all parameters, perfectly meets the prerequisites and functions mentioned above does not exist (Grofman and Bowler, Reference Grofman and Bowler1996; Nohlen, Reference Nohlen1996). Discussions on electoral systems are either normative in nature by attempting to highlight the importance of specific factors, or they are shaped by trade-offs. The latter are largely about the search for electoral systems which may not completely fulfill all of the functions mentioned above, but at least most of them to an acceptable level of satisfaction (Carey and Hix, Reference Carey and Hix2011; Raabe and Linhart, Reference Raabe and Linhart2018). The focus here is often on mixed and hybrid systems. While Lijphart (Reference Lijphart1984) posed the question, whether these systems would even succeed in mixing the advantages of different systems, the question has since more moved on to what the successful balance of different functions would look like. This understanding allows electoral systems to be judged as functional if they succeed in fulfilling a demand to a large degree with only minimal losses in another function. Unsuccessful combinations, on the other hand, only achieve a small margin of success in one function with high losses in another.
The conflicting goals discussed most frequently are proportionality and party system concentration (Nohlen, Reference Nohlen1984; Powell, Reference Powell2000). This is mostly due to the antithetical nature of the two functions – each electoral system that forces concentration via mechanical means does so at the cost of the proportionality between votes and seats. Newer studies of electoral systems show, however, that the trade-off described above can reach a good balance (such as in PR systems with small district magnitudes or in compensatory MMP systems; see Carey and Hix, Reference Carey and Hix2011; Raabe and Linhart, Reference Raabe and Linhart2018).
Other conflicting goals are discussed less intensively but do not play a minor role. Some newer studies, mostly researching elections in Germany, highlight the issue that broad parts of the electorate do not understand the electoral system (for an overview, see Jankowski et al., Reference Jankowski, Linhart and Tepe2022). Attempts to improve personalization, for example by introducing cumulation or cross-voting mechanisms, can go at the price of understandability (cf. Schäfer and Schoen, Reference Schäfer and Schoen2013; Müller and Jankowski, Reference Müller and Jankowski2019: 265). Thus, personalization and understandability can be treated as conflicting goals, too.
Further, the attempt to unify or balance out different demands like proportionality, concentration, and personalization is likely to lead to (too) complicated systems which are not understood by large parts of the electorate (Nohlen, Reference Nohlen1996: 96). While, for example, MMP systems often are evaluated positively with regard to a successful balance (Nohlen, Reference Nohlen1984; Saalfeld, Reference Saalfeld2005; Linhart et al., Reference Linhart, Raabe and Statsch2019), studies also point out that these systems are confronted with the problem of lacking comprehensibility (Pappi and Thurner, Reference Pappi and Thurner2002: 210; Karp, Reference Karp2006).
Further conflicting goals are conceivable, but harder to address in general. For example, we argued above that the increasing complexity of electoral systems could be a possible reason for their lacking legitimacy. Here, conflicting goals that we attributed to comprehensibility are also likely to be connected with the goal of legitimacy. Likewise, the representation of minorities follows a similar core idea like proportionality, namely a broad and accurate reflection of the electorate in parliament. As a consequence, trade-offs discussed for proportionality are likely to also play a role for the demand of minority representation.
Due to the existence of these – and more – trade-offs, the question is which features of an electoral system are considered as more relevant by citizens, if hard decisions must be made. If no electoral system can fully satisfy all demands, which functions do they prefer over others?
Citizens’ attitudes toward electoral systems: theory, empirical findings, and expectations
The evaluation of electoral systems is a topic which has been discussed extensively among experts. In particular, a vast number of studies have dealt with the advantages of PR or plurality systems from a normative point of view, which we will not discuss here for the sake of parsimony (for an overview, see Powell, Reference Powell2000; Farrell, Reference Farrell2011). Regarding specific functions of electoral systems, Bowler et al. (Reference Bowler, Farrell and Pettitt2005) as well as Carey et al. (Reference Carey, Hix, Mozaffar and Reynolds2013) asked experts to rate various electoral system features – similar to those which we discussed in “Electoral systems’ functions and trade-offs”. While Bowler et al. found proportionality to be considered most important, according to Carey et al.’s study individual accountability and stable governments top the list. Since in the two studies different catalogues are used, the results are not fully comparable. But a tendency toward the advantages of PR systems seems to be appreciated in the study by Bowler et al., while in the study by Carey et al. functions of plurality systems are rated better. This can be a direct effect of the consulted experts – APSA members in the case of Carey et al., a broader group (PSA, APSA, and IPSA members) in the study by Bowler and colleagues.
Regarding the electorate’s preferences about electoral system functions, similar studies are not available. However, there are several strands of research which are related to this research question and which we briefly outline in order to frame our work and deduce expectations for our analysis. First, some studies examine variables which affect satisfaction with democracy. Farrell and McAllister (Reference Farrell and McAllister2006) identify the make-up of the electoral system as one important factor. According to their results, both the proportionality of an electoral system and its candidate-centeredness raise satisfaction. Taking individual factors into account, Anderson and Guillory (Reference Anderson and Guillory1997) hint to the fact that supporters of election winners are more confident than those of losers and thus highlight the importance of self-interest. They also find that differences between these groups are smaller in consensus democracies (typically with PR electoral systems) than in majoritarian democracies (typically using plurality or majority systems). Birch (Reference Birch2008) directly addresses the electoral process. Her results show that the existence of a PR component in the electoral systems fosters the evaluation of the elections as fair. We thus can expect that proportionality and personalization play an outstanding role in general, but we assume differences between supporters of large and small parties, according to their self-interest.
Second, some specific research exists in the context of electoral reforms. New Zealand, for example, has undergone a significant change in 1993 from plurality to MMP, based on a public referendum. According to Jou (Reference Jou2013), left-leaning/progressive voters tend to support the new system over the old while this is not or less clearly the case for center-right voters. These results indicate that electoral system preferences are influenced by voters’ ideological positions. Similarly, Vowles (Reference Vowles2011) asks which voters prefer coalition governments (typically necessary in countries with PR systems) or single-party governments (as often observed in plurality systems) in New Zealand. Corroborating the expectations, again supporters of small and/or left parties prefer coalitions. On the subnational level in Germany, Müller and Jankowski (Reference Müller and Jankowski2019) examine the cases of electoral reform in the German states of Bremen and Hamburg in which a closed-list system was replaced by a strongly personalized open-list PR system as a consequence of a referendum. They, as well, find evidence for ideological effects. According to their results, supporters of leftist parties are more favorable toward the electoral reform, i.e., they do not only have stronger preferences for proportional systems but also for candidate-centered electoral systems.
Further research has been carried out in the context of electoral reform proposals which finally have not been implemented. In 1992, possible electoral reforms toward a more proportional system have extensively been discussed in the UK (Dunleavy et al., Reference Dunleavy, Margetts and Weir1993). In polls, citizens were asked if they supported a change to such system, and what they thought about the maintenance of the current plurality system. While overall 59% of the panel supported a more proportional system and 41% were in favor of the previous system, considerable differences between voter groups became evident. 81% of Liberal Democrats voters and 73% of Labour voters preferred more proportionality, but 69% of Conservative voters wanted to keep plurality (Dunleavy et al., Reference Dunleavy, Margetts and Weir1993: 180). Karp (Reference Karp2007) analyzed voters’ attitudes toward an electoral reform proposal for the members of the Electoral College in Colorado. Specifically, the reform suggested voting the members according to PR. Here as well, liberal voters (or Democrats) preferred the proportional system more than Conservatives (or Republicans).
Summarized, we expect effects of ideology, with left-wing voters rating proportionality and personalization higher than right-wing voters, whereas the latter more strongly prefer party systems concentrating electoral systems.Footnote 3
Third, three recently published studies analyze preferences for electoral rules and outcomes in (quasi-)experiments. Around the 2012 French presidential election, Blais et al. (Reference Blais, Laslier, Poinas and Van Der Straeten2015) confronted subjects with four different voting rules (two-round majority, one-round plurality, alternative vote, and approval voting) and asked them which rule they liked best. The authors found self-interest as well as ideology influencing the preferences for single rules. Although highly innovative, the study is obviously restricted to voting rules for persons, not for assemblies. Framed by the context of Canadian elections, Blais et al. (Reference Blais, Sevi and Plescia2022) confront their subjects with hypothetic outcomes, some of them more, others less proportional. While also in this study, proportional outcomes are generally preferred over disproportional ones, the authors also hint to egoistic effects: Voters are most satisfied when their preferred party wins. The only cross-country study directly measuring preferences for electoral rules is the recent research by Plescia et al. (Reference Plescia, Blais and Högström2020). Like in the study by Blais et al. (Reference Blais, Sevi and Plescia2022), the authors conduct experiments and ask subjects about their satisfaction with potential election results, but also – and more importantly for our purpose – with the voting rules. Again, the voters prefer proportional voting rules, notably in all four countries under research (the UK, Ireland, Austria, and Sweden). Interestingly, Plescia et al. (Reference Plescia, Blais and Högström2020) also find country effects. While they expected a status quo bias, the opposite is true: Negative effects of disproportionality are smaller in the countries with PR systems (Austria and Sweden).
These results corroborate the expectations formulated above. Additionally, we can expect to observe differences between respondents in different countries.
In a nutshell, both the multi-dimensionality of electoral system functions and potential country effects have not been sufficiently addressed in this strand of research (the latter with the exception of Plescia et al., Reference Plescia, Blais and Högström2020). We contribute to the closure of this research gap with our conjoint experiment. From the literature discussed above, we can derive expectations for at least some subgroups and electoral system functions. Table 1 summarizes these expectations and shows the references from which we derive them. However, since many facets to which our research contributes have not been addressed at all so far, our article needs to be explorative at least in parts.
Expectations

Conjoint experiment
In order to address this paper’s research question, we conducted a cross-national online survey, as is typical for conjoint experiments (see Bansak et al., Reference Bansak, Hainmueller and Hangartner2016 for an example). In total, 3,739 subjects participated in our online experiment, between 1,200 and 1,300 in each country (the UK, Germany and the Netherlands). In order to avoid systematic bias in the composition of the sample, we used quotas for gender, age, education, and region of the respondents. In each country, these quotas were set to reflect the composition of the voting population.Footnote 4 The samples were provided by the internationally operating panel provider respondi, and the survey was conducted in May/June 2020.Footnote 5 To test the survey questions for intelligibility, a pre-test was conducted with the first 100 participants. We slightly adjusted the wording of the survey as a reaction to the pre-test subjects’ comments.
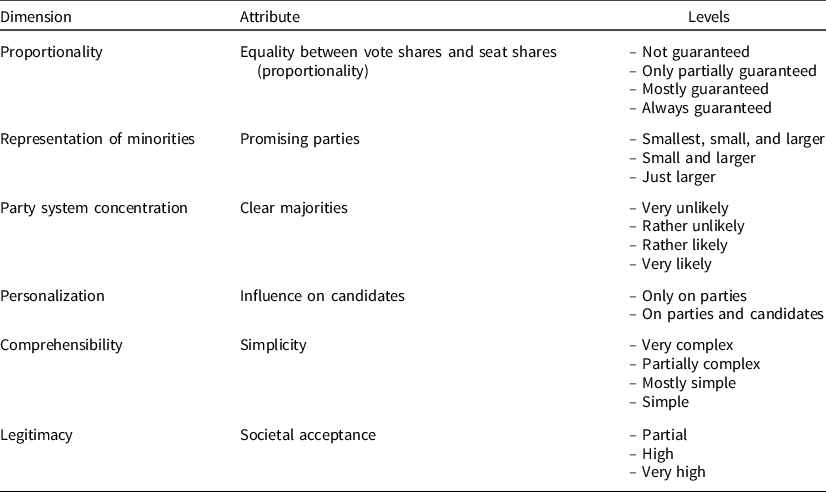
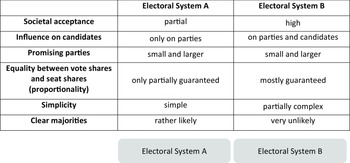
The conjoint experiment was introduced by a brief explanation of the different features of electoral systems (see the Online Appendix 1 for the exact wording). This was done to guarantee that even respondents without any knowledge of electoral systems can understand what the experiment is about. More precisely, we informed the respondents about the six dimensions of which the conjoint experiment consists. These are exactly the six demands we discussed in “Electoral systems’ functions”. However, for the sake of understandability and as reaction to pre-test comments, we partially used easier expressions.Footnote 6 All of these dimensions could take on different levels, which we display in Table 2. Each choice consisted of two electoral systems characterized by these six dimensions (see Fig. 1 for an example). Both the order of the dimensions and the specific selection of the different levels were completely randomized. Each respondent was presented five of those choice situations.
Attributes and levels in the conjoint experiment

Note: Smallest, small, and large parties have been defined as those parties with less than 5% support from the electorate, between 5% and 10%, or more than 10%, respectively. This definition has been made explicit in the instructions of the experiment (see Online Appendix).
Example of a choice situation.

Each level of the attributes was chosen in such a way that they represent the different levels for each dimension accurately. However, we did our best to simplify the complexity of some attributes. For example, we simplified personalization by reducing the options to “only vote for parties” and “vote for parties and candidates.” This of course does not do justice to the empirical variety of possible ways to elect candidates. However, our goal is first and foremost to differentiate whether there is the chance of a candidate vote or not. Differentiating into the different kinds of choosing candidates would overload the conjoint experiment and would come at the price of comprehensibility of the survey. Similar considerations between comprehensibility of the presented characteristics and the theoretically needed complexity were made for almost all characteristics.
As one can still argue that electoral systems are so complex that respondents could not understand the experiment, we not only presented an explanation of the attributes and levels at the beginning of the survey, but also, respondents could access the explanation of the different attributes and levels while conducting the conjoint experiment.
After the conjoint experiment, participants were asked a series of questions on their political interest, party preferences, attitudes and socio-demographic characteristics, and more. Importantly, we also asked two questions about political knowledgeFootnote 7 and six questions about the understanding of the six electoral system functions we explained and which built the core of our experiment.Footnote 8 Since the correct answers to the latter questions require a deeper understanding of political mechanisms, we use them as proxies for political competence (cf. Lupia, Reference Lupia2016).
Results
Overall attitudes toward electoral systems
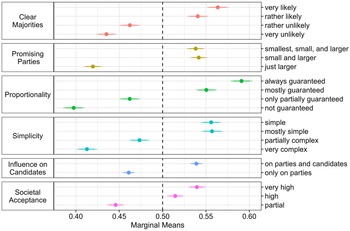
Figure 2 reports the main results of the conjoint experiment. The x-axis displays the marginal means for each attribute and level (cf. Leeper et al., Reference Leeper, Hobolt and Tilley2020). These marginal means indicate the selection probability of a profile if it contains the respective level averaged over all other attributes. If an attribute does not play any role for the subjects’ choice, the marginal means of all its levels should be around 50%. The more a value deviates from 50%, the more important the corresponding level is for the decision – in one or the other direction.Footnote 9 We report 95% and 99% confidence intervals as indicated by the thick (=95%) and thin (=99%) horizontal lines around the point estimates. We report both levels of confidence intervals as we conduct various subgroup analyses and the probability of false-positive findings increases when conducting multiple comparisons. Thus, by finding results that are significant at the 0.01%-level (i.e., 99% confidence intervals) reduces the chances of finding false-positive results.Footnote 10
Marginal means (full sample).
Note: Horizontal lines are 95% and 99% confidence intervals.

The main result that can be drawn from Fig. 2 is that all dimensions matter to a certain degree. We do not find a single attribute for which the levels’ marginal means cluster around .5. Further, the order of the levels within each attribute is in line with what electoral system theory would suggest. Generally, the worse an electoral system function is fulfilled, the lower the marginal mean. We can observe two exceptions here. First, in terms of simplicity, it does not seem to matter whether an electoral system is “rather simple” or “very simple.” The “full simplicity” attribute level does not have a larger marginal mean than a “rather simple” electoral system. Second, for promising parties, the marginal mean is higher for “small and larger” than for “smallest, small and larger.” While differences are small and not significantly different, this result could indicate a preference against splinter parties which in quite some cases are radical. All in all, the results suggest that the respondents understood the experiment in principle, despite the complexity of the topic.
With regard to the general order of the marginal means, proportionality clearly stands out with the largest overall marginal mean for electoral systems which guarantee full proportionality. This is followed by clear majorities, simplicity, and promising parties. We see the smallest variance for societal acceptance and influence on candidates. These results confirm the wish for proportional systems by the electorate from former studies (see “Citizens’ attitudes toward electoral systems: theory, empirical findings and expectations”). But the results go far beyond. We also learn that proportionality is not only preferred over party system concentration but also over all other features under research here. On the other hand, clear majorities are placed second by our sample. This can be interpreted as preference for a somewhat balanced electoral system – granted with a higher emphasis on proportionality. We omit a pairwise discussion of all attributes in the following. But regarding the trade-off between simplicity and personalization, it is important to know that there seems to be a stronger preference for simpler than for highly personalized electoral systems. Thus, our results are in line with our expectations regarding proportionality, but not for personalization.
However, we should also acknowledge that all effect sizes are comparably small. The strongest effects – observed for proportionality – are connected with marginal means of 0.58 (“proportionality always guaranteed”) and roughly 0.4 (“proportionality not guaranteed”). This amounts to a difference of almost 20 percentage points in the probability of a profile being selected between these two attribute levels. For the other attributes, the differences in the levels are smaller. These rather small effect sizes might result from two causes. First, due to the various trade-offs in electoral systems respondents might not have a clear preference for certain attributes and, thus, the effect sizes might reflect to a certain degree that all attributes are somewhat relevant for the respondents. Second, due to the complexity of the task and voters’ rather limited knowledge about electoral systems, some voters might not have particularly strong preferences for certain attributes which might reflect in less consistent response patterns in the experiment, which would also reduce the observed effect sizes.Footnote 11
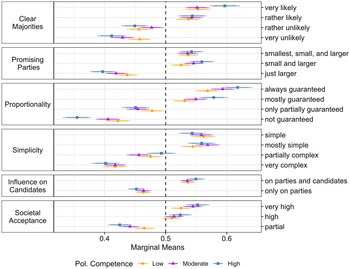
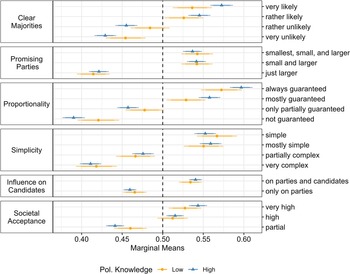
Although the results so far suggest that our subjects generally coped with the experiment, it is appropriate to take a closer look at this aspect, given the complexity of the topic. For this reason, we carry out a subgroup analysis based on the subjects’ varying abilities. To do this, we divided our sample into different subgroups – on the one hand according to their political knowledge (see fn. 7) and on the other hand, according to their political competence (see Online Appendix 2). Figs. 3 and 4 show the results.
Marginal means for subjects with high, moderate, and low political competence.
Note: Political competence was categorized as high, when a respondent answered five or six competence questions correctly, moderate between three and four questions, and low in the case of two or fewer correct answers.

Marginal means for subjects with high and low levels of political knowledge.
Note: Political knowledge is categorized as high, if the respondents could correctly answer two knowledge questions, and low otherwise.

Although we see differences between subjects with low and high political knowledge or competence, the main message which we draw from Figs. 3 and 4 is that the basic results of our experiment do not depend on the degree of the subjects’ abilities. We see the same patterns for all our subgroups. The order of the levels’ marginal means within each dimension is rational, all attributes considerably deviate from 0.5, and the relative importance of the single attributes is largely independent of the level of political knowledge or competence. For all subgroups the order more or less coincides with the order of the full sample; most notably, proportionality is considered most important.Footnote 12
However, there are also some deviations from the overall picture which deserve attention. For example, for respondents with low or moderate levels of political competence or low political knowledge, the comprehensibility of the electoral system is more important (ranked second according to the deviations from .5) than for those with high political knowledge or competence (ranked third). Obviously, subjects are well aware about their limitations. However, the non-overlapping confidence intervals that can be observed between the subgroups for some attributes result from a different effect. We see amplitudes for the politically informed and competent generally being higher. This makes sense, since a higher share of random choices can be expected for less informed or less competent respondents, shifting the marginal means closer to .5. Still, the pictures for these groups are sufficiently clear to attest them a general understanding of the experiment.
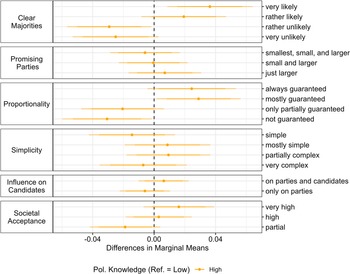
In order to test more systematically which differences between subgroups are statistically significant and which are not, we examine the differences in marginal means. The results for political knowledge are illustrated in Fig. 5; results for political competence are shown in Online Appendix 4. Generally, differences are statistically significant where the confidence intervals do not include the zero. We see that clear majorities, proportionality, and in parts societal acceptance, are more important for voters with high political knowledge than for those with low, whereas differences for the variables promising parties, simplicity, and influence on candidates are not statistically significant. Further, one should consider that some results are only significant at P < 0.05 and not at P < 0.01 as indicated by the 99% confidence intervals overlapping with zero in Fig. 5. However, the patterns observed are quite consistent and, thus, we are confident that the observed effects do not reflect random variation.
Marginal means differences by political knowledge.

Results by country, ideology, and party size
Since the studies discussed in “Citizens’ attitudes toward electoral systems: theory, empirical findings and expectations” suggest differences between citizens in terms of their electoral system preferences with a view to their ideology, the country in which they live and the probable success of their preferred parties (cf. Table 1), we investigate these facets also for our experiment.
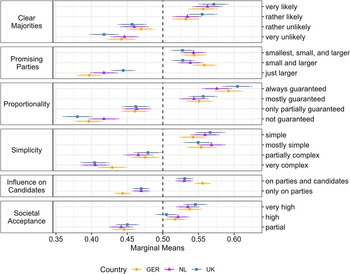
Starting with country effects, Fig. 6 shows the marginal means separately for our subjects from the UK, Germany, and the Netherlands; the differences in marginal means are illustrated in Online Appendix 4 (Figure A4). With few exceptions, we find no or only very small differences between the three electorates. In particular, proportionality is considered most important in all three countries. Where differences are statistically significant (cf. Figure A4), we find evidence for a status quo bias in three cases and against it in two further cases leading to an incoherent overall picture.
Marginal means by country.

Like Plescia et al. (Reference Plescia, Blais and Högström2020), we find a reversed status quo bias for proportionality. The selection probability of a profile in which an electoral system always guarantees proportionality is highest in the UK and lowest in the Netherlands. Obviously, the experience with a non-proportional electoral system like in the UK makes the citizens more aware of the value of this feature when it is absent. The Dutch, on the other hand, could take proportionality for (too) granted, so that it is only rated slightly more important than “clear majorities” or “simplicity” by them. Second, German respondents seem to have stronger preferences in favor of electoral systems which allow for candidate voting, compared to the Dutch or the British. This finding, too, corroborates the assumption of a reversed status quo bias as both the Dutch and British electoral systems have high levels of personalization.
On the other hand, British respondents rather accept only larger parties in their parliament than the Germans and the Dutch (variable promising parties) and they dislike it more strongly if clear majorities are very unlikely. As regards simplicity, German subjects are more likely to accept very complex systems than the British (significant at P < 0.05 only). These findings rather support the idea of a status quo bias.
However, taken together, the comparison of preferences between countries shows high levels of agreement between the subsamples of the different countries and little evidence for or against a strong and systematic status quo bias.
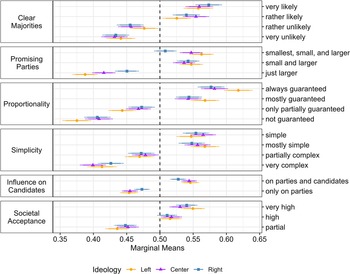
Turning to ideology, Fig. 7 shows the marginal means for subgroups according to their self-placement on a general left-right-scale (Figure A5 in Online Appendix 4 shows differences in marginal means). Strikingly, we see significant differences with regard to proportionality between left citizens on the one hand and center or right citizens on the other hand. In line with previous research, for subjects from the left, proportionality is considered clearly more important than for center or right respondents. However, these distinct differences should not hide the fact that also for center or right citizens, proportionality is seen as the most important demand. In other words, the relative importance of proportionality is highest for left-wing respondents, but the general importance of proportionality can be found for all groups.
Marginal means by ideology.
Note: Our subjects have been asked to place themselves on a left-right scale ranging from 0 to 10. We code subjects who chose the middle category 5 as “center,” lower values as “left,” and higher values as “right.” Although the ranges of the three categories are of strongly unequal size, each group contains roughly a third of our subjects.

In a similar vein, left citizens dislike systems in which only large parties are promising more strongly than center and especially right respondents. Interestingly, when we compare marginal means for the levels “small and larger” and “smallest, small and larger” parties, we observe different trends between left or center respondents on the one side and right respondents on the other. Whereas the first group rather likes more promising parties, the second group is more likely to select a profile if it includes only small and larger parties as promising, but not the smallest parties.
A further difference can be found with respect to influence on candidates. Like Müller and Jankowski (Reference Müller and Jankowski2019) we find stronger preferences of left (and center) citizens for candidate-centered electoral systems compared to right citizens. Still, for all groups the values are close to .5, hinting to a generally small relative importance of this attribute.Footnote 13
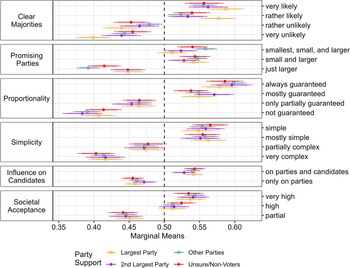
Concluding this subsection, we examine the functionalist argument that people support election rules the more, they produce outcomes they like. Following this idea, voters of large parties should put higher emphasis on “clear majorities,” whereas for voters of small parties, the attributes “proportionality” and “promising parties” are expected to be more important. Since size is relative, given the three countries in our sample, we differentiate between voters for the strongest party in the respective parliament (with the highest chances to succeed under non-proportional rules), voters for the second-strongest parties (with moderate chances), voters for other parties, and non-voters or respondents who were unsure.
We see that most confidence intervals in Fig. 8 largely overlap, and also the respective Figure A6 in the Online Appendix showing differences in marginal means indicates rare significant differences for the subgroups under research here. Yet, there are two exceptions. First, the subgroup of the largest parties’ voters is here the only researched subgroup for which proportionality does not matter the most. For this group, the highest (and lowest) marginal means can be found for “clear majorities.” On the other hand, for voters of the “other” – smaller – parties, “promising parties” is an outstanding attribute. All these findings are in line with expectations of rational self-interest. As Figure A6 demonstrates, many differences between attributes of the dimensions “clear majorities” and “promising parties” are statistically significant.
Marginal means by the size of the preferred party.
Note: Our subjects have been asked which party they would vote for, if general elections would take place next week. We allocated the voters according to the party sizes in the national parliament at the time of the experiment.

Having researched various subgroups and identified differences in their choices, it is important to note that, although there are differences between individual subgroups, overall the patterns for the single groups are very similar, i.e., the differences in marginal means are generally rather small. It would, therefore, be wrong to draw the picture of different groups having fundamentally different wishes about the design of electoral systems. Rather, it is correct that overall there is a broad consensus as to which electoral system functions are regarded as important and which as less important.
Conclusion
In this paper, we have contributed to the question of which electoral system demands are important for the population and which are not. For this purpose, we carried out a conjoint experiment in three countries whose electoral systems cover a wide range of possible types. Our results show that, in principle, all of the functions examined here are of relevance for the citizens, with proportionality standing out positively and simplicity and personalization falling behind the other attributes. Considering different subgroups, our results are twofold. On the one hand, we find clear differences between subgroups, at least with respect to some attributes. On the other hand, overall patterns remain surprisingly stable.
Our study goes beyond previous research in several points. First, apart from a few exceptions, former studies are restricted to single countries. Since we observe (albeit minor) differences between respondents in various countries, it seems important to use broader samples as a data basis for understanding how generalizable findings from single-country studies are. Second, previous research typically focuses on single electoral system functions only, almost exclusively on proportionality. Since multiple demands are addressed at electoral systems, this limitation leads to a very incomplete picture only. Third, although previous studies have identified differences between various voter groups, this again is limited to a few characteristics only, such as ideology or size of the preferred party. For a complex topic such as electoral systems, it is appropriate to also include variables connected to abilities to understand the matter, e.g., political knowledge, political competence and education.
On the basis of our results, we can derive clear recommendations for electoral system designers and for those who decide on electoral systems. Importantly, the outstanding position of proportionality needs to be addressed again. Electoral systems that violate this criterion too strongly are not in the interest of the sovereign. This argument is all the more valid as this result is stable across (almost) all subgroups including electorates in different countries. And even where proportionality is less outstanding, it still takes an important position.
Having said this, it would also be wrong to rely solely on proportionality. Our results show that all of the examined attributes are viewed as important, including those that appear to be in opposition to proportionality. The complete abandonment of goals, such as party system concentration or the comprehensibility of electoral systems, would therefore be highly inappropriate. Rather, it seems advisable to shift the view on electoral systems that offer a good balance between different demands, with proportionality requiring special attention.
The particularly good news of our study is that major social conflicts between different groups are not to be expected. Apart from nuances, the ideas about what constitutes a good electoral system are the same in different social groups.
Of course, also the limitations of our study must be addressed. Although we conducted our experiment in three countries that cover a wide variety of electoral system types, these are of course not representative of all political systems around the world. All three countries here examined are established democracies, countries in Western Europe, parliamentary democracies, and wealthy industrialized countries. Whether or not our results are transferable, e.g., to presidential systems or to states outside Western Europe, must therefore remain unanswered for now. These limitations directly hint to open questions which need to be answered in future research.
Supplementary material
The supplementary material for this article can be found at https://doi.org/10.1017/S1755773923000218.
Acknowledgments
Previous versions of this article have been presented at the 26th IPSA World Congress and at the 2021 Congress of the Deutsche Vereinigung für Politikwissenschaft/German Political Science Association (DVPW/GPSA). We thank all panelists for helpful comments. Further, we are grateful to three anonymous reviewers for very important suggestions to improve our manuscript.