Implications
Selection for calves that require less feed than average during growth, has resulted in adult cows requiring less feed than average. These animals increase the efficiency of feed utilisation and the research presented here has shown that cows that were efficient calves have similar milk production, body condition score, BW and reproduction as inefficient individuals when managed under intensive pastoral grazing systems.
Introduction
In a pasture-based dairy system, the amount of milk produced/ha is affected by pasture growth, management, cow genetic merit and stocking rate (SR). The amount of milk fat+protein (milksolids; MS) production/ha is often used to indicate the efficiency of a herd or system, referred to as feed conversion efficiency. Feed conversion efficiency is important, because feed accounts for 50% to 60% of production costs in most dairy systems (Herndon, Reference Herndon2010).
Residual feed intake (RFI) is the difference between the actual and predicted dry matter intake (DMI) of individual animals. The RFI measure of efficiency has been well documented in growing beef animals (and non-ruminants), but less so in dairy cattle. Recent measurements of RFI with dairy calves (Williams et al., Reference Williams, Pryce, Grainger, Wales, Linden, Porker and Hayes2011; Waghorn et al., Reference Waghorn, Macdonald, Williams, Davis and Spelman2012) and lactating cows (Macdonald et al., Reference Macdonald, Pryce, Spelman, Davis, Wales, Waghorn, Williams, Marett and Hayes2014) defined divergence in RFI, and enabled the estimation of genomic breeding values for the trait (Pryce et al., Reference Pryce, Arias, Bowman, Davis, Macdonald, Waghorn, Wales, Williams, Spelman and Hayes2012).
Growing calves have been used for screening and determination of genetic markers for RFI (Pryce et al., Reference Pryce, Arias, Bowman, Davis, Macdonald, Waghorn, Wales, Williams, Spelman and Hayes2012), with a view to identifying efficient (lactating) cows and improving herd efficiency for milk production. Macdonald et al. (Reference Macdonald, Pryce, Spelman, Davis, Wales, Waghorn, Williams, Marett and Hayes2014) reported that calves identified as divergent in RFI during their growth phases (calf RFI) were also divergent for RFI during lactation. Of the 1052 calves screened for RFI at 5 to 9 months of age when fed alfalfa cubes (Waghorn et al., Reference Waghorn, Macdonald, Williams, Davis and Spelman2012), there was ~20% difference in DMI between the most efficient (low calf RFI) and least efficient (high calf RFI) 10% of the calves and no difference in BW or daily gain. The average pre-calving BW of these cows were 572 and 569 kg for the most efficient (low calf RFI) and least efficient (high calf RFI), respectively. When evaluated for RFI while lactating, group calf RFI ranking remained the same, but differences were ~3% to 4%, at similar levels of milk production (Macdonald et al., Reference Macdonald, Pryce, Spelman, Davis, Wales, Waghorn, Williams, Marett and Hayes2014).
The research presented here addresses both feed efficiency (RFI) and SR in an applied setting. Stocking rates are important in intensive temperate pastoral farming systems because they affect cow management, efficiency and productivity, and enable farmers to match production with feed supply to optimise profitability (Macdonald et al., Reference Macdonald, Beca, Penno, Lancaster and Roche2008 and Reference Macdonald, Penno, Lancaster and Roche2011).
We hypothesised that productivity of cows with divergent RFI would be affected by feed allowance and a high SR would be most detrimental to low RFI (efficient) animals. So the objective of the experiment described here was to determine if there are any negative effects of selecting efficient v. inefficient calves (low v. high calf RFI) on milk production, reproduction, or BW and body condition score (BCS) change as adult cows when grazing pasture at a range of stocking rates.
Material and methods
Lactating cows that were divergent for RFI as growing calves (calf RFI) were evaluated in a 3-year experiment at Hawera, New Zealand (39°61'S, 174°31'E) between 2011 and 2014. All procedures were approved by the AgResearch (Ruakura) Animal Ethics Committee (AEC 12363). Four farmlets were established on 44 ha of ryegrass-dominant pasture. Farmlets were subdivided into 0.5 ha paddocks, which were randomly allocated to one of four SR treatments, ensuring they were balanced for soil type, distance from the milking parlour and previous experimental treatments. The soil was a gently undulating and free-draining Egmont ash (Allophanic). The pasture composition was mainly perennial ryegrass (Lolium perenne L.) with small proportions of white clover (Trifolium repens) and other grass species.
Farmlets were stocked with 126 Holstein-Friesian cows at an SR of 2.2, 2.6, 3.1 and 3.6 cows/ha (24, 28, 34 and 40 cows/farmlet), with all cows calving in late winter (mid-July) to early spring (September). Nitrogen applied to each farmlet was similar (average 157 kg N/ha per year) but timing of application varied due to pasture growth and farmlet demand.
Initially, the farmlets were stocked with 2, 3 and 4-year-old cows (n=126). These cows had a known calf RFI and were selected from the 10% most and 10% least efficient of 1052 calves evaluated for RFI at 5 to 9 months of age (Waghorn et al., Reference Waghorn, Macdonald, Williams, Davis and Spelman2012). The cows used in the experiment averaged −0.88 and +0.75 kg DM intake/day for low and high calf RFI selections, respectively. There was an equal representation of low and high calf RFI animals within each farmlet.
Over the course of the experiment there was some attrition (e.g. from cows that failed to get in calf within 12 weeks of breeding or were culled for other reasons) and about 20% of each herd was replaced at the end of each lactation. Thus, 60% of the original cows were used for data collection and analysis in the 3rd year of the experiment. Replacement cows were from a separate herd that was purchased on the basis of genomic breeding values for RFI, with confirmation of actual RFI by measurement during lactation (Davis et al., Reference Davis, Macdonald, Waghorn and Spelman2014). This maintained an equal distribution of low and high RFI (determined as calves, or confirmed during lactation) within each farmlet; the data from the replacement cows were not used in the analyses as their RFI had been calculated as lactating cows and not as calves.
Feeding management
Herd management and grazing decision rules, described by Macdonald and Penno (Reference Macdonald and Penno1998), were the same for all farmlets with the inter-grazing interval managed to optimise production for each SR. On each farmlet, cows were rotationally grazed, similar to the description of Roche et al. (Reference Roche, Macdonald, Burke, Lee and Berry2007), with fresh pasture allocated each day. Paddocks were grazed in a rotation of 14 to 90 days, so cows received allowances that enabled intakes of up to 18 kg DM/day. Desired post-grazing pasture residual DM in all treatments was 40 mm in height (about 1500 to 1800 kg DM/ha).
Herd intakes were estimated throughout the experiment by calculating herbage mass in pre and post-grazing areas using a Rising Plate Meter on Tuesday, Wednesday and Thursday of each week. The Rising Plate Meter provides an objective and systematic measurement system for pasture mass and a standard equation (Rising Plate Meter reading×140+500=kg DM/ha; L’Huillier and Thomson, Reference L’Huillier and Thomson1988) was used to calculate kg DM/ha. Feed analyses were based on representative samples of pasture cut to grazing height once/month on each farmlet (to represent material consumed by cows) on the day before grazing (Macdonald et al., Reference Macdonald, Beca, Penno, Lancaster and Roche2008).
Pasture herbage mass was estimated by two people using calibrated visual assessment of each paddock and weekly farm walks similar to the method described by O’Donovan et al. (Reference O’Donovan, Connolly, Dillon, Rath and Stakelum2002). On each occasion, 11 calibration quadrats (each 0.3 m2) covering the range of herbage mass present were assessed before and after the farm walk. After the final assessment, the pasture within the quadrats was cut to ground level, washed and dried in a forced draught oven at 100°C until dry (~48 h). The herbage mass estimate for each paddock (for that week) was then adjusted using a regression of quadrat visual assessment on quadrat herbage mass. The net herbage accumulation was calculated weekly from the increase in herbage mass on ungrazed paddocks.
The total area of each farmlet was available for grazing for the entire year, with surplus pasture conserved as silage when growth exceeded cow requirements (primarily October and November). Weight of silage harvested for each paddock was recorded and was fed to cows in the farmlet from where it was harvested, as required (usually in late summer, fall and winter), and samples were taken for analysis. Samples from the silage were collected from the paddock pre baling. Duplicate samples of pastures and silage were dried at 100°C for DM determination and 60°C for 72 h, then ground to pass a 1.0-mm sieve (Christy Lab Mill, Suffolk, UK) to determine CP, NDF, ADF, non structural carbohydrate (NSC), lipid and ash, and predicted metabolisable energy content by near infrared reflectance spectroscopy (NIRS; Corson et al., Reference Corson, Waghorn, Ulyatt and Lee1999).
Individual milk yields (kg) were measured from all cows at each milking using the GEA Westfalia milking system and its associated DairyPlan C21 herd and parlour management software (GEA Farm Technologies, Hamilton, New Zealand). Milk fat, CP, true protein, casein and lactose concentrations determined on 1 day/week on composite p.m. and a.m. samples by a Fossomatic FT120 analyser (Fossomatic, Foss Electric, Hillerød, Denmark). Milk components were verified by reference techniques for a subset of milk samples: milk fat using Röse-Gottlieb (IDF, 1987) technique; CP, true protein and casein by macro-Kjeldahl techniques (Barbano et al., Reference Barbano, Lynch and Fleming1991).
BW and reproduction
BW and BCS were determined every week following morning milking, from start of calving for 12 weeks and fortnightly thereafter. BCS was assessed using a 10-point scale, where 1 is emaciated and 10 is obese (Roche et al., Reference Roche, Dillon, Stockdale, Baumgard and VanBaale2004). Those scores can be converted to a five-point scale using a regression equation generated by Roche et al. (Reference Roche, Dillon, Stockdale, Baumgard and VanBaale2004). Decisions to dry-off individual cows during each season were based on BCS, level of production and number of days from calving, as described by Macdonald et al. (Reference Macdonald, Beca, Penno, Lancaster and Roche2008). Cow BW and calf birth weight were recorded within 18 h of calving.
Cows were managed to calve every 12 months and mating management included recording of cows exhibiting signs of oestrus before the planned start of mating by twice daily visual observation, aided by paint applied to the tail-head of the cow. Cows that had not shown signs of oestrus by 30 days post-calving were presented for veterinary examination. Those without a palpable corpus luteum were treated with an intravaginal controlled internal drug releasing insert (CIDR®; InterAg, Hamilton, New Zealand). Artificial insemination was performed for the first 6 weeks from planned start of mating followed by a further 6-week natural breeding.
Progesterone was determined in milk samples twice weekly from 7 days post-calving until planned start of mating, using a commercial kit (Coat-A-Count; Diagnostic Products Corp., Los Angeles, CA, USA). The postpartum anoestrus interval was defined as the interval from calving to the first of the two consecutive samples where the milk progesterone concentration were ⩾2 ng/ml, as validated for use in cattle by McDougall et al. (Reference McDougall, Williamson and Macmillan1995). The date of conception was determined from mating records and confirmed by ultrasound measurements at 8, 15 and 29 weeks after the planned start of mating.
Blood was collected into an evacuated tube (100 international units sodium heparin/ml blood to prevent coagulation) from each cow by coccygeal venipuncture ~7 days before calving, on the day of calving, days 7 and 30 post-calving and monthly until the end of lactation. Plasma was extracted and analysed to determine concentrations of urea and creatinine during each of the 3 years, and non-esterified fatty acids, aspartate aminotransferase and glutamate dehydrogenase in the final 2 years of the trial. These analyses were used to indicate any differences in tissue turnover and cow health between low and high calf RFI groups. Analyses of each blood metabolite used SAS 9.3 (Proc Mixed).
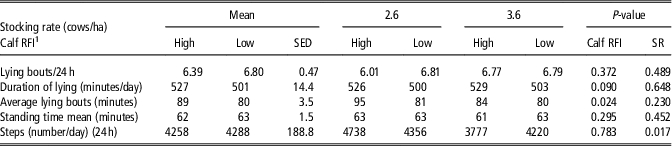
During the 3rd year of measurements, walking and lying behaviour was measured using pedometers (IceTag® ActivityMonitor; Ice Robotics Ltd, Edinburgh, UK) fitted to the left hind legs of eight low and eight high calf RFI animals on the 2.6 and 3.6 cows/ha farmlets (n=32; selected randomly). The measurements were restricted to these two farmlets due to limited resources. These cows were selected randomly from the cows available for use. Measurements were made for 4×55 day periods and data are expressed as time spent lying and standing as well as number of steps taken per day.
Statistical analysis
The linear trend of stocking rate over the trial was determined using linear models fitted to the 3-year averages of each SR for each variable (GenStat 16.2, 2013). A quadratic term was also included in the analysis but was dropped from the analyses when not significant at P<0.05.
The repeated measurements of BW and BCS for 35 weeks post-calving were analysed using spline models within the linear mixed model framework described by Verbyla et al. (Reference Verbyla, Cullis, Kenward and Welham1999). Year, age, SR, calf RFI and the interaction of SR with calf RFI, the linear trend of week and the interaction of treatments with the linear trend of week were included in the model as fixed effects and cow, linear trend of week within cow, spline, the interaction of cow with spline and the interaction of treatments with spline were included as random effects (GenStat 16.2, 2013). Residual maximum likelihood was used to fit these models. Pre-calving BW and BCS for the week before calving were analysed as mixed models using residual maximum likelihood, including year, age, SR, calf RFI and interaction of SR with calf RFI as fixed effects, and cow and year within cow as random effects.
Annual totals for production were calculated for each cow for each year of the trial and these were analysed as repeated measurement data with mixed models, including year, age, SR, calf RFI and interaction of SR with calf RFI as fixed effects, and cow and year within cow as random effects. GenStat 16.2 (2013) was used for all statistical analyses of BW, BCS, reproduction, production and grazing behaviour.
Days from calving to first mating, days from planned start of mating to conception date, and days from calving to the measurement day when milk progesterone was first ⩾2 ng/ml was calculated for each cow for each lactation. Reproduction data were analysed for each year of the trial using GLMs with binomial error distribution and logit link for the proportion of cow’s pregnant and linear models for continuous variables with age, SR, calf RFI and interaction of SR with calf RFI in the model.
Cow measures of walking and lying made in the 3rd year of the trial were analysed using mixed models including SR, calf RFI and interaction of SR with calf RFI as fixed effects, and cow as a random effect.
Analyses of each blood metabolite used SAS 9.3 (Proc Mixed) and samples from days −7, 7 and 30 were analysed separately for each calf RFI group, year and sampling date. The model included SR, calf RFI and their interaction as fixed effects and cow as random effect. The monthly samples from day 60 onwards were analysed separately for each calf RFI group and lactation and sampling date using mixed models approach to repeated measures ANOVA. The model included SR, calf RFI, month and their interactions as fixed effects, and SR as random effect.
Results
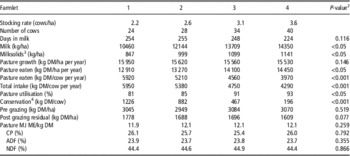
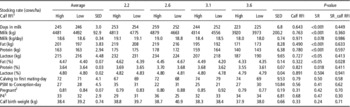
Analyses did not identify interactions between calf RFI groups and year, for production, days in milk, BCS, BW or BW change, so mean values over 3 years for each SR are presented in Table 1. Values for cows with divergent RFI are given in Table 2 for each SR treatment. Although there were no differences between cows with divergent calf RFI for days in milk, milk or MS production, and no interaction with SR (Table 2), actual values are presented to help readers envisage the experiment and treatments.
A description of pasture growth, composition and milk production for cows on the four farmlets, averaged for the 3-year trialFootnote 1

DM=dry matter; MJ ME=mega joules metabolisable energy.
1 There were no statistically significant effects of year on the parameters given below, thus only average values are presented.
2 P-value for linear trend of stocking rate.
3 Milksolids=fat and protein.
4 Pasture silage conserved within farmlets.
Milk production and fertility measures from cows with divergent residual feed intake determined as growing 5 to 9-month old calves (calf RFI), managed at four stocking rates (SR) and averaged over 3 years of production

SED=standard error of the difference.
Data are expressed/lactation, unless indicated.
1 Low calf RFI, efficient use of energy; high calf RFI, inefficient use of energy.
2 Proportion of cows pregnant after a 12-week mating period.
3 Days from calving until the concentration of progesterone in milk exceeded 2 ng/ml.
Pasture herbage accumulation for all farmlets averaged 15.5, 15.8 and 14.9 ton DM/ha in years 1, 2 and 3 of the trial, and MS production was 996, 946 and 1079 kg/ha in the respective years. Average annual pasture yields and pre-grazing pasture composition (Table 1) were similar for all SR treatments. Concentrations of CP and NDF (Table 1) averaged 25.8% and 44.6%, respectively, with a predicted ME of 12.0 MJ/kg DM. The composition (% of DM) varied over the growing season, with lowest values for CP in summer (24.8%), and 25.5%, 25.5% and 27.4% in autumn, winter and spring, respectively.
The cows grazing at high SR had a higher utilisation of pasture (by grazing) than those at lower SR (93% v. 81%; Table 1). The high SR reduced MS production/cow (from 389 to 313 kg/lactation), and reduced lactation length by 30 days (P<0.001) (Table 2) but did not affect reproduction (Table 2). Calf birth weights averaged 38.5 kg, and days from calving to first mating averaged 72, from planned start of mating to conception averaged 28, and milk P4 concentrations exceeded 2 ng/ml at 33 days post-calving (Table 2).
The grazing intervals were managed to achieve sufficient pasture cover to meet the requirements of cows throughout the year (the only supplement fed was silage grown on each farmlet), while maintaining pasture quality as far as practicable. The intervals between grazing averaged 35, 26, 38 and 94 days in spring, summer, fall and winter, respectively, and there were no meaningful differences in grazing frequency between farmlets.
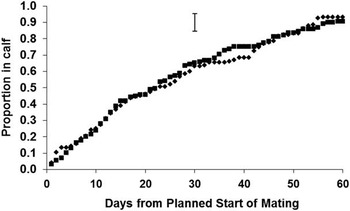
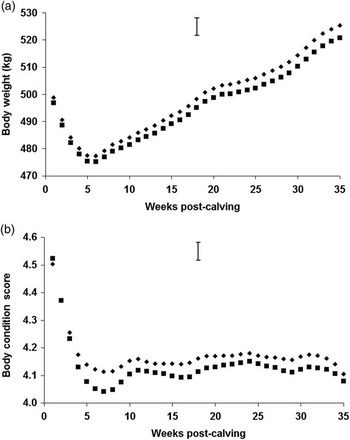
In the trial reported here, selection for calf RFI did not affect day from calving to first mating (P=0.788) (Table 2), planned start of mating to conception (P=0.563), proportion of cows pregnant (P=0.308) (Figure 1) or calf birth weight (P=0.330). Concentrations of progesterone in milk did not indicate differences between the two efficiency groups (P=0.680), and there was no interaction between calf RFI groups and SR (P=0.299) in relation to oestrus, days from calving to first mating or PSM to conception (Table 2). Similar proportions of cows selected for divergent calf RFI became pregnant throughout the mating period (Figure 1) and cow BW and BCS followed similar patterns after calving for the divergent selections (Figure 2a and b).
Proportion of Low calf RFI1 (♦) (most efficient) and High calf RFI1 (■) (least efficient) cows pregnant from planned start of mating for cows that were managed at a range of stocking rates for three lactations. Data are averaged for the 3-year study with maximum SED. 1Calf RFI=residual feed intake determined at 5 to 9 months of age.

(a) BW and (b) body condition score (1 to 10 scale1) from 1 week pre calving to 35 weeks post-calving with maximum SED of Low calf RFI2 (♦) (most efficient) and High calf RFI2 (■) (Least efficient) cows that were managed at a range of stocking rates for three lactations. 1Body condition scores can be converted to the five-point scale using the regression equation (Roche et al., Reference Roche, Dillon, Stockdale, Baumgard and VanBaale2004). 2Calf RFI=Residual feed intake determined at 5 to 9 months of age.

Concentrations in plasma of creatinine averaged over 3 years were lower in low v. high calf RFI individuals (60.2 v. 63.0 µmol/l), and differences between calf RFI selections were significant in years 1, 2 and 3 of the study (P=0.0023, 0.0438 and 0.0147, respectively). Urea concentrations in plasma differed between months (P<0.0001), with average concentrations of 5.9, 6.8 and 9.6 mmol/l in years 1, 2 and 3, respectively, but were similar for cows with divergent calf RFI. There were no differences between cows with high or low calf RFI in concentrations of non-esterified fatty acids (0.35 mEq/l) or the enzymes aspartate aminotransferase (59.1 IU/l) and glutamate dehydrogenase (14.5 IU/l). There were no effects of SR on any of the metabolites measured in plasma.
Measurements of cow behaviour in year 3 during lactation indicated they lay down six to seven times over 24 h, for a total of 8.6 h/day. There was a small difference in duration of each lying period for low and high calf RFI animals (80 v. 89 min/lying bout; P<0.05), but there were no differences in other parameters (Table 3). The number of steps/day was higher (P<0.01) for cows on the low v. high SR (4547 v. 3999), but values were similar for both calf RFI groups and there was no interaction with SR.
Lying and standing time, and steps taken by cows with divergent residual feed intake determined as growing 5 to 9-month old calves (calf RFI), managed at two stocking rates over 220 days in year 3 of the trial

RFI=residual feed intake.
1 Low calf RFI, efficient use of energy; high calf RFI, inefficient use of energy.
Discussion
It is important that selection for efficient use of feed (RFI) does not have negative consequences for other aspects of productivity, especially under conditions typical of commercial farming. Grazing at four SR, in combination with the 3-year duration of the measurements reported here, provided a rigorous assessment of the cows under conditions typical of New Zealand dairying where calving is at 12-month intervals, and feed availability varies in response to management and climate. This experiment is novel for dairy cows with known divergence for calf RFI to be managed under pastoral conditions. Even though we were not able to measure intakes to verify the reduced intakes of the cows that were low RFI as calves, the fact that there was no difference in milk production between the low and high calf RFI animals confirms previous results (Davis et al., Reference Davis, Macdonald, Waghorn and Spelman2014; Macdonald et al., Reference Macdonald, Pryce, Spelman, Davis, Wales, Waghorn, Williams, Marett and Hayes2014). Measurement of individual pasture DMI was not possible in this trial whereas as calves they were fed a dry diet in pens so that intakes could be measured (Waghorn et al., Reference Waghorn, Macdonald, Williams, Davis and Spelman2012). There were no differences between cows identified as low or high calf RFI on days in milk (Table 2) and there was no interaction with SR, suggesting selection did not affect changes in resilience.
Vallimont et al. (Reference Vallimont, Dechow, Daubert, Dekleva, Blum, Barlieb, Liu, Varga, Heinreichs and Baumrucker2011) reported strong negative correlations between efficiency traits (in a study of 11 tie-stall dairy farms) and BW and BCS, suggesting that low RFI cows (most efficient) generally had a lower BW and BCS than less efficient (high RFI) individuals. They reported that larger and fatter cows were less efficient than smaller and thinner cows. Consistent with this, Herd et al. (Reference Herd, Arthur and Bottema2014) and also Arthur et al. (Reference Arthur, Herd and Basarab2010) have reported that in studies with beef cattle selected for divergent RFI, the most efficient had less rump and rib fat, relative to inefficient (high RFI) individuals. These results have contributed to concerns that the most efficient dairy cows will lose more BW immediately after calving. Prolonged periods of negative energy balance will reduce BCS and can reduce fertility (Reist et al., Reference Reist, Erdin, von Euw, Tschümperlin, Leuenberger, Hammon, Morel, Phillipona, Zbinden, Künzi and Blum2003; Roche et al., Reference Roche, Macdonald, Burke, Lee and Berry2007; Oikonomou et al., Reference Oikonomou, Valergakis, Arsenos, Roubies and Banos2008), while tissue mobilisation and re-synthesis is energetically inefficient. These effects demonstrate the importance of measurements over months or years as was done in this trial, rather than weeks, when assessing individuals for RFI.
In New Zealand, pasture is often the sole feed for most or all of the lactation, so dairying systems capture seasonal patterns of pasture growth by adopting a compact calving in spring to match the seasonal supply of pasture with herd requirements (Macdonald et al., Reference Macdonald, Beca, Penno, Lancaster and Roche2008). Any decrease in fertility will increase calving spread and will reduce potential production and profitability. To maintain this alignment between pasture supply and demand, it is essential that cows calve every 12 months, and to do this they must be inherently fertile.
One of the concerns with selecting for low RFI is possible negative associations with traits such as fertility. Pryce et al. (Reference Pryce, Wales, de Hass, Veerkamp and Hayes2014) reported a lower (P=0.05) 6-week in-calf rate, in efficient (low RFI) Holstein cows, when compared with their high RFI counterparts fed pastures with grain in Australia. Vallimont et al. (Reference Vallimont, Dechow, Daubert, Dekleva, Blum, Liu, Varga, Heinrichs and Baumrucker2013) also reported that Holstein dairy cows with low RFI had more days between calving and conception, but a longer productive life in intensive high production (United States) systems, relative to cows with a higher RFI. These systems differ from the pastoral grazing evaluated here, because inclusion of grain increased milk production, and Coleman et al. (Reference Coleman, Berry, Pierce, Brennan and Horan2010) did not find any association between RFI and fertility in dairy or beef cattle. However, Arthur and Herd (Reference Arthur and Herd2005) and Donoghue et al. (Reference Donoghue, Arthur, Wilkins and Herd2011) reported a delayed calving date for Angus cattle with a low RFI.
The data presented here show no effect of divergent calf RFI on postpartum BW and BCS change or fertility, despite a significant loss of body tissue after calving at all SR, similar to that reported by Macdonald et al. (Reference Macdonald, Beca, Penno, Lancaster and Roche2008). An important component of management of dairy cow management on pasture is to ensure they achieve adequate BCS at calving (Macdonald and Penno, Reference Macdonald and Penno1998) and both groups were close to the desired 5.0 BCS 1 week pre-calving. Thus, the good fertility of the cows in this experiment may have been facilitated by management to ensure all cows had an appropriate BCS at calving because cows that calve with a low BCS are likely to have an extended postpartum anoestrus interval, and are less likely to get pregnant than cows with a higher BCS (Roche et al., Reference Roche, Friggins, Kay, Fisher, Stafford and Berry2009).
Of the blood analyses undertaken only plasma creatinine differed between calf RFI groups, and although the higher values in the less efficient (high RFI) cows correspond with a higher protein turnover (Vagnoni and Broderick, Reference Vagnoni and Broderick1997; Herd and Arthur, Reference Herd and Arthur2009), the differences between groups were minor. Similar concentrations of non-esterified fatty acids corresponds with similar patterns of BCS and BW change in the two groups, especially postpartum and the absence of SR effects suggests that even the high SR did not cause metabolic stress and tissue mobilisation. Liver enzyme concentrations were within expected values and indicated good metabolic health in all animals.
Herd and Arthur (Reference Herd and Arthur2009) suggested differences in activity could account for 9% of the variation in RFI in beef cattle and Green et al. (Reference Green, Jago, Macdonald and Waghorn2013) reported efficient calves (including some of those evaluated here) ate more slowly than less efficient counterparts. However, use of IceTag® ActivityMonitor sensors showed no significant differences between selections based on calf RFI in two SR treatments, for walking, lying or the number of lying bouts (Table 3). Cows in the high SR (3.6 cows/ha) treatment took fewer steps than those in the lower SR (2.6 cows/ha) treatment (P=0.017), but pasture DM intake of individuals cannot be measured, but it can be estimated by the use of indigestible markers. Thus, relationships between walking and feeding could not be determined. However, these results contrast with Gregorini et al. (Reference Gregorini, Waghorn, Kuhn-Sherlock, Romera and Macdonald2015) where cows that were divergent for calf RFI (low RFI) walked less and are more efficient grazers. Cows used by Gregorini et al. (Reference Gregorini, Waghorn, Kuhn-Sherlock, Romera and Macdonald2015) were selected from the same pool of animals as used here, and no explanation can be given for the difference in the results.
The range of SR, resulted in calculated intakes ranging from 5.9 to 4.0 ton DM/cow per year (low and high SR, respectively), which should enable interactions between RFI and SR to be identified and measured. However, over the 3-year study there were no meaningful interactions, and no negative effects on fertility, BCS or production associated with calf RFI in grazing cows. The main benefits of high SR were the higher pasture utilisation (by grazing) and production/ha, similar to reports by Macdonald et al. (Reference Macdonald, Beca, Penno, Lancaster and Roche2008) and Horan et al. (Reference Horan, Mee, O’Connor, Rath and Dillon2004) for pasture-based dairy production systems, which can improve farm profitability.
Conclusion
The hypothesis that productivity of cows with divergent RFI would be affected by feed allowance and a high SR would be most detrimental to low RFI (efficient) animals was not proven. The experimental results summarised here indicate no negative effects of selection for efficiency (cows identified as low RFI as calves) when lactating cows are grazing pasture, although intakes could not be verified. There were no differences between the two selections in production, reproduction BW and BCS at any feed allowance (SR) over the 3-year trial. These results suggest that selection for RFI as calves to increase efficiency of feed utilisation for production during lactation will not have negative effects on important farm productivity variables (milk production and reproduction) when managed under intensive pastoral grazing systems.
Acknowledgements
The authors thank Livestock Improvement Corporation (LIC), the Ministry of Business, Industry and Employment (formerly Foundation for Research, Science and Technology; FRST; Wellington, New Zealand), New Zealand dairy farmers through DairyNZ Inc. (Hamilton, New Zealand) and Trade and Enterprise (NZ) (Auckland, New Zealand) for funding. They also acknowledge the DairyNZ technical and farm teams at Hawera (New Zealand) for managing the experiments. The authors also thank Barbara Dow and Barbara Kuhn-Sherlock who analysed the data sets.