Implications
National emission inventories require reliable emission data representative of national practices. In some EU countries, such as France, cattle production systems are very diverse, including deep litters, for which few references exist. This study provides new insight on pollutant gas emissions from liquid and solid manure combined with low or high N excretion levels and recommends some changes to improve consideration of diet and manure management practices in inventory guidelines.
Introduction
Environmental impacts of agriculture in general, and of livestock systems in particular, have been discussed extensively in recent decades. Greenhouse gas (GHG) and NH3 volatilization processes, as well as factors that influence these, are well understood and documented (Monteny and Erisman, Reference Monteny and Erisman1998; Petersen et al., Reference Petersen, Blanchard, Chadwick, Del Prado, Edouard, Mosquera and Sommer2013). In particular, NH3 emissions from livestock are directly linked to the amount of N the animals excrete, especially in the form of urea (Bussink and Oenema, Reference Bussink and Oenema1998; Hristov et al., Reference Hristov, Hanigan, Cole, Todd, McAllister, Ndegwa and Rotz2011). Urea is rapidly hydrolysed by the enzyme urease to ammonium-N and compounds, referred to as total ammonia nitrogen (TAN). A reduction in the dietary protein content appears the most effective strategy to decrease at-source N, and especially TAN, excretion, and related NH3 emissions (see Hou et al., Reference Hou, Velthof and Oenema2015 for a review). However, most studies consider manure in its liquid form, with daily or more frequent removal from the barn. For deep litter systems, which still represent a large proportion of housing systems in France, the UK and Eastern Europe (Steinfeld et al., Reference Steinfeld, Mooney, Schneider and Neville2010), manure is mixed with bedding material and accumulates for a few weeks in a thick layer where the oxygen level decreases with depth. This can result in several processes, such as aerobic and/or anaerobic organic matter (OM) degradation, urea hydrolysis, nitrification-denitrification and N immobilization (Jeppsson, Reference Jeppsson1999). These complex interactions among microbial, biochemical and physical processes result in highly variable emissions of NH3 and GHGs (Webb et al., Reference Webb, Sommer, Kupper, Groenestein, Hutchings, Eurich-Menden, Rodhe, Misselbrook, Amon and Lichtfouse2012) that could intensify with high N and TAN excretion levels.
The objective of this study was therefore to investigate consequences of the interaction between dietary N (low or high) and manure management (liquid or solid) on NH3, CH4 and N2O emissions at the dairy barn level. Diets provided balanced amounts of energy with degradable protein in deficit (LowN) or in excess (HighN), which should result in different levels of TAN being excreted. Manure was managed in either liquid form (LM) (removed twice a day) or solid form (SM) as deep litter that accumulated under the animals for 4 weeks, leading to variable physicochemical processes causing gas emissions. Finally, measured emissions were confronted to estimates using the Tier 2 European Environment Agency (EMEP/EEA; European Environment Agency, 2016) and Intergovernmental Panel on Climate Change (IPCC, 2006) methods to discuss the accuracy of emission factors (EF) used for national and international inventories, under the conditions of the study.
Materials and methods
Animals, treatments and experimental design
The experiment was conducted at the INRA dairy experimental farm in Méjusseaume, near Rennes (France), from September 2012 to January 2013. Six Holstein dairy cows in late lactation (242±40 days in milk and 19±3 kg of milk per cow per day) were divided into two homogeneous groups of three cows (initial bodyweight = 617±33 kg). The cows were in their second or third lactation. Each group of cows was housed in a closed and mechanically ventilated experimental room with negative air pressure and a controlled air-conditioning system (temperature maintained at ca. 16°C). Cows were milked in the rooms twice a day (0700 and 1700 h) and were weighed every 4 weeks. For practical reasons, each manure management treatment (LM v. SM) was allocated to one room with no changeover during the experiment.
Room A was equipped to manage manure in liquid form (no bedding material). For 14 days, the three cows were tied to measure N balance at the animal level on the last 4 days (LMtied); all manure either was collected for 24 h (to quantify N excretion) or fell into a gutter behind the animals and was automatically scraped outside of the room twice a day (0730 and 1630 h). For the following 14 days, the room was transformed to allow the animals to move around in a free-stall barn with a solid floor and cubicles (LMfree); since the gutter was covered, the solid floor was manually scraped twice a day (0730 and 1630 h) to remove the manure. In room B, animals produced solid manure on a deep litter of straw (SM). Straw was spread homogeneously on the floor each day (80 kg on the first day, 40 kg per day thereafter), and litter accumulated below the animals for 4 weeks. Liquids were collected continuously in the 1% sloping central gutter below the deep litter. The solid manure was removed from the room after 4 weeks. In both rooms, cows moved freely within a 40 m2 area when not tied (Supplementary Figure S1).
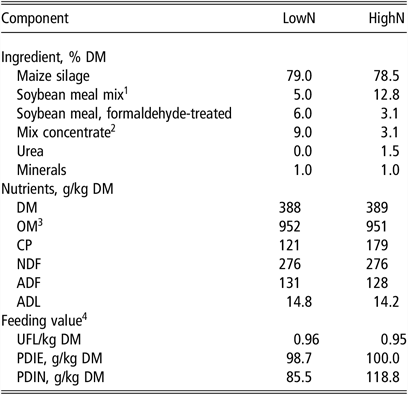
Dietary treatments consisted of total mixed rations offering low (LowN; CP: 120 g/kg DM, 85 g PDIN/kg DM) or high (HighN; CP: 180 g/kg DM, 119 g PDIN/kg DM) dietary degradable protein (PDIN – true protein absorbable in the small intestine when rumen-fermentable N is restricted in the rumen; INRA, 2007). The treatments represent extremes of the most commonly used feeding practices in French dairy systems (Pellerin et al., Reference Pellerin, Bamière, Angers, Béline, Benoît, Butault, Chenu, Colnenne-David, De Cara, Delame, Doreau, Dupraz, Faverdin, Garcia-Launay, Hassouna, Hénault, Jeuffroy, Klumpp, Metay, Moran, Recous, Samson, Savini and Pardon2013). The rations, composed of an 80 : 20 mixture of maize silage : concentrate, were fed ad libitum (refusal maintained at 5% to 10% of feed offered), individually for LMtied and at the group level for LMfree and SM twice a day (0800 and 1800 h) with free access to water. Diets were formulated to meet animal protein requirements (Table 1).
Diet composition, nutrient content and calculated feeding values of the two experimental diets (LowN, 120 g CP/kg DM; HighN, 180 g CP/kg DM) fed to dairy cows

1 Soybean meal mix is composed of 98% soybean meal and 2% molasses.
2 Mix concentrate is composed of 25% wheat, 25% maize, 25% barley, 20% beet pulp, 3% molasses, 1% vegetable oil and 1% NaCl.
3 OM=organic matter.
4 UFL, amount of net energy for milk production contained in 1 kg of a reference barley (87% DM, 2 700 kcal of metabolizable energy); PDIE, true protein absorbable in the small intestine when rumen-fermentable energy is limiting in the rumen; PDIN, true protein absorbable in the small intestine when rumen-fermentable N is limiting in the rumen (INRA, 2007).
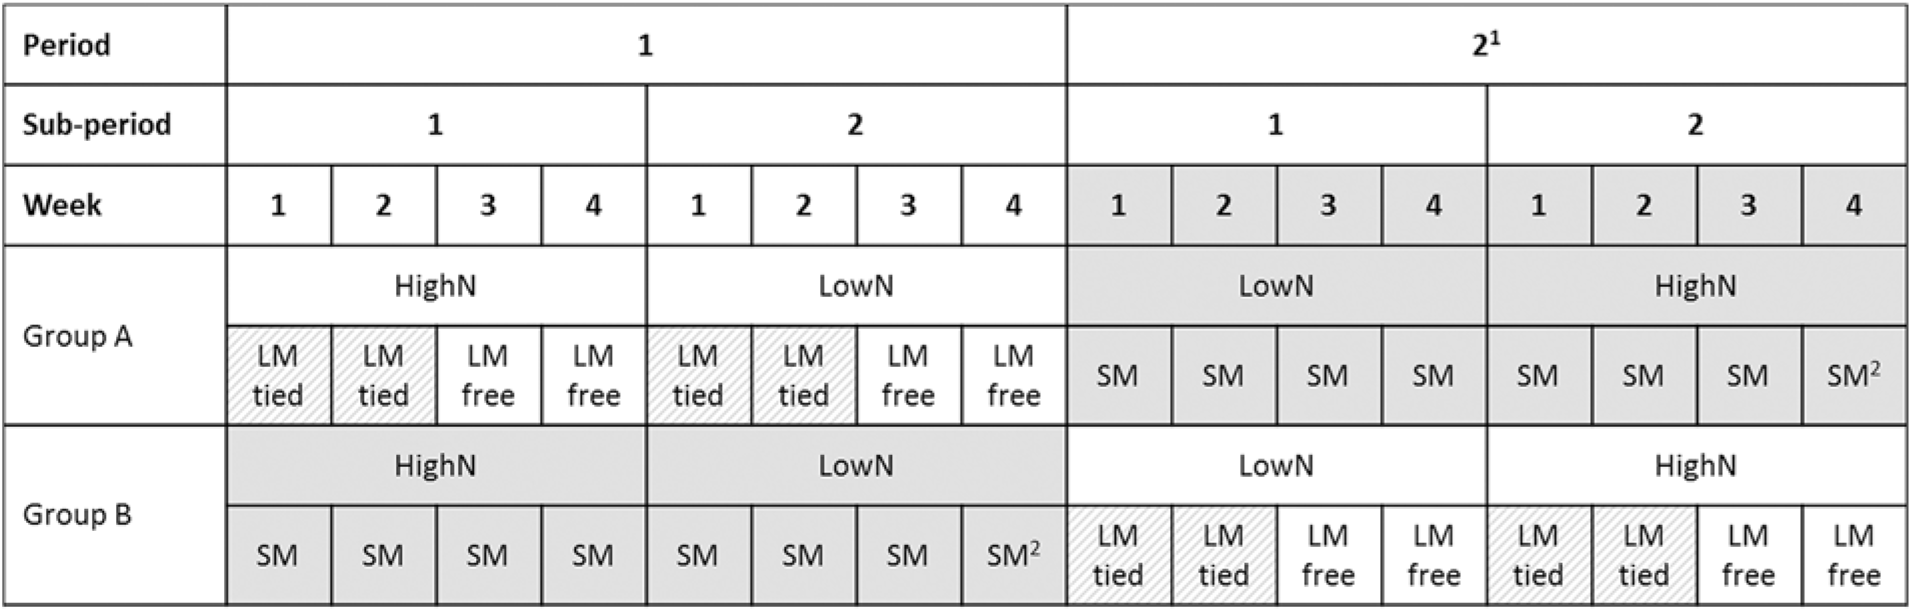
The experiment was conducted over two 8-week periods. Each group of cows was assigned to one manure treatment for period 1 and then switched to its alternative for period 2. During each period, the two dietary treatments (LowN v. HighN) were offered successively to each group of three cows during two sub-periods of 4 weeks (hereafter referred to as weeks 1 to 4); the order of succession was inverted between the two periods (Figure 1).
Description of the experimental design offered to the two groups of three dairy cows (A and B), with two dietary treatments (LowN, 120 g CP/kg DM; HighN, 180 g CP/kg DM) and two manure management systems (LM, white boxes: liquid manure; SM, grey boxes: solid manure, straw-based deep litter). In the LM treatment, for each sub-period, animals were tied for the first 2 weeks (LMtied, hatched boxes) and then allowed to move freely in the free-stall barn with cubicles (LMfree, empty boxes) for the last 2 weeks. In the SM treatment, cows were allowed to move freely over the whole area of the deep litter throughout the experience. 1Two cows, one in group A and one in group B, unexpectedly dried off in the course of period 2. 2For sub-period 2 of periods 1 and 2, the litter was left alone for 3 days after the cows left the room to measure gas emissions from the litter itself after the accumulation period.

Measurements, samples and analyses
Feed sampling and intake
Mechanical water meters were used to monitor daily water intake at the group level in LMfree and SM, and at the individual level in LMtied. Offered and refused feed were weighed and sampled daily to determine their DM concentration to calculate cow DM intake. Average samples of concentrate and maize silage offered and refused were taken per sub-period and analysed for OM concentration, total N concentration and fibre content (NDL, ADF and ADL).
Milk yield and composition
Individual milk yield was monitored daily. Morning and evening milk samples were collected 3 days a week to measure protein and fat contents. Daily total N in the milk was measured from morning and evening milk yields and joint samples at the individual level once during week 2 (in LMtied) and once during week 4 (in LMfree and SM) of each sub-period.
Faeces and urine
Faeces and urine daily excretion were quantified during the last 4 days and nights of week 2 in the LMtied treatment. Faeces were collected at the individual level in the gutter behind the animals and were weighed daily. Animals were equipped with harnesses to collect urine separately. Urine was immediately acidified with 500 ml of 20% H2SO4 to prevent NH3 volatilization and weighed daily. Samples were collected daily at the individual level (1% of fresh amount for faeces and urine) and averaged per week (four daily samples successively stored in the same container at −20°C) to analyse faecal DM, faecal OM, faecal and urinary total-N and urinary urea-N.
Chemical analyses
Dry matter and organic matter concentrations were obtained by drying of diets and faeces at 80°C for 48 h and ashing at 500°C for 6 h, respectively. Fibre concentration corresponded to ADF, NDF and ADL fractions (van-Soest et al., Reference Van-Soest, Robertson and Lewis1991). Milk protein and fat contents were measured by IR analysis using Milkoscan 605 (Foss Electric, Hillerød, Denmark). Total-N was measured using the Dumas method (Association Française de Normalisation, 2003), while urea-N resulted from a colorimetric enzymatic reaction assessed by a multi-parameter analyser (KONE Instruments 200 Corporation, Espoo, Finland).
N balance
During week 2 of the LMtied treatment, N balance was calculated individually for 4 days based on N intake minus [N in milk plus N excreted (urine and faeces) plus N retained by the animal (based only on its energy balance, as almost no N was retained for growth and gestation in the present study; INRA, 2007)]. The remainder was assumed to be related to losses during N recovery and/or unaccounted-for sources of N excretion.
Litter temperature
In the SM treatment, the temperature of the litter at a 10 cm depth was measured once a week using a stick temperature probe (HI 935005, Hana Instruments, Tanneries, France). The litter surface was virtually divided into six equal zones, in each of which three measurements were taken, resulting in a total of 18 temperature measurements averaged to have one mean temperature data per week (except for week 1 of sub-period 1 of period 2 due to equipment failure).
Gas emission measurements
Gas emissions, as well as temperature and humidity in the rooms, were continuously measured for both LM and SM from weeks 1 to 4 of each sub-period (Supplementary Table S1). Once per period (after sub-period 2), in the SM treatment only, gas emissions were also measured for 3 days immediately after the cows left the room but before the litter was removed. Gas concentration measurements started 3 days before period 1 to measure basal concentrations in the room without animals. An IR photo-acoustic analyser (INNOVA model 1412; Air Tech Instruments, Ballerup, Denmark) combined with a sampler-doser (INNOVA 1303) and a computer recorded the concentrations. The INNOVA analyser was fitted with six filters, enabling the concentrations of six gases (NH3, CO2, CH4, N2O, H2O and C2H6O) to be measured. This configuration was chosen to compensate for interference between NH3 and other volatile molecules (e.g. C2H6O; Hassouna et al., Reference Hassouna, Robin, Charpiot, Edouard and Méda2013). The instrument internally corrected for signal interferences from the gases measured (optical filter/detection limit: NH3 979/0.5 ppm; CO2 982/1.5 ppm; CH4 969/0.4 ppm; N2O 985/0.03 ppm) and was span-calibrated with known concentrations by the manufacturer before the experiment. Air was sampled in each isolated room at the air inlet and outlet to calculate a gradient. Air samples were extracted from the experimental rooms into the analyser through 3-mm PTFE (Teflon®) sampling lines that were protected with dust filters, insulated and heated to avoid water condensation. The analyser sampled the air and measured gas concentrations at 2-min intervals (1 min for measurement, 1 min for flushing sampling tubes and measurement chamber). Each location (inlet and outlet of each room) was successively analysed for 15 min, the first two measurements being excluded to address potential pollution from one location to the next.
Air was extracted continuously by the extraction duct at a constant rate which did not fluctuate as a function of ambient temperature. The flow rate (Q, in m3/h per cow) in each experimental room was determined over 1 week at the end of the experiment (not performed during gas concentration measurements because it required another INNOVA analyser with the suitable configuration in terms of filters) using the tracer ratio method (SF6) and the constant dosing approach (Baptista et al., Reference Baptista, Bailey, Randall and Meneses1999). Flow rate was calculated as a function of time (t) from the rate of tracer release (ϕT) in m3/h and the indoor tracer concentration (CT inside) in mg/m3 after correcting for the background concentration of the tracer (CT outside) (Demmers et al., Reference Demmers, Phillips, Short, Burgess, Hoxey and Wathes2001):
 $$Q\left( t \right) = \left( {\phi T\left( t \right)} \right)/\left( {{\rm{CT}}\,{\rm{inside}}\,\left( t \right) -{\rm{CT}}\,{\rm{outside}}\left( t \right)} \right).$$
Ventilation rate was 702 ± 65 m3/h per cow for the room with the SM treatment and 763 ± 80 m3/h per cow for the room with the LM treatment.
Flow rates and gas concentrations were expressed as mean values per hour. Gas emissions were calculated by multiplying the ventilation rate (m3/h per cow) by gas concentration gradients (corrected from the basal concentrations in the room without animals, in mg/m3) and were expressed as cumulative gas emissions per cow per day (including for the 3 days without cows at the end of the sub-period in the SM treatment). Emissions were expressed as CH4-C, NH3-N and N2O-N and were validated based on element mass balances (Hassouna and Eglin, Reference Hassouna and Eglin2016).
Emission estimates from national inventory guidelines
NH3-N emissions were estimated for each treatment based on a default value of TAN excretion or a calculated value (from N balance) and emission factors at the barn level (European Environment Agency, 2016). Enteric CH4 emissions were estimated from gross energy intake, the CH4 conversion factor and the energy content of CH4 (IPCC, 2006). In SM, CH4 emissions from manure were added based on measured feed digestibility and assuming storage of deep cattle litter for <1 month in temperate conditions. In LMfree, as the removal of liquid manure from the room twice a day would have resulted in negligible CH4-C emissions, the latter were not considered. N2O-N emissions were estimated from N excretion per head, the fraction of TAN excretion captured in the manure management system, and the relative EF for direct N2O emissions (IPCC, 2006).
Statistical analyses
In the LMtied treatment, variables related to the N balance were recorded at the individual level and averaged over the 4 days of urine and faeces collection: N intake; N excreted in milk, faeces and urine; retained and unaccounted N; urea-N content in urine, urea-N excreted in urine and N efficiency (N in milk divided by N intake). During period 2, two cows unexpectedly dried off (one per group). Only one was involved in measurements for LMtied. Considering this cow in the N balance calculation could lead to biased interpretation as no more N is exported in milk for this dried cow. All N ingested was therefore excreted in urine and faeces, modifying the repartition of N excretion. To ensure a consistent N balance at the individual level, measurements for this cow were removed from the dataset for all of period 2. The influence of dietary treatment (LowN v. HighN) was assessed by the following linear model (SAS, 2013; PROC MIXED):
 $${Y_{ijk}} = \mu + {\rm{Ncon}}{{\rm{c}}_i} + {\rm{Perio}}{{\rm{d}}_j} + {\rm{Co}}{{\rm{w}}_k} + {e_{ijk}}$$
where Yijk is the variable studied; μ is the mean; Nconci is the dietary CP concentration (1 df); Periodj is the period of 8 weeks (1 df); Cowk is a random factor; and eijk is the error associated with each Yijk.
In the SM and LMfree treatments, only week 4 of the sub-period was considered for analysis. Milk yield, water intake, DM intake and daily gas emissions (CH4-C, NH3-N, N2O-N) were compared at the group level between the two dietary treatments (LowN v. HighN), the two manure management systems (liquid v. solid) and their interaction. To capture dynamics of gas emissions that are known to be variable between days, daily measurements were used instead of weekly averages. To address temporal correlation among daily measurements of the same groups of cows, linear models for repeated measurements were created using the statistical model (SAS, 2013; PROC MIXED):
 $$\matrix{{{Y_{ijklm}}} \hfill & = \hfill & {\mu + {\rm{Ncon}}{{\rm{c}}_i} + {\rm{Manure}}{\mkern 1mu} {\rm{Typ}}{{\rm{e}}_j} + {\rm{Nconc}}} \hfill \cr \hfill & {} \hfill & { \times {\rm{Manure}}{\mkern 1mu} {\rm{Typ}}{{\rm{e}}_k} + {\rm{Perio}}{{\rm{d}}_l} + {\rm{Day}}{\mkern 1mu} {{\left( {{\rm{Period}}} \right)}_{m\left( l \right)}}} \hfill \cr{} \hfill & {} \hfill & { + {e_{ijklm}}} \hfill \cr} $$
where Yijklm is the variable studied; μ is the mean; Nconci is the dietary CP concentration (1 df); ManureTypej is the manure form (liquid or solid, 1 df); Nconc × ManureTypek is the interaction of the two factors (1 df); Periodl is the period of 8 weeks (1 df); Day (Period)m (l ) is the day of measurement within the period (12 df); and eijklm is the error associated with each Yijklm. The REPEATED statement was added to the SAS procedure (Day (Period)/sub = Group, compound symmetry). The two cows that unexpectedly dried off in period 2 could not be removed from the dataset because they continued to ingest feed and emit gases in the rooms. This can lead to biased intake and emissions results at the group level; however, as both groups were concerned, all treatments were considered to be similarly affected.
In the SM treatment, gas emissions and litter temperature at a 10-cm depth were averaged per week and analysed to determine the influence of dietary treatment (LowN v. HighN), the weeks (1 to 4) and their interaction using the statistical model (SAS, 2013; PROC MIXED):
 $${Y_{ijkl}} = \mu + {\rm{Ncon}}{{\rm{c}}_i} + {\rm{Wee}}{{\rm{k}}_j} + {\rm{Nconc}} \times {\rm{Wee}}{{\rm{k}}_k} + {\rm{Grou}}{{\rm{p}}_l} + {e_{ijkl}}$$
where Yijkl is the variable studied; μ is the mean; Nconci is the dietary CP concentration (1 df); Weekj is the week of measurement for each sub-period (3 df); Nconc × Weekk is the interaction of the two factors (3 df); Groupl is the group of cows (1 df); and eijkl is the error associated with each Yijkl. The Period effect was unfortunately confounded with the group of cows and consequently not included in the model. The REPEATED statement was added to the SAS procedure to consider temporal correlation between weeks of the same group of cows’ intra-diet treatment (Week/sub = Group(Nconc), compound symmetry).
Regardless of the model, the Room effect could not be considered because it was confounded with the ManureType treatment. The Room effect gathered potential bias from its ventilation system or its orientation to the sun. However, ventilation rates used for emission calculations were assessed for each room individually, and climate conditions were controlled in both rooms by the air conditioner system. Consequences are therefore likely to be very negligible for emission measurements.
Results
Influence of N supply on N balance and excretion
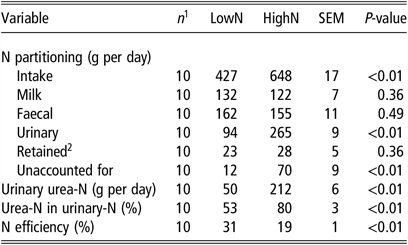
On the HighN diet, N intake increased by 50% (P<0.01), N in milk and N in faeces did not differ significantly (P=0.36 and 0.49, respectively), but N in urine was almost three times as high (P<0.01; Table 2) as that in the LowN diet. Consequently, cows on the LowN diet had significantly higher N efficiency (+12 percentage-units; P<0.01). The amount of N the animals retained was similar for both diets (23 to 28 g N per cow per day; Table 2). More N was unaccounted for on the HighN diet than on the LowN diet (70 v. 12 g N per cow per day; P<0.01). Urinary urea-N was four times as high on the HighN diet (P<0.01), with urea-N representing 80% of urinary N on the HighN diet, compared to 53% on the LowN diet (P<0.01).
Nitrogen partitioning as a function of dietary N supply (LowN, 120 g CP/kg DM; HighN, 180 g CP/kg DM) offered to dairy cows

1 Average of the 4 days of N-balance measurements: five cows (experimental units) × two dietary treatments.
2 Based on the animals’ energy balance (calculated from UFL intake, mean bodyweight and fat-corrected milk yields as described by INRA, 2007), using 6 g N retained per UFL (Faverdin and Vérité, Reference Faverdin and Vérité1998). UFL, amount of net energy for milk production contained in 1 kg of a reference barley (87% DM, 2 700 kcal of metabolizable energy; INRA, 2007).
Interaction between N supply and manure management
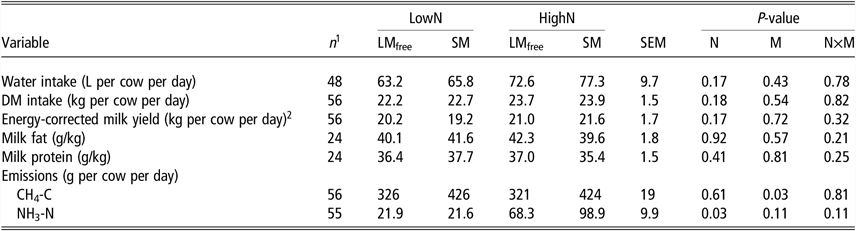
N supply and manure management did not influence the performance parameters, either alone or in interaction. For emissions, manure management influenced only CH4-C (P=0.03), which were 30% higher in SM than in LMfree. In contrast, N supply influenced NH3-N emissions (P=0.03), which increased considerably on the HighN diet. Although the interaction between N supply and manure management was not significant (P=0.11; Table 3), the HighN diet resulted in NH3-N emissions three and four times as high in the LMfree and SM treatment, respectively, compared with LowN, reaching 100 gNH3-N per cow per day in the latter (Table 3). N2O-N emissions were nearly 0 in almost all situations and therefore close to the INNOVA detection limit (results not shown).
Performance and gas emissions of groups of dairy cows as a function of dietary N supply (LowN, 120 g CP/kg DM; HighN, 180 g CP/kg DM) and the manure management system for week 4 of each sub-period

LMfree, liquid manure, free-stall barn with cubicles; SM, solid manure, straw-based deep litter; N, effect of dietary N supply (LowN v. HighN); M, effect of manure management system (LMfree v. SM); N×M, effect of their interaction.
1 Daily measurements: two groups of cows (experimental unit) × four sub-periods × 7 days (2 days for milk fat and protein); some values can be missing.
2 Energy-corrected milk yield = milk yield (kg per cow per day) × (0.4 + (0.015 × milk fat (g/kg))) (INRA, 2007).
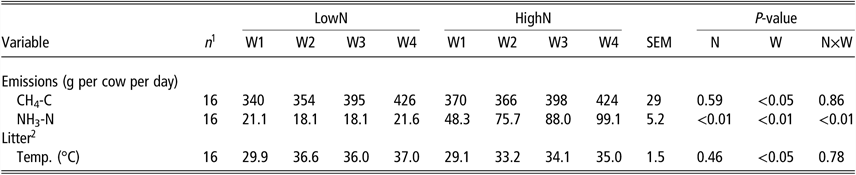
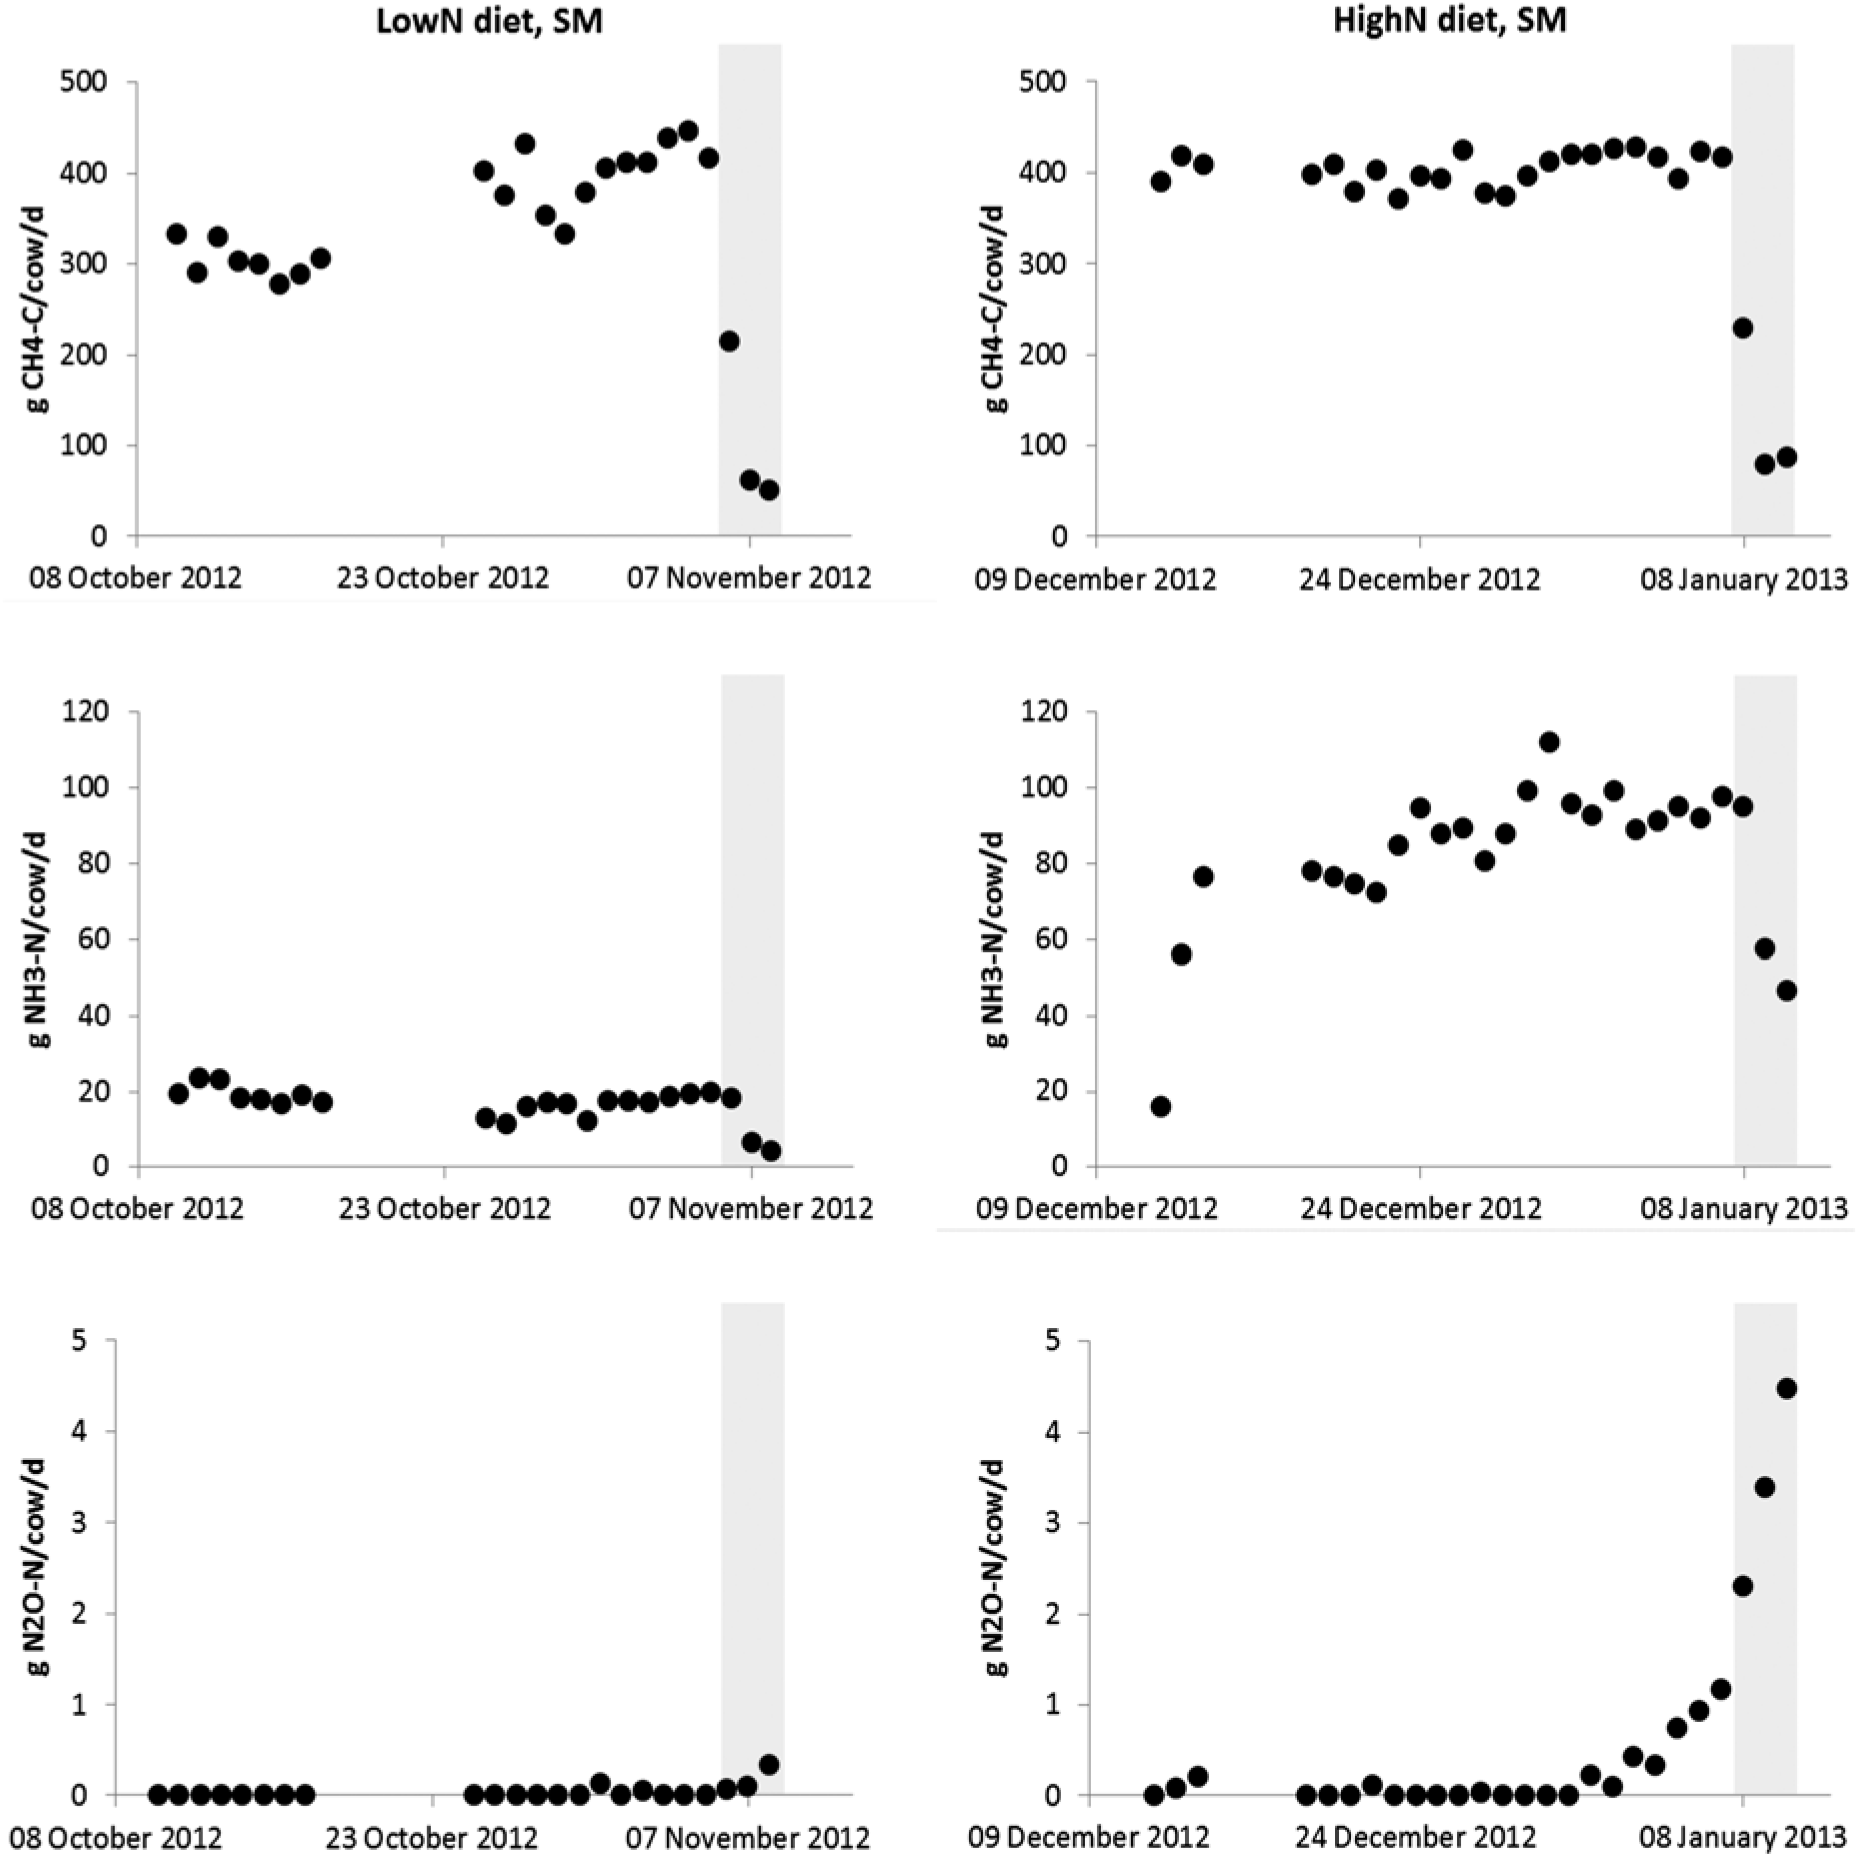
In the SM treatment, CH4-C and NH3-N emissions increased every week due to litter accumulation under the animals (P<0.05 and <0.01; Table 4). For NH3-N, however, this increase was observed only on the HighN diet (48 to 99 g NH3-N per cow per day; P<0.01), while emissions remained low on the LowN diet (<22 g NH3-N per cow per day). Deep litter temperature at a 10-cm depth increased over time, regardless of the diet (P<0.05). For CH4-C and NH3-N, daily emissions decreased rapidly after the cows left the room (Figure 2). Conversely, N2O-N emissions in the SM treatment started to increase in the final days of the sub-period and increased even more after the cows left the room (Figure 2). This occurred mainly on the HighN diet, with N2O-N emissions reaching 1.2 g N2O-N per cow per day at the end of week 4 and 4.5 g N2O-N per cow per day 3 days after the cows left the room and the litter was left alone.
Gas emissions and litter temperature dynamics in the solid manure management system as a function of dietary N supply (LowN, 120 g CP/kg DM; HighN, 180 g CP/kg DM) offered to dairy cows and the week of measurement (W1–W4)

N, effect of dietary N supply; W, effect of the week of measurement; N×W, effect of their interaction.
1 Average per week: two groups of cows (experimental unit) × two dietary treatments × 4 weeks.
2 Litter temperatures measured at a 10-cm depth, mean values of 18 measurements per week (six zones × three replicates).
Time-dependent gas emission of CH4-C, NH3-N and N2O-N in the SM treatment offered to dairy cows during sub-period 2 of period 1 (LowN diet, left) and period 2 (HighN diet, right). Gaps indicate days without measurement due to equipment failure. Grey bars represent the 3 days at the end of the sub-periods when the litter was left alone in the room, without cows. SM=solid manure.

Gas emission estimates based on national inventory guidelines
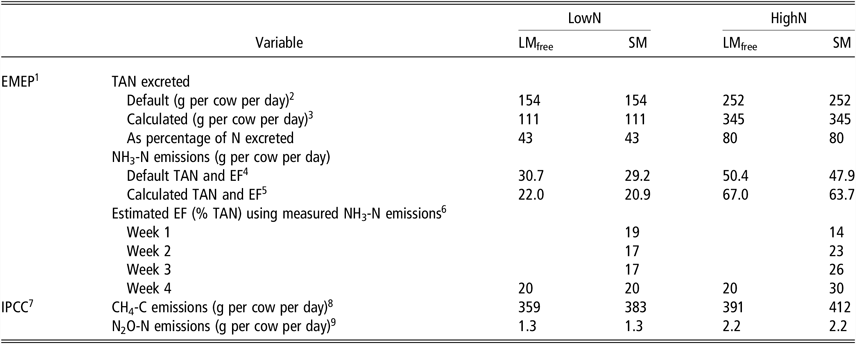
Using the standard calculation from EMEP/EEA, estimated NH3-N emissions were 30 and 50 g per cow per day on the LowN and HighN diets, respectively, regardless of the manure management (Table 5). Using the calculated TAN excretion instead of a default value, NH3-N was 22 g per cow per day on the LowN diet but increased to nearly 70 g per cow per day on the HighN diet. Measured NH3-N emissions in LMfree (Tables 3 and 4) represented 20% of the calculated TAN excretion, regardless of the diet. In SM, measured NH3-N emissions from weeks 1 to 4 of litter accumulation represented 17% to 20% of the calculated TAN excretion on the LowN diet and 14% to 30% on the HighN diet (Table 5). CH4-C emissions from IPCC (enteric for LM; enteric + manure for SM) varied between 360 and 410 g per cow per day. Finally, estimations of N2O-N emissions were close to 1 to 2 g per cow per day regardless of the manure management (Table 5).
Estimated total ammonia nitrogen (TAN) excretion and NH3-N, CH4-C and N2O-N emissions using the EMEP/EEA and IPCC Tier 2 methods as a function of dietary N supply (LowN, 120 g CP/kg DM; HighN, 180 g CP/kg DM) and the manure management system offered to dairy cows LMfree, liquid manure, free-stall barn with cubicles; SM, solid manure, straw-based deep litter.

1 EMEP/EEA Tier 2 method (European Environment Agency, 2016).
2 60% of N excreted (N in urine + N in faeces, from Table 1).
3 Equals N ingested – (milk N + faecal N + retained N); see Table 1.
4 Using TAN = 60% of N excreted and the emission factors EFhousing = 20% TAN for liquid manure and 19% TAN for solid manure (Table 3.9 of the EMEP/EEA Tier 2 method).
5 Using the estimated TAN from the calculation (N ingested – (milk N + faecal N + retained N)) and the emission factors EFhousing = 20% TAN for liquid manure and 19% TAN for solid manure (Table 3.9 of the EMEP/EEA Tier 2 method).
6 Measured NH3-N emissions from Tables 2 and 3 expressed as a percentage of TAN estimated from the calculation (N ingested – (milk N + faecal N + retained N)).
7 IPCC Tier 2 method (IPCC, 2006).
8 Based on enteric CH4 (equation 10.21), manure CH4 (equations 10.23 and 10.24) added for SM only.
9 Direct N2O emissions (equation 10.25).
Discussion
Manure management had more influence on methane emissions
Manure management influenced CH4 emissions, which were 30% higher (+100 g CH4-C per cow per day) in the SM treatment than in the LMfree treatment in week 4. CH4 emissions from deep litter systems are mainly the result of fermentation processes. CH4 is formed under warm anaerobic conditions, induced by compaction of the litter, when degradable C is available (Amon et al., Reference Amon, Amon, Boxberger and Alt2001). CH4-C emissions increased over time but decreased rapidly after the animals left the rooms, down to a level close to the difference between the SM and LMfree treatments (100 g CH4-C per cow per day), that is, emissions from the litter itself.
At the room level (animals and manure), dietary N supply did not influence CH4 emissions. Forage intake and digestibility did not vary between diets (digestible DM: 716 and 724 g/kg DM for LowN and HighN, respectively; SEM = 29 g/kg DM; P>0.05) leading to quite similar levels of enteric methane emissions (Table 5). When expressed in relation to intake, CH4 emissions from LMfree (i.e. enteric methane) were 19.6 and 18.1 g CH4/kgDMI, respectively, in the range of common observations (Hristov et al., Reference Hristov, Ott, Tricarico, Rotz, Waghorn, Adesogan, Dijkstra, Montes, Oh, Kebreab, Oosting, Gerber, Henderson, Makkar and Firkins2013).
Nitrogen-based gas emissions influenced by an interaction between nitrogen supply and manure management
Nitrogen balance and N efficiency measurements are consistent with the literature (Castillo et al., Reference Castillo, Kebreab, Beever and France2000; Cantalapiedra-Hijar et al., Reference Cantalapiedra-Hijar, Peyraud, Lemosquet, Molina-Alcaide, Boudra, Noziere and Ortigues-Marty2014; Edouard et al., Reference Edouard, Hassouna, Robin and Faverdin2016). The HighN diet resulted in excretions of urea-N in urine and TAN three times as high as those in the LowN diet. The HighN diet also led to more N unaccounted for. These deficits in the balance might be related to substantial TAN losses during manure recovery and/or unaccounted-for sources of excretion, which might be enhanced as the dietary N availability increases (Spanghero and Kowalski, Reference Spanghero and Kowalski1997). Accordingly, NH3-N emissions on the HighN diet were 3.0 and 4.5 times as high as those on the LowN diet in LMfree and SM, respectively. This large difference is partly because emissions were observed in week 4 of each sub-period, when NH3 emissions were at their maximum in SM. These results are consistent with those of studies that estimated NH3 volatilization from manure following similar dietary manipulations under laboratory conditions (Frank and Swensson, Reference Frank and Swensson2002; Burgos et al., Reference Burgos, Embertson, Zhao, Mitloehner, DePeters and Fadel2010) or at the barn level using modelling (Monteny et al., Reference Monteny, Smits, Van Duinkerken, Mollenhorst and de Boer2002) or in situ measurements (Powell et al., Reference Powell, Broderick and Misselbrook2008). Decreasing the CP content of the diet by modulating the protein balance in the rumen [expressed by the ratio (PDIN – PDIE)/UFL; Table 1] is an effective way to reduce NH3 emissions, as previously discussed by Edouard et al. (Reference Edouard, Hassouna, Robin and Faverdin2016).
In the literature, conflicting results are reported, as solid manure is described to emit less NH3-N than liquid manure at the barn level (Gac et al., Reference Gac, Béline, Bioteau and Maguet2007; Schrade and Keck, Reference Schrade and Keck2011), or more (Webb et al., Reference Webb, Sommer, Kupper, Groenestein, Hutchings, Eurich-Menden, Rodhe, Misselbrook, Amon and Lichtfouse2012). All of these reviews, however, report large intra- and inter- variability in emission measurements due to contrasting environmental conditions, diets, methodological approaches and manure management practices (type and amount of litter, area and depth of the litter bed, removal frequency, frequency of adding fresh litter, etc.). Using the same methodological approach as in the present study, we previously showed that mean daily NH3-N emissions at the dairy barn level were 25% higher in a straw deep litter system (accumulated over 6 weeks) than in a tying stall under similar conditions (same experimental rooms, 140 g/kg CP in the diet; Edouard et al., Reference Edouard, Charpiot, Hassouna, Faverdin, Robin, Dollé, Hassouna and Guingand2012).
The originality of the present study was to test the interaction between the dietary N supply and manure management: NH3-N was higher in the SM treatment when cows were offered the HighN diet, that is, when N and TAN excretions increased. This was most likely due to the substantial accumulation of N, especially urea-N, in the litter and the resulting chemical processes. Urease activity is related to temperature: higher temperatures result in more gaseous NH3 (Monteny and Erisman, Reference Monteny and Erisman1998; Webb et al., Reference Webb, Sommer, Kupper, Groenestein, Hutchings, Eurich-Menden, Rodhe, Misselbrook, Amon and Lichtfouse2012). The NH3-N emission dynamics observed were consistent with the litter temperature dynamics. These dynamics were not observed in the SM–LowN treatment combination because the solid manure contained little urea-N. When the cows left the rooms (no new N from fresh urine and faeces), emissions from the solid manure decreased rapidly to a level similar to those of manure storage conditions (around 50 gNH3-N per cow per day, i.e., 150 mgNH3-N/h/m2; Külling et al., Reference Külling, Menzi, Sutter, Lischer and Kreuzer2003; Mosquera et al., Reference Mosquera, Hol and Monteny2006; Aguerre et al., Reference Aguerre, Wattiaux and Powell2012).
Conversely, N2O-N emissions remained nearly 0 for all treatments; they started to increase only in week 4 in the SM–HighN treatment combination and continued to do so after the cows left the rooms. N2O emissions are linked to incomplete nitrification and denitrification processes associated with oxic and anoxic conditions, respectively. In animal houses that do not use bedding materials, faeces and urine on the floor remain mainly in an aerobic state and are frequently removed from the building. As a result, these systems are likely to emit little or no N2O, whereas N2O emissions from deep litter systems are slightly higher (though remaining <2 g N2O-N per cow per day; Webb et al., Reference Webb, Sommer, Kupper, Groenestein, Hutchings, Eurich-Menden, Rodhe, Misselbrook, Amon and Lichtfouse2012). In the SM–HighN treatment combination, compaction by animals and increased moisture of the litter (due to more urine) might have generated partially anoxic conditions that encouraged denitrification and stimulated N2O emissions (Aguerre et al., Reference Aguerre, Wattiaux and Powell2012; Petersen et al., Reference Petersen, Blanchard, Chadwick, Del Prado, Edouard, Mosquera and Sommer2013). These emission dynamics (increase in N2O emissions after 3 to 4 weeks) are typical of storage conditions (Külling et al., Reference Külling, Menzi, Sutter, Lischer and Kreuzer2003; Aguerre et al., Reference Aguerre, Wattiaux and Powell2012).
Estimates from national inventory guidelines only partly consistent with measurements
The calculated TAN represented 43% and 80% of N excreted in manure for the LowN and HighN diets, respectively, compared to the default value of 60% use in the EMEP/EEA methodology. This suggests that the recommended value of TAN excretion would be more accurate if determined as a function of dietary CP content, leading to more specific NH3 emissions. The calculated TAN based on measured excretion and the EMEP/EEA EFs resulted in estimates of NH3-N emission similar to those measured, especially for liquid manure. Conversely, estimated NH3 emissions differed greatly from those measured for the SM–HighN treatment combination, suggesting the need to consider emission dynamics related to solid manure management as well when TAN excretion is high.
When compared to measurements in the LMfree treatment, enteric CH4 emissions estimated with the IPCC method were 10% to 20% higher. Nonetheless, given uncertainties in both the measurements and estimates, a difference of ±20% can be considered satisfactory. Conversely, CH4 emissions from the litter (assuming that they equalled the difference between SM and LMfree CH4 emissions) were three times as high as the IPCC estimate (100 v. 30 g CH4-C per cow per day). Selecting the relevant EF seems critical, because using the EF related to storing deep bedding for >1 month (instead of <1 month) in temperate conditions would have resulted in predicted emissions >600 g CH4-C per cow per day in the SM treatment, that is, 50% higher.
For N2O emissions, IPCC estimates were very low (<2 g N2O-N per cow per day), in agreement with the measurements at the barn level. N2O emissions could however be a larger issue when deep litter accumulates under the animals for a longer period (increasing emissions in week 4), which the IPCC method might not sufficiently consider.
Conclusions
When combined with a low-N diet, NH3 emissions from deep litter systems could be maintained at a low level. Conversely, high levels of N in the diet increased NH3 emissions, which should encourage farmers to be cautious, especially in the case of housing systems that produce solid manure. Moreover, the longer the litter accumulates, the higher gas emissions may be. Comparing measured emissions to those estimated with EMEP/EEA and IPCC guidelines shows that these methods accurately estimate gas emissions under certain conditions but not with diets high in CP or deep litter manure systems. These calculations would in particular require to better take into consideration the variability in TAN excretion, which is the primary factor that influences NH3 emissions, and the emission dynamics of solid manure. More specific emission factors would finally help estimations at farm level and national inventories to gain precision.
Acknowledgements
This study was supported by ADEME (CORTEA programme, contract no. 1160C0041) and the French Ministry of Agriculture, Agro-Food and Forestry (RFI CASDAR project no. 1122). We are also grateful to the staff from the INRA unit PEGASE, both at the experimental dairy farm and the laboratory. Finally, many thanks go to Luc Delaby for his valuable advice on statistics.
N. Edouard, 0000-0002-6158-0956
Declaration of interest
None.
Ethics statement
This work complies with the national legislation applicable at the time of the experiment.
Software and data repository resources
None of the data were deposited in an official repository.
Supplementary material
To view supplementary material for this article, please visit https://doi.org/10.1017/S1751731119001368.