1 Introduction
Statistical descriptions are appropriate for turbulent flows. In nature such flows are rarely homogeneous and isotropic; instead they typically exhibit rich correlations that reflect the presence of coherent structures, with statistics that evolve only slowly in time, or not at all. The large range of spatial and temporal scales spanned by turbulent flows often makes their direct numerical simulation (DNS) computationally prohibitive (Bauer, Thorpe & Brunet Reference Bauer, Thorpe and Brunet2015; Tobias Reference Tobias2019). Fifty years ago Lorenz pointed to an alternative approach that ‘consists of deriving a new system of equations whose unknowns are the statistics themselves’ (Lorenz Reference Lorenz1967). Such direct statistical simulation (DSS) has seen, in recent years, a number of successful applications (Farrell & Ioannou Reference Farrell and Ioannou2007; Marston, Conover & Schneider Reference Marston, Conover and Schneider2008; Marston Reference Marston2010; Tobias, Dagon & Marston Reference Tobias, Dagon and Marston2011; Marston Reference Marston2012; Tobias & Marston Reference Tobias and Marston2013; Constantinou, Farrell & Ioannou Reference Constantinou, Farrell and Ioannou2014; Laurie et al. Reference Laurie, Boffetta, Falkovich, Kolokolov and Lebedev2014; Marston, Qi & Tobias Reference Marston, Qi and Tobias2019).
Many well-established approaches can be considered instances of DSS. For example, the probability distribution function can be obtained from the Fokker–Planck equation by numerical methods, but this is limited to dynamical systems of at most a few dimensions (Bergman & Spencer Jr Reference Bergman and Spencer1992; Naess & Hegstad Reference Naess and Hegstad1994; von Wagner & Wedig Reference von Wagner and Wedig2000; Kumar & Narayanan Reference Kumar and Narayanan2006; Pichler, Masud & Bergman Reference Pichler, Masud and Bergman2013; Allawala & Marston Reference Allawala and Marston2016). Another form of DSS, large deviation theory (Varadhan Reference Varadhan1966; Bouchet & Simonnet Reference Bouchet and Simonnet2009; Laurie & Bouchet Reference Laurie and Bouchet2015; Bouchet, Marston & Tangarife Reference Bouchet, Marston and Tangarife2018), focuses on extreme or rare events. Other methods such as those developed by Kolmogorov (Batchelor Reference Batchelor1947), Kraichnan (Frisch Reference Frisch1995) and others (Holloway & Hendershott Reference Holloway and Hendershott1977; Legras Reference Legras1980; Huang, Galperin & Sukoriansky Reference Huang, Galperin and Sukoriansky2001) provide an approximate description of some statistical properties of turbulent flows but assume homogeneity and usually isotropy. Many flows in geophysics and astrophysics spontaneously develop features such as coherent vortices and zonal banding (Marston et al. Reference Marston, Qi and Tobias2019; Skitka, Marston & Fox-Kemper Reference Skitka, Marston and Fox-Kemper2020). Furthermore, in engineering applications turbulence often interacts with non-trivial mean flows (see e.g. Barkley Reference Barkley2016). Therefore, any statistical method that can appropriately treat such systems needs to respect such asymmetries. One such scheme of DSS that meets these requirements is that of low-order expansions in equal-time (but spatially non-local) cumulants. Since low-order statistics are spatially smoother than the corresponding dynamical fields (or instantaneous flow), such an approach can capture the macroscopic features of turbulent flows using fewer degrees of freedom. An added benefit of such a cumulant expansion scheme is that the detailed time evolution of the flow is replaced by a description of the statistics of most interest. The modes associated with the low-order statistics may be described by a fixed point or a slow manifold that can be quickly accessed.
It is important to note that naive implementations of expansions in cumulants may be much more expensive computationally than full DNS because the second cumulant may have higher dimension than the underlying fields (depending on the symmetry of the problem and choice of averaging operation). In this paper we investigate a reduced dimensionality method for DSS, based on a proper orthogonal decomposition (POD) of the eigenvectors of the second moment. This is a form of unsupervised learning (Ghahramani Reference Ghahramani2003), with training based upon full resolution simulations. The equations of motion (EOMs) for the cumulants are rotated into a sub-basis formed by the eigenvectors of the second zonally averaged moment after removal of eigenvectors with small eigenvalues. We implement POD directly on the simplest non-trivial closure, one that goes to second order in an expansion of cumulants (CE2), of two model problems in fluid dynamics.
The rest of the paper is organized as follows. In § 2 we introduce the two different types of cumulant expansions. Although CE2 is often performed using a zonal average (Marston et al. Reference Marston, Conover and Schneider2008, Reference Marston, Qi and Tobias2019) (§ 2.1), this has the drawback that scattering of eddies off non-zonal coherent structures such as vortices is neglected (Tobias & Marston Reference Tobias and Marston2017). We therefore also explore a variant of CE2 that is based upon an ensemble average (Bakas & Ioannou Reference Bakas and Ioannou2011, Reference Bakas and Ioannou2013, Reference Bakas and Ioannou2014; Allawala & Marston Reference Allawala and Marston2016) (§ 2.2). Although more accurate, ensemble-averaged cumulants have higher dimensionality compared with those based upon the zonal average; this is partly overcome with our POD method as discussed in § 3. In § 4 both types of CE2 are evaluated against DNS which serves as the reference truth. We test the approaches on two different highly idealized barotropic models of planetary atmospheres on a spherical geodesic grid: a deterministic point jet relaxed towards an unstable profile (§ 4.1) and a stochastically forced jet (§ 4.2). The order-of-magnitude computational savings of DSS in a reduced basis with little loss to accuracy promise a fast and accurate alternative to accessing directly the low-order statistics of turbulent flows, and offer the possibility that flow regimes inaccessible to DNS will come within reach. This speed-up is illustrated by a continuation in parameter space, keeping the POD basis fixed, in § 5. Section 6 concludes with some discussion.
2 Cumulant expansions
We carry out a non-equilibrium statistical closure of the low-order equal-time statistics of the flow (Marston et al. Reference Marston, Conover and Schneider2008, Reference Marston, Qi and Tobias2019). The approach can be more easily understood by application to a simple toy model. We do so here by considering a barotropic (two-dimensional) fluid on a rotating sphere of unit radius, where relative vorticity evolves under the action of a bilinear Jacobian operator,  $J[A,B]=\hat{r}\boldsymbol{\cdot }(\unicode[STIX]{x1D735}A\times \unicode[STIX]{x1D735}B)$, a linear operator that contains frictional and hyperviscous terms
 $L[A]\equiv -[\unicode[STIX]{x1D705}-\unicode[STIX]{x1D708}_{3}(\unicode[STIX]{x1D6FB}^{2}+2)\unicode[STIX]{x1D6FB}^{4}]A$, and either a deterministic forcing term
 $F$, stochastic forcing
 $\unicode[STIX]{x1D702}$, or both. The EOM of the barotropic model is then given by
 $$\begin{eqnarray}\dot{\unicode[STIX]{x1D701}}=J[\unicode[STIX]{x1D701}+f,\unicode[STIX]{x1D713}]+L[\unicode[STIX]{x1D701}]+F+\unicode[STIX]{x1D702},\end{eqnarray}$$
where  $\unicode[STIX]{x1D713}$ is the stream function,
 $\unicode[STIX]{x1D701}=\unicode[STIX]{x1D6FB}^{2}\unicode[STIX]{x1D713}$ is the relative vorticity,
 $f=2\unicode[STIX]{x1D6FA}\cos (\unicode[STIX]{x1D703})$ is the Coriolis parameter,
 $\unicode[STIX]{x1D703}$ is the co-latitude and
 $\unicode[STIX]{x1D719}$ is the azimuth angle. We set
 $\unicode[STIX]{x1D6FA}=2\unicode[STIX]{x03C0}$ and thus the unit of time is the period of rotation, a day.
The cumulant expansion may then be implemented by Reynolds-decomposing the relative vorticity into the sum of an average vorticity field  $\overline{\unicode[STIX]{x1D701}}$ and a fluctuation about that average
 $\unicode[STIX]{x1D701}^{\prime }$ so that
 $\unicode[STIX]{x1D701}(\unicode[STIX]{x1D703},\unicode[STIX]{x1D719})=\overline{\unicode[STIX]{x1D701}}(\unicode[STIX]{x1D703},\unicode[STIX]{x1D719})+\unicode[STIX]{x1D701}^{\prime }(\unicode[STIX]{x1D703},\unicode[STIX]{x1D719})$. The choice of this averaging operation will be postponed until later, but it will be required to satisfy the Reynolds-averaging rules:
 $$\begin{eqnarray}\overline{\unicode[STIX]{x1D701}^{\prime }(\unicode[STIX]{x1D703},\unicode[STIX]{x1D719})}=0,\quad \overline{\overline{\unicode[STIX]{x1D701}(\unicode[STIX]{x1D703},\unicode[STIX]{x1D719})}}=\overline{\unicode[STIX]{x1D701}(\unicode[STIX]{x1D703},\unicode[STIX]{x1D719})},\quad \overline{\overline{\unicode[STIX]{x1D701}}\unicode[STIX]{x1D701}}=\overline{\unicode[STIX]{x1D701}}\,\overline{\unicode[STIX]{x1D701}}.\end{eqnarray}$$
The first three cumulants are centred moments, and on the surface of a sphere the first two read
 $$\begin{eqnarray}\left.\begin{array}{@{}c@{}}c(\unicode[STIX]{x1D703}_{1},\unicode[STIX]{x1D719}_{1})\equiv \overline{\unicode[STIX]{x1D701}(\unicode[STIX]{x1D703}_{1},\unicode[STIX]{x1D719}_{1})},\\ c(\unicode[STIX]{x1D703}_{1},\unicode[STIX]{x1D719}_{1};\unicode[STIX]{x1D703}_{2},\unicode[STIX]{x1D719}_{2})\equiv \overline{\unicode[STIX]{x1D701}^{\prime }(\unicode[STIX]{x1D703}_{1},\unicode[STIX]{x1D719}_{1})\unicode[STIX]{x1D701}^{\prime }(\unicode[STIX]{x1D703}_{2},\unicode[STIX]{x1D719}_{2})}.\end{array}\right\}\end{eqnarray}$$
Since the Jacobian couples the relative vorticity and the stream function, it is useful to define their correlations as auxiliary cumulants:
 $$\begin{eqnarray}\left.\begin{array}{@{}c@{}}p(\unicode[STIX]{x1D703}_{1},\unicode[STIX]{x1D719}_{1})\equiv \overline{\unicode[STIX]{x1D713}(\unicode[STIX]{x1D703}_{1},\unicode[STIX]{x1D719}_{1})},\\ p(\unicode[STIX]{x1D703}_{1},\unicode[STIX]{x1D719}_{1};\unicode[STIX]{x1D703}_{2},\unicode[STIX]{x1D719}_{2})\equiv \overline{\unicode[STIX]{x1D701}^{\prime }(\unicode[STIX]{x1D703}_{1},\unicode[STIX]{x1D719}_{1})\unicode[STIX]{x1D713}^{\prime }(\unicode[STIX]{x1D703}_{2},\unicode[STIX]{x1D719}_{2})}.\end{array}\right\}\end{eqnarray}$$
The EOMs of the cumulants are derived by applying the averaging operation to (2.1). Refer to Marston et al. (Reference Marston, Qi and Tobias2019) for a detailed derivation. The first cumulant evolves as
 $$\begin{eqnarray}\displaystyle \frac{\unicode[STIX]{x2202}}{\unicode[STIX]{x2202}t}c(\unicode[STIX]{x1D734}_{1}) & = & \displaystyle \int J_{1}[p(\unicode[STIX]{x1D734}_{1},\unicode[STIX]{x1D734}_{2}),\unicode[STIX]{x1D6FF}(\unicode[STIX]{x1D734}_{1}-\unicode[STIX]{x1D734}_{2})]\,\text{d}\unicode[STIX]{x1D6FA}_{2}\nonumber\\ \displaystyle & & \displaystyle +\,J_{1}[c(\unicode[STIX]{x1D734}_{1})+f(\unicode[STIX]{x1D703}_{1}),p(\unicode[STIX]{x1D734}_{1})]\nonumber\\ \displaystyle & & \displaystyle +\,L_{1}[c(\unicode[STIX]{x1D734}_{1})]+F(\unicode[STIX]{x1D734}_{1}),\end{eqnarray}$$
where the subscript  $1$ on
 $J$ and
 $L$ indicates that these operators act upon the vector coordinate
 $\unicode[STIX]{x1D734}_{1}\equiv (\unicode[STIX]{x1D703}_{1},\unicode[STIX]{x1D719}_{1})$ and
 $\unicode[STIX]{x1D6FF}(\unicode[STIX]{x1D734}_{1}-\unicode[STIX]{x1D734}_{2})$ is the two-dimensional Dirac functional.
As averages of the product of two fields do not generally equal the product of their separate averages, the quadratic nonlinearity leads to the well-known closure problem with the EOM of the first cumulant depending on the second cumulant. Likewise, the EOM for the second cumulant involves the first, second and third cumulant. A closure should be performed at the lowest order possible; this may be achieved by decoupling the third cumulant from the EOM of the second cumulant, known as the CE2 approximation:
 $$\begin{eqnarray}\overline{\unicode[STIX]{x1D701}^{\prime }(\unicode[STIX]{x1D734}_{1})~\unicode[STIX]{x1D701}^{\prime }(\unicode[STIX]{x1D734}_{2})~\unicode[STIX]{x1D713}(\unicode[STIX]{x1D734}_{3})}\simeq c(\unicode[STIX]{x1D734}_{1},\unicode[STIX]{x1D734}_{2})~p(\unicode[STIX]{x1D734}_{3})\quad (\text{CE}2).\end{eqnarray}$$
With this approximation the EOM for the second cumulant closes to give
 $$\begin{eqnarray}\displaystyle \frac{\unicode[STIX]{x2202}}{\unicode[STIX]{x2202}t}c(\unicode[STIX]{x1D734}_{1},\unicode[STIX]{x1D734}_{2}) & = & \displaystyle 2\{\!J_{1}[c(\unicode[STIX]{x1D734}_{1})+f(\unicode[STIX]{x1D703}_{1}),p(\unicode[STIX]{x1D734}_{2},\unicode[STIX]{x1D734}_{1})]\nonumber\\ \displaystyle & & \displaystyle +\,2J_{1}[c(\unicode[STIX]{x1D734}_{1},\unicode[STIX]{x1D734}_{2}),p(\unicode[STIX]{x1D734}_{1})]\nonumber\\ \displaystyle & & \displaystyle +\,L_{1}[c(\unicode[STIX]{x1D734}_{1},\unicode[STIX]{x1D734}_{2})]\!\}+2\unicode[STIX]{x1D6E4}(\unicode[STIX]{x1D734}_{1},\unicode[STIX]{x1D734}_{2}),\end{eqnarray}$$
where the symmetrization operator  $\{\cdots \}$ performs an average over all interchanges of the field points. Here
 $\unicode[STIX]{x1D6E4}(\unicode[STIX]{x1D734}_{1},\unicode[STIX]{x1D734}_{2})$ is the covariance of the Gaussian stochastic forcing
 $\unicode[STIX]{x1D702}(\unicode[STIX]{x1D734},t)$ that is assumed to be
 $\unicode[STIX]{x1D6FF}$-correlated in time. The CE2 approximation neglects interaction between two fluctuations to produce another fluctuation because of the decoupling of the third and higher cumulants (Herring Reference Herring1963; Schoeberl & Lindzen Reference Schoeberl and Lindzen1984). Thus the fluctuation–fluctuation scattering process is neglected, making it formally equivalent to a quasi-linear approximation (Herring Reference Herring1963; O’Gorman & Schneider Reference O’Gorman and Schneider2007). This confers upon the CE2 approximation two attractive properties: conservation up to quadratic order (Legras Reference Legras1980) (angular momentum, energy and enstrophy) in the limit of no forcing or dissipation, and physical realizability (Hänggi & Talkner Reference Hänggi and Talkner1980; Kraichnan Reference Kraichnan1980; Salmon Reference Salmon1998) with a positive-definite second cumulant. These properties ensure numerical stability. Both the DNS and DSS performed here are carried out in a basis of spherical harmonics (see Marston et al. Reference Marston, Qi and Tobias2019) with the spectral decomposition:
 $$\begin{eqnarray}\unicode[STIX]{x1D701}(\unicode[STIX]{x1D703},\unicode[STIX]{x1D719})=\mathop{\sum }_{\ell =1}^{L}\mathop{\sum }_{m}^{|m|\leqslant \min (\ell ,M)}\unicode[STIX]{x1D701}_{\ell m}~Y_{\ell }^{m}(\unicode[STIX]{x1D703},\unicode[STIX]{x1D719}).\end{eqnarray}$$
Spectral cutoffs  $L$ and
 $M$ are specified below. (A program that implements the computations is available on the Apple Mac App Store at https://apps.apple.com/us/app/gcm/id592404494?mt=12.)
2.1 Zonal average
Common choices for the DSS averaging operation,  $\overline{\cdots \,}$, are temporal, spatial and ensemble means. For models with zonal symmetry such as idealized geophysical or astrophysical flows, the zonal spatial average, defined as
 $\overline{q}(\unicode[STIX]{x1D703})\equiv (1/2\unicode[STIX]{x03C0})\int _{0}^{2\unicode[STIX]{x03C0}}q(\unicode[STIX]{x1D703},\unicode[STIX]{x1D719})\,\text{d}\unicode[STIX]{x1D719}$, is often the simplest and most natural. Henceforth
 $\overline{\cdots \,}$ will be used to only denote such a zonal average. Since the fluctuations
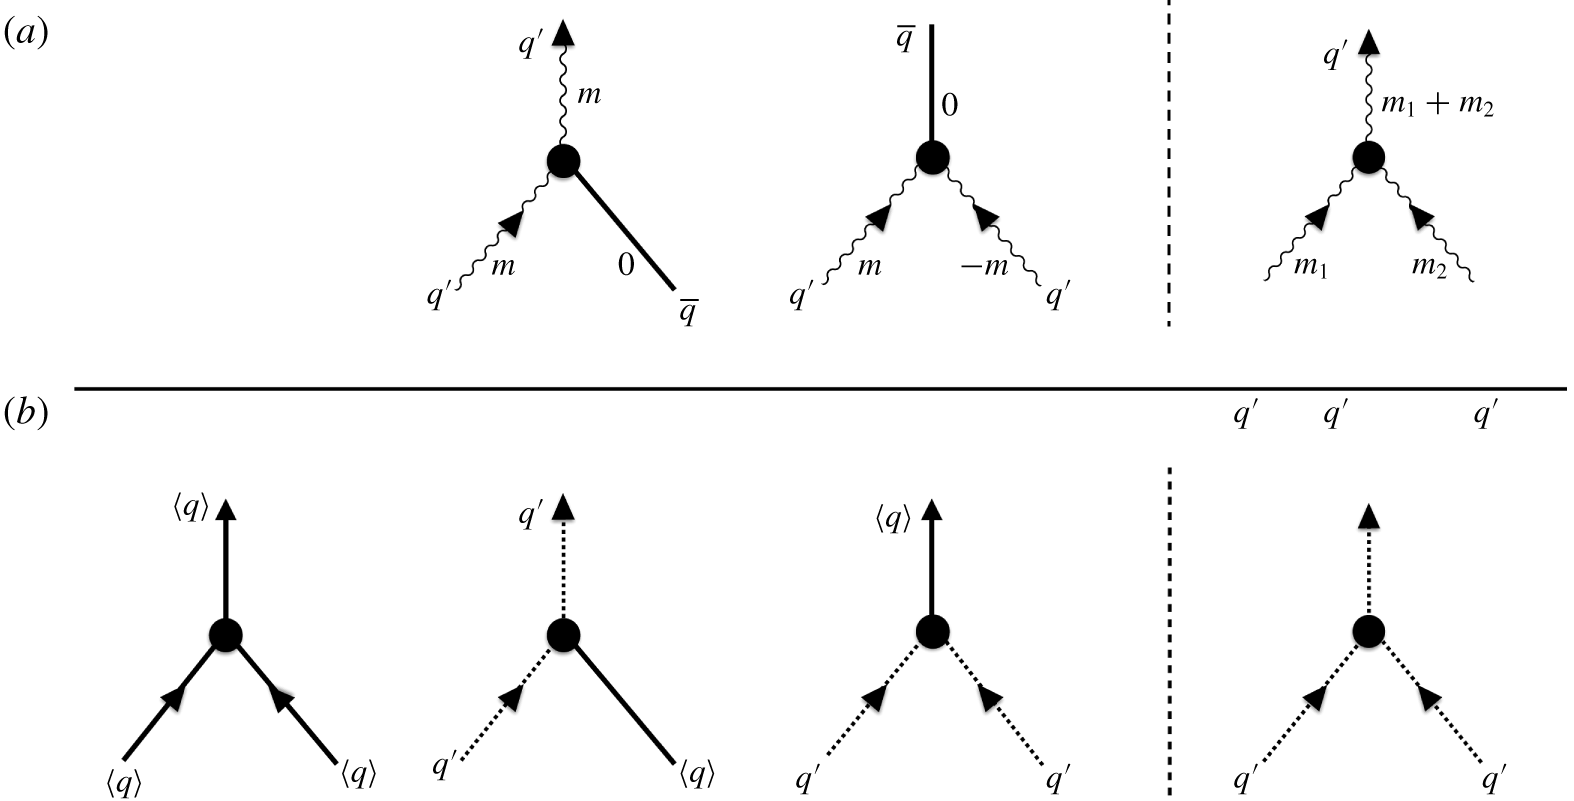
 $q^{\prime }$ with respect to a zonal average now represent eddies that may be classified by zonal wavenumber, zonal CE2 allows for the interaction between a mean flow and an eddy to produce an eddy, and also for the interaction between two eddies to produce a mean flow, as shown in figure 1(a). An important virtue of the zonal average is that it reduces the dimension of each cumulant by one in the zonal direction, reducing computational complexity. The first cumulant depends only on the co-latitude,
 $c(\unicode[STIX]{x1D734}_{1})=c(\unicode[STIX]{x1D703}_{1})$, and the second cumulant depends only on the two co-latitudes of either point and the difference in their longitudes,
 $c(\unicode[STIX]{x1D734}_{1},\unicode[STIX]{x1D734}_{2})=c(\unicode[STIX]{x1D703}_{1},\unicode[STIX]{x1D703}_{2},\unicode[STIX]{x1D719}_{2}-\unicode[STIX]{x1D719}_{1})$. Since
 $c(\unicode[STIX]{x1D734}_{1})$,
 $p(\unicode[STIX]{x1D734}_{1})$ and
 $f(\unicode[STIX]{x1D703}_{1})$ do not vary with longitude, the second term in (2.5) vanishes.
(a) Retained (left) and discarded (right) triadic interactions in zonal CE2. Solid lines denote the amplitude of the zonal mean flow. Wavy lines represent eddies with zonal wavenumber  $m$ that is unchanged by the interaction with the zonal mean flow. (b) Same as (a) but for ensemble CE2. Solid lines indicate the coherent part of the flow and dashed lines represent the incoherent parts. The zonal wavenumber now generally changes when the coherent and/or incoherent components interact.

2.2 Ensemble average
In systems where the eddy–eddy scattering processes dominate, or where non-zonal coherent structures dominate, zonal CE2 can give an inaccurate reproduction of the statistics (Tobias & Marston Reference Tobias and Marston2013). An alternative version of the cumulant expansion that does not entirely neglect these processes can be formulated by replacing the zonal average with an ensemble average, to be denoted in the following with  $\langle \cdots \rangle$. Formally the triadic interactions that are retained in ensemble CE2 are identical to those in zonal CE2 as shown in figure 1(b) except for the addition of a diagram with three mean fields. This addition reflects the fact that, for ensemble averaging, the mean field may contain non-zonal coherent structures (Bakas & Ioannou Reference Bakas and Ioannou2011, Reference Bakas and Ioannou2013, Reference Bakas and Ioannou2014; Allawala & Marston Reference Allawala and Marston2016) instead of only the zonal mean; the fluctuations about this average represent incoherent perturbations, instead of eddies, that may interact. The coherent part of the flow,
 $c(\unicode[STIX]{x1D703},\unicode[STIX]{x1D719})=\langle \unicode[STIX]{x1D701}(\unicode[STIX]{x1D703},\unicode[STIX]{x1D719})\rangle$, may for instance consist of long-lived vortices rather than zonal jets (Tobias & Marston Reference Tobias and Marston2017) in which case departures from the zonal mean do not necessarily constitute a fluctuation, and some of the eddy + eddy
 $\rightarrow$ eddy scattering processes (where eddies are defined as deviations from the zonal mean) are retained. On the other hand, because only the first two cumulants are retained, ensemble-averaged CE2 is equivalent to the requirement that the probability distribution function be purely Gaussian – an approximation known to be poor for some flows such as isotropic and homogeneous turbulence.
It is well known that for ergodic flows, the average over an infinite ensemble of realizations should equal a long-time average (in the limit of the averaging time going to infinity). For such flows one therefore expects that the statistics in ensemble CE2 typically flow to a single fixed point – this would be guaranteed if there were no closure approximation – and those for zonal CE2 to match this behaviour. However, in flows where long-lived coherent structures such as vortices and jets play an important role (Frishman, Laurie & Falkovich Reference Frishman, Laurie and Falkovich2017), reducing the chaoticity of the flow, it is not true that the two versions of CE2 described here should yield the same results. If ensemble CE2 is initialized with non-zonally symmetric initial conditions, then we find that it often flows to a fixed point. By contrast, zonal CE2 often does not flow to a fixed point; instead the statistics may oscillate in time (Marston et al. Reference Marston, Qi and Tobias2019).
3 Proper orthogonal decomposition
The zonal average second cumulant is a three-dimensional object, one dimension higher than that of the underlying dynamical fields; for ensemble averages the second cumulant is of dimension four. This ‘curse of dimensionality’ (Bellman Reference Bellman1957, Reference Bellman1961) can be tamed by application of POD (Holmes, Lumley & Berkooz Reference Holmes, Lumley and Berkooz1998; Muld, Efraimsson & Henningson Reference Muld, Efraimsson and Henningson2012) directly to the low-order statistics. Traditionally, POD has been applied directly to the instantaneous master partial differential equation; instead, here we apply these methods directly to the statistical formulation and find improved performance. Because the two operations of formulating DSS, and reducing dimensionality, do not commute, a given number of POD modes may better represent the DSS statistics than they would the full instantaneous dynamics. In the reduced basis, the two-point function may be efficiently evolved forward in time without encountering the instabilities that plague DNS in POD bases (Resseguier, Mémin & Chapron Reference Resseguier, Mémin and Chapron2015). Here we illustrate how the procedure keeps dimensionality in check without significant loss of accuracy.
A new basis of lower dimensionality that represents the first and second cumulants may be found by Schmidt decomposition of the zonally averaged second moment:
 $$\begin{eqnarray}\displaystyle \overline{\unicode[STIX]{x1D701}(\unicode[STIX]{x1D734}_{1})~\unicode[STIX]{x1D701}(\unicode[STIX]{x1D734}_{2})} & = & \displaystyle c(\unicode[STIX]{x1D734}_{1},\unicode[STIX]{x1D734}_{2})+c(\unicode[STIX]{x1D703}_{1})c(\unicode[STIX]{x1D703}_{2})\nonumber\\ \displaystyle & = & \displaystyle \mathop{\sum }_{i}\unicode[STIX]{x1D706}_{i}~\unicode[STIX]{x1D709}_{i}(\unicode[STIX]{x1D734}_{1})~\unicode[STIX]{x1D709}_{i}(\unicode[STIX]{x1D734}_{2}).\end{eqnarray}$$
Here  $\unicode[STIX]{x1D709}_{i}(\unicode[STIX]{x1D734}_{1})$ is an eigenvector of the second moment with eigenvalue
 $\unicode[STIX]{x1D706}_{i}$ that is both real and non-negative (Kraichnan Reference Kraichnan1980). Equation (3.1) can equivalently be expressed in the space of spherical harmonics where the second moment
 $m_{\ell \ell ^{\prime }m}\equiv \unicode[STIX]{x1D701}_{\ell m}\unicode[STIX]{x1D701}_{\ell ^{\prime }m}^{\ast }$ is block-diagonal in the zonal wavenumber
 $m$ and
 $$\begin{eqnarray}m_{\ell \ell ^{\prime }m}=c_{\ell \ell ^{\prime }m}+c_{\ell }c_{\ell ^{\prime }}\unicode[STIX]{x1D6FF}_{m,0}=\mathop{\sum }_{i}U_{\ell i}^{(m)}\unicode[STIX]{x1D706}_{i}^{(m)}U_{i\ell ^{\prime }}^{\dagger (m)}.\end{eqnarray}$$
Here  $U_{\ell i}^{(m)}$ are unitary matrices (
 $\sum _{\ell }U_{i\ell }^{\dagger (m)}U_{\ell j}^{(m)}=\unicode[STIX]{x1D6FF}_{ij}$) that are composed of the eigenvectors of the second moments:
 $\sum _{\ell ^{\prime }}m_{\ell \ell ^{\prime }m}U_{\ell ^{\prime }j}^{(m)}=\unicode[STIX]{x1D706}_{j}^{(m)}U_{\ell j}^{(m)}$. The dimension of the EOMs for the cumulants may now be reduced by setting a cutoff for the eigenvalues,
 $\unicode[STIX]{x1D706}_{c}$, and discarding all eigenvectors with eigenvalues below this value. The truncation generally breaks conservation of angular momentum, energy and enstrophy, but for driven and damped systems this will generally not cause divergences as long as the truncation is not too severe. Positivity of the second cumulant is maintained by periodically projecting out eigenvectors with negative eigenvalues.
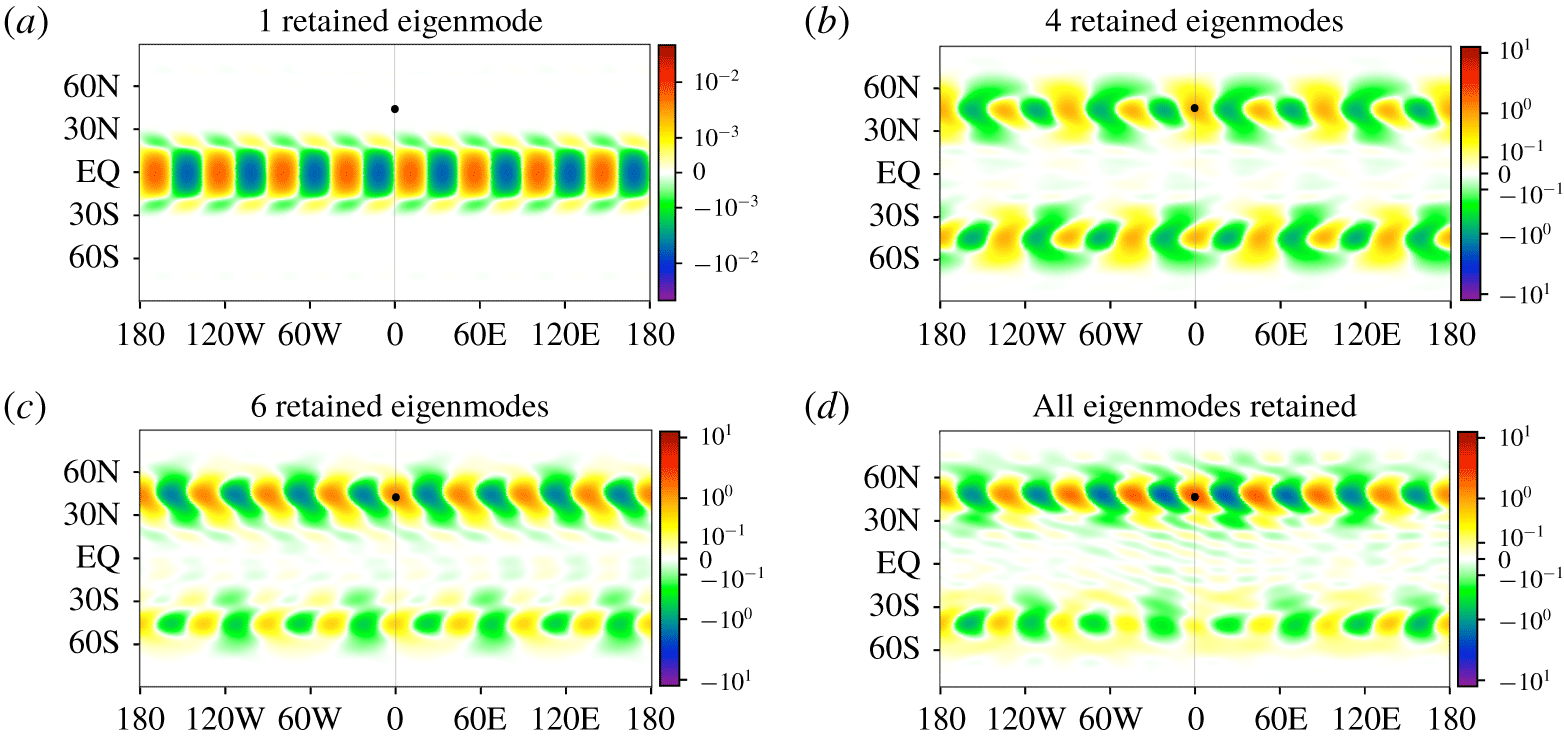
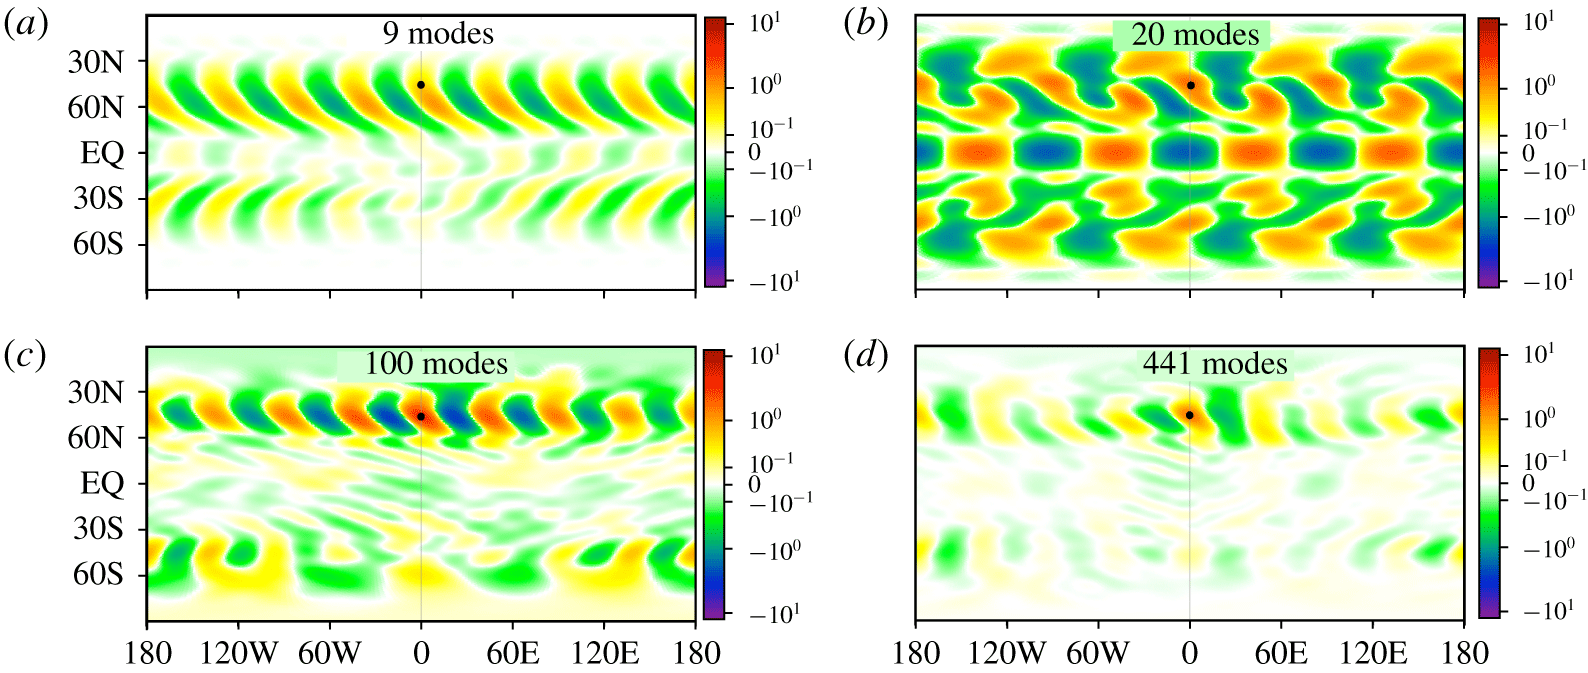
The zonally averaged second moment is accumulated after spin-up to a statistical steady state. For each type of simulation (DNS, zonal CE2 or ensemble CE2) we first compute the second moment in the full basis, perform the POD decomposition and implement the corresponding reduced-dimensionality version of CE2. Figure 2, for instance, shows the second cumulant for the stochastically forced jet (defined below) as calculated by zonal CE2 at different levels of truncation. A severe truncation that retains only the six eigenvectors with largest eigenvalues is still able to reproduce most features of the cumulant.
The reconstituted second cumulant of the stochastic jet with varying number of retained eigenmodes (out of a total of 441) as found by zonal CE2. The jet is spun up for  $300$ days and then the second cumulant is time-averaged for a subsequent
 $700$ days. The reference point (black dot) for one of the two coordinates appearing in the second cumulant, equation (2.3), is on the central meridian (
 $\unicode[STIX]{x1D719}_{2}=0$) at co-latitude of
 $\unicode[STIX]{x1D703}_{2}=45^{\circ }$. The six largest eigenvalues paired with their corresponding zonal wavenumber are:
 $(m,\unicode[STIX]{x1D706}_{i}^{(m)})=(0,19.43)$,
 $(8,2.197)$,
 $(7,2.062)$,
 $(4,1.110)$,
 $(8,0.838)$ and
 $(9,0.676)$.

4 Tests
We first implement unreduced ensemble CE2 and zonal CE2 on two idealized barotropic models on a rotating unit sphere. After comparing these two variants of CE2 against the statistics gathered by DNS that are used as the reference truth, we study the efficacy of dimensional reduction of the two forms of DSS using the POD procedure outlined in § 3.
(a) Zonal mean absolute vorticity  $\overline{\unicode[STIX]{x1D701}+f}$ of the point jet as a function of latitude for DNS, ensemble CE2 and zonal CE2. (b–d) Comparison of all modes retained against different levels of truncation for DNS, ensemble CE2 and zonal CE2, respectively. Each run is evolved until a statistically steady state is reached.

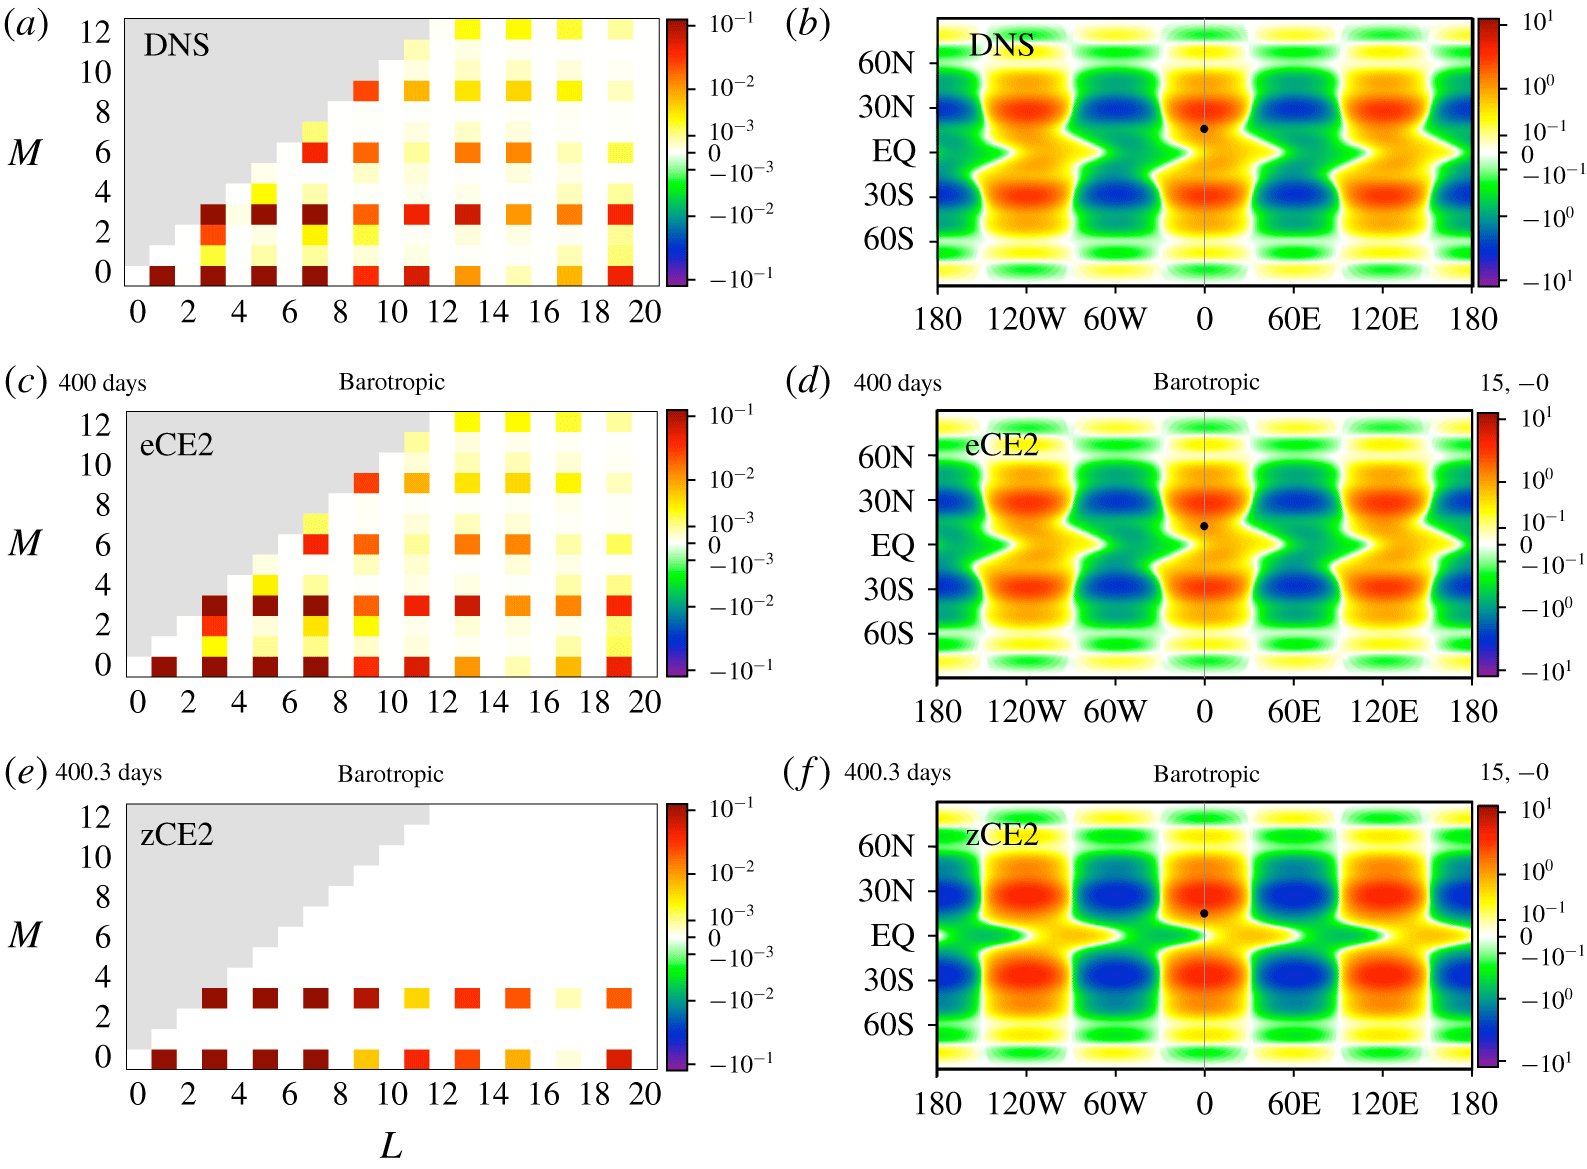
Power spectra (a,c,e) and second cumulant of relative vorticity field (b,d,f) of the point jet for (a,b) DNS, (c,d) ensemble CE2 and (e,f) zonal CE2. The DNS is evolved until  $1000$ days with time averaging over the last
 $500$ days. Ensemble and zonal CE2 are evolved until
 $400$ days without time averaging. The reference point (black dot) for one of the two coordinates appearing in the second cumulant, equation (2.3), is on the central meridian (
 $\unicode[STIX]{x1D719}_{2}=0$) at co-latitude of
 $\unicode[STIX]{x1D703}_{2}=75^{\circ }$. Ensemble CE2 matches the statistics obtained by accumulation from DNS whereas zonal CE2 exhibits an artificial symmetry of reflection about the equator not present in the statistics obtained from DNS.

4.1 Point jet
We study a deterministic point jet that relaxes on a time scale  $\unicode[STIX]{x1D70F}$ towards an unstable retrograde jet with meridional profile
 $\unicode[STIX]{x1D701}_{jet}(\unicode[STIX]{x1D703})=-\unicode[STIX]{x1D6EF}\tanh ((\unicode[STIX]{x03C0}/2-\unicode[STIX]{x1D703})/\unicode[STIX]{x0394}\unicode[STIX]{x1D703})$. Parameters
 $\unicode[STIX]{x1D6EF}=0.6\unicode[STIX]{x1D6FA}$ and
 $\unicode[STIX]{x0394}\unicode[STIX]{x1D703}=0.05$ are chosen to correspond with the jet previously examined in Marston et al. (Reference Marston, Conover and Schneider2008). The flow is damped and driven by the terms that appear in (2.1), i.e.
 $$\begin{eqnarray}L[\unicode[STIX]{x1D701}]+F=\frac{\unicode[STIX]{x1D701}_{jet}-\unicode[STIX]{x1D701}}{\unicode[STIX]{x1D70F}},\end{eqnarray}$$
with  $\unicode[STIX]{x1D702}=0$. Spectral simulations are performed at a modest resolution of
 $0\leqslant \ell \leqslant L$ and
 $|m|\leqslant \min \{\ell ,M\}$ with
 $L=20$ and
 $M=12$. For a short relaxation time of
 $\unicode[STIX]{x1D70F}=2$ days the flow is dominated by critical-layer waves and eddies are suppressed by the strong coupling to the fixed jet. For a longer relaxation time of
 $\unicode[STIX]{x1D70F}=20$ days the flow is turbulent and well-mixed near the equator. Since zonal CE2 neglects eddy–eddy interactions, it increasingly differs from DNS as
 $\unicode[STIX]{x1D70F}$ grows. Here we set
 $\unicode[STIX]{x1D70F}=20$ days to demonstrate that ensemble average CE2 captures features of the non-zonal coherent structures that zonal average CE2 misses. Figure 3(a) shows that ensemble CE2 accurately reproduces the zonal mean absolute vorticity, whereas zonal CE2 overmixes the absolute vorticity at low latitudes (Marston et al. Reference Marston, Conover and Schneider2008). Figure 4 shows that whereas zonal CE2 has power only in the zonal mean
 $m=0$ mode, and a single eddy of wavenumber
 $m=3$, the power spectrum of ensemble CE2 matches that found by DNS. The DNS statistics are accumulated from time
 $500$ to
 $1000$ days after spin-up of
 $500$ days. Ensemble CE2 reaches a statistically steady state by
 $400$ days and no time averaging is required. Whereas the second cumulant of the vorticity field as determined by zonal CE2 exhibits artificial reflection symmetry about the equator (Marston et al. Reference Marston, Conover and Schneider2008), ensemble CE2 does not have this defect (see figure 4b,d,f).
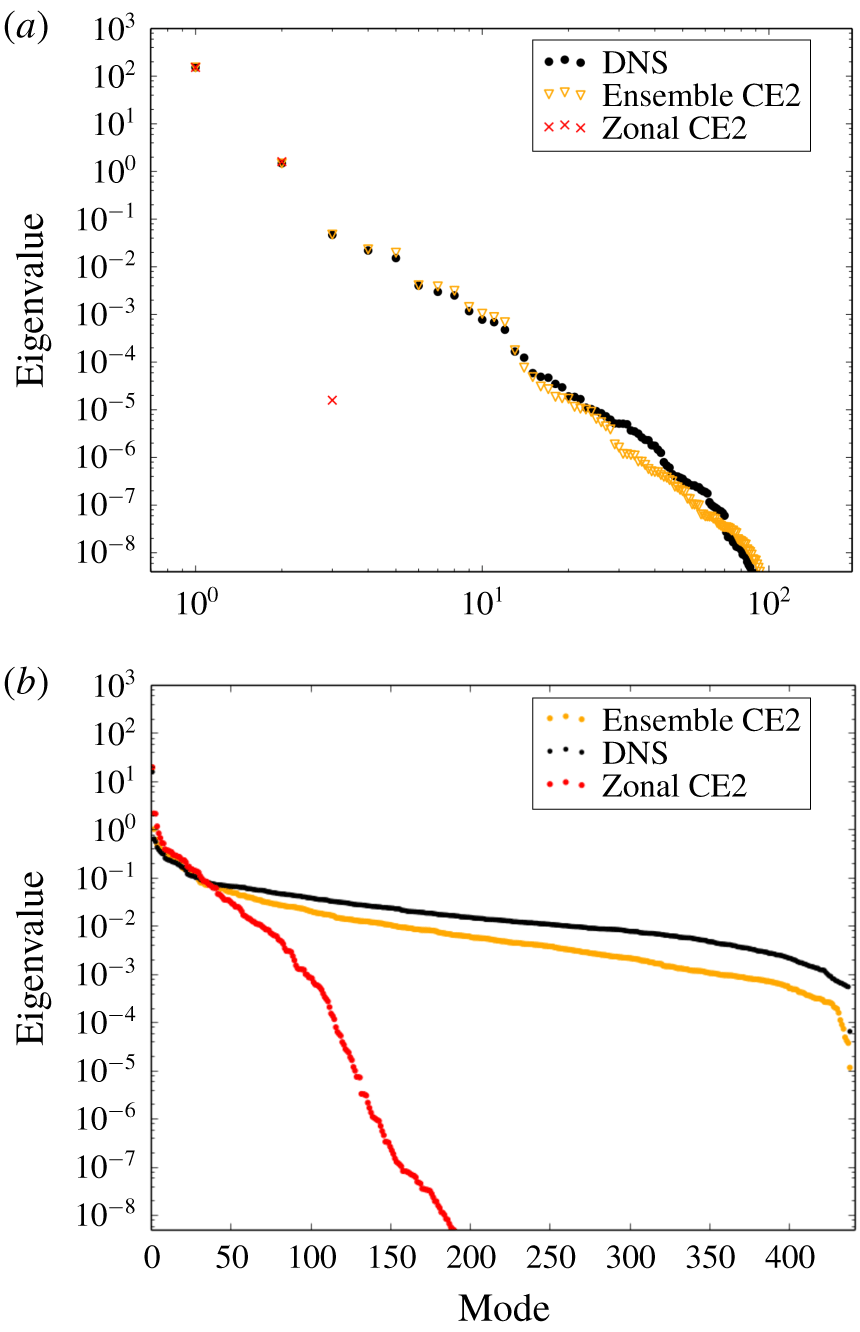
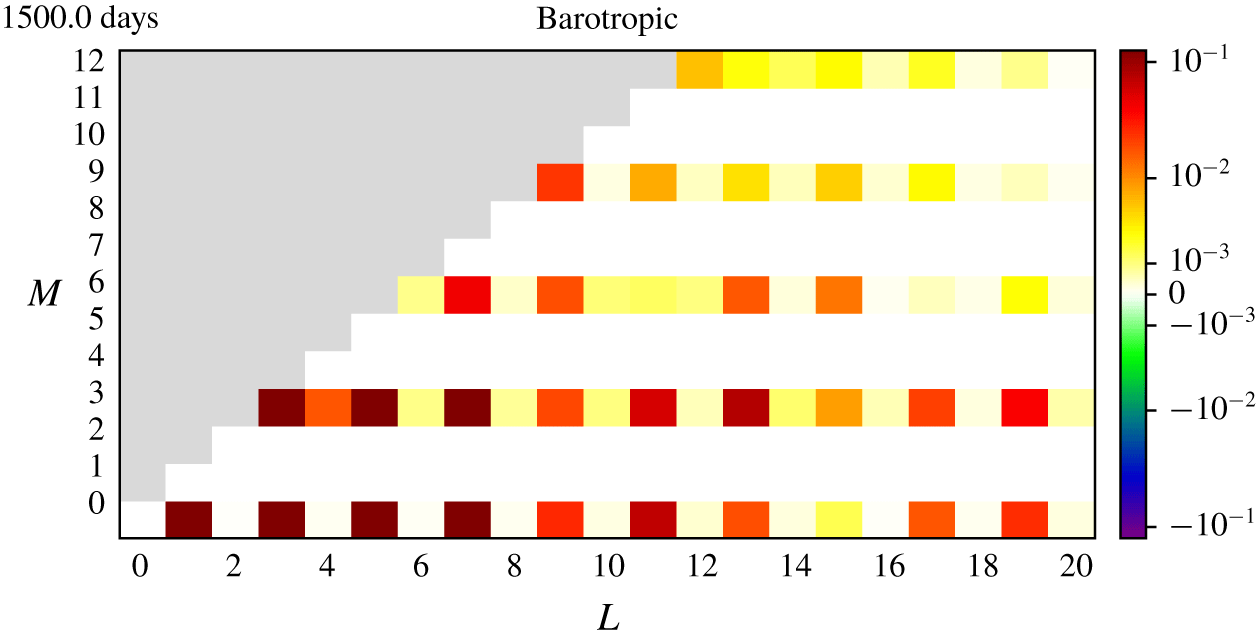
We turn now to model reduction via POD truncation. Figure 3(b–d) shows the first cumulants, or zonal mean absolute vorticity, at different levels of truncation. While POD offers a substantial dimensional reduction for DNS and ensemble CE2 with slight loss of accuracy, extreme truncation of zonal CE2 down to just a few modes is possible. This is consistent with the spectrum of the eigenvalues of the second moment shown in figure 5(a). The steep decay of the eigenvalues of zonal CE2 reflects the fact that only the  $m=3$ eddy has power.
(a) Spectrum of eigenvalues of the second moment of the point jet in descending order for DNS, ensemble CE2 and zonal CE2. The eigenvalues decay most quickly for zonal CE2; only zonal wavenumbers  $m=0$ and
 $m=3$ have non-zero eigenvalues
 $\unicode[STIX]{x1D706}_{i}^{(m)}$, consistent with the power spectra shown in figure 4. (b) Spectrum of eigenvalues for the stochastic jet. The eigenvalues decay exponentially, though less rapidly than for the point jet.

4.2 Stochastic jet
Jets that form spontaneously in the presence of rotation and small-scale random forcing provide another, perhaps more stringent, test of DSS. An idealized barotropic model that has been much studied (Farrell & Ioannou Reference Farrell and Ioannou2007; Tobias et al. Reference Tobias, Dagon and Marston2011; Tobias & Marston Reference Tobias and Marston2013; Constantinou et al. Reference Constantinou, Farrell and Ioannou2014; Marston et al. Reference Marston, Qi and Tobias2019) is governed by
 $$\begin{eqnarray}L[\unicode[STIX]{x1D701}]=-[\unicode[STIX]{x1D705}-\unicode[STIX]{x1D708}_{3}(\unicode[STIX]{x1D6FB}^{2}+2)\unicode[STIX]{x1D6FB}^{4}]\unicode[STIX]{x1D701},\end{eqnarray}$$
with  $F=0$. We examine this model for the set of parameters used in Marston et al. (Reference Marston, Qi and Tobias2019); friction
 $\unicode[STIX]{x1D705}=0.02$ with hyperviscosity
 $\unicode[STIX]{x1D708}_{3}$ set such that the mode at the smallest length scale decays at a rate of 1. The covariance of the Gaussian white noise of the modes that are forced stochastically is
 $\unicode[STIX]{x1D6E4}_{\ell \ell ^{\prime }m}=0.1\unicode[STIX]{x1D6FF}_{\ell \ell ^{\prime }}$ for
 $8\leqslant \ell \leqslant 12$ and
 $8\leqslant |m|\leqslant \ell$, and the stochastic renewal time is set to be
 $\unicode[STIX]{x1D70F}_{r}=0.1$. For this experiment, the forcing is concentrated at low latitudes, enabling an evaluation of the ability of different DSS approximations to convey angular momentum towards the poles (Marston, Chini & Tobias Reference Marston, Chini and Tobias2016; Marston et al. Reference Marston, Qi and Tobias2019). Spectral simulations are performed at a resolution of
 $0\leqslant l\leqslant L$ and
 $|m|\leqslant \min \{l,M\}$ with
 $L=30$ for
 $M=20$. After a spin-up time of
 $300$ days, statistics are accumulated for a further
 $700$ days.
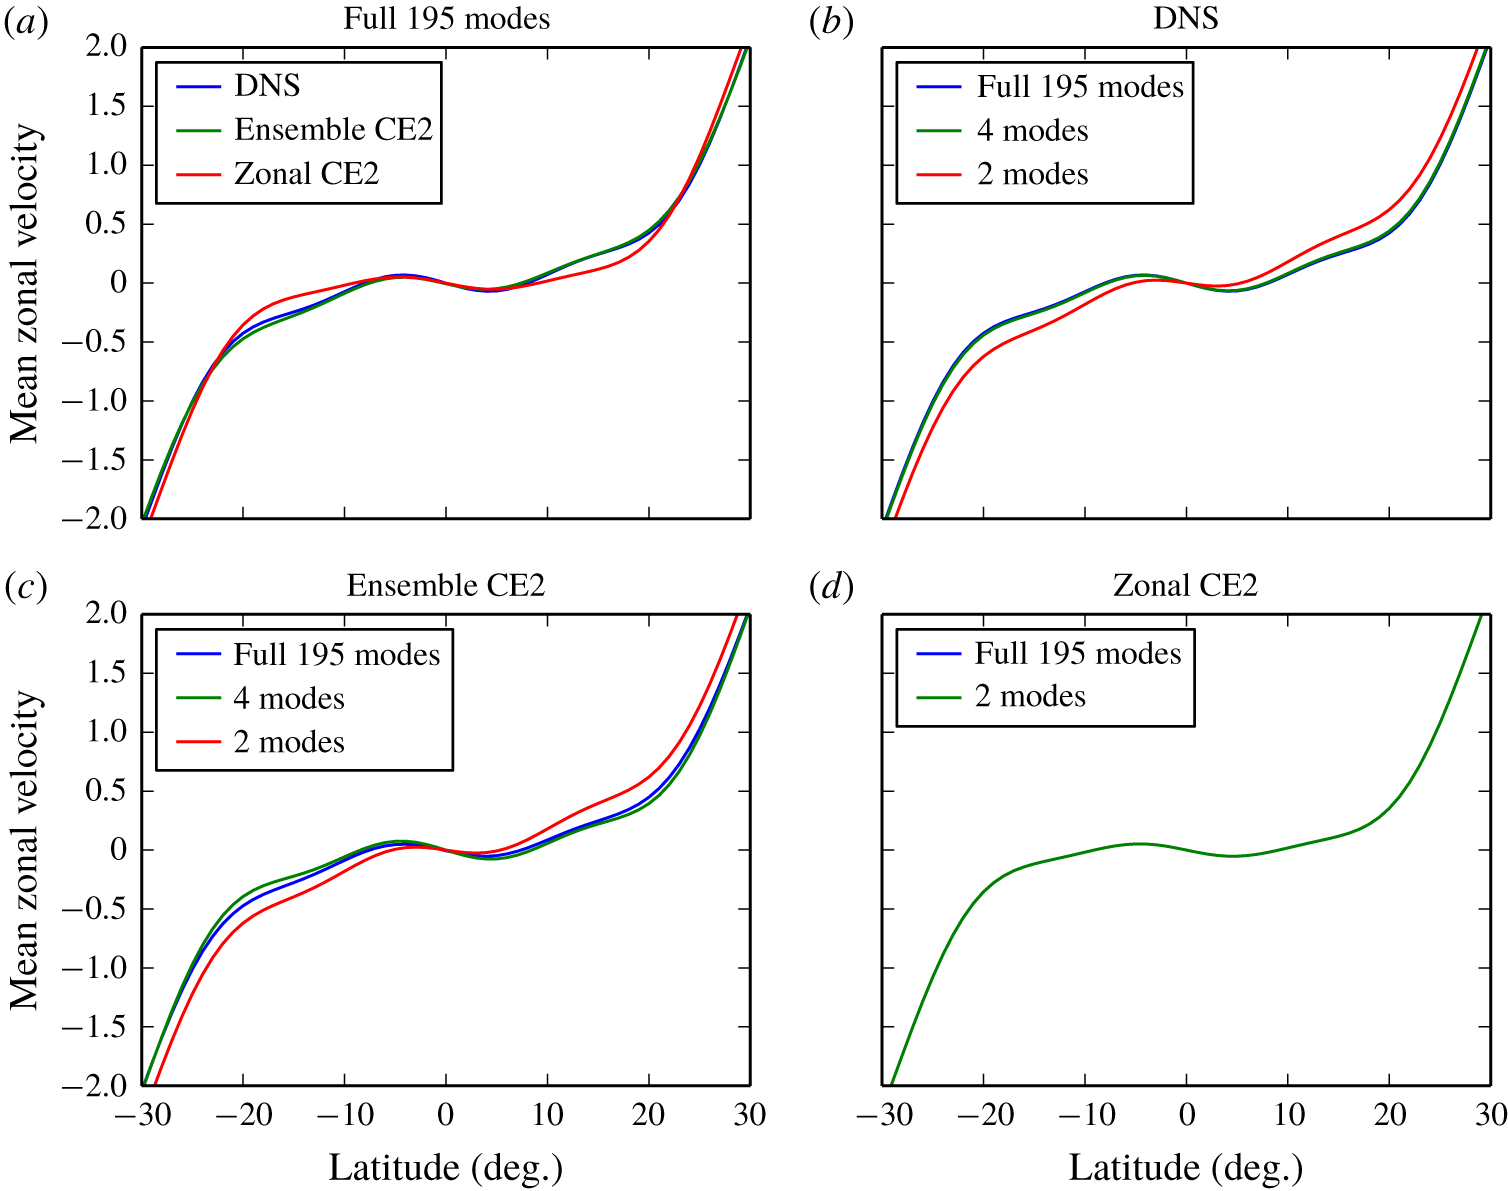
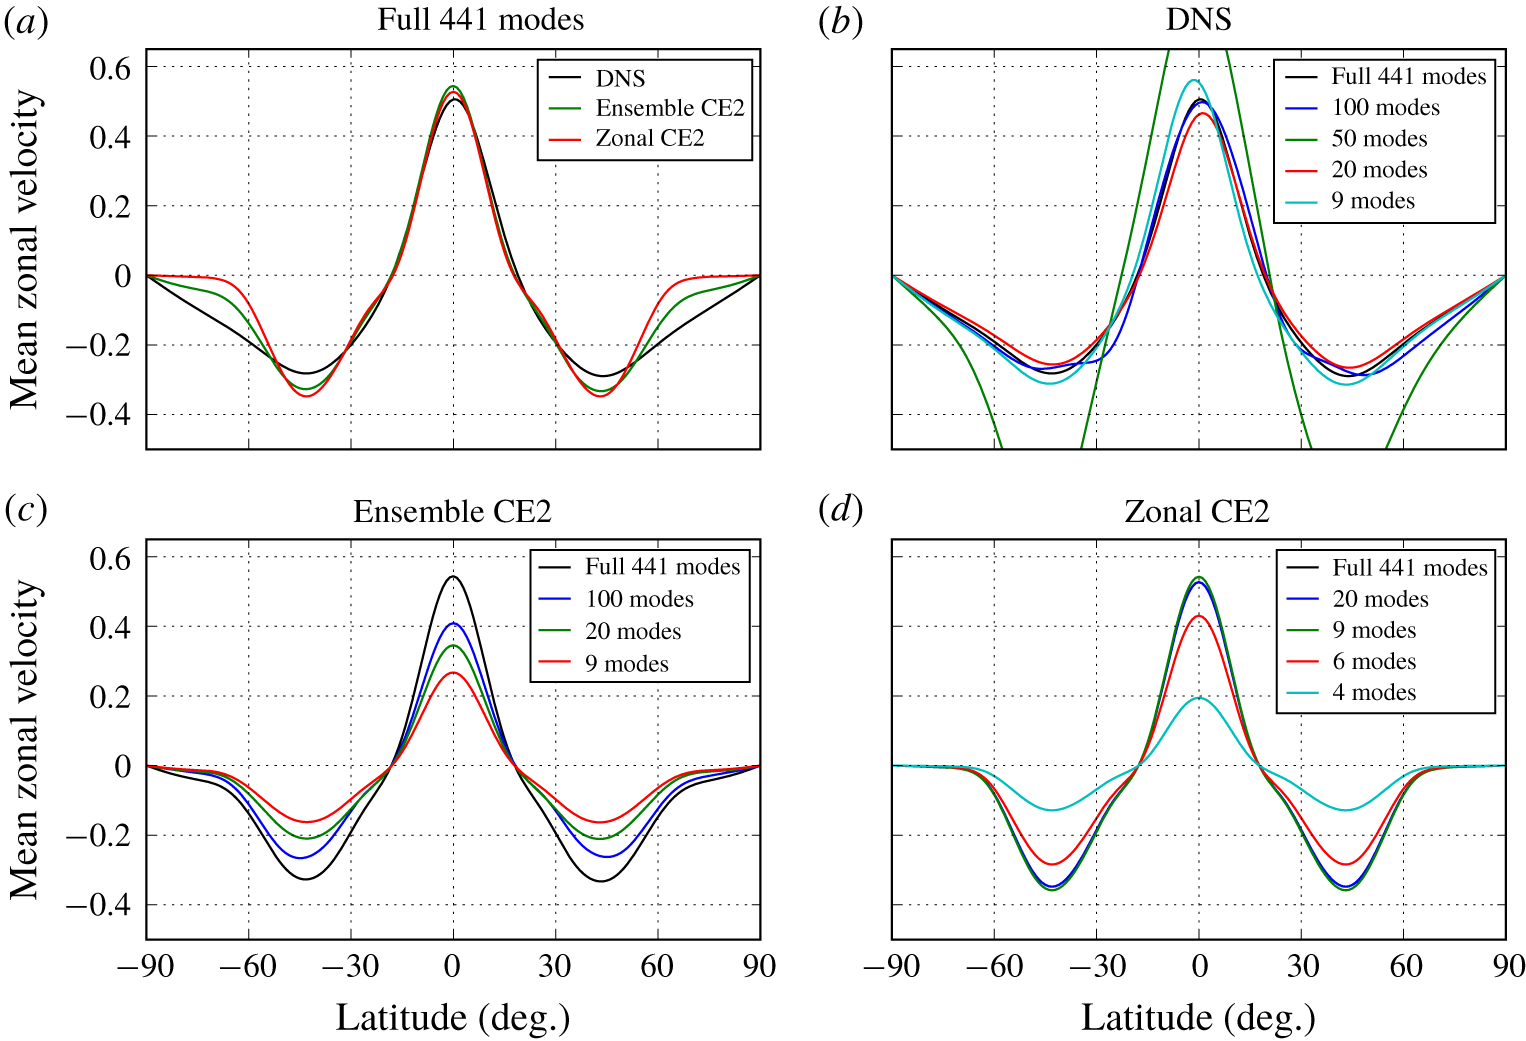
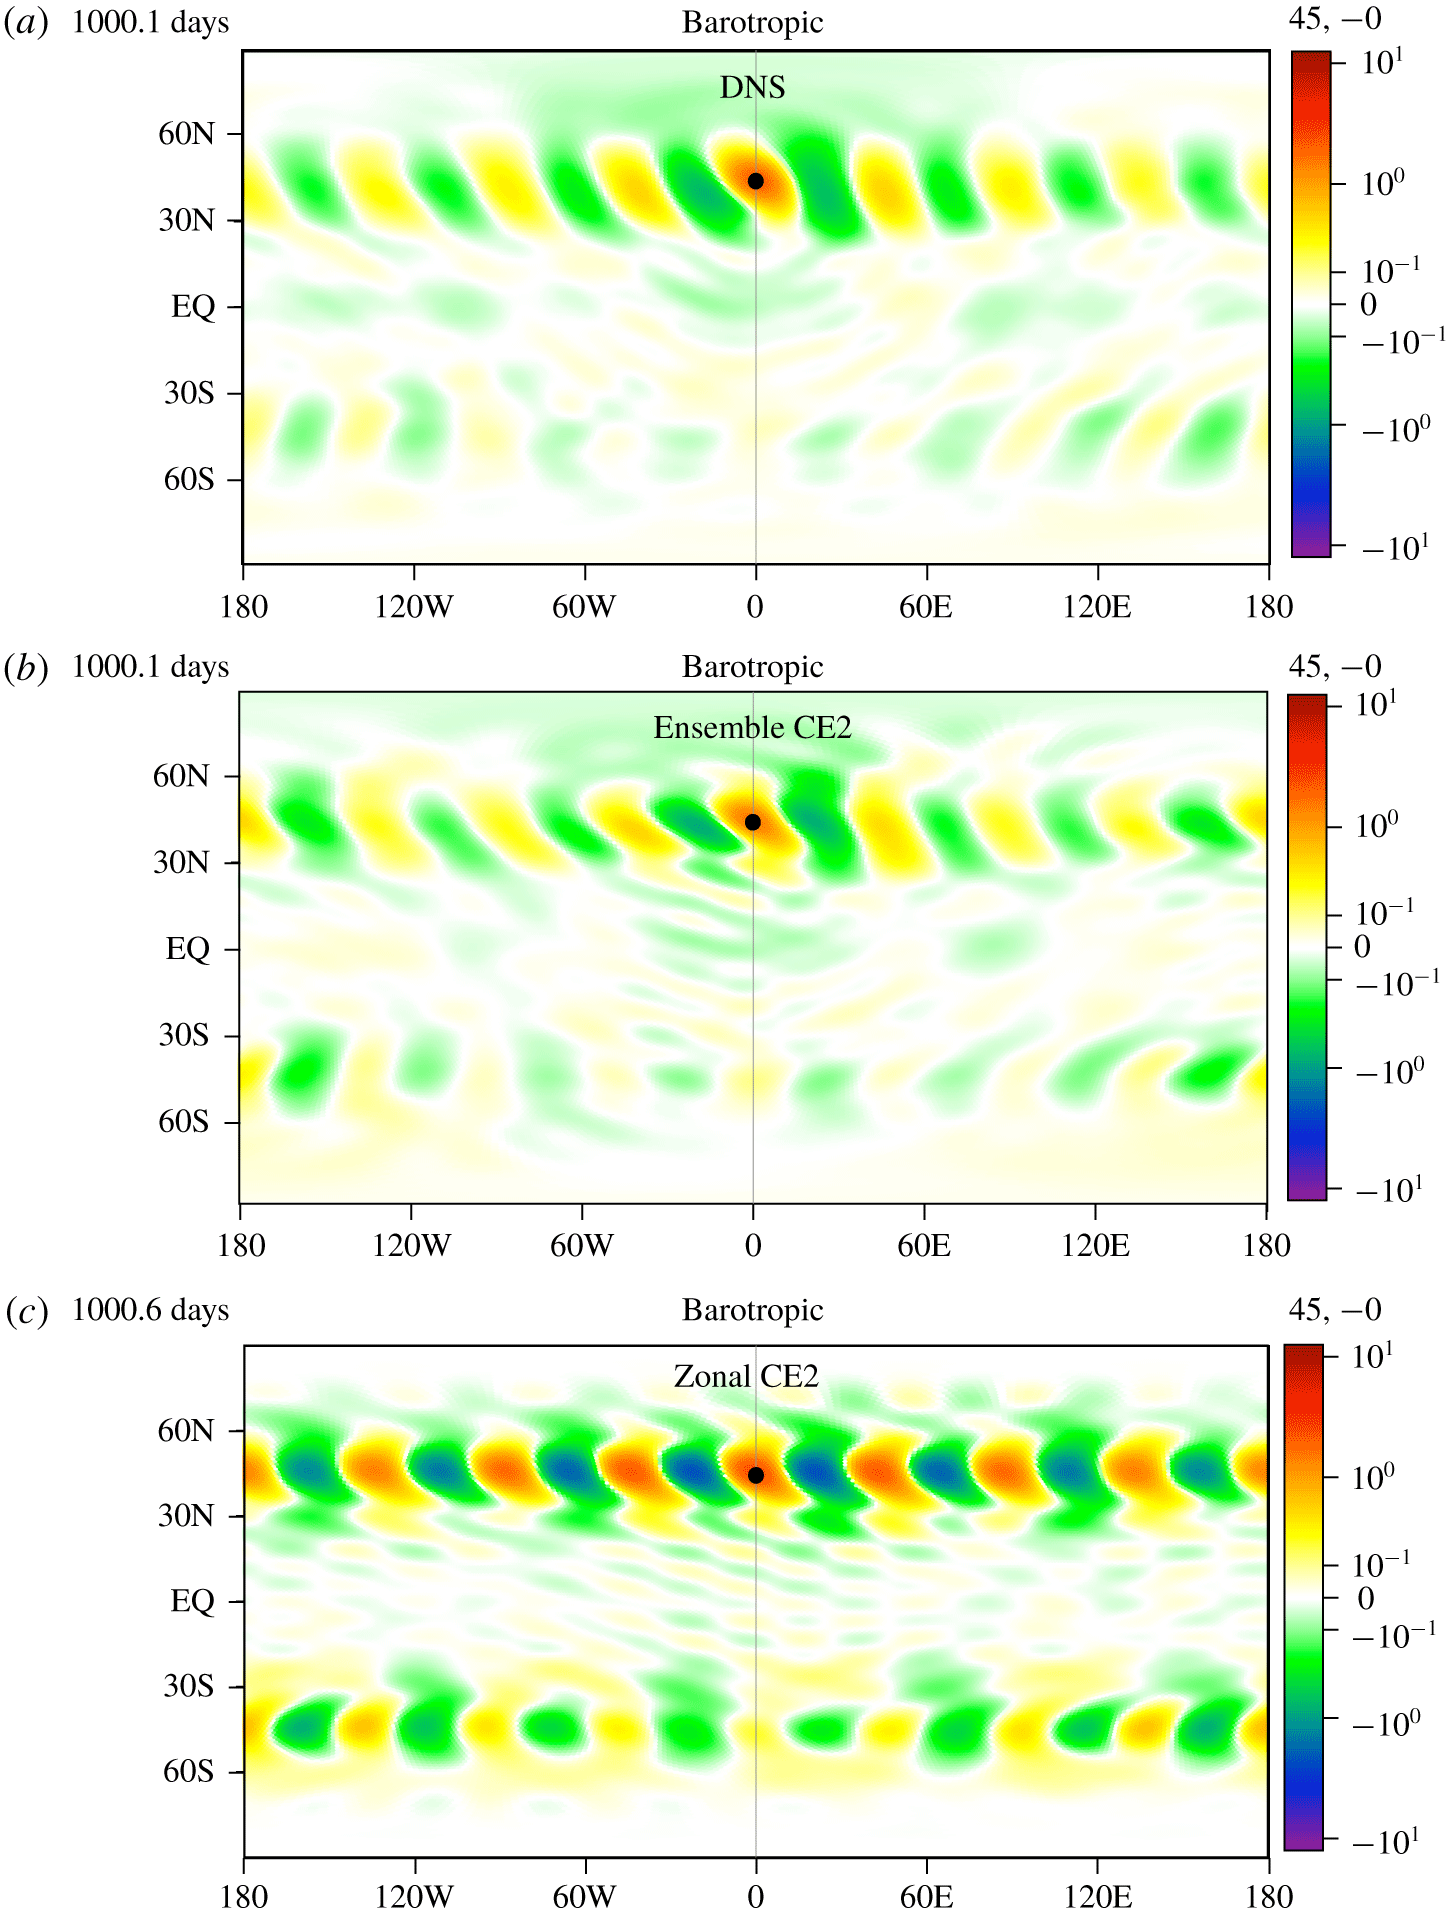
Figure 6(a) compares the zonal mean zonal velocity as a function of latitude for ensemble CE2, zonal CE2 and DNS. Owing to the neglect of eddy–eddy scattering in zonal CE2, there is no mechanism to transport eddy angular momentum from the equator, where the forcing is concentrated, towards the poles, and the method underestimates the mean zonal velocity at high latitudes. Ensemble CE2 does somewhat better, but the match at high latitudes remains poor. (Higher-order closures do much better – see Marston et al. (Reference Marston, Qi and Tobias2019) – but for simplicity we do not study them here.) The second vorticity cumulant is shown in figure 7. Vorticity correlations are non-local in space, and zonal CE2 exaggerates the range of the correlations because the waves are coherent, again owing to the lack of eddy–eddy scattering. Ensemble CE2 more closely matches DNS.
(a) Comparison of the zonal mean zonal velocity of the stochastically driven jet as a function of latitude for DNS, ensemble CE2 and zonal CE2. Ensemble CE2 matches DNS better than zonal CE2 because it retains some of the eddy–eddy scattering process which transports eddy angular momentum poleward. (b–d) Comparison of the zonal mean zonal velocities of the non-truncated system against different levels of truncation for DNS, ensemble CE2 and zonal CE2, respectively.

Second cumulant of relative vorticity field of the stochastic jet for (a) DNS, (b) ensemble CE2 and (c) zonal CE2. The reference point for the second cumulant (black dot) is positioned along the central meridian at a co-latitude of  $45^{\circ }$. Zonal CE2 shows exaggerated coherent waves in comparison to DNS and ensemble CE2.

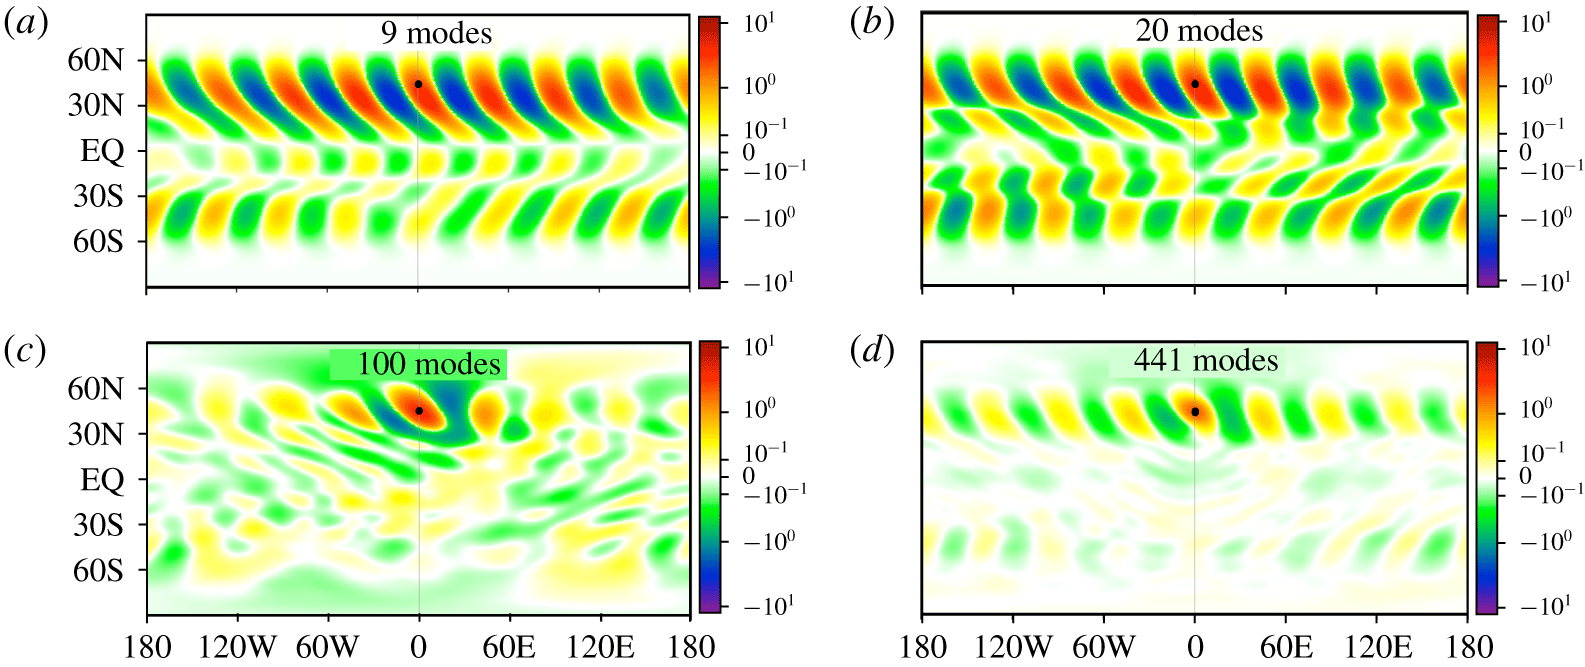
We now examine the reduction in dimensionality of DSS by POD. Figure 6(b–d) shows the zonal mean zonal velocity as a function of latitude at different levels of truncation for DNS, ensemble CE2 and zonal CE2. It is apparent that both types of CE2 are better suited to the POD method than DNS. Zonal CE2 in particular allows for a more severe truncation compared with ensemble CE2 and DNS, a fact that can again be explained by the spectrum of eigenvalues shown in figure 5(b). The eigenvalues decay more slowly for the stochastically forced jet than for the point jet. It can be seen that statistics accumulated from DNS do not converge monotonically in truncation level towards those of the full simulation; those obtained from the cumulant expansions are better behaved. Convergence of the second cumulant with increasing number of retained modes is also evident (see figures 8 and 9).
The number of operations required for a POD-reduced CE2 time step scales with the size of the retained basis  $N_{ret}$ as
 $O(N_{ret}^{3})$. Therefore a dimensional reduction from
 $N_{ret}=441$ to
 $N_{ret}=13$ would naively equate to a speeding up of order
 $10^{4}$. In the case of unreduced zonal CE2, however, zonal symmetry may be exploited to decrease the number of operations per time step (Marston et al. Reference Marston, Qi and Tobias2019) to
 $O(L^{3}M)\ll O((LM)^{3})$. Nevertheless, the speed-up is considerable. A machine with a 2.6 GHz quad-core Intel Core i7 processor runs 28 times faster for reduced zonal CE2 with
 $N_{ret}=13$ in comparison to full unreduced zonal CE2, with little loss in accuracy.
Comparison of the second vorticity cumulants of the stochastic jet in the statistical steady state of DNS for different truncation levels. The non-truncated statistics are shown in (d).

Comparison of the second vorticity cumulants of the stochastic jet in the statistical steady state of ensemble CE2 for different truncation levels. The non-truncated statistics are shown in (d).

5 Continuation in parameter space
The test problems studied in the preceding section show that it is possible to implement DSS in a subspace of reduced dimensionality, supporting the idea that relatively few modes are required for a description of the low-order statistics. The reduced statistical simulations still, however, require a full-resolution training run for POD. Thus, from a practical point of view, the reduced simulations do not offer a speed-up. In order to address this, we show here that it is possible to fix the reduced basis obtained from a single training run, alter model parameters and still obtain good agreement with both DNS and CE2 in a reduced basis. Thus, the reduced basis obtained from one training run can be used to perform DSS for a range of parameters.
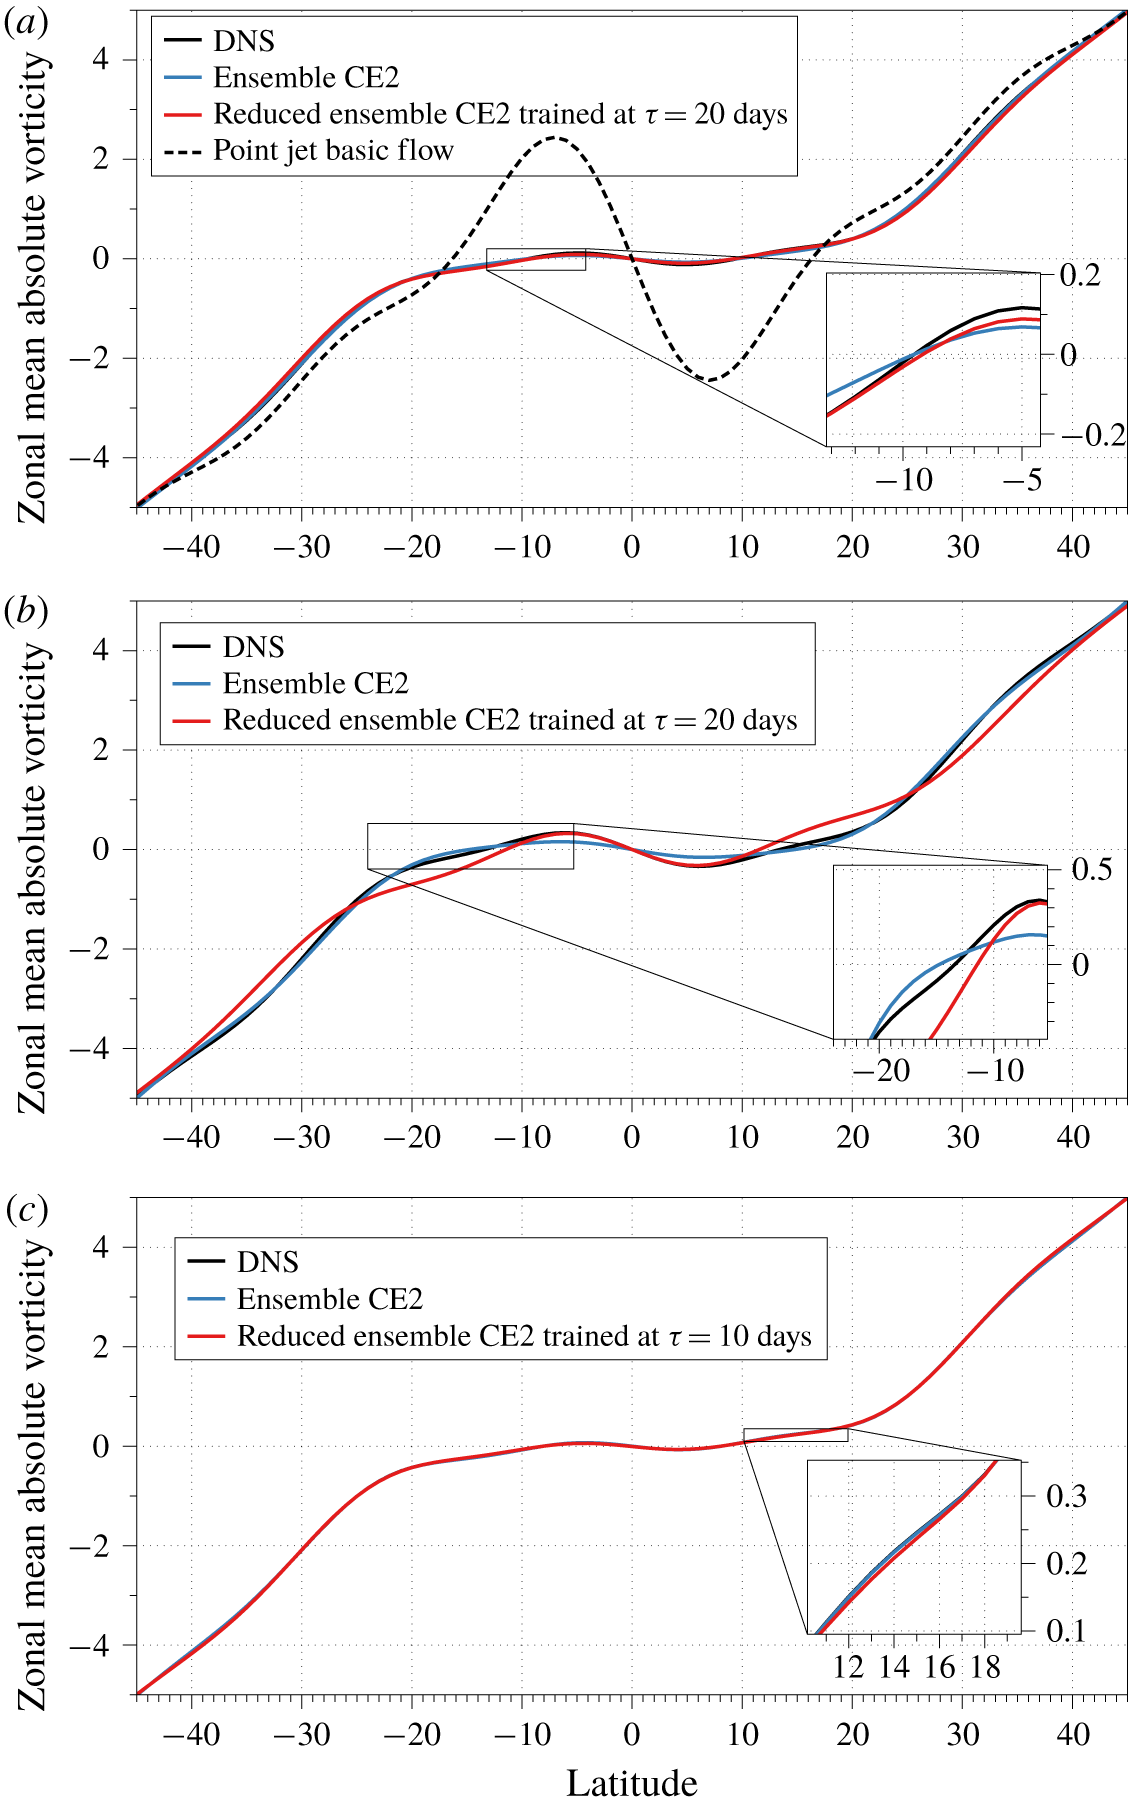
We illustrate the continuation by reducing the relaxation time of the point jet. This parameter controls the relative degree of turbulence to mean flow in the jet and is related to the Kubo number, which is a measure of the degree of applicability of the quasilinear approximation (Marston et al. Reference Marston, Chini and Tobias2016). We utilize the  $\unicode[STIX]{x1D70F}=20$ days jet as a training run for POD on the ensemble CE2 solution, and calculate the reduced basis for this parameter set. Figure 10 shows the (zonally averaged) first cumulant for ensemble CE2 in this reduced basis of
 $40$ retained modes for
 $\unicode[STIX]{x1D70F}=10$ and
 $5$ days. Note that the dynamics (and indeed the statistics) does change significantly when this parameter is altered. For
 $\unicode[STIX]{x1D70F}=10$ days the agreement is exceptionally good. However, as the parameter
 $\unicode[STIX]{x1D70F}$ is reduced further away from the training run to
 $\unicode[STIX]{x1D70F}=5$ days, the agreement between reduced ensemble CE2 with full ensemble CE2 and DNS worsens as expected. Even here, qualitative agreement is retained. Continuation to values of
 $\unicode[STIX]{x1D70F}$ greater than that of the training value is also possible. Figure 10(c) shows the statistics for the
 $\unicode[STIX]{x1D70F}=20$ days jet as calculated by reduced ensemble CE2 with a basis determined by a
 $\unicode[STIX]{x1D70F}=10$ days training run. Excellent agreement is obtained.
Zonal mean absolute vorticity  $\overline{\unicode[STIX]{x1D701}+f}$ of the point jet as a function of latitude for DNS, full ensemble CE2 and reduced ensemble CE2 for different jet relaxation times
 $\unicode[STIX]{x1D70F}$ (see (4.1)). The reduced basis is fixed and obtained by POD from ensemble CE2 for a single training run on the jet at a different value of
 $\unicode[STIX]{x1D70F}$. In each case 40 modes are retained. (a) The point jet with
 $\unicode[STIX]{x1D70F}=10$ days with a reduced basis obtained from a training run at
 $\unicode[STIX]{x1D70F}=20$ days. The basic absolute vorticity of the point jet,
 $\unicode[STIX]{x1D701}_{jet}+f$, is shown for comparison; the region around the equator is well mixed by the eddies. (b) The point jet
 $\unicode[STIX]{x1D70F}=5$ days from a training run at
 $\unicode[STIX]{x1D70F}=20$ days. As parameter
 $\unicode[STIX]{x1D70F}$ is continued away from the training run with
 $\unicode[STIX]{x1D70F}=20$ the agreement between reduced ensemble CE2 with full ensemble CE2 and DNS deteriorates. (c) The point jet with
 $\unicode[STIX]{x1D70F}=20$ days where the reduced basis is obtained from a training run at
 $\unicode[STIX]{x1D70F}=10$ days.

Comparison of power spectra in figure 11 with figure 4(c) shows that second-order statistics show qualitative agreement as  $\unicode[STIX]{x1D70F}$ is continued from
 $10$ to
 $20$ days. The reduction in dimensionality simplifies the spectrum of the reduced ensemble CE2 spectra in comparison with the full-resolution simulation as expected. This initial exploration of parameter continuation shows a promising direction for future research.
Power spectra for the  $\unicode[STIX]{x1D70F}=20$ day jet as calculated by reduced ensemble CE2 with 40 retained modes, with the fixed basis determined by training on the
 $\unicode[STIX]{x1D70F}=10$ days jet. Comparison should be made to figure 4(c).

6 Discussion and conclusion
Proper orthogonal decomposition can be used to reduce the dimensionality of CE2 by discarding modes that are unimportant for the low-order statistics. For one of the two idealized models that we studied, the first and second cumulants can be accurately reproduced with relatively few modes, permitting a substantial reduction in dimensionality, and an increase in computational speed. This is particularly true for zonal CE2. The degree of truncation and hence computational saving that can be made while maintaining accuracy depends on the specifics of the system, as demonstrated by our results for the two different test problems.
It would be interesting to explore dimensional reduction of DSS for more realistic models such as those explored in Ait-Chaalal et al. (Reference Ait-Chaalal, Schneider, Meyer and Marston2016). Dimensional reduction by POD has been tested in a quasilinear model of the ocean boundary layer (Skitka et al. Reference Skitka, Marston and Fox-Kemper2020). It would also be interesting to determine whether or not a dimensional reduction algorithm could be constructed that acts dynamically on DSS, bypassing the step of first acquiring statistics for the full non-truncated problem, as in the current work. With such an advance it may be possible for DSS to access regimes that cannot be reached by DNS. We note that CE2 by itself has already been used for a dynamo problem to access lower magnetic Prandtl number than is possible by DNS (Squire & Bhattacharjee Reference Squire and Bhattacharjee2015). As reduced-dimensionality DSS is able to quickly describe some fluid dynamical systems via parameter continuation of the low-order statistics, the combination of POD with cumulant expansions offers a good prospect for other simulations to reach beyond DNS.
Acknowledgements
This work was supported in part by NSF DMR-1306806 and by a grant from the Simons Foundation (grant no. 662962, GF). S.M.T. would also like to acknowledge support of funding from the European Research Council (ERC) under the European Union’s Horizon 2020 research and innovation programme (grant agreement no. D5S-DLV-786780). We thank G. Chini and J. Skitka for useful discussions.
Declaration of interests
The authors report no conflict of interest.