Introduction
Graphene research has experienced tremendous growth in the past 13 years because of its unique fundamental properties and prospects for very promising applications. Reference Geim and Novoselov1 Techniques for the preparation of large-area graphene films at the centimeter or even meter scale, especially by chemical vapor deposition (CVD) of carbon precursors on catalytic substrates, have seen rapid progress. Reference Li, Colombo and Ruoff2 Graphene formation on catalytic substrates, especially metals such as Ni, Co, Ru, Pt, Rh, Pd, and Ir, has been the subject of several studies for more than 50 years. Reference Batzill3 Rather than synthesizing graphene, many of these studies were concerned with poisoning the metal’s catalytic activity (i.e., metal catalysts lose their activity due to the formation of graphitic layers on their surface). Reference Bartholomew4
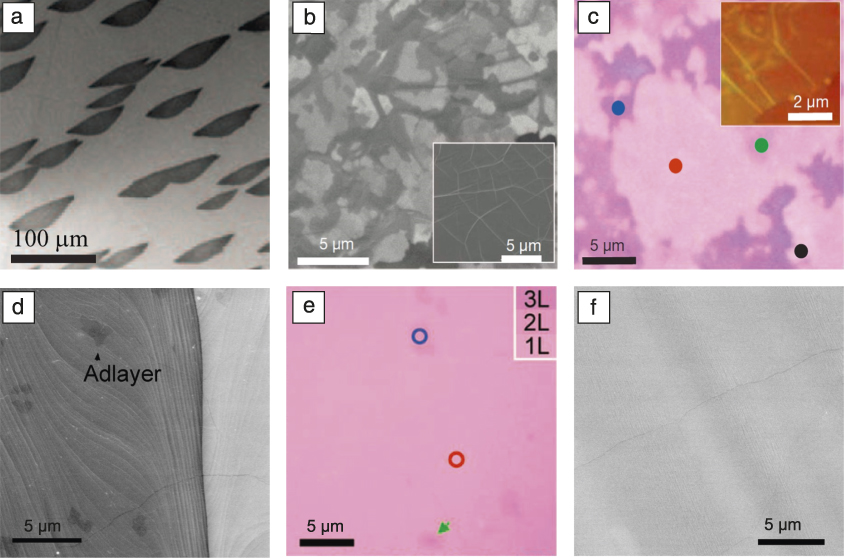
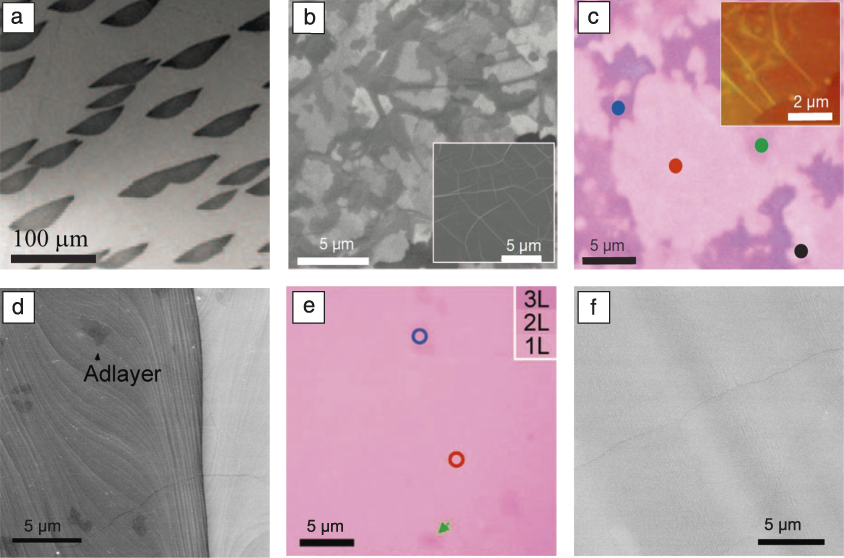
Following the rediscovery of graphene by Novoselov and Geim in 2004, Reference Geim and Novoselov1 researchers have deliberately developed methods to produce large-area graphene films by revisiting existing carbon/metal systems such as Ru and Ni ( Figure 1a–c). Reference Sutter, Flege and Sutter5–Reference Kim, Zhao, Jang, Lee, Kim, Kim, Ahn, Kim, Choi and Hong8 These systems, however, show difficulty in isolating graphene from the metal substrates or controlling the thickness uniformity. Li et al. introduced Cu in 2009 as a catalytic substrate for graphene growth by CVD from methane (Figure 1d–f). Reference Li, Cai, An, Kim, Nah, Yang, Piner, Velamakanni, Jung, Tutuc, Banerjee, Colombo and Ruoff9,Reference Li, Zhu, Cai, Borysiak, Han, Chen, Piner, Colombo and Ruoff10 Since then, Cu (sometimes alloyed with other metals such as Ni) has emerged as a good choice for graphene synthesis due to its advantages of being able to grow large-area and high-quality graphene with maximum control. Other graphene-film preparation techniques have also been developed, such as growing graphene on dielectric substrates Reference Chen, Wu and Liu11 and the growth of graphene foam. Reference Chen, Ren, Gao, Liu, Pei and Cheng12
Graphene growth on metal substrates. (a) Ultrahigh vacuum-scanning electron microscope (SEM) image of a Ru(0001) surface after first-layer graphene (dark islands) growth. Reproduced with permission from Reference Sutter, Flege and SutterReference 5. © 2008 Nature Publishing Group. (b) SEM image of as-grown graphene film on 300-nm Ni film and (inset) 1-mm Ni foil. (c) Optical microscope image of the graphene film in (b) transferred onto SiO2/Si (300-nm-thick oxide layer). The color contrast indicates thickness differences, as marked by the colored dots: black, monolayer; red, bilayer; green, trilayer; blue, >4 layers. The inset atomic force microscope image shows typical rippled structures. (b–c) Reproduced with permission from Reference Kim, Zhao, Jang, Lee, Kim, Kim, Ahn, Kim, Choi and HongReference 8. © 2009 Nature Publishing Group. (d) SEM image of monolayer graphene on a Cu foil with a few adlayer flakes. (e) Optical microscope image of graphene in (d) transferred onto SiO2/Si (285-nm-thick oxide layer). Red circle, monolayer (1L); blue circle, bilayer (2L); green arrow, trilayer (3L). Reproduced with permission from Reference Li, Cai, An, Kim, Nah, Yang, Piner, Velamakanni, Jung, Tutuc, Banerjee, Colombo and RuoffReference 9. © 2009 AAAS. (f) SEM image of monolayer graphene on Cu with no adlayers after optimization. Reproduced with permission from Reference Li, Zhu, Cai, Borysiak, Han, Chen, Piner, Colombo and RuoffReference 10. © 2009 American Chemical Society.
Understanding graphene growth on nonmetal substrates, especially the catalytic activity, is still in its infancy and therefore is not reviewed in this article. We focus on metal catalytic substrates for graphene growth by CVD, including graphene growth mechanisms and kinetics, control of the number of graphene layers and stacking order, engineering of large-area graphene single crystals, low-temperature growth, and associated challenges and prospects.
Graphene growth mechanisms and kinetics
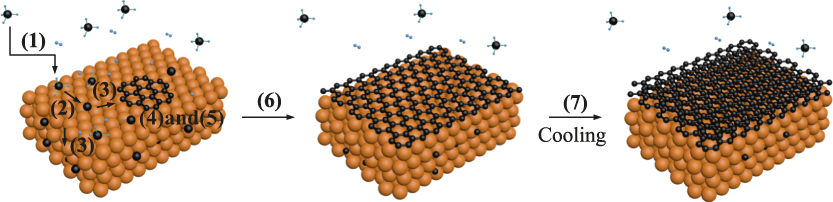
Generally, graphene growth on metals by CVD can be divided into the following steps (see Figure 2 ): (1) Carbon precursors are transported to the metal surface; (2) the precursor is adsorbed and catalytically decomposed into active C species; (3) the active C species diffuse on the surface or into the bulk; (4) C aggregates on the surface for nucleation; (5) C attaches graphene nuclei for growth; (6) catalytic decomposition of C precursors terminates once the substrate is fully covered with graphene; and (7) more graphene layers form by C precipitation during the cooling process due to supersaturation of C in the metal.
Schematic of graphene growth kinetics. (1) Gas phase transportation, (2) surface adsorption and decomposition of gas molecules, (3) diffusion on the surface and in the bulk of decomposed active species, (4) graphene nucleation, (5) graphene growth, (6) termination of catalytic decomposition of gas molecules, and (7) graphite precipitation.

The main issues with graphene growth are the control of the number of layers (and stacking order) and crystallinity. When C solubility in a metal is low (such as in Cu), there is almost no C precipitation (step 7) and graphene growth is surface mediated, preferentially growing monolayer graphene. Monolayer graphene growth also benefits from a self-limited growth mechanism (i.e., once the metal surface is fully covered by graphene, it loses its catalytic activity for C precursor decomposition and thus limits more graphene layer growth). Reference Li, Cai, Colombo and Ruoff13 On the other hand, if C solubility in a metal is high (such as in Ni), graphene growth follows a C dissolution-segregation-precipitation (DSP) process (C first dissolves into the metal. When the whole metal, or the region near the surface, is saturated, a monolayer graphene forms on the metal surface by surface segregation. Then, more graphite layers precipitate out due to the decrease of C solubility with temperature decrease), Reference Eizenberg and Blakely14 which can be used to grow multilayer graphene. Reference Li, Cai, Colombo and Ruoff13 However, both monolayer and multilayer graphene can be grown by either surface mediation or DSP processes with appropriate kinetic control.
Control of layer number and stacking order
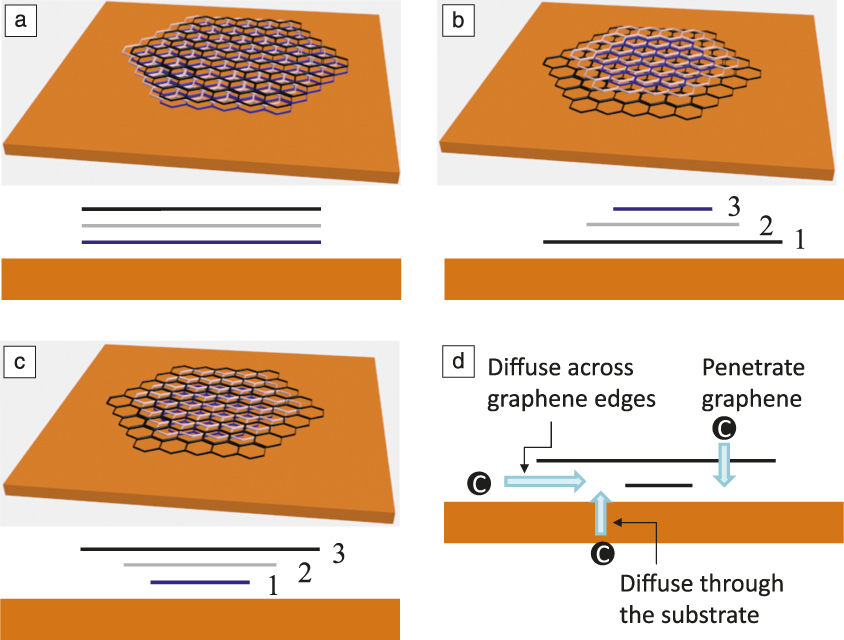
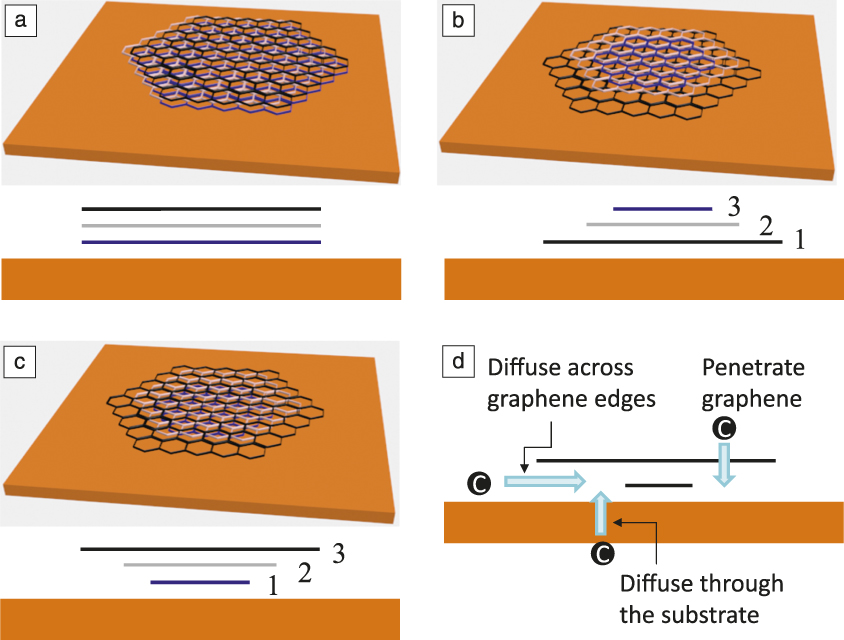
Few-layer graphene with a specific stacking order (e.g., AB-stacking) has unique electronic and optoelectronic properties as compared to monolayer graphene. Reference McCann and Koshino15 Adlayer flakes or multilayer graphene can grow on a metal with a low C solubility by surface mediation via three possible mechanisms, schematically shown in Figure 3 —synchronous growth, Reference Sun, Raji, Zhu, Xiang, Yan, Kittrel, Samuel and Tour16,Reference Liu, Gong, Wilt, Sakidja and Wu17 on-top growth, Reference Yan, Peng, Zhou, Li and Liu18–Reference Ta, Perello, Duong, Han, Gorantla, Nguyen, Bachmatiuk, Rotkin, Lee and Rummeli21 and underneath growth. Reference Ta, Perello, Duong, Han, Gorantla, Nguyen, Bachmatiuk, Rotkin, Lee and Rummeli21–Reference Wu, Zhai, Li and Yang30 In synchronous growth, all layers nucleate and grow simultaneously. In the case of on-top growth, graphene grows layer by layer on top of previous layers or multiple layers grow from the same nucleation site, although the upper ones grow more slowly. For underneath growth, the lower layers grow more slowly. In this case, C for the growth of the bottom layers is mainly supplied by catalytic decomposition of the C precursor on the catalyst surface that is not covered with graphene (see Figure 3d). for new layer growth the decomposed C species, mainly C atoms, diffuse across the graphene edges Reference Nie, Walter, Bartelt, Starodub, Bostwick, Rotenberg and McCarty22–Reference Li, Chou, Zhong, Liu, Dolocan, Zhang, Zhou, Ruoff, Chen and Cai24 or through the substrate into the interface between existing graphene layers and the underneath substrate to occur. Reference Fang, Hsu, Song, Birdwell, Amani, Dubey, Dresselhaus, Palacios and Kong26–Reference Hao, Wang, Liu, Chen, Wang, Tan, Nie, Suk, Jiang, Liang, Xiao, Ye, Dean, Yakobson, McCarty, Kim, Hone, Colombo and Ruoff28 It has also been theoretically proposed that C may penetrate graphene layers, but to the best of our knowledge, there has been no experimental proof of this phenomenon. Reference Wu, Zhai, Li and Yang30
Schematics of multilayer graphene growth models. (a) Synchronous growth—all layers nucleate and grow simultaneously. (b) On-top growth—graphene grows layer by layer on top of previous layers or multiple layers grow from the same nucleation site, although the upper ones grow more slowly, and (c) underneath growth—the lower layers grow more slowly. The upper diagrams are perspective views and the lower ones are cross-sectional views. The numbers in (b) and (c) represent the growth sequence of graphene layers. (d) Schematics of possible paths for C reaching the bottom layers.
Both hydrogen and oxygen play important roles in multilayer graphene growth. Hydrogen may passivate a graphene edge to prevent its bonding to the metal surface so as to lower the barrier for C atoms diffusing across it. Reference Zhang, Wang, Xin, Yakobson and Ding29 Oxygen is also crucial in helping hydrocarbon precursors to completely dehydrogenate in order to provide C atoms. Reference Hao, Wang, Liu, Chen, Wang, Tan, Nie, Suk, Jiang, Liang, Xiao, Ye, Dean, Yakobson, McCarty, Kim, Hone, Colombo and Ruoff28 A high purity Cu substrate with a smooth surface and C precursors with low partial pressure are preferred for monolayer growth with almost no adlayers. Otherwise, multilayer growth may result. Reference Liu, Zhou, Cheng, Chen, Lin, Qu, Bai, Ivanov, Liu, Huang and Duan31–Reference Lee and Ye33
It should be noted that in contrast to the unambiguous identification of the underneath growth sequences, there is still lack of direct experimental proof for the synchronous growth and on-top growth models, and these need to be further investigated.
On the other hand, the number of layers of graphene grown by the DSP process can be controlled kinetically. For example, C solubility in the substrate can be tuned by temperature or metal alloy composition; Reference Wu, Chou, Ji, Wu, Chen, Jiang, Hao, Kang, Ren, Piner and Ruoff34,Reference Addou, Dahal, Sutter and Batzill35 the amount of dissolved C can be controlled by the thickness of the substrate; Reference Kim, Zhao, Jang, Lee, Kim, Kim, Ahn, Kim, Choi and Hong8 and C precipitation can also be controlled by its concentration gradient from the surface to the inner bulk and the cooling conditions. Reference Yu, Lian, Siriponglert, Li, Chen and Pei6,Reference Weatherup, Dlubak and Hofmann36,Reference Xiao, Wu, Lv, Wu and Qian37
Controlling the stacking order of multilayer graphene is crucial as well. However, current understanding of their formation is superficial, and results in the literature are contradictory. Ta et al. suggested that graphene flakes growing on top of the first full layer are non-AB-stacked, while those grown by the underneath growth mechanism are highly oriented AB-stacked. Reference Ta, Perello, Duong, Han, Gorantla, Nguyen, Bachmatiuk, Rotkin, Lee and Rummeli21 On the other hand, most of the other work reported a high degree of AB-stacked order comes from the suggested on-top growth mode, Reference Yan, Peng, Zhou, Li and Liu18–Reference Han, Lee and Yeo20 while bilayer graphene through the underneath growth model shows non-AB-stacked order. Reference Nie, Wu, Xing, Yu, Bao, Pei and McCarty23,Reference Fang, Hsu, Caudillo, Song, Birdwell, Zakar, Kalbac, Dubey, Palacios, Dresselhaus, Araujo and Kong25
Engineering of large-area graphene single crystals
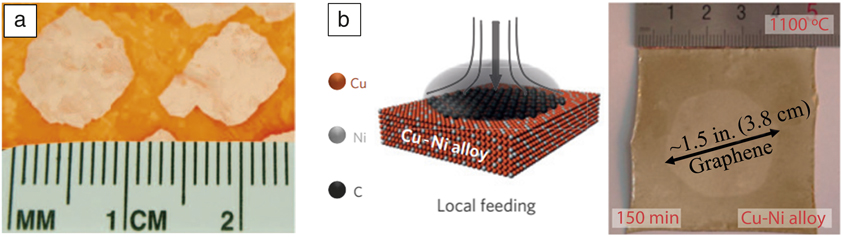
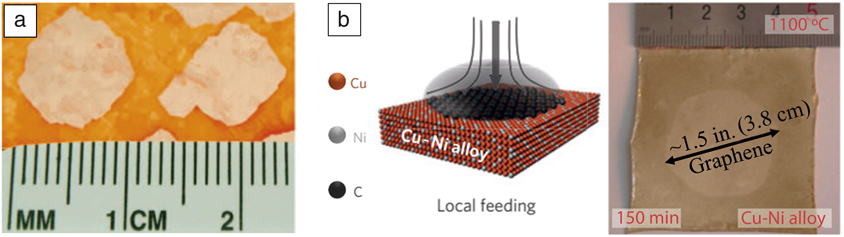
Normally, graphene nuclei on metal surfaces are not aligned. These misaligned nuclei grow and finally merge together, resulting in a polycrystalline graphene film with grain boundaries containing pentagonal and heptagonal carbon rings. Reference Li, Cai, Colombo and Ruoff13,Reference Huang, Ruiz-Vargas, van der Zande, Whitney, Levendorf, Kevek, Garg, Alden, Hustedt, Zhu, Park, McEuen and Muller38 To improve its crystallinity, one straightforward strategy is to reduce the nucleation density and achieve a large-area single crystal from one nucleus. The nucleation density can be reduced using a Cu substrate with high purity and a smooth surface, a low carbon precursor partial pressure, and a high growth temperature. Reference Li, Magnuson, Venugopal, An, Suk, Han, Borysiak, Cai, Velamakanni, Zhu, Fu, Vogel, Voelkl, Colombo and Ruoff39,Reference Yan, Lin, Peng, Sun, Zhu, Li, Xiang, Samuel, Kittrell and Tour40 Oxygen can also significantly suppress graphene nucleation while increasing graphene growth rate. Reference Hao, Bharathi, Wang, Liu, Chen, Nie, Wang, Chou, Tan, Fallahazad, Ramanarayan, Magnuson, Tutuc, Yakobson, McCarty, Zhang, Kim, Hone, Colombo and Ruoff41–Reference Guo, Jing, Xiao, Zhou, Lin and Wang43 Both centimeter-sized graphene single crystals ( Figure 4a) Reference Hao, Bharathi, Wang, Liu, Chen, Nie, Wang, Chou, Tan, Fallahazad, Ramanarayan, Magnuson, Tutuc, Yakobson, McCarty, Zhang, Kim, Hone, Colombo and Ruoff41 and rapid graphene lateral growth of 60 μm/s Reference Xu, Zhang, Qiu, Zhuang, Zhang, Wang, Liao, Song, Qiao, Gao, Hu, Liao, Liao, Yu, Wang, Ding, Peng and Liu44 have been achieved with the assistance of oxygen. A Cu substrate alloyed with Ni also showed rapid growth. Reference Wu, Zhang, Yuan, Xue, Lu, Liu, Wang, Wang, Ding, Yu, Xie and Jiang45 By tuning C solubility in the alloy, an appropriate amount of C can be dissolved in the near surface region and then quickly attached to the graphene nuclei. This is much faster than C supplied from the gas phase followed by the adsorption-dehydrogenation-diffusion process. Reference Li, Colombo and Ruoff2 By locally feeding the carbon precursor, a ∼1.5-in. (3.8-cm) graphene single crystal was grown on a Cu85Ni15 substrate (Figure 4b). Reference Wu, Zhang, Yuan, Xue, Lu, Liu, Wang, Wang, Ding, Yu, Xie and Jiang45
Growth of large-area graphene single crystals from individual nuclei. (a) Centimeter-sized graphene domains (pale area) on Cu (orange area). Reproduced with permission from Reference Hao, Bharathi, Wang, Liu, Chen, Nie, Wang, Chou, Tan, Fallahazad, Ramanarayan, Magnuson, Tutuc, Yakobson, McCarty, Zhang, Kim, Hone, Colombo and RuoffReference 41. © 2013 AAAS. (b) Left: schematic of the local gas feed; right: optical image of the ∼1.5-in. (3.8-cm) graphene single crystal (pale area) grown on Cu85Ni15 at 1100°C in 150 min. Reproduced with permission from Reference Wu, Zhang, Yuan, Xue, Lu, Liu, Wang, Wang, Ding, Yu, Xie and JiangReference 45. © 2015 Nature Publishing Group.
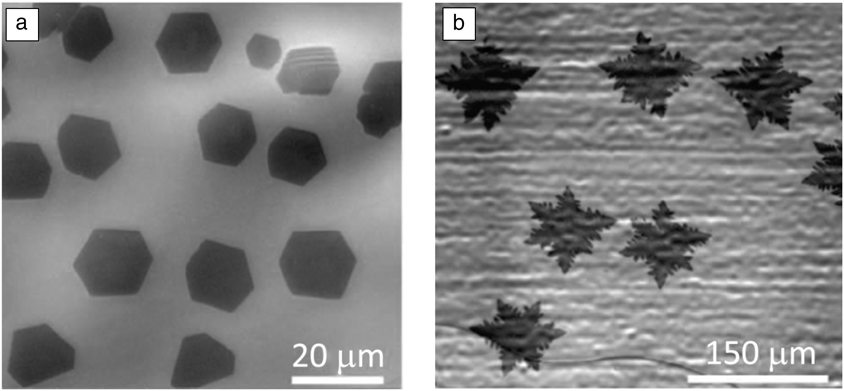
Morphologies of grown graphene crystals depend on both the growth conditions and the substrate crystallographic orientation. Reference Geng, Wang and Yu46 Typically, they are compact hexagons with sharp edges ( Figure 5a) or four- or six-lobed shapes with protruding branches or dendritic edges (Figure 5b), whose growth involves two mechanisms. The sharp-edge hexagons, arising from the kinetic Wulff construction (which gives a shape of the crystal with its minimized surface Gibbs free energy) have zigzag edges and grow by an edge-attachment-limited growth mechanism. That is, graphene growth is limited by the rate of C incorporation into its lattice rather than C supply by diffusion from the surrounding environment, a diffusion (mass transport)-limited process, which results in the protruding branches and the dendritic edges. Reference Hao, Bharathi, Wang, Liu, Chen, Nie, Wang, Chou, Tan, Fallahazad, Ramanarayan, Magnuson, Tutuc, Yakobson, McCarty, Zhang, Kim, Hone, Colombo and Ruoff41,Reference Artyukhov, Liu and Yakobson47,Reference Jacobberger and Arnold48
Scanning electron microscope images of graphene single crystals with (a) sharp edges and (b) dendritic edges. Reproduced with permission from Reference Hao, Bharathi, Wang, Liu, Chen, Nie, Wang, Chou, Tan, Fallahazad, Ramanarayan, Magnuson, Tutuc, Yakobson, McCarty, Zhang, Kim, Hone, Colombo and RuoffReference 41. © 2013 AAAS.

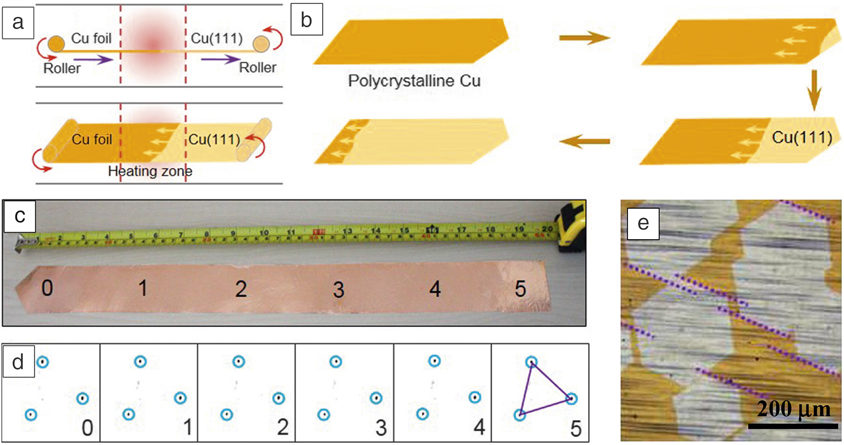
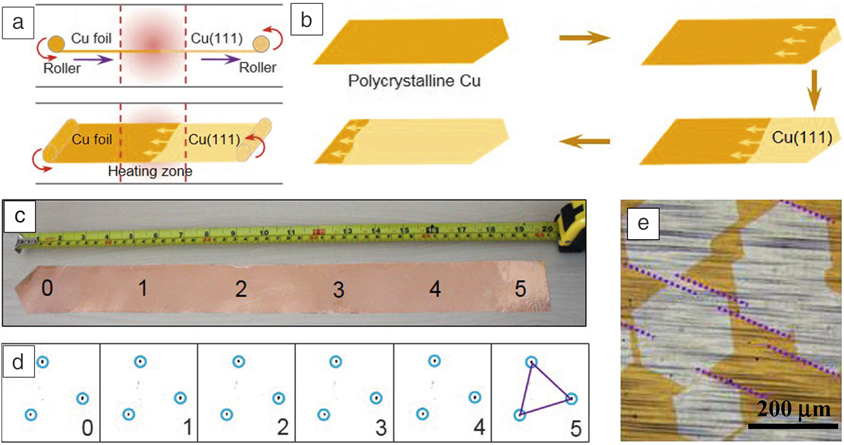
Another strategy is to grow aligned graphene nuclei, which then grow and merge seamlessly to form a large single crystal. The advantage of this strategy is the much faster growth rate when many graphene nuclei grow simultaneously versus growth from a single nucleus. For example, because the lattice mismatch between graphene and Cu(111) is small (4%), with appropriate conditions, compact hexagonal graphene nuclei can epitaxially grow on Cu(111) with edge alignment parallel to 〈101〉. Reference Nguyen, Shin, Duong, Kim, Perello, Lim, Yuan, Ding, Jeong, Shin, Lee, Chae, Vu, Lee and Lee49 With the development of a technique to produce a large-area Cu(111) single-crystal foil, a graphene single crystal with size up to 5 cm × 50 cm has been achieved, demonstrating a promising solution for the preparation of large-area graphene single crystals ( Figure 6 ). Reference Xu, Zhang, Dong, Yi, Niu, Wu, Lin, Yin, Li, Zhou, Wang, Sun, Duan, Gao, Jiang, Wu, Peng, Ruoff, Liu, Yu, Wang, Ding and Liu50
Synthesis of large-area graphene single crystals by seamless stitching of aligned graphene domains. (a) Schematic of the experimental design for the continuous production of a single-crystal Cu(111) foil with a hot temperature zone at the central area of a furnace tube. The temperature gradient provides the driving force to move Cu grain boundaries from the low-temperature region to the high-temperature region. In practice, the continuous motion of grain boundaries can be realized by continuously moving the substrate. (b) The schematic evolution of the Cu(111) grain growth, which starts from a single nucleus at the tapered end of the foil. (c) Photograph of a 5 cm × 50 cm single-crystal Cu(111) foil. (d) Representative low-energy electron diffraction patterns from six different regions as marked with the number in (c) show aligned orientation. (e) Optical image of graphene domains on the Cu(111) surface. The parallel dotted lines indicate all the graphene domains have aligned orientation, which ensures a seamless stitching of these domains to form a single crystal. Reproduced with permission from Reference Xu, Zhang, Dong, Yi, Niu, Wu, Lin, Yin, Li, Zhou, Wang, Sun, Duan, Gao, Jiang, Wu, Peng, Ruoff, Liu, Yu, Wang, Ding and LiuReference 50. © 2017 Elsevier.
Low-temperature growth
Considering the high growth temperatures (˃1000°C), which are normally required in the previously mentioned conventional route to obtain high-quality graphene, low-temperature growth is desired to reduce energy consumption and the associated cost, improve system safety, and more importantly, integrate with present semiconductor manufacturing technologies, or grow graphene directly on flexible substrates.
Two issues need to be resolved to achieve high-quality graphene growth at low temperatures—an efficient supply of active C species and an appropriate attachment of intermediate species to a graphene crystal to form an ordered structure. The efficiency of the C supply can be improved by using carbon precursors with a low decomposition or a high adsorption energy such that the adsorbed carbon precursors can have enough time to decompose before desorption. Reference Choi, Li, Cui, Fan, Zhang, Zeng and Zhang51 Various carbon precursors other than methane have been explored, such as aromatic hydrocarbons (e.g., benzene and p-terphenyl), Reference Choi, Li, Cui, Fan, Zhang, Zeng and Zhang51–Reference Lee, Lee, Jo, Lee, Lee, Park, Lee, Kim, Bong and Cho55 aliphatic gases with low decomposition energy (e.g., acetylene), Reference Weatherup, Dlubak and Hofmann36,Reference Weatherup, Bayer, Blume, Ducati, Baehtz, Schloegl and Hofmann56 liquid oxygenated carbon (e.g., methanol and ethanol), Reference Guermoune, Chari, Popescu, Sabri, Guillemette, Skulason, Szkopek and Siaj57 and polymers (e.g., poly (methyl methacrylate). Reference Li, Wu, Wang, Fan, Zhang, Zhai, Zeng, Li, Yang and Hou52 Growth temperatures from 100–1000°C have been reported. However, it should be noted that when using liquid or solid carbon precursors, they may adsorb onto the inside wall of the reaction chamber. When running the system, even without deliberately introducing carbon precursors, the desorption of those adsorbates may interfere with subsequent graphene growth, as it has been demonstrated that even a trace amount of carbon may promote graphene growth. Reference Qing, Jia, Li, Liu, Li, Peng, Deng, Zhang, Li, Ruoff and Li58 Besides, some of the studies require a high-temperature annealing process for the substrate before graphene growth at low temperature. Reference Choi, Li, Cui, Fan, Zhang, Zeng and Zhang51–Reference Zhang, Lee, Piner, Kholmanov, Wu, Li, Ji and Ruoff53 The whole process is not a true low-temperature process because a high-temperature process is still involved. In addition, as just mentioned, the system may be contaminated by the liquid or solid carbon precursors, which also probably promote graphene growth during the high-temperature “annealing” process rather than during the expected low-temperature “growth” process. Another strategy is to use a substrate with a high catalytic activity such as Ni, which is more active than Cu in cracking the hydrocarbons. Reference Weatherup, Dlubak and Hofmann36,Reference Weatherup, Bayer, Blume, Ducati, Baehtz, Schloegl and Hofmann56 Energy-assisted CVD techniques such as plasma-enhanced CVD can also help to decompose hydrocarbons. Reference Boyd, Lin, Hsu, Teague, Chen, Lo, Chan, Su, Cheng, Chang, Wu and Yeh59
To continue perfecting the graphene structure, a mixture of polycyclic aromatic and aliphatic hydrocarbons were used. It was suggested that the aliphatic carbon species could incorporate small carbon fragments into defect sites to decrease defect density. Reference Lee, Lee, Jo, Lee, Lee, Park, Lee, Kim, Bong and Cho55 It was also reported that high-quality graphene can be achieved with a slow growth rate, which allowed the intermediate hydrocarbon species attached to graphene crystals to have sufficient time to reorganize or shed hydrogen atoms. If the growth rate is too fast, these disordered intermediates can be trapped in the crystal, leading to local disruptions of the lattice or coordination defects. Reference Jacobberger, Levesque, Xu, Wu, Choubak, Desjardins, Martel and Arnold60
Challenges and prospects
Despite the advances in graphene synthesis achieved in the last few years, there are still many challenges. Neither the uniformity nor the stacking order of multilayer graphene can be easily achieved by kinetic control unless one grows a large-area multilayer graphene single crystal, which is limited to the submillimeter scale. Reference Li, Chou, Zhong, Liu, Dolocan, Zhang, Zhou, Ruoff, Chen and Cai24,Reference Hao, Wang, Liu, Chen, Wang, Tan, Nie, Suk, Jiang, Liang, Xiao, Ye, Dean, Yakobson, McCarty, Kim, Hone, Colombo and Ruoff28 Defect control is another challenge. Although tuning the graphene nucleation density, and hence the number of grain boundaries, can solve this problem to some extent, there is still a lack of knowledge on the formation and control of many other defects such as vacancies, a distorted/disordered lattice in the grains, wrinkles, and functional groups. Quality degradation and a cost increase because of a necessary transfer process are also issues, and direct growth on target substrates is always preferred.
Acknowledgments
The authors acknowledge support from the China 985-Project and the China 863-Project, No. 2015AA034202.

Fangzhu Qing is an assistant professor at the University of Electronic Science and Technology of China (UESTC). She received her PhD degree in materials science from Sichuan University, China. She then joined the State Key Laboratory of Electronic Thin Films and Integrated Devices and School of Microelectronics and Solid State Electronics, UESTC, in 2015. Her research interests focus on the synthesis and functionalization of graphene films and their applications in biotechnology. Qing can be reached by email at qingfz@uestc.edu.cn.

Changqing Shen is a master’s candidate at the University of Electronic Science and Technology of China. He received his BS degree from the Southwest University of Science and Technology, China, in 2016. His research interests focus on the synthesis of large-area graphene single crystals and bilayer graphene single crystals and their applications. Shen can be reached by email at 937775701@qq.com.

Ruitao Jia is a doctoral candidate at the University of Electronic Science and Technology of China (UESTC). He received his MS degree from Northwestern Polytechnical University in 2015, and then joined UESTC as a research assistant. His research interests include the synthesis of graphene and other two-dimensional materials. Jia can be reached by email at rtjia1015@163.com.
Longlong Zhan is a master’s candidate at the University of Electronic Science and Technology of China (UESTC). He received his BS degree from UESTC in 2017. His research interests include developing low-cost graphene synthesis techniques such as low-temperature growth of graphene and direct growth on dielectric substrates. Zhan can be reached by email at 1172621627@qq.com.

Xuesong Li has been a professor at the University of Electronic Science and Technology of China (UESTC) since 2015. He received his BS degree in 2000 and MS degree in 2003 from Tsinghua University, China, and PhD degree in 2007 from Rensselaer Polytechnic Institute. After completing postdoctoral research at The University of Texas at Austin and the IBM T.J. Watson Research Center, he co-founded Bluestone Global Tech, Ltd. and LasLumin LLC for graphene commercialization. His research interests focus on synthesis and applications of graphene films and other two-dimensional materials. Li can be reached by email at lxs@uestc.edu.cn.