
I. INTRODUCTION
Study of core–shell nanoparticles (CSNs) has gotten appreciable attention recently due to their diverse possible applications in medicine, catalysis, optics, magnetic devices, and energy storage. Reference Song, Wang and Zhang1–Reference Dong, Pan, Xu, Zheng, Sow, Wu, Xu and Chen6 The composite aspect of CSNs provides a unique opportunity to develop novel properties within the nanoparticles (NPs), including highly useful magnetic, optical, catalytic, and chemical properties. Among various CS structures, the magnetic CSNs are highly promising for applications in giant-magnetoresistance based spin valves, magnetic storage devices, spintronic devices, and MRI imaging. One of the major limitations of magnetic NPs is that superparamagnetism (SP) limits the size reduction of the NPs, whereas their smaller size typically offers superior properties that are highly desirable for modern devices. By developing different magnetic phase in the CSNs, overcoming the SP limit and attaining the desired small NP size becomes possible, thus offering an opportunity to develop devices with exclusive properties. Reference Skumryev, Stoyanov, Zhang, Hadjipanayis, Givord and Nogués7,Reference Evans, Yanes, Mryasov, Chantrell and Chubykalo-Fesenko8 A feature of typical CSNs is structurally different phase formation in the core and shell. The structural difference results in having a rough and disordered interface between core and shell through defect formation and amorphization. Reference Nogués, Sort, Langlais, Skumryev, Suriñach, Muñoz and Baró9 The effect of this structural disorder and defects on the magnetic properties of the CSNs is not well understood yet. A few studies have shown that the presence of defects (e.g., cation or anion vacancies) may enhance the exchange biasing Reference Berkowitz, Rodriguez, Hong, An, Hyeon, Agarwal, Smith and Fullerton10,Reference Li, Zhao, Wang, Tang, Zhu, Lee, Cao, Cai, Guo, Wang, Ling, Pi, Jin, Zhang, Wang, Wang, Ju and Yang11 or overall magnetism whereas others claim that defects have a detrimental effect on their magnetic properties. Reference Juhin, López-Ortega, Sikora, Carvallo, Estrader, Estradé, Peiró, Baró, Sainctavit, Glatzel and Nogués12 Skumryev et al. Reference Skumryev, Stoyanov, Zhang, Hadjipanayis, Givord and Nogués7 reported adverse effect of interface roughness on the exchange interaction exhibited in Co@CoO CSNs whereas theoretical calculation made by Evans et al. showed that interface roughness enhances the coupling between FM and AFM part of the CSN structure leading to a greater degree of the exchange biasing effect in Co@CoO. Reference Evans, Bate, Chantrell, Yanes and Chubykalo-Fesenko13 Our group has developed a novel hydrothermal nanophase epitaxy technique (HNE) for synthesis of well-ordered crystalline CSNs. Reference Dey, Hossain, Mayanovic, Wirth and Gordon14 Our HNE technique provides an opportunity for epitaxial synthesis of CSNs with a relatively defect-free and atomically continuous core–shell interface; the technique was inspired by mineral zoning formation under hydrothermal conditions. Reference Jamtveit, Jamtveit and Meakin15 We have successfully been able to synthesize α-Cr2O3@α-M x Cr2−x O3−δ CSNs by incorporation of several transition metals M (Co, Ni, Mn, Fe, Cu) in α-Cr2O3-based shell. Our α-Cr2O3@α-M x Cr2−x O3−δ CSNs consistently exhibit either ferromagnetic (FM) or ferrimagnetic (FiM) characteristics in the shell compared to the antiferromagnetic (AFM) α-Cr2O3 core. Development of two different magnetic phases in such inverse CSNs presents opportunity of tailoring their magnetic properties and to develop their multifunctionality. In this paper, we report our most recent findings on the synthesis, structural and magnetic characterization, and ab-initio theoretical calculations of α-Cr2O3@α-Mn x Cr2−x O3−δ CSNs.
II. EXPERIMENTAL
A. Synthesis of CSNs
The Cr2O3 NPs were synthesized according to the procedures described by Farzaneh et al. Reference Farzaneh16 and as reported by our group previously. Reference Dey, Hossain, Mayanovic, Wirth and Gordon14,Reference Hossain, Dey, Mayanovic and Benamara17 Synthesis of the α-Cr2O3@α-Mn0.35Cr1.65O2.94 CSNs was made by hydrothermal nano-phase epitaxy of Mn-chromia shell over our Cr2O3 NPs ∼190 °C; the details of this synthesis can be found in our recent publication. Reference Hossain, Dey, Mayanovic and Benamara17
B. X-ray photoelectron spectroscopy (XPS)
For XPS analysis, an Al Kα source was used with a characteristic energy of 1486.6 eV. For calibration of the source and analyzer, the Ag 3d 5/2 (FWHM = 0.36 eV) peak with a characteristic energy of 368.26 eV was used. The Casa XPS 2.3.16 was used for analysis and peak fitting of the XPS spectra. Both the high resolution and survey scan were calibrated with respect to the C 1s peak (284.8 eV). The Shirley background and Gaussian–Lorentzian product GL(30) functions were used for the background and peak fitting, respectively.
C. Transmission electron microscopy (TEM)
Transmission electron microscopy (TEM) samples were prepared by dispersing the α-Cr2O3@α-Mn0.35Cr1.65O2.94 CSNs in hexane followed by quick submersion of a carbon lacey grid. TEM images were collected by using Titan 80-300 (FEI Company, Hillsboro, Oregon) with the field emission gun operated at 300 keV located at the University of Arkansas Nano-Bio Materials Characterization Facility. ImageJ software was used for all the analysis of TEM images.
D. X-ray diffraction (XRD)
Room temperature XRD measurement were made by using a Bruker D8 Discover powder diffractometer (Bruker AXS, Karlsruhe, Germany) operating at 40 kV and 40 mA and using Cu Kα radiation as a X-ray source. The Topas 4.2 full pattern refinement program 18 was used for Rietveld refinement Reference Dinnebier, Müller, Mittemeijer and Welzel19 and structural characterization of the CSNs. The Rietveld refinement was accomplished based on the ICSD #173470 (space group #167) corundum structure. The background function of the XRD pattern was modeled by using a Chebyshev polynomial of 9th order, whereas zero error and incident beam profile were determined using a modified Thompson-Cox-Hasting pseudo-Voigt (PV-TCHZ) peak function. The amorphous like background originated from the glass substrate used to hold the CSNs.
E. Magnetic measurement
Magnetic measurements of the CSNs were made in the field cooled (FC) and zero field cooled (ZFC) condition using a Quantum Design PPMS-VSM instrument (at CCMR at Cornell; Quantum Design Inc., San Diego, California). The field cooled M(H) and M(T) magnetization measurement were accomplished by cooling the sample from 330 K to 5 K in a field of 20 kOe and 500 Oe, respectively.
F. First principles calculations
The first principles calculations were made using the local spin density approximation method
Reference Liechtenstein, Anisimov and Zaanen20
(LSDA) implemented in Quantum Espresso.
Reference Giannozzi, Baroni, Bonini, Calandra, Car, Cavazzoni, Ceresoli, Chiarotti, Cococcioni, Dabo, Corso, de Gironcoli, Fabris, Fratesi, Gebauer, Gerstmann, Gougoussis, Kokalj, Lazzeri, Martin-Samos, Marzari, Mauri, Mazzarello, Paolini, Pasquarello, Paulatto, Sbraccia, Scandolo, Sclauzero, Seitsonen, Smogunov, Umari and Wentzcovitch21
A rhombohedral primitive unit cell of α-Cr2O3 with a space group of
 $R\bar 3cH$
(ICSD 173470) was used for the self-consistent field calculations. The α-Mn(III)Cr3O6 and α-Mn(II)Cr3O6 structures were constructed by replacement of one of the Cr (out 4 cation sites) with Mn. The Mn2+ state in the α-Mn(II)Cr3O6 structure was achieved by introducing a homogeneous background charge in the computational cell. Calculation convergence was achieved with a net antiferromagnetic configuration (+-+-) for the α-Cr2O3 structure. The Brillouin zone integral 4 × 4 × 4 k point grid was used based on the Monkhorst–Pack scheme.
Reference Monkhorst and Pack22
The cutoff energies for the plane wave and augmentation charge were 30 and 300 eV, respectively, and energy convergence was achieved with a value of 0.0979610 μeV by setting the atomic energy convergence to 1 × 10⁻⁸ eV. Structural relaxation was accomplished for all of the structures and the relaxed structural parameters were used in the final calculation. Density of states (DOS) and the projected density of state (pDOS) were obtained by using the tetrahedron method with an 8 × 8 × 8 k-point grid mesh. For spin polarization calculations, the rotationally invariant LSDA+U method introduced by Liechtenstein et al.
Reference Liechtenstein, Anisimov and Zaanen20
and the Coulomb repulsion parameter (U) were used to ensure better agreement with measured data. The Hubbard parameter U ∼4 eV was used as in Shi et al.
Reference Shi, Wysocki and Belashchenko23
and Perdew–Zunger exchange-correlational
Reference Perdew and Zunger24
norm conserving pseudopotentials were used for all the atoms. The calculated equilibrium lattice parameters for the primitive cell using LSDA+U are a = b = 5.09491 Å and c = 5.50707 Å, whereas the measured values for the α-Cr2O3 structure are a = b = 4.96070 Å and c = 5.36200 Å.
Reference Yang25
Thus, a small expansion of the equilibrium α-Cr2O3 structure is observed.
III. RESULTS AND DISCUSSION
Figure S1 shows the XRD data measured from the α-Cr2O3@α-Mn0.35Cr1.65O2.94 core shell nanoparticles. We have made a more improved Rietveld refinement fit of the XRD data that yields more consistent structural results than those that we initially reported. Reference Hossain, Dey, Mayanovic and Benamara17 The core and shell were regarded as separate phases in the Rietveld refinement of the XRD measured from the CSNs. As shown in Fig. S1, the fit is consistent with the corundum structured chromia phase in both the core and shell regions. The Rietveld refinement convergence of fit was achieved with an Rwp value of 2.24 and goodness of fit value of 0.65. The lattice parameter values of the fit data for the core and shell of the CSNs are shown in Table SI. The site occupancy values of the elements in the fit are consistent with a stoichiometric formula of α-Mn0.35Cr1.65O2.94 for the shell. The peak positions for the α-Mn0.35Cr1.65O2.94 shell occur at slightly lower angles compared to the peak position angle values for the core indicating a small expansion (0.6%) of the shell of the CSNs. This is consistent with the ionic radius of Mn (0.67 Å) being slightly larger than the ionic radius of Cr (0.61 Å). Reference Shannon26 The Rietveld refinement yielded a CSN average diameter value of 33.0(1) nm, which is consistent with the crystal size of 31.87(86) nm determined using the Scherrer formula. This was also substantiated from particle size distribution analysis using TEM (see Supplementary Material).
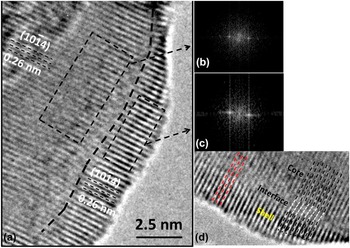
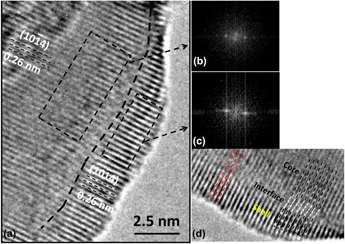
Figure 1(a) shows the high resolution transmission electron microscopy (HRTEM) image of a select CSN: additional HRTEM and TEM images and analysis can be found elsewhere.
Reference Hossain, Dey, Mayanovic and Benamara17
The morphology of our CSNs is typically quasi-spherical and faceted. The thickness of the shell of this CSN is approximately ∼2.5 nm. The core and shell of the CSN are separated by an interface indicated by black dashes in the figure. The same atomic planes are found to be continuous from the core to the shell of the CSN with the exception of slight disorder at the interface. As indicated in Fig. 1(a), the (
 $10\bar 14$
) atomic planes maintain a constant separation of 0.26 nm both in the core and shell of the CSN. Figure 1(b) and 1(c) are the fast Fourier transforms (FFT) of the core and shell regions of the CSN, which provides further evidence that the same structure is maintained in the core and shell of the CSN. Figure 1(d) shows the enlarged view of a section of the CSN with a slight mismatch between the atomic planes in the core–shell interface due to a shift of only one atomic plane between the core and shell. This is attributed to a missing crystalline atomic plane, which is an indication of the presence of a dislocation. Also this mismatch is not present throughout the entire region of the CSN, as shown in left side of Fig. 1(d). As was shown in our initial report on this study, the line scan energy-dispersive X-ray spectroscopy (EDX) analysis shows that the incorporated Mn dominates in the shell region of the CSNs.
Reference Hossain, Dey, Mayanovic and Benamara17
Fig. S3 shows the HRTEM image of a CSN showing faceting of the NPs. As has been reported elsewhere,
Reference Hossain, Dey, Mayanovic and Benamara17
the faceted NPs exhibit pseudo hexagonal/octagonal outlines consistent with the corundum structure. Fig. S3 shows the (0001), (
 $11\bar 20$
), and (
 $23\bar 43$
) facets of a select CSN.
TEM analysis of α-Cr2O3@α-Mn0.35Cr1.65O2.94 core shell nanoparticles. (a) HRTEM image of a select CSN showing clear distinction between core and shell of the NP, (b) FFT of the core, (c) FFT of the shell, and (d) an enlarged (and rotated) view of a core–shell interface region showing the presence of a dislocation (black and white dashes-right side); in the region indicated by the red-dashed lines, the atomic planes are continuous from core to shell with very minimal disorder.

Fig. S4 shows the X-ray photoemission spectroscopy (XPS) survey scan data of α-Cr2O3@α-Mn0.35Cr1.65O2.94 CSNs. The survey scan shows the presence of Cr, O and Mn in the sample; the C 1s peak in the XPS survey spectrum originates from carbon tape used to hold the sample and is used for energy calibration. Table SII shows the at.% of each of the elements present in the CSNs determined from the survey scan analysis. Presence of OH− in the sample results in a greater amount of imbalance in the at.% of the elements. The stoichiometric formula (α-Mn0.35Cr1.65O2.94) was estimated based on a spherical nanoparticle model: atomic percentages of the elements determined from XPS analysis and a 4 nm shell thickness determined from TEM analysis Reference Hossain, Dey, Mayanovic and Benamara17 were used for the stoichiometric formula calculation. The details of the calculation are provided in the Supplementary Material.
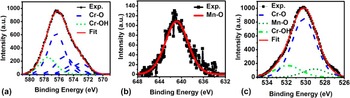
Figure 2 shows the high resolution XPS data of the α-Cr2O3@α-Mn0.35Cr1.65O2.94 CSNs. Figure 2(a) shows the high resolution Cr 2p 3/2 XPS peak. The peak fitting of the Cr 2p 3/2 was made by considering the multiplet splitting phenomena of the first-row transition metal elements. Along with the Cr–O bonding (which is consistent with the +3 oxidation state of Cr) multiplet-split peaks, a Cr–OH peak at 577.54 eV is found within the overall Cr 2p 3/2 peak shape. Figure 2(b) shows the Mn 2p 3/2 high resolution peak, which is representative of Mn–O bonding with Mn in the +2 oxidation state. The deconvolution of the O 1s peak [Fig. 2(c)] shows presence of Cr–O, Mn–O and Cr–OH bonding in the CSNs. Table SIII shows the high resolution XPS peak fitting data. The high resolution XPS data provide evidence of the substitution of Cr3+ by Mn2+ which creates charge imbalance in the structure. To maintain charge neutrality, there may be anion O or cation Cr vacancy formation in the shell region; this will create stressed regions and ultimately some distortion in the shell of the CSNs. Oxygen vacancy formation is evident from Rietveld refinement of the XRD data showing a sub-occupancy of O in the shell of the CSNs. Upon closer inspection of the HRTEM image shown in Fig. 1(d), it is evident that atomic planes that originate in the core end up being slightly distorted in the epitaxial shell, occasionally resulting in the formation of dislocations.
High resolution XPS data analysis of the (a) Cr 2p 3/2 peak, (b) Mn 2p 3/2 peak, and (c) O 1s peak measured from the α-Cr2O3@α-Mn0.35Cr1.65O2.94 core shell nanoparticles.

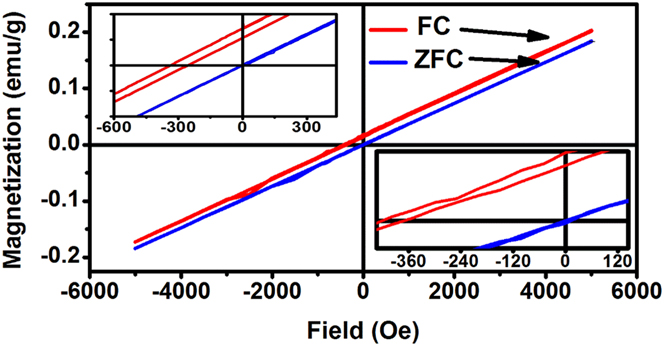
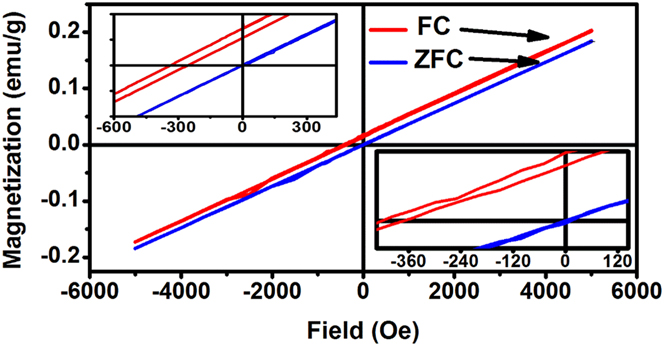
The magnetization (M) versus applied magnetic field (H) data measured from the α-Cr2O3@α-Mn0.35Cr1.65O2.94 CSNs at 5 K have been reported previously. Reference Hossain, Dey, Mayanovic and Benamara17 In the M(H), loop we do not observe evidence for an FM type hysteresis; an AFM configuration appears to predominate both in the core and shell of the CSNs. For the ZFC M(H) curve, a small amount of coercivity (Hc∼8 Oe) is observed. For the FC M versus H measurements, an enhancement of coercivity (Hc∼42 Oe) and a shift of the loop with respect to ZFC curve are observed. The exchange bias field, defined as (Hc1 + Hc2)/2, is observed to be 293 Oe. For a better comparison of our magnetization results, M(H) data of pure α-Cr2O3 NPs have also been measured at 5 K and are shown in Fig. 3. The coercivity value is approximately ∼4 Oe for ZFC and ∼23 Oe for the FC M(H) data of α-Cr2O3 NPs. The small coercivity in the pure α-Cr2O3 NPs and α-Cr2O3@α-Mn0.35Cr1.65O2.94 CSNs may originate from uncompensated surface, and in addition, for the CSNs, from interface spins. Reduced coordination of the atoms in the surface introduces uncompensated surface spins which are responsible for a small coercivity that is typically evident in pure α-Cr2O3 NPs. On the other hand, both the FC and the ZFC coercivity values are significantly larger (approximately doubled) for our α-Cr2O3@α-Mn0.35Cr1.65O2.94 CSNs. The incorporation of Mn2+ ions may introduce a greater degree of uncompensated surface and interface spins, in the core–shell architecture of the CSNs. As the TEM image in Fig. 1 shows, the interface regions contain nominal disorder due to presence of defects (dislocations, vacancies, etc.) which may result in canted spins at the interface. As mentioned above, our CSNs exhibit both faceted and quasi-spherical morphology. For quasi-spherical CSNs, the uncompensated surface spins rotate very readily to adopt lowest-energy orientations in an applied magnetic field. However, for the faceted CSNs, the tendency of rotation of uncompensated surface (and potentially interface) spins will depend upon the facet and upon the relative orientation (i.e., normal direction) of the facet and the applied magnetic field. Thus the uncompensated spins in case of the faceted CSNs likely contribute to a great extent in the overall enhancement of the coercivity. In addition, the faceted surfaces may potentially contain canted spins resulting from triangular spin cluster interactions that contribute to the surface anisotropy of the CSNs. Reference Swaminathan, Willard and McHenry27,Reference Swaminathan, McHenry, Poddar and Srikanth28 The (0001) faceting at the surface of the CSNs (see Fig S3), which coincides with the buckled honeycomb (BH) plane (described in more detail in Sec. III), is the most likely of the facets to contain such triangular spin clusters. Due to broken translational symmetry, Mn substitution (particularly in the middle of the surface clusters), and oxygen vacancies, it may be possible for localized canted spin configurations to result from such triangular spin cluster interactions, which may contribute to the overall exchange interaction behavior of the CSNs. Such canted spin configurations resulting from triangular spin clusters may potentially form at the (0001) core–shell interface also. More in depth analysis is required to determine precisely how the faceting of the CSNs factors in the overall magnetic characteristics of the CSNs.
Magnetization versus applied magnetic field (H) data of our α-Cr2O3 NPs at 5 K. The lower right inset is the enlarged view of M(H) data of α-Cr2O3 NPs near H = 0. For comparison, in the upper left inset we show the shift of the FC relative to ZFC hysteresis loop data measured from our α-Cr2O3@α-Mn0.35Cr1.65O2.94 CSNs and first reported in Hossain et al.
The small enhancement in coercivity for our CSNs may also be from FM/FiM regions dispersed in an overall AFM configuration in the shell of the NPs and localized in the vicinity of Mn-occupied cation sites. In addition, it is plausible that strains induced from local distortion upon Mn2+ incorporation and the resultant O vacancy formation in the shell may result in additional uncompensated spins on the surface of the CSNs. In their study of a epitaxial Cr2O3 thin film, Punugupati et al. Reference Punugupati, Narayan and Hunte29 suggested that there is strain induced ferromagnetism within the antiferromagnetic structure of the film. In addition, presence of O vacancies has been shown to induce FM characteristics in nanoparticles and thin films. Reference Yang, Gao, Zhang, Zhang, Shi and Xue30–Reference Niu, Hildebrandt, Schubert, Boscherini, Zoellner, Alff, Walczyk, Zaumseil, Costina, Wilkens and Schroeder32 Our α-Cr2O3@α-Co0.38Cr1.42O2.92 CSNs exhibit similar exchange bias (5 Oe) and coercivity value (45 Oe) whereas our α-Cr2O3@α-Ni0.58Cr1.42O2.88 and α-Cr2O3@α-Fe0.40Cr1.60O2.92 possess considerably larger exchange bias (100 and 365 Oe) and coercivity values (534 and 729 Oe), respectively. Reference Hossain, Dey, Mayanovic and Benamara17 Because the level of local structural disorder is quite similar, it is clear that the type of substitutional cation plays a major role in determining the overall magnetic properties in our CSNs.
Figure 4 (a) shows the 1 × 1 × 1 primitive structure used for calculation with a single Mn substitution in the cell. Figure 4(b) shows the calculated density of states (DOS) of the 1 × 1 × 1 primitive unit cell α-Cr2O3 structure. The energy band gap is 3.15 eV (defined as the separation between O 2p and Cr t2g orbitals) with the Fermi level position located at top of the valence band. Our theoretically calculated band gap value is very close to the experimental value of 3.2–3.4 eV Reference Cao, Qiu, Liang, Zhao and Zhu33–Reference Abdullah, Rajab and Al-Abbas35 verifying the validity of our modeling approach. Figure 4(c) and 4(d) shows the calculated pDOS of the Cr 3d and O 2p orbitals of the α-Cr2O3 structure. The highest occupied valence band is populated by hybridized Cr 3d and O 2p orbitals. The magnetic moment of Cr was calculated to be 3.11 μB which is very close to the experimental value of 2.76 μB. Reference Corliss, Hastings, Nathans and Shirane36 Figures 4(e) and 4(h) show the calculated DOS of the α-Mn(III)Cr3O6 and α-Mn(II)Cr3O6 structures, respectively. For the α-Mn(III)Cr3O6, the Fermi level crosses the down spin energy states, thus exhibiting a spin polarized half metallic behavior. For α-Mn(II)Cr3O6, the Fermi level is positioned just above the valence band maximum. Both structures show an appreciable shortening of band gap; the band gap of α-Mn(III)Cr3O6 and α-Mn(II)Cr3O6 is 2.55 and 2.27 eV, respectively. It should be noted that the incorporation of Mn at such a high percentage (25%) is above typical doping levels (i.e., at the level of a compound formation with a substantial substitution level) and has a considerable effect in the proportion of their electronic-level contributions. This is evident in the calculated pDOS shown in Figs. 4(f) and 4(i). The Mn3+ contribution is concentrated right above the Fermi level in the down spin state, coinciding with Cr2 and O’s contributions, in the α-Mn(III)Cr3O6 structure. This suggests an FM exchange coupling interaction between Mn and Cr2 mediated through O. Compared to Cr, Mn shows a more pronounced contribution in the deep levels of the valence band for both the α-Mn(III & II)Cr3O6 structures.
(a) The 1 × 1 × 1 primitive α-Cr2O3-based cell used in the first principles calculations (Mn is substituted for Cr3); primitive α-Cr2O3 structure (b) DOS plot (c) pDOS plot of Cr 3d orbitals (d) pDOS plot of O 2p orbitals; α-Mn(III)Cr3O6 structure (e) DOS plot (f) pDOS plot of Cr 3d and Mn 3d orbitals (g) pDOS plot of O 2p orbitals; α-Mn(II)Cr3O6 structure (h) DOS plot (i) pDOS plot of Cr 3d and Mn 3d orbitals (j) pDOS plot of O 2p orbitals. The vertical dotted line represents the Fermi level.

In addition, compared to the DOS of the α-Cr2O3 structure, the Cr1 and Cr4 pDOS contributions in the valence band region are shifted upwards by an amount of 0.6 and 0.88 eV for α-Mn(III)Cr3O6 and α-Mn(II)Cr3O6 structures, respectively. Another significant feature is that Cr2 shows a considerable up spin state eg orbital contribution in the conduction band which reduces the overall magnetic moment contribution. This effect is especially more pronounced in the α-Mn(III)Cr3O6 than in α-Mn(II)Cr3O6. Table I shows the calculated individual atomic magnetic moments of the cations in the α-Cr2O3, α-Mn(III)Cr3O6 and α-Mn(II)Cr3O6 structures. Formally, in the high spin state, Mn3+ and Mn2+ have 4 and 5 unpaired 3d electrons, respectively. The calculated magnetic moments of Mn in α-Mn(III)Cr3O6 and α-Mn(II)Cr3O6 structures are 4.68 and 4.98 μB, respectively, which is close to the experimental value of 4.90 and 5.92 μB. Reference Julien, Ait-Salah, Mauger and Gendron37,Reference Goldenberg38 Our calculations yield a net magnetic moment of −1.136 μB for α-Mn(III)Cr3O6 and −2.0447 μB for α-Mn(II)Cr3O6. Thus, our calculations show that Mn2+ substitution in chromia results in local ferrimagnetic characteristics that provide for a net magnetic moment in the structure.
Magnetic moment of individual atom in α-Cr2O3 and α-Mn(III & II)Cr3O6 structure.

Electron localization function (ELF) plotting can be quite useful for an in-depth analysis to reveal the cation–oxygen bond characteristics within a compound structure.
Reference Contreras-García, Pendás, Silvi and Manuel Recio39
Specifically, an ELF plot gives a normalized scale that represents a relative spatial distribution of electrons surrounding the core or nucleus of ions.
Reference Silvi and Savin40
The value of the ELF at any position, ranged from 0 to 1, represents the probability of finding an electron at that position.
Reference Becke and Edgecombe41
Fig. 5(a) shows the primitive α-MnCr3O6 structure within the (
 $3\bar 1\bar 2\bar 2$
) plane used for ELF analysis. Figures 5(b), 5(c), and 5(d) show the contour plot of electron density of atoms in the (
 $3\bar 1\bar 2\bar 2$
) plane for the α-Cr2O3, α-Mn(III)Cr3O6, and α-Mn(II)Cr3O6 structures, respectively. The extent of Cr–O electron overlap is more pronounced in the α-Cr2O3 structure than Mn–O electron overlap in the α-Mn(III & II)Cr3O6 structures. In addition, α-Mn(III)Cr3O6 shows a higher degree of Mn–O electron overlap than the α-Mn(II)Cr3O6 structure. Our analysis shows that the ranking of covalent bonding characteristics follows a sequence of α-Cr2O3 > α-Mn(III)Cr3O6 > α-Mn(II)Cr3O6. This result contrasts with what we have found for our Ni-substituted α-Cr2O3 structure exhibiting a greater degree of Ni–O than Cr–O covalent bonding characteristics.
Reference Hossain, Sakidja and Mayanovic42
(a) Primitive α-MnCr3O6 structure with (
 $3\bar 1\bar 2\bar 2$
) plane (b) ELF plot of primitive α-Cr2O3 structure (c) ELF plot of primitive α-Mn(III)Cr3O6 structure (d) ELF plot of primitive α-Mn(II)Cr3O6 structure (iso-surface level of 0.97).

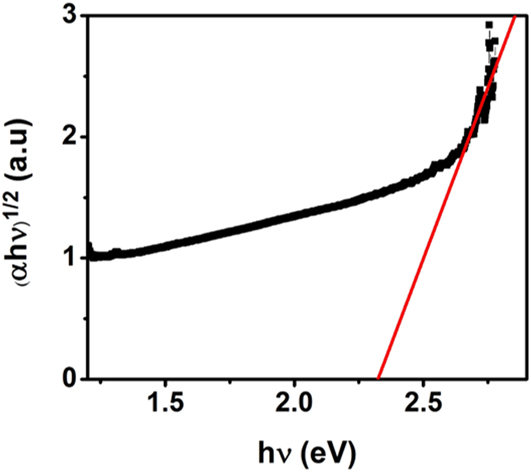
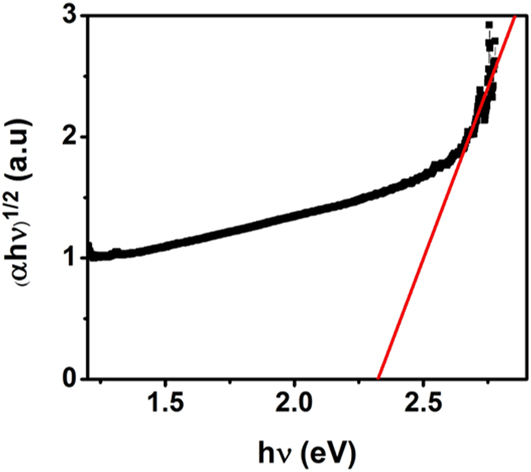
Figure 6 shows a Tauc (αhν)1/2 versus hν plot derived from our measured UV–Vis specta of α-Cr2O3@α-Mn0.35Cr1.65O2.94 CSNs. The fit of the linear part of the Tauc plot intersects the horizontal axis at 2.32(3) eV, thus providing evidence for ∼0.58 eV band-gap narrowing in our CSNs compared to a measured band gap of 2.90(9) eV of our α-Cr2O3 NPs. Furthermore, this is in very good agreement with our theoretical calculations described above. Shinde et al. Reference Shinde, Gujar, Lokhande, Mane and Han43 found a ∼0.2 eV band-gap reduction for 5% Mn-doped ZnO, whereas Yang et al. Reference Yang and Zhang44 reported a 0.036 eV band gap narrowing in 7% Mn-doped ZnO and Kim et al. Reference Kim and Park45 observed a band gap reduction of ∼0.12 and ∼0.4 eV for 8 and 22% Co-doped ZnO, respectively. Similar band gap narrowing was observed in our α-Cr2O3@α-Ni0.58Cr1.42O2.88 CSNs (in preparation). The band gap narrowing phenomenon in metal oxides has been attributed to the sp-d exchange interaction between the band electrons and 3d electrons of the dopant. Reference Lee, Ramdas and Aggarwal46,Reference Diouri, Lascaray and Amrani47 Our calculations are thus quite consistent with the extensive d–d exchange interaction between the substitutional Mn and host Cr atoms which leads to the negative and positive corrections to the conduction- and valence-band edges, respectively. As a consequence, this results in the apparent band gap narrowing in the α-Mn x Cr2−x O3−δ shell of the CSNs.
UV–Vis spectroscopy data of the α-Cr2O3@α-Mn0.35Cr1.65O2.94 CSNs.
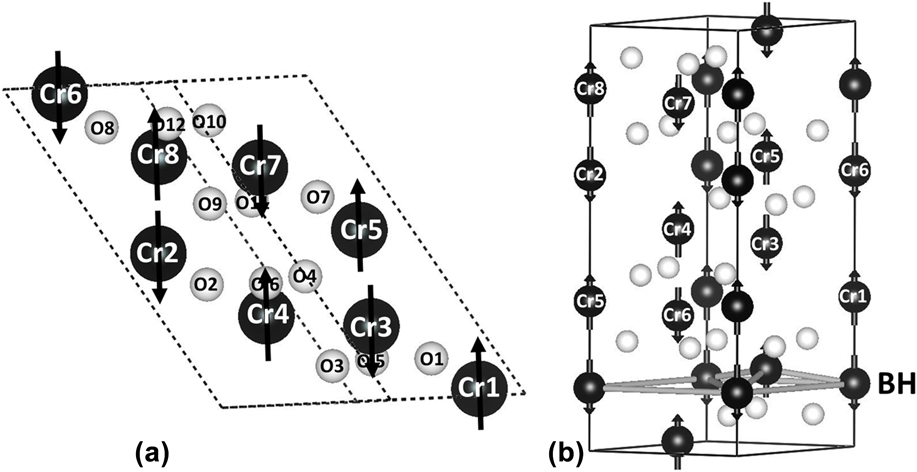
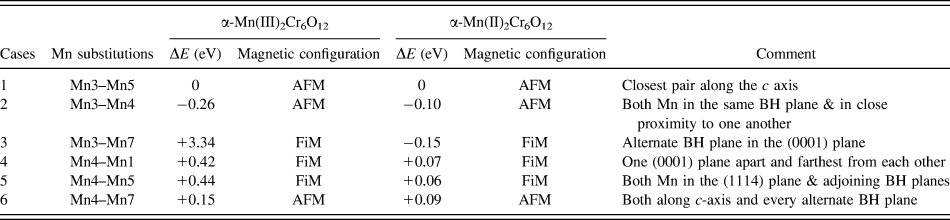
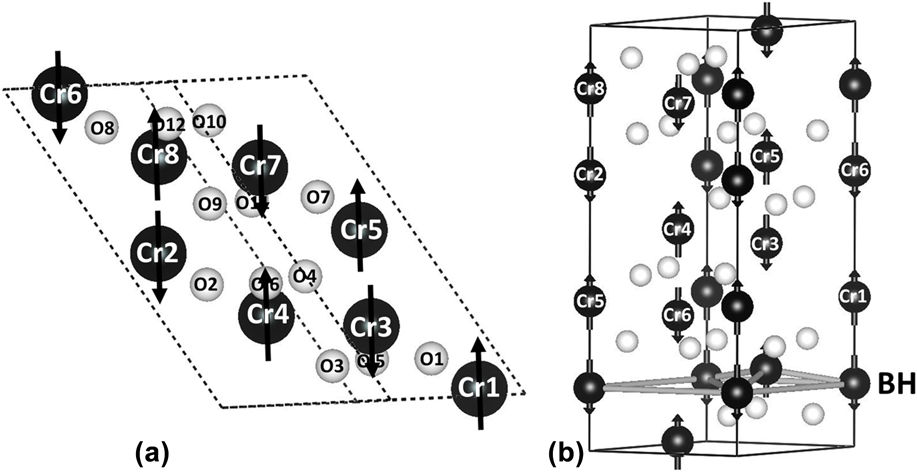
Previous studies of Mn(II) doping/substitution in metal oxides have shown interesting magnetic properties in metal oxides. Reference Wang, Sun, Rao and Jena48–Reference Choudhury and Choudhury51 From their theoretical modeling of Mn(II) doped ZnO thin films, Wang et al. Reference Wang, Sun, Rao and Jena48 showed that both the AFM and FM Mn–Mn configurations are likely to occur for ∼6.25% substitution whereas the AFM configuration is more favorable for 12.5% substitution. Similarly, Bououdina et al. Reference Bououdina, Omri, El-Hilo, El Amiri, Lemine, Alyamani, Hlil, Lassri and El Mir49 and Karmakar et al. Reference Karmakar, Neogi, Banerjee and Bandyopadhyay50 concluded from their studies of Mn doped nanocrystals and thin films, respectively, that a higher percentage of Mn incorporation in the ZnO system strengthens the preference of the Mn–Mn AFM configurations. From their investigations of the magnetic properties of Mn doped TiO2 NPs, Choudhury et al. Reference Choudhury and Choudhury51 concluded that low Mn doping levels favor FM ordering of Mn spins whereas increased amount of doping results in an impurity phase and predominantly paramagnetic behavior. In our present study of CSNs, the shell region represents a 17.5% Mn substitution and our magnetic measurements show prominent AFM with minor FM/FiM characteristics. Our experimental study suggests that at this higher level of doping, Mn prefers to maintain an AFM configuration by the exchange interaction mechanism. To test the role of Mn(III) and Mn(II) random substitutions in chromia, we have conducted first principles calculations on a 1 × 1 × 2 supercell that is comprised of a total of 20 atoms. Figure 7(a) shows the 1 × 1 × 2 supercell of α-Cr8O12 and Fig. 7(b) shows the corresponding atomic positions in the hexagonal unit cell. Table II shows the total energy and the corresponding magnetic configurations associated with the varied Mn substitutions in two out of the eight cation sites in the 1 × 1 × 2 supercell α-Mn(III&II)2Cr6O12 structure. Our calculations show that an AFM configuration (case 2) is the most stable for the α-Mn(III)2Cr6O12; the next favorable configuration is the FiM configuration (case 4) which differs in total energy by +0.68 eV/f.u. Comparatively, in the case of α-Mn(II)2Cr6O12, wherein the Mn(II) exhibits a relatively larger individual moment than Mn(III) (see Table I), there is relatively much smaller difference in terms of the total energy between the AFM and FiM configurations. Although the FiM configuration (case 3) has the lowest cohesive total energy, the total energy for the AFM configuration alternative (case 2) is only slightly higher i.e., +0.05 eV/f.u. Although this was not investigated in the present study, we expect that because of reduced coordination, the electronic states for a given surface are likely to result in a change in spin–spin coupling that was determined from our calculations for bulk α-Mn2Cr6O12, resulting in a formation of uncompensated surface spins. In general, our calculation results show that a dispersed Mn substitution for Cr typically leads to localized FiM configurations whereas a more concentrated Mn substitution for Cr results in localized AFM configurations in α-Mn(II)2Cr6O12. Our results are consistent with our magnetization measurements showing the presence of a weak FM/FiM character and predominantly AFM behavior of our CSNs.
(a) 1 × 1 × 2 supercell α-Cr2O3 structure (b) α-Cr2O3 unit cell. BH indicates the buckled honeycomb (0001) plane.
Energy value and stable magnetic configuration for two Mn substitution in 1 × 1 × 2 supercell structure.

IV. CONCLUSIONS
In conclusion, we have successfully synthesized α-Cr2O3@α-Mn0.35Cr1.65O2.94 CSNs using our hydrothermal nano-phase epitaxy technique. Structural characterization shows that the nanoparticles exhibit a core–shell architecture with a corundum structure throughout the core and shell. Furthermore, the CSNs are shown to have an epitaxial registry across the core–shell interface with a relatively minimal amount of lattice defects. XPS and XRD analyses reveal the presence of oxygen vacancies within the shell of the CSNs. UV–Vis measurements show an appreciable reduction in the energy band gap, which is substantiated by our first principles calculations, of our chromia@Mn-chromia CSNs. The electron localization function (ELF) analysis indicates a reduction of covalent bond characteristics of the Mn substituted chromia as compared to that of α-Cr2O3. The magnetization measurements show a predominant AFM behavior with a weak FM/FiM character of chromia@Mn-chromia CSNs consistent with our ab initio calculations.
Supplementary Material
To view supplementary material for this article, please visit https://doi.org/10.1557/jmr.2016.504.
ACKNOWLEDGMENTS
We thank Rishi Patel of the JVIC center at MSU for making the XPS measurements on our samples. This work used the Extreme Science and Engineering Discovery Environment (XSEDE), which is supported by National Science Foundation grant number ACI-1053575. We greatly appreciate the constructive reviews of the referees and suggestions made by the editor, which have improved our manuscript.