INTRODUCTION
Environmentally sustainable intensification of agricultural systems is a means of increasing production capacities under current and future resource limitations (Soussana et al. Reference Soussana, Fereres, Long, Mohren, Pandya-Lorch, Peltonen-Sainio, Porter, Rosswall and Von Braun2012) in a situation where agriculture and land-use change are constrained by various global boundaries (Rockström et al. Reference Rockström, Steffen, Noone, Persson, Chapin, Lambin, Lenton, Scheffer, Folke, Schellnhuber, Nykvist, De Wit, Hughes, Van Der Leeuw, Rodhe, Sörlin, Snyder, Costanza, Svedin, Falkenmark, Karlberg, Corell, Fabry, Hansen, Walker, Liverman, Richardson, Crutzen and Foley2009; Foley et al. Reference Foley, Ramankutty, Brauman, Cassidy, Gerber, Johnston, Mueller, O'Connell, Ray, West, Balzer, Bennett, Carpenter, Hill, Monfreda, Polasky, Rockstrom, Sheehan, Siebert, Tilman and Zaks2011). In many European countries, there has been a general slowing of yield increases of the major crops over the past two decades (Olesen et al. Reference Olesen, Trnka, Kersebaum, Skjelvåg, Seguin, Peltonen-Sainio, Rossi, Kozyra and Micale2011). In the most extreme case, in the northernmost European regions represented in the present paper by Finland, national cereal and rapeseed yields have stagnated or even declined despite continuous advances in genetic potential (Peltonen-Sainio et al. Reference Peltonen-Sainio, Jauhiainen and Hannukkala2007, Reference Peltonen-Sainio, Jauhiainen and Laurila2009a). This means that the gap between potential and actual yields has expanded during recent decades.
Yield-gap assessments indicate under-utilization of available growth resources in the northern and eastern parts of Europe, whereas yield gaps are far narrower in the prime agricultural areas of western Europe (Stoate et al. Reference Stoate, Baldi, Beja, Boatman, Herzon, Van Doorn, De Snoo, Rakosy and Ramwell2009). Future climate change is, however, likely to increase yield potentials further, as well as sustain the expansion of climatically suitable areas in northern Europe (Peltonen-Sainio et al. Reference Peltonen-Sainio, Jauhiainen, Hakala and Ojanen2009b; Elsgaard et al. Reference Elsgaard, Børgesen, Olesen, Siebert, Ewert, Peltonen-Sainio, Rötter and Skjelvåg2012), while water shortages and extreme weather events are likely to be experienced more frequently in the southern European regions (Bindi & Olesen Reference Bindi and Olesen2011). Current under-utilization of growth resources and future prospects for yield gains anticipate appreciable potential for elevation of productivity per unit of arable land while minimizing or mitigating environmental costs through sustainable intensification and land-use optimization (Bindi & Olesen Reference Bindi and Olesen2011; Porter et al. Reference Porter, Soussana, Fereres, Long, Mohren, Peltonen-Sainio, Von Braun, Hillel and Rosenzweig2012; Soussana et al. Reference Soussana, Fereres, Long, Mohren, Pandya-Lorch, Peltonen-Sainio, Porter, Rosswall and Von Braun2012).
As a complex and strongly interlinked entity with critical trade-offs and ecosystem service interactions, sustainable intensification of agricultural production as a whole, requires a system-based approach. However, intensification measures can be identified as a group of actions that must be implemented one by one, prior to aggregating and scaling them up to an entire agricultural system and landscape level. Such single actions represent, e.g.: (1) breeding crops for improved nutrient and water use efficiency, disease and pest resistance, and insensitivity to climate change-induced elevated mean temperatures and heat waves, or (2) development of crop management practices and cropping systems (e.g. water management systems, recycled nutrients, more resilient and diversified crop rotations).
Germination is a complex, fundamental process (Weitbrecht et al. Reference Weitbrecht, Müller and Leubner-Metzger2011) with only limited opportunities for genetic improvement (Nonogaki et al. Reference Nonogaki, Bassel and Bewley2010), but it is strongly influenced by environmental conditions (Benjamin Reference Benjamin1990). Conditions during seed formation (Egli Reference Egli2006) and harvesting, handling and storage can all cause reduction and/or variation in viability and other seed characteristics within and among seed lots (Benjamin Reference Benjamin1990; Naylor & Gurmu Reference Naylor and Gurmu1990). In addition to internal heterogeneity within a seed lot, variation in sowing depth, presence of crop residues and other prevailing conditions may further increase unevenness of seedling emergence and plant stand establishment (Gan et al. Reference Gan, Stobbe and Moes1992; Kirby Reference Kirby1993; Chastain et al. Reference Chastain, Ward and Wysocki1995; Håkansson et al. Reference Håkansson, Keller, Arvidsson and Rydberg2012). Contribution of early and uniform plant stand establishment to yield determination is, however, particularly emphasized in northern growing conditions, which are characterized by a short growing season and long-day induced accelerated development rate with lack of sufficient compensation ability for temporary stresses or constraints (Peltonen-Sainio et al. Reference Peltonen-Sainio, Rajala, Känkänen, Hakala, Sadras and Calderini2009c). Therefore, use of high-quality seed should be among the first choices of farmers for sustaining cereal yield formation, rather than being largely neglected as it is currently in north-eastern Europe.
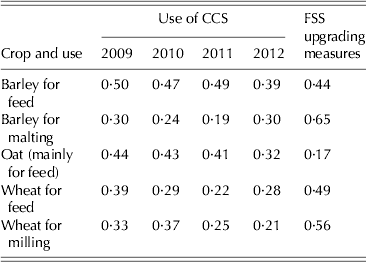
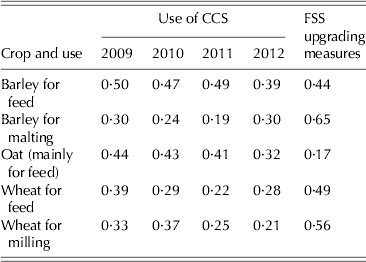
There are large differences within Europe in the use of high-quality commercial certified seed (CCS). An increase in use of quality seed is one of the first, readily taken steps that can be put into practice in order to intensify cropping systems’ sustainably. In Finland, use of CCS for barley (Hordeum vulgare L.) is low, ranging from 0·19 to 0·50, depending on year and whether harvested grain is destined for feed or malting (Table 1). According to recent studies carried out in northern Europe, use of CCS for sowing barley averaged 12% yield enhancements over the years and locations when compared with use of non-upgraded farm-saved seed (FSS) (Rajala et al. Reference Rajala, Niskanen, Isolahti and Peltonen-Sainio2011). Such a yield gain was evident even though grain weight and germination were taken into account in determining sown seed mass. Furthermore, upgrading FSS by using only the seeds remaining on the 2·7 mm sieve plate and by disinfection resulted in 8% yield increases compared with FSS that had not been upgraded. The range of improvement gained by use of CCS was 0·04–0·20 and by use of upgraded FSS from 0·01 to 0·22, depending on year and location. Yield benefits were derived from enhanced seedling emergence and consequently a more even plant stand establishment. However, only negligible changes, if any, following use of CCS were established for quality traits (Rajala et al. Reference Rajala, Niskanen, Isolahti and Peltonen-Sainio2011). In addition to avoid the risks associated with viability, and assuring seed performance and yield benefits, use of quality seed represents a means of controlling self-sown volunteer species or cultivars. Repeated cycles of seed handling and storage also increase the risk of mixing alien cultivars and species into a seed lot, especially when several generations of FSS are used. Such unintentional genotypic decline in an FSS lot can reduce harvested crop value (Garstang Reference Garstang1993).
Use of CCS and upgrading measures for FSS of barley, oat and wheat according to farmer interviews in 2009–12 held in Finland. Upgrading measures include: sieving, determination of germination, 1000 grain weight and disinfection. Data from VYR (2012)
The present study aimed to: (1) characterize, according to recent surveys (Peltonen-Sainio et al. Reference Peltonen-Sainio, Rajala and Jauhiainen2011a; Anonymous 2012), why farmers content themselves with use of FSS and (2) demonstrate the potential of increased CCS use and/or upgrading of FSS as a single case of underutilized management to boost yields per unit land area and through scaling up from field level show the yield benefits at regional and national levels.
MATERIALS AND METHODS
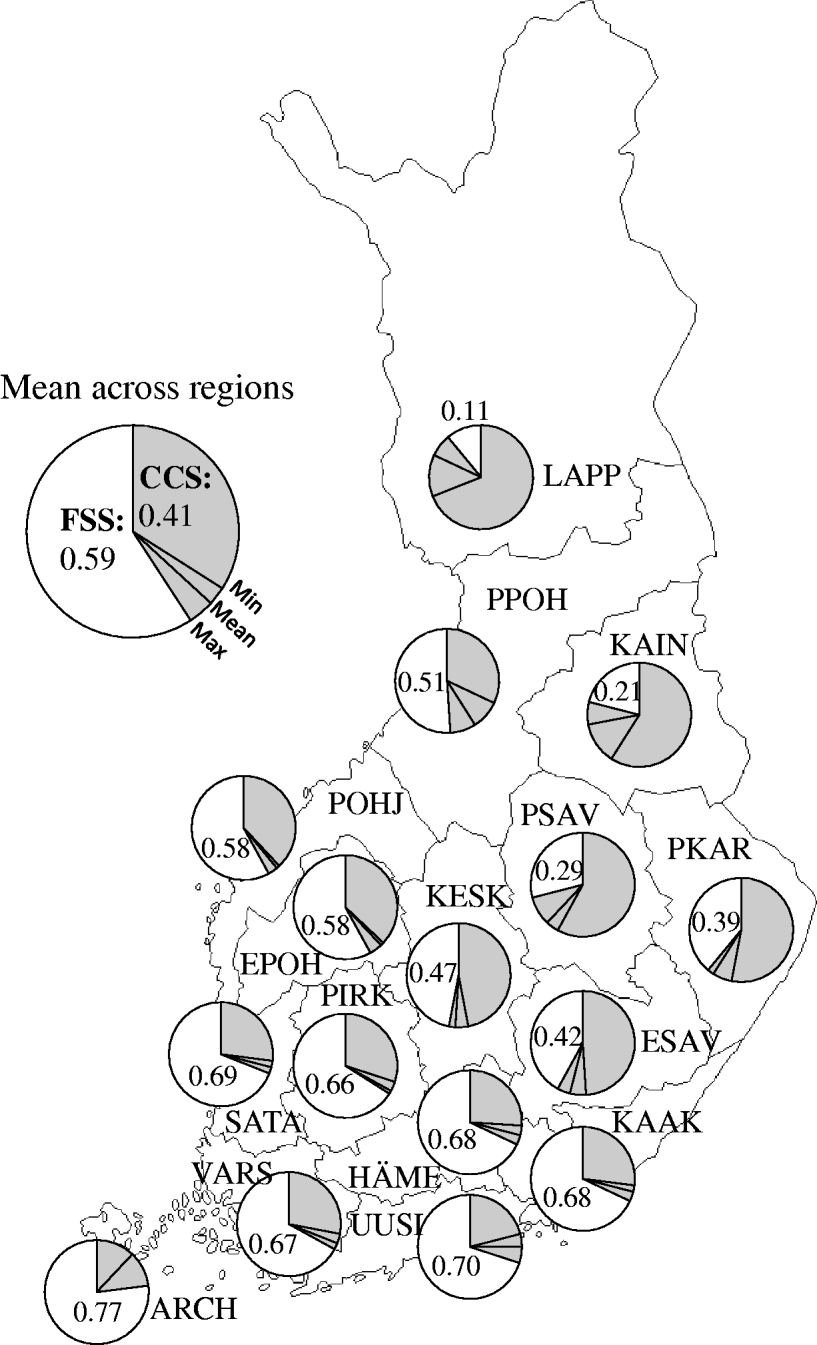
Spring barley was used as a model crop as it is the principal cereal crop in Finland, and is grown over large areas (mean 546 700 ha for the 2000s) from the south to the north of the country. Potential effects of increased use of high-quality seed for barley cultivation at regional and national levels were estimated based on yield benefits demonstrated by Rajala et al. (Reference Rajala, Niskanen, Isolahti and Peltonen-Sainio2011), regional levels of CCS use (Fig. 1) and survey information on frequencies of different upgrading methods used by farmers (VYR 2012). It was estimated that the relative yield gains were similar across regions even though they differ in mean yields (i.e. 0·12 for CCS and 0·08 for fully upgraded FSS as compared with non-upgraded FSS). This was justified, as grain yield did not have significant relationships with degree of yield benefit gained by use of CCS or upgraded FSS (R 2 was 0·017 and 0·002, respectively). This was also substantiated by the findings from earlier studies carried out on barley during the early 2000s, according to which use of CCS and upgraded FSS resulted in comparable yield improvements despite 43% lower mean yields (reported in Anonymous 2012) than in the experiments of Rajala et al. (Reference Rajala, Niskanen, Isolahti and Peltonen-Sainio2011).
Regional differences in use of CCS and FSS. Mean is across 2009–11 and minimum and maximum rates for the period of 2005–11. Data from Anonymous (2012). ARCH, Archipelago; UUS, Uusimaa; VARS, Varsinais-Suomi; SATA, Satakunta; HÄME, Häme; PIRK, Pirkanmaan; KAAK, Kaakkois-Suomi; ESAV, Etelä-Savo; PSAV, Pohjois-Savo; PKAR, Pohjois-Karjala; KESK, Keski-Suomi; EPOH, Etelä-Pohjanmaa; POHJ, Pohjanmaa; PPOH, Pohjois-Pohjanmaa; KAIN, Kainuu; LAPP, Lappi.

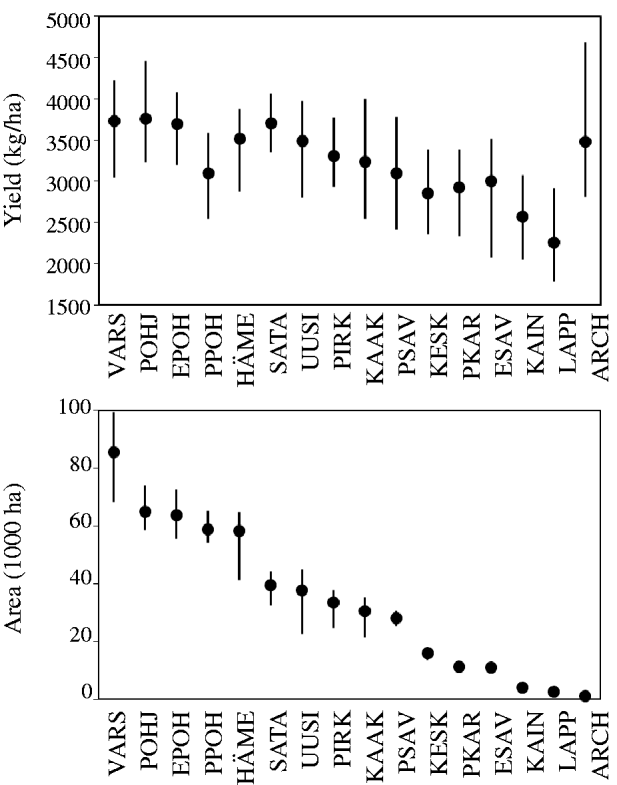
The contribution of the current level of CCS use and upgrading measures of FSS to regional yields was initially estimated by using average yields and cultivation areas of barley over the 2000s because of large annual variation in both variables (Fig. 2). The national mean yield was 3460 kg/ha. The yield benefits gained by current levels of CCS use and upgrading FSS through sieving (0·37 of farmers using FSS) or complete restoration measures (0·55) were estimated at the regional scale. The weighted total mean (after annulling the effects of present CCS use and FSS upgrading measures on national mean) was estimated at 3350 kg/ha.
Mean (black square) for regional grain yield (upper graph) and cultivation area (lower graph) of barley, with the ranges minimum to maximum (vertical line) in 2000–11. Data from Tike, Information Centre of the Ministry of Agriculture and Forestry.
Regional yields that excluded the effects of current use of CCS and upgraded FSS were used as the starting points for assessing potential yield increases that could be gained by increasing the use of CCS and FSS when completely upgraded. The assessment was made according to two scenarios: either full (1·00) use of CCS or combining a 0·75 rate of CCS use with 0·25 of high-quality, upgraded FSS.
Also the potential benefits from changing cultivars were included in assessments as the next step by taking into account the current distribution of the age range of barley cultivars and by assuming that the most recent cultivars would replace the older ones when farmers buy CCS. Yield benefit was estimated to be 1·144% per year, as documented by Peltonen-Sainio et al. (Reference Peltonen-Sainio, Jauhiainen and Laurila2009a), as a constant breeding achievement over recent decades.
RESULTS AND DISCUSSION
How do farmers justify low rates of CCS use?
CCS use is modest in Finland for all cereal species (Table 1) when compared with Sweden and Denmark, where the range is 0·85–0·90 (Peltonen-Sainio et al. Reference Peltonen-Sainio, Rajala and Jauhiainen2011a). Furthermore, depending on cereal species, only c. 0·17–0·65 of the farmers who do not use CCS, upgrade their FSS properly. For oat (Avena sativa L.), FSS upgrading measures were very low (Table 1). One likely reason for this is that farmers consider oat to be a crop giving lower returns, requiring only modest inputs and succeeding on soils not suitable for barley and wheat (Triticum aestivum L.) (Peltonen-Sainio Reference Peltonen-Sainio, Hamel and Smith1999). Furthermore, the risk of seed-borne pathogen infections is expected to be a less serious problem than in barley and wheat, although this has not been studied thoroughly.
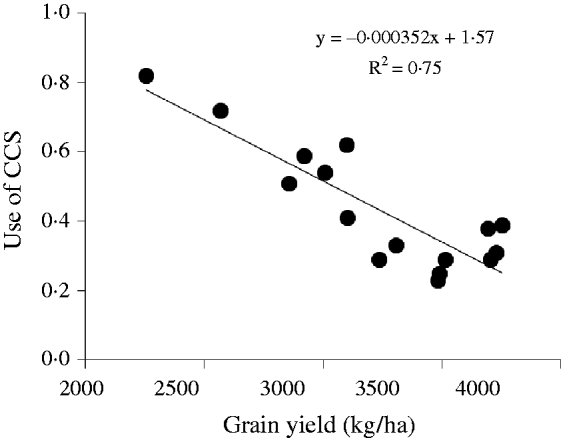
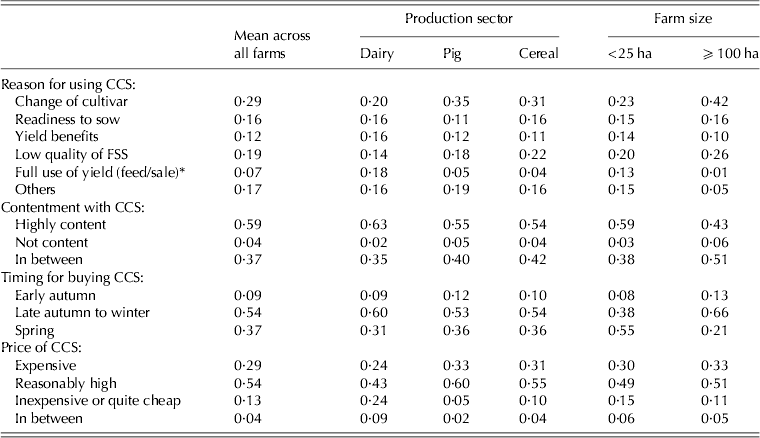
A recent survey revealed that CCS is more frequently used on farms specialized in animal production than on arable farms (Anonymous 2012). The difference between such farms in CCS use averaged 0·10 units. Also farms of >200 ha, as well as those of <50 ha, seem to use CCS more frequently than medium-sized farms (Anonymous 2012). Regional differences in CCS use are substantial. Typically, the use is high (0·42–0·89) in the northern and eastern regions of Finland CCS as compared with that in southern and south-western coastal regions (0·23–0·34) (Fig. 1). In the northern regions, 0·18 of dairy farms use all grain produced for feed, and they also place a high value on the fact that CCS is ready for sowing immediately, without any need for upgrading measures as needed for FSS (Anonymous 2012). Because of a short growing season in the northern and eastern areas, the risks for impaired germination induced by late harvests are high (Peltonen-Sainio et al. Reference Peltonen-Sainio, Rajala and Jauhiainen2011a) and may hinder farmers’ willingness to rely on FSS. For these reasons, farmers are more apt to use CCS in regions with the lowest mean yields (Fig. 3).
Association between regional mean yield of barley (2000–11) and farmers’ readiness to use CCS (2009–11) in Finland. Data from Tike, Information Centre of the Ministry of Agriculture and Forestry.
In general, the principal reason (averaging 0·29) for use of CCS is to change cultivar to a more recently released one (Table 2). Cultivar change is particularly important on large farms (0·42). Low quality of FSS is also a common reason for buying CCS, and especially so among the cereal production farms (0·22) and large farms (0·26). Effortless and easy use of CCS for sowing (0·16), and expected yield benefits (0·12) are not the main reasons for CCS use. Using the entire yield solely for feed (0·18) is significant only among dairy farms (Table 2).
Proportion of different primary reasons for using CCS, degree of contentment of farmers for use of CCS and timing for CCS purchase as well as farmers’ feelings about the price of CCS as compared with FSS depending on production sector and farm size. Data from Anonymous (2012)
* ‘Full use of yield’ means that all of the yield is used for feed or is sold and therefore there is no grain available for use as FSS.
Despite the low rates of CCS use, most farms are content with the CCS that they have used for sowing (Table 2). Few farmers expressed dissatisfaction with quality of CCS (0·04 ± 0·02 depending on production sector and farm size). Close to one-third of farms and even 0·55 of small farms (<25 ha) buy CCS in spring.
Despite the finding that farmers are generally content with CCS, and the significant yield increases (0·12) demonstrated by use of high-quality seed (Rajala et al. Reference Rajala, Niskanen, Isolahti and Peltonen-Sainio2011), there are no consistent signs of progress in use of CCS in Finland in recent years (Table 1). The major argument against use of CCS is that it is considered to be expensive or reasonably expensive by 0·83 of farmers (Table 2). According to a recent study, CCS and upgraded FSS clearly out-yielded non-upgraded FSS (Rajala et al. Reference Rajala, Niskanen, Isolahti and Peltonen-Sainio2011). Furthermore, upgrading increases the cost of FSS. To justify the use of more expensive seed economically, either CCS or upgraded FSS, the yield benefit needs to exceed the cost difference compared with non-upgraded FSS. Yield gains were estimated to exceed the upgrading costs, although recent volatility in market prices hampers the comparison (Rajala et al. Reference Rajala, Niskanen, Isolahti and Peltonen-Sainio2011). When other issues were taken into consideration, the economic assessment of seed costs tended even more towards use of high-quality seed, as also demonstrated by TeKrony (Reference Tekrony1999) and Boland et al. (Reference Boland, Dhuyvetter and Howe2001). For example, fertilizers and crop protection are used at the same application rates despite differences in the yielding capacity of a seed lot, and thereby seed lots with lower yields inevitably result in less efficient input use. This is a disadvantage not only in economic terms but is also in environmental terms (Rajala et al. Reference Rajala, Niskanen, Isolahti and Peltonen-Sainio2011).
Use of FSS: upgrading or going with the risk?
Most of the Finnish cereal area is sown with FSS. Among those farmers that cultivate barley and wheat for feed, 0·44 and 0·49, respectively, carry out thorough upgrading measures for FSS, including sieving, germination tests, determination of 1000 grain weight and disinfection (Table 1). When aiming at sustaining the higher quality required for industrial processes, and taking into account prices in the cereal markets, FSS upgrading measures are a little more common: 0·65 for malting barley and 0·56 when wheat is grown for milling. For oat, only 0·17 of farmers currently carry out sufficient upgrading measures. All these figures indicate that about a quarter of the barley area, corresponding to c. 150 000 ha, is sown through FSS, the quality of which is unanalysed and hence completely unknown.
Sowing seeds of unknown quality may involve huge hidden risks for plant stand establishment. In particular, the risk of seed-borne diseases is high (Paveley et al. Reference Paveley, Rennie, Reeves, Wray, Slawson, Clark, Cockerell and Mitchell1996; Anonymous 2004; Law et al. Reference Law, Thomas, Kenyon, Thompson, Smith, Cockerell, Cockerell, Paveley, Clark, Thomas, Anthony, McEwan, Bates, Roberts, Law, Kenyon and Mulholland2004). However, disinfection measures that are operated routinely may cause unnecessary costs and environmental load if prevalence of seed-borne diseases in FSS is not properly tested (Anonymous 2004). According to Peltonen-Sainio et al. (Reference Peltonen-Sainio, Rajala and Jauhiainen2011a), total failures may occur: according to an FSS survey carried out in Finland, in some cases (although very few) up to 0·97 of barley seeds in an FSS lot produced for sowing did not germinate and up to 0·33 were abnormal, without any visual signs of loss of seed viability. Furthermore, seedling length ranged from 14·5 to 65·4 mm depending on the FSS lot and the year, which again indicates profound differences in seed vigour that is further challenged by the risk of high frequencies of seed-borne pathogens (Paveley et al. Reference Paveley, Rennie, Reeves, Wray, Slawson, Clark, Cockerell and Mitchell1996; Johnsson et al. Reference Johnsson, Hökeberg and Gerhardson1998; Law et al. Reference Law, Thomas, Kenyon, Thompson, Smith, Cockerell, Cockerell, Paveley, Clark, Thomas, Anthony, McEwan, Bates, Roberts, Law, Kenyon and Mulholland2004; Peltonen-Sainio et al. Reference Peltonen-Sainio, Rajala and Jauhiainen2011a). These probably result in uneven emergence rate, defined as the number of emerged plants and duration of emergence, which again causes variability in plant stand structure. All these examples indicate the definite and concrete risk and costs of using the seed without checking its viability and conducting proper germination and health tests prior to sowing.
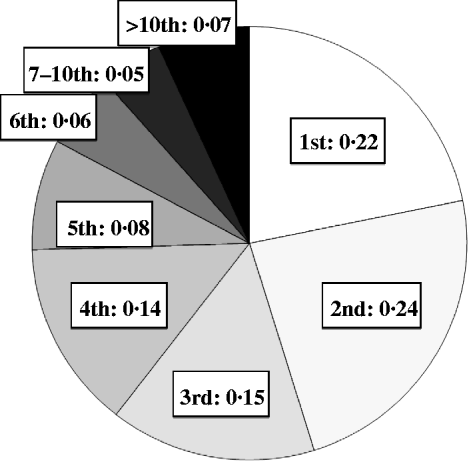
In addition to hidden risks for seed quality and its viability when non-upgraded FSS is used, farmers obviously miss the opportunity to gain from the improved traits of the most modern cultivars when they use several generations of FSS. According to the FSS survey carried out in Finland, the proportion of 1st and 2nd generations of FSS averaged close to 0·50 and that of the 1st to 4th generations about 0·75 of analysed samples. The remaining 0·25 ranged from the 5th FSS generation onwards, even up to the 15th generation (Fig. 4). The oldest barley cultivars still in cultivation were released in 1980.
Frequency of different generations of FSS according to a farmer survey carried out for barley in 2008/09 in Finland.
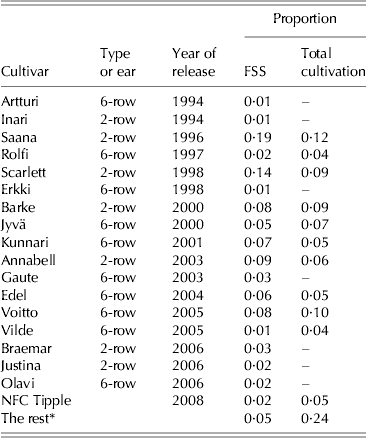
When comparing the average age of cultivars in the FSS collection and that at the national scale, according to the year of release of each cultivar and how frequently they were grown, it appeared that the age difference between the FSS sample collection and the national distribution of barley cultivars averaged 4 years. This means that the current level of CCS use at national level contributes only a 4-year advantage. Furthermore, because of the present high use of FSS, barley cultivars are in many cases clearly outdated (see footnote of Table 3) and should be replaced by modern cultivars released since the late 2000s. The impact of the use of old cultivars to a large extent represents loss of potential yield benefits that could be gained from breeding (averaging 37 kg/ha/year and corresponding to 1·144% increase annually; Peltonen-Sainio et al. Reference Peltonen-Sainio, Jauhiainen and Laurila2009a).
Frequency of barley cultivars differing in year of release in FSS materials and their proportion of areas in total cultivation on average over 2008 and 2009. Data from Peltonen-Sainio et al. (Reference Peltonen-Sainio, Rajala and Jauhiainen2011a) and Tike, Information Centre of the Ministry of Agriculture and Forestry. Year of release published in EVIRA (2011)
* FSS cultivars: Hankkijan Pokko (1980), Kymppi (1985), Arve (1994), Loviisa (1994), Mette (1994), Tofta (2000), SW Wikingett (2002), Tolar (2003), Maaren (2004), Polartop (2005), Prestige (2007).
– data not available.
It has been emphasized that improving the resilience of cropping systems is a means of protecting against the harmful impacts of climate change and variability, including weather extremes (Reidsma & Ewert Reference Reidsma and Ewert2008). Diversification of cropping systems is considered to be one of the key measures to improve resilience, i.e. the capacity of a cropping system and plant stand to be buffered and recover from temporary climatic constraints (IPCC SREX Reference Field, Barros, Stocker, Qin, Dokken, Ebi, Mastrandrea, Mach, Plattner, Allen, Tignor and Midgley2011). Hakala et al. (Reference Hakala, Jauhiainen, Himanen, Rötter, Salo and Kahiluoto2012) demonstrated variation in barley cultivars adapted to northern growing conditions in their response to climatic conditions. Thus, one could argue that the current situation of having a large number of barley cultivars, representing different times of introduction into cultivation, may partly improve production stability (Peltonen-Sainio et al. Reference Peltonen-Sainio, Jauhiainen and Sadras2011b) at the farm or regional level. However, the genetic diversity of barley germplasm in Finland is generally quite narrow (Manninen & Nissilä Reference Manninen and Nissilä1997) and its contribution to resilience is therefore small. Comprehensive resilience benefits are likely to be achieved by using more diversified crop rotations and cropping systems (Reidsma & Ewert Reference Reidsma and Ewert2008) rather than maintaining cultivars from recent decades and justifying use of FSS for prolonged periods by claiming that it sustains resilience (Peltonen-Sainio Reference Peltonen-Sainio2012).
Scaling up the potential yield benefits for higher rate of CCS use
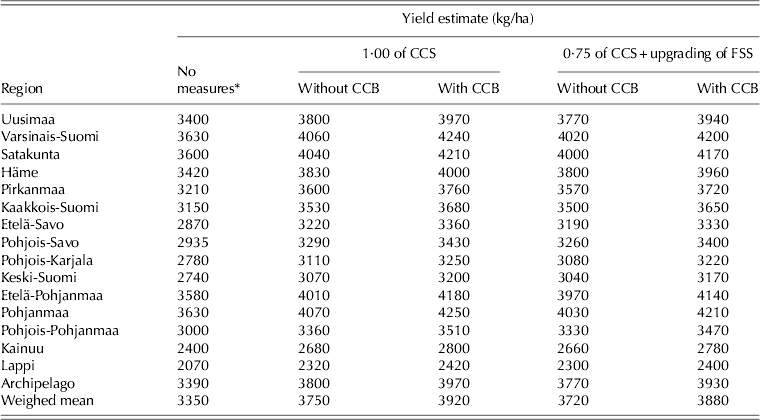
The national mean yield was 3460 kg/ha during the study period, while the weighted total mean, after annulling the effects of present CCS use and FSS upgrading measures on national mean yield, was estimated at 3350 kg/ha (Table 4). Hence, the contribution of current use of CCS and upgrading measures of FSS on national yields averaged 0·03. The scenario of full use of CCS resulted in an estimated national mean yield increase of 400 kg/ha, whereas the figure for combined use of CCS and high-quality FSS (0·75 and 0·25) was 370 kg/ha. Of course, regional yield gains were particularly high in areas characterized by current low rates of CCS use. When the potential benefits from changing cultivars were included in assessments, yield estimates approached 3900 kg/ha, corresponding to 16–17% yield increases when scaled up to the national level (Table 4). In general, the benefits from breeding achievements that would be gained through changing cultivars contributed 0·29 to the estimated yield increases.
Estimate for regional barley yield (kg/ha) in case that no CCS would be used and no upgrading measures for FSS would be carried out as well as in case that use of CCS is 1·00 or 0·75 with rest of the area sown with upgraded (sieving and disinfection) FSS without or with cultivar change benefits (CCB)
* Grain yields are lower than current means because the effects of present levels of CCS use and upgrading of FSS are assumed to be annulled.
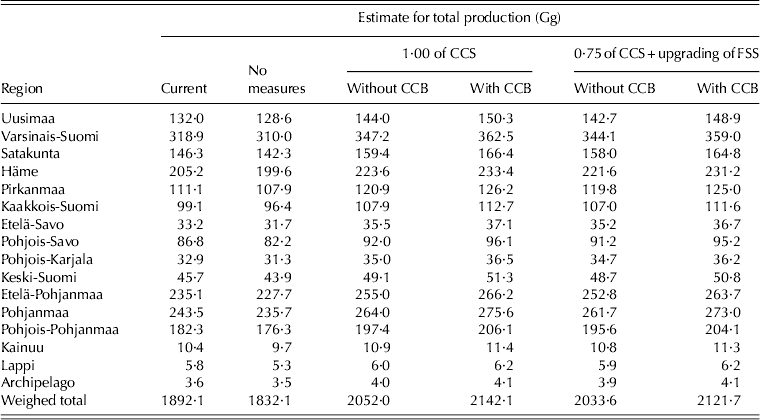
As barley is the most commonly grown crop in Finland, the increases in mean yields would result in marked increases in total national production (Table 5). Total barley production was estimated to substantially exceed 2000 Gg in all scenarios, whereas it averaged a little less than 1900 Gg for rates of CCS use recorded in the 2000s. The contribution of the southern regions to increases in national production capacities was estimated to be particularly high due to the currently low rate of CCS use compared with northern parts of the country.
Total estimated barley production (Gg) for each region if no CCS is used and no upgrading measures for FSS carried out, and if use of CCS is 1·00 or 0·75 with the rest of the area sown with upgraded (sieving and disinfection) FSS without or with cultivar change benefits (CCB)
Along with higher yields, more of the applied nitrogen (N) is removed from the field. According to experiments of Rajala et al. (Reference Rajala, Niskanen, Isolahti and Peltonen-Sainio2011), N removal was c. 8% higher when CCS was used when compared with use of non-upgraded FSS, and some 5% higher as compared with FSS that was properly upgraded. If this was realized at the national level, an additional 20 000 tonnes of N would be removed with elevated yields. Also this example, together with estimations of yield gains, indicates the high potential of increased use of high-quality seed to contribute to sustainable intensification of northern European cropping systems.
Finland was used in this assessment as an example of a country with low rate of CCS use. The yield benefits demonstrated in the present paper are probably also achievable in other countries with modest current CCS use, such as Poland, Lithuania and Slovakia (Peltonen-Sainio et al. Reference Peltonen-Sainio, Rajala and Jauhiainen2011a). Furthermore, the present results may also encourage countries with trends of declining CCS use to think again. As demonstrated by Peltonen-Sainio et al. (Reference Peltonen-Sainio, Rajala and Jauhiainen2011a), there are alarming signs of gradual increases in the use of FSS in countries having traditionally high CCS use. Cleansing and disinfection of seed grains is an established tradition, and their importance needs to be emphasized in case of increased levels of FSS use in the future. Seed testing carried out for CCS in accredited laboratories has an essential role in supplying seed purity and freedom from pests and diseases (Paveley et al. Reference Paveley, Rennie, Reeves, Wray, Slawson, Clark, Cockerell and Mitchell1996; http://seedtest.org) while, e.g. routine disinfection treatments for FSS without testing seed-borne diseases may be unfounded and cause unnecessary fungicide load to the environment (Anonymous 2004). Furthermore, high variation of quality within and between FSS lots (Law et al. Reference Law, Thomas, Kenyon, Thompson, Smith, Cockerell, Cockerell, Paveley, Clark, Thomas, Anthony, McEwan, Bates, Roberts, Law, Kenyon and Mulholland2004; Peltonen-Sainio et al. Reference Peltonen-Sainio, Rajala and Jauhiainen2011a) suggests that only part of the seed material saved by farmers may have sufficiently high starting quality and uniformity for successful upgrading measures.
In conclusion, the current low levels of CCS use and insufficient upgrading measures carried out for FSS represent significant limitations for expression of potential barley yields in the northernmost European growing areas. By increasing the use of CCS in Finland to correspond with that of Sweden and Denmark, for example, barley-dominated cropping systems could be sustainably intensified. Increasing the use of high-quality seed is easy to carry out, and it is likely to benefit farmers, plant breeding companies and industry. Therefore, the potential of using high-quality seed to sustainably intensify northern European cropping systems and reduce yield gaps should not be ignored.
The work was financed by the Ministry of Agriculture and Forestry and/or MTT Agrifood Research Finland as a part of on-going projects entitled Enhancing Production and Use of Quality Seed: from Knowledge to Actions (LAATUSIEMEN) and Sustainable Intensification of Cropping Systems (SusIntens).