Introduction
For species showing dormancy, the timing and extent of seedling emergence in the field is strictly related to the dormancy state of the seed bank. Thus, for those species, an accurate prediction of changes in seed dormancy level is essential if we aim to forecast temporal patterns of seedling emergence (Batlla and Benech-Arnold, Reference Batlla and Benech-Arnold2010).
Among environmental factors that can affect dormancy, temperature has been identified as the one driving seasonal changes in the dormancy level of seed banks in temperate environments where water does not present seasonal restrictions (Benech-Arnold et al., Reference Benech-Arnold, Sánchez, Forcella, Kruk and Ghersa2000; Finch-Savage and Footitt, Reference Finch-Savage and Footitt2017). For example, in the case of Polygonum aviculare, a cosmopolitan summer annual weed, low temperatures usually reduce dormancy during winter, while early-summer rising temperatures induce seeds into secondary dormancy (Courtney, Reference Courtney1968; Baskin and Baskin, Reference Baskin and Baskin1990; Kruk and Benech-Arnold, Reference Kruk and Benech-Arnold1998; Batlla and Benech-Arnold, Reference Batlla and Benech-Arnold2003; Batlla et al., Reference Batlla, Grundy, Dent, Clay and Finch-Savage2009). This temperature-regulated seasonal dormancy pattern establishes a low dormancy level of the seed bank during early spring, and consequently, the seasonal field emergence window during this period.
These seasonal variations in the dormancy level of the seed bank are expressed through changes in the range of environmental conditions that allow germination (Vleeshouwers et al., Reference Vleeshouwers, Bouwmeester and Karssen1995; Allen et al., Reference Allen, Benech-Arnold, Batlla, Bradford, Bradford and Nonogaki2007). The permissive environmental range for germination expands when dormancy level decreases, whereas it narrows when the level of dormancy increases. Therefore, changes in the level of dormancy could be evaluated through quantifying the environmental range within which a population of seeds can germinate (Batlla and Benech-Arnold, Reference Batlla and Benech-Arnold2010, Reference Batlla and Benech-Arnold2015).
The relationship between seed dormancy level and the range of environmental conditions permissive for seed germination was first proposed by Vegis (Reference Vegis1964). Vegis introduced the concept of relative levels of dormancy, based on the observation that as the seeds go out of dormancy the temperature range permissive for seed germination expands, while conversely, as dormancy is induced the temperature range permissive for seed germination becomes narrow. More recent findings showed that not only the range of temperatures under which germination is possible changes with dormancy level, but also the range of water potentials within which seed germination can proceed (Alvarado and Bradford, Reference Alvarado and Bradford2002, Reference Alvarado and Bradford2005; Allen et al., Reference Allen, Benech-Arnold, Batlla, Bradford, Bradford and Nonogaki2007).
Working with seeds of P. aviculare, Batlla and Benech-Arnold (Reference Batlla and Benech-Arnold2004) showed that during dormancy loss the range of water potentials permissive for seed germination widens as a consequence of a decrease in the mean base water potential for seed germination of the seed population [Ψb(50)], while dormancy induction was characterized by an increase in Ψb(50). This parameter [Ψb(g)] can be defined as the water potential below which a certain fraction (g) of a population of seeds would not germinate. Based on evidence showing that variation in seed dormancy level is related to changes in Ψb, Bradford (Reference Bradford, Kigel and Galili1995, Reference Bradford and Lang1996, Reference Bradford2002) proposed that changes in seed dormancy status could be quantified and even modelled in relation to variations in Ψb based on the concept of hydrotime initially proposed by Gummerson (Reference Gummerson1986). The hydrotime model describes seed germination response to water potential (Ψ) using the following function:
 $$\theta _{\rm H} = {\rm} [\Psi -\Psi _{\rm b} \left( g \right)]t_g, $$
where θ H is the hydrotime (MPa h or d) the seeds require for germination, Ψ is the actual water potential of the germination media (MPa) and t g is the germination time (h or d) of the germination fraction g. The model assumes that Ψb varies among fractions of a seed population following a normal distribution with its mean Ψb(50) and standard deviation σ Ψb, while θ H is considered constant for a seed population (Bradford, Reference Bradford1990). Although this model just takes into account the effect of Ψ on seed germination, it can be combined with a thermal-time model to include the effect of temperature on seed germination, resulting in the hydrothermal time model (Gummerson, Reference Gummerson1986).
Population threshold models, as hydrotime and hydrothermal time models, were used to analyse and/or predict changes in the dormancy status of seed populations. For example, Bauer et al. (Reference Bauer, Meyer and Allen1998), working with seeds of the winter annual grass Bromus tectorum, developed a thermal after-ripening time model able to simulate dormancy loss in the field using Ψb(50) as an index of the seed population dormancy status. In this model, changes in germination time course curves according to after-ripening time and temperature were accounted for by changes in Ψb(50), while all other hydrothermal time model parameters were held constant. Similarly, Gianinetti and Cohn (Reference Gianinetti and Cohn2007) applied the hydrotime model to analyse changes in germination behaviour during dormancy release through dry after-ripening in red rice (Oryza sativa L.) seeds. These studies highlight the possibility of applying a threshold model approach using Ψb(50) as an index of the dormancy status of the seed population to describe changes in seed germination behaviour as a consequence of changes in dormancy level. However, most of the work that used hydrotime and/or hydrothermal time approaches to describe changes in seed population dormancy status was related to the dormancy release process, with very few examples in relation to dormancy induction.
If we pretend to predict temporal patterns of seedling emergence for summer annual species, we should be able to simulate two processes that give shape to seasonal changes in buried seed dormancy level: on the one hand, dormancy release due to the exposition of seeds to low temperatures during winter, and on the other hand, dormancy induction due to the exposition of seeds to high summer temperatures. Thus, a correct assessment of the effect of temperature on secondary dormancy induction is crucial for developing models able to predict seasonal seedling emergence patterns in the field. In the case of P. aviculare, many models has been developed for simulating changes in the response of seeds to environmental cues as a consequence of dormancy release (Batlla and Benech-Arnold, Reference Batlla and Benech-Arnold2003, Reference Batlla and Benech-Arnold2004, Reference Batlla and Benech-Arnold2005; Batlla et al., Reference Batlla, Verges and Benech-Arnold2003, Reference Batlla, Nicoletta and Benech-Arnold2007); however, there are few for simulating dormancy induction (Malavert et al., Reference Malavert, Batlla and Benech-Arnold2017).
Based on these considerations, the objectives of this study were: (1) to quantify the relationship between temperature and the rate of induction into secondary dormancy in seeds of Polygonum aviculare through changes in Ψb(50) and other hydrotime model parameters, and (2) to develop a model able to simulate changes in seed germination dynamics during dormancy induction based on observed changes in hydrotime model parameters.
Materials and methods
Plant material and storage treatments
Seeds of P. aviculare were collected in a wheat field at Balcarce (latitude 37°45′S, longitude 58°15′W), Argentina, at the time of their natural dispersal (March). After collection, seeds were winnowed using a seed blower (Burrows model 1836–3, Evanston, IL, USA) to eliminate light seeds and stored in glass jars at ambient temperature (ca 20°C) for 25 days until the experiment commenced.
Approximately 800 seeds were placed inside rectangular (3 × 15 × 20 cm) plastic boxes on two sheets of filter paper with a 1 cm layer of sterile cotton underneath. Seeds were covered by one additional sheet of filter paper and soaked with distilled water (excess water was added first and then allowed to briefly drain by gravity). Sixty boxes, sealed with plastic film and wrapped with aluminium foil to prevent moisture loss and exposure of seeds to light, were placed in a chamber set at 5°C to reduce the level of primary dormancy of the seed population (i.e. stratification) (Kruk and Benech-Arnold, Reference Kruk and Benech-Arnold1998; Batlla and Benech-Arnold, Reference Batlla and Benech-Arnold2003). At regular intervals during stratification a group of four boxes (four replications) were extracted and subjected to germination tests to assess changes in the dormancy level of the seed population. This process was repeated until it was considered that the seed population reached a ‘minimum’ level of dormancy. Once this ‘minimum’ level of dormancy was attained, the remaining boxes were moved to chambers set at temperatures of 10, 15, 20 and 25°C to induce seeds into secondary dormancy. During this second storage period seeds were also exhumed at regular intervals and exposed to germination tests to assess changes in the dormancy level of the seed population. During storage under dormancy release and inductive temperatures, the moisture condition of the boxes was regularly checked in darkness through touching the filter paper and the cotton underneath, and water was added if needed. No seeds germinated during storage.
Germination test
Boxes were unwrapped and seeds were exposed to a 15-min pulse of red light to fulfil the light requirements for germination (Batlla and Benech-Arnold, Reference Batlla and Benech-Arnold2003). After the light pulse, seeds were placed in Petri dishes (40 seeds per dish) on two sheets of filter paper containing 5 ml of distilled water (0 MPa) or solutions establishing water potentials of –0.2, –0.4 and –0.6 MPa. The boxes were sealed with plastic film to prevent moisture loss and placed in chambers set at constant temperatures of 10, 15 or 20°C and at an alternating regime of 10/20°C (12 h/12 h) for 15 days. During incubation, germination was recorded every 48 h and germinated seeds were eliminated in each count.
Water potential solutions were prepared by dissolving polyethylene glycol (PEG 6000) in water according to Michel (Reference Michel1983). The water potential values of the solutions were verified using a vapour pressure osmometer (Vapro 5520, Wescor Inc., UT, USA) calibrated against NaCl solutions of known osmotic potential. PEG solutions were changed on days 1, 5 and 10 of the germination test to ensure that the water potential of the incubation medium was held constant during incubation (Ni and Bradford, Reference Ni and Bradford1992).
Germination data analysis
Parameters of the hydrotime model (Ψb(50), θ H and σ Ψb) were derived from germination time course curves obtained at different temperatures and water potentials for seeds stored under dormancy release and inductive temperatures by minimizing the root mean square error (RMSE) between simulated and observed germination data through an optimization procedure using the following function:
 $$G\% = (\Phi [(\Psi - (\theta _{\rm H} /t_g ) -\Psi _{\rm b} \left( {50} \right))/\sigma _{\Psi {\rm b}} ]) \times 100,$$
where G% is germination percentage, and Φ is the standard normal cumulative distribution function. Optimization was performed using the Solver tool of Microsoft Excel (2003–2010).
Quantification of temperature effects on dormancy induction through changes in hydrotime parameters and model development
To quantify the effect of temperature on dormancy induction through changes in Ψb(50) and other hydrotime model parameters we:
-
(1) determined changes in hydrotime model parameters during induction into secondary dormancy for seeds stored at 10, 15, 20 and 25°C and incubated at 10, 15, 20 and 10/20°C under different water potentials;
-
(2) adjusted functions that best describe progressive changes in hydrotime model parameters during dormancy induction in relation to storage time for the different storage and germination temperatures;
-
(3) established a relationship between the value of the parameter(s) defining the rate of change of the function(s) adjusted in (2) and storage temperature; and
-
(4) checked obtained parameters values by comparing predicted vs experimentally obtained germination data using the functions developed in (2) and (3) and the hydrotime model.
Results
Changes in hydrotime model parameters during dormancy release
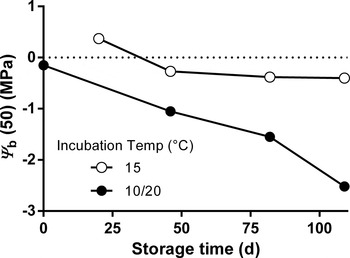
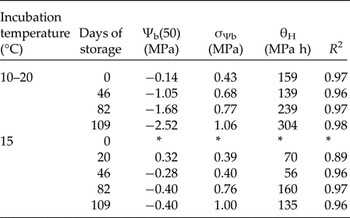
Recently harvested seeds incubated at constant 15°C showed no germination under any water potential (data not shown), denoting the high dormancy level of the seed population at dispersal and precluding the possibility of calculating seed population hydrotime model parameters (Table 1; Fig. 1). However, when incubated at an alternating temperature regime of 10/20°C seeds achieved germination values higher than 20% in water (Fig. S1), allowing the determination of hydrotime model parameters and showing an initial Ψb(50) of –0.14 MPa (Table 1; Fig. 1).
Changes in the mean base water potential for germination [Ψ b(50)] for P. aviculare seeds incubated at 15 and 10/20°C (12 h/12 h) during moist storage at 5°C. The dotted horizontal line indicates the value of 0 MPa.

Estimated population hydrotime parameters for P. aviculare seeds moist-stored at 5°C and germinated at 15 and 10/20°C (12 h/12 h)

*Estimation of hydrotime parameters was not possible due to low (<5%) or no germination in the germination test. R 2 are coefficients of determination of the adjustment of the hydrotime model to observed germination data.
During stratification seeds showed a progressive increase in germination percentage and velocity when incubated under different water potentials at both thermal regimes (Figs S1 and S2); although only slight changes in germination behaviour were observed for seeds stratified for more than 46 days when incubated at 15°C (Fig. S2). This increase in germination percentage and velocity was reflected in a progressive decrease in Ψb(50) during stratification for seeds incubated under both thermal regimes (Table 1; Fig. 1). However, the values of Ψb(50) and its dynamics of decrease were different depending on incubation temperature. Seeds incubated at 15°C showed a marked decrease in Ψb(50) after 46 days of stratification, while subsequent exhumations only showed a slight decrease in Ψb(50), registering a value of –0.40 MPa at the end of the stratification period. On the other hand, seeds incubated at 10/20°C showed a constant linear decreasing trend of Ψb(50) during stratification, achieving a final value of –2.52 MPa.
In contrast to the decrease observed in Ψb(50), σΨb and θH values showed an increasing trend during stratification at both incubation regimes (Table 1). On the other hand, while similar σΨb values were determined for both incubation temperature regimes, seeds incubated under alternating temperatures showed higher θH values than those determined for seeds incubated under constant 15°C.
Changes in hydrotime model parameters during dormancy induction
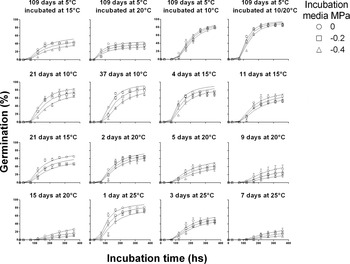
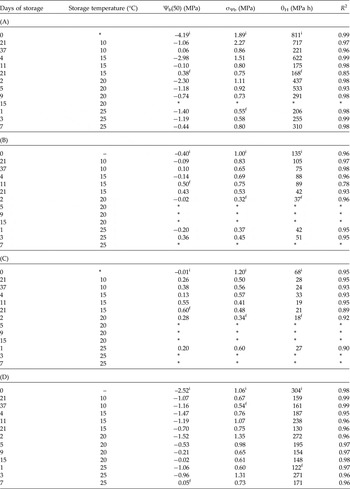
Seeds stratified for 109 days at 5°C showed a different germination behaviour depending on the incubation temperature regime (i.e. dormancy was differentially expressed at each temperature), and this was reflected in the Ψb(50) values derived [higher germination values were related to lower values of Ψb(50)] (Table 2; Fig. 2). Under constant incubation temperatures, the lower the temperature the lower the Ψb(50); seeds incubated at 10°C showed a Ψb(50) of –4.19, while higher Ψb(50) values were observed for seeds incubated at 15 and 20°C (–0.4 and –0.01, respectively). On the other hand, seeds incubated under alternating temperatures showed a Ψb(50) lower than that observed at 15 and 20°C, but higher than that at 10°C. σΨb values were similar at 15, 20 and 10/20°C, while seeds incubated at 10°C showed higher σΨb values. θH showed a trend opposite to Ψb(50) at all incubation temperatures, the lower the Ψb(50) the higher the θH (r = –0.95; P < 0.05).
Germination of P. aviculare seeds incubated under different water potentials (0, –0.2 and –0.4 MPa). The top four panels show germination of seeds incubated at 10, 15, 20 and 10/20°C (12 h/12 h) after 109 days of moist storage at 5°C (i.e. stratification). The other panels show germination at 10/20°C (12 h/12 h) of previously stratified seeds (109 days at 5°C) moist stored at 10, 15, 20 and 25°C for different periods. The symbols are the experimental data and the curves are predicted from equation 2. Vertical bars indicate SE.

Estimated population hydrotime parameters for P. aviculare seeds moist stored at different temperatures in the range 10–25°C and germinated at different temperatures

(A) Germination at 10°C, (B) germination at 15°C, (C) germination at 20°C and (D) germination at 10/20°C (12 h/12 h); seeds were stratified for 109 days at 5°C before storage. *Estimation of population hydrotime parameters was not possible due to little (<5%) or no germination in the germination test. R 2 are coefficients of determination of the adjustment of the hydrotime model to observed germination data. Superscripts i and f denote initial and final parameter values used in equations 3, 4 and 5.
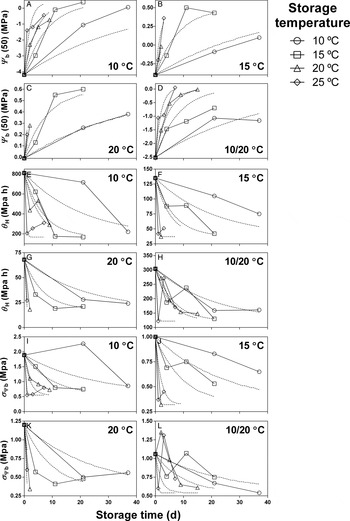
In contrast to the increase in seed germination observed during stratification, a clear decrease in germination percentage and velocity was observed during storage at 10, 15, 20 and 25°C (Figs 2, S3, 4 and 5). As mentioned above, even though the observed germination behaviour (i.e. dormancy expression) was dependent on incubation temperature, a common pattern of change was observed in relation to storage temperature, in which the higher the storage temperature, the higher the rate of decrease in germination (i.e. induction into secondary dormancy) (Fig. 2). These changes in germination behaviour during storage were reflected in hydrotime model parameters, in which a higher rate of increase in Ψb(50) was observed at higher storage temperatures (under constant incubation temperatures and at high storage temperatures this decrease in germination determined no germination after a few days of storage, precluding the possibility of calculating hydrotime parameters) (Table 2; Fig. 3A–D).
Changes in the mean base water potential for germination [Ψb(50)], the hydrotime required for seed germination (θH) and the standard deviation of base water potential (σΨb) for P. aviculare seeds incubated at 10, 15, 20 and 10/20°C (12 h/12 h) during moist storage at 10, 15, 20 and 25°C (before storage, seed were stratified at 5°C for 109 days). Incubation temperature is indicated in each panel. Interrupted lines are predicted values according to: y = y i + {[(y i – y f) × exp (–K x)] + (y i – y f)} for panels A to D, and y = y i – (y i +y f) × (1 – exp (–K x)) for panels E to L, where subscripts i and f denote the initial and final values of y, respectively, and K is the exponential changing rate. y i at each incubation temperature are parameter values obtained after 109 days of stratification at 5°C, while y f at each incubation temperature are the highest Ψb(50) and the lowest θH and σΨb obtained during storage under each incubation temperature (see Table 2). Functions for each hydrotime model parameter at the different incubation temperatures were predicted using a single value of K for each storage temperature; for Ψb(50) 10°C: 0.02, 15°C: 0.12, 20°C: 0.22, 25°C: 0.52; for θH 10°C: 0.04, 15°C: 0.15, 20°C: 0.19, 25°C: 2.8; for σΨb 10°C: 0.04, 15°C: 0.1, 20°C: 0.5, 25°C: 2.4 (see Fig. 4). Values of K for each storage temperature were obtained by minimizing the RMSE between simulated and observed values at that temperature for seeds germinated at the four tested thermal regimes. Note that the scales are different between panels.

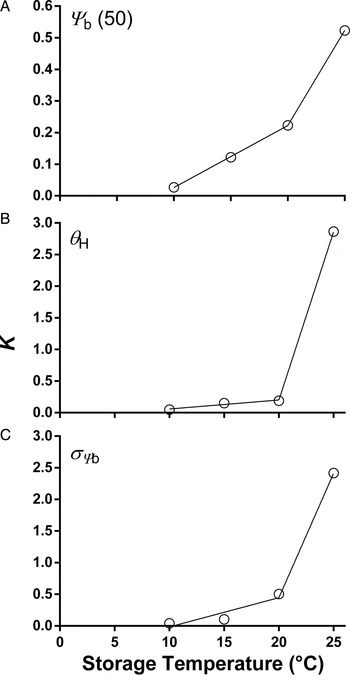
Values of K (parameter from equations 3, 4 and 5) in relation to storage temperature for each hydrotime model parameter. K values correspond to the exponential rate at which the mean base water potential for germination [Ψb(50)], the hydrotime required for seed germination (θH) and the standard deviation of base water potential (σΨb) change during moist storage under dormancy inductive temperatures of 10, 15, 20 and 25°C (see Fig. 3). K values were obtained through optimization to get the value of K which minimized the RMSE between simulated and observed values of Ψb(50), θH and σΨb at each storage temperature for seeds germinated at the four tested thermal regimes (10, 15, 20 and 10/20°C) according to: y = y i + {[(y i – y f) × exp (–K x)] + (y i – y f)} for panel A and y = y i – (y i + y f) × [1 – exp (–K x)] for panels B and C, where subscripts i and f denote the initial and final values of y, respectively, and K is the exponential changing rate. The continuous lines are adjusted bi-linear equations with a similar R 2 of 0.99. Note that the scales are different between panels.

In contrast to the increase observed in Ψb(50), σΨb and θH showed a decreasing trend during storage at all incubation temperatures (Table 2; Fig. 3E–L). The rate of change in these parameters (i.e. the rate of decrease) were, as observed for Ψb(50), higher at higher storage temperature.
Storage temperature effects on seed germination behaviour during dormancy induction quantified through changes in hydrotime model parameters
The pattern of increase in Ψb(50) in relation to storage time showed an exponentially increasing trend, in which the rate of change was fast at the beginning of storage, and then there was a decrease in the rate of change (Fig. 3A–D). Therefore, to describe changes in Ψb(50) during dormancy induction for seeds stored and incubated under different temperatures, the following exponential function was adjusted:
 $$\eqalign{& \Psi _{\rm b} \left( {50} \right) = \Psi _{{\rm bi}} \left( {50} \right) + \left( {\left\{ {\left[ {\Psi _{{\rm bi}} \left( {50} \right) -\Psi _{{\rm bf}} \left( {50} \right)} \right]} \right.} \right. \times \cr & \left. {\left. {\left[ {{\rm exp} \left( {-K \times \hbox{days of storage}} \right]} \right.} \right\}} \right) - \left[ {\Psi _{{\rm bi}} \left( {50} \right) -\Psi _{{\rm bf}} \left( {50} \right)} \right],} $$
where subscripts i and f denote the initial and final value of the parameter, respectively, and K is the exponential rate at which the parameter increases in relation to days of storage; the higher the value of K the higher the exponential rate of increase of Ψb(50) with storage time (i.e. the higher the rate of induction into secondary dormancy). For adjusting equation (3) Ψbi(50) was the Ψb(50) after the stratification period for each germination temperature, while Ψbf(50) was the highest value of Ψb(50) achieved during storage at each germination temperature (i.e. the Ψb(50) for seeds showing the highest dormancy level at each germination temperature) (Table 2).
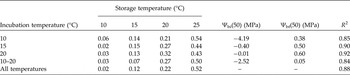
The Ψb(50) exponential increase rate (parameter K in equation 2) for seeds incubated at different temperatures showed similar values for each storage temperature (Table 3). This similarity among K values indicates that the relative change in Ψb(50) [the one observed between Ψbi(50) and Ψbf(50)] during storage at the different temperatures was similar across incubation temperatures. Therefore a single K value (equation 2) was determined for each storage temperature (Table 3). These values were obtained through optimization to get the value of K that minimized the RMSE between simulated and observed values of Ψb(50) through storage for seeds germinated at the four tested thermal regimes for each storage temperature. Using a single value of K for each storage temperature, the model was able to account for 88% of the variability in Ψb(50) for seed incubated at the different thermal regimes (Table 3; Fig. 3).
Values of K obtained from the adjustment of exponential equations

Values of parameter K were obtained from the adjustment of exponential equations: Ψb(50) = Ψbi(50) + {([Ψbi(50) – Ψbf(50)] × [exp (–K × days of storage)]} – [Ψbi(50) – Ψbf(50)], to changes in the mean base water potential for germination [Ψb(50)] for seeds incubated under different temperatures during moist storage at 10, 15, 20 and 25°C; seeds were stratified for 109 at 5°C before storage. Ψbi(50) and Ψbf(50) are the initial and final Ψb(50) at each incubation temperature. Ψbi(50) corresponds to the Ψb(50) for seeds stratified for 109 days at 5°C, while Ψbf(50) is the higher Ψb(50) observed during storage at each temperature (see Table 2). In the last row (‘All temperatures’), a single K value for each storage temperature across all incubation temperatures was adjusted by minimizing the RMSE between simulated and observed values at each storage temperature for seeds germinated at the four tested thermal regimes. R 2 are coefficients of determination of the adjustment of the exponential equations to observed Ψb(50) values (see panels A to D in Fig. 3).
The pattern of decrease in σΨb and θH showed a similar exponential trend to storage time to that observed for Ψb(50), so similar exponential functions (although decreasing) were adjusted:
 $${\rm \theta} _{\rm H} {\rm = \theta} _{{\rm Hi}} {\rm - (\theta} _{{\rm Hi}} {\rm -\theta} _{{\rm Hf}} {\rm )} \times \left[ {{\rm 1 - exp} \left( {{-K} \times \hbox{days of storage}} \right)} \right]{\rm, and}$$
 $${\rm \sigma} _{{\rm \Psi b}} {\rm = \sigma} _{{\rm \Psi bi}} {\rm -} \left( {{\rm \sigma} _{{\rm \Psi bi}} {\rm - \sigma} _{{\rm \Psi bf}}} \right) \times \left[ {{\rm 1 - exp} \left( {{-K} \times \hbox{days of storage}} \right)} \right]{\rm,} $$
where σΨbi and θHi were those values obtained after the stratification period for each germination temperature, and σΨbf and θHf were the lowest values achieved during storage at each germination temperature (Table 2).
Functions were adjusted using an identical optimization procedure to that explained for Ψb(50), in which single K values for each storage temperature were obtained by minimizing the RMSE between simulated and observed values of σΨb and θH through storage for seeds germinated at the four tested thermal regimes (Fig. 3). These models were able to account for 50% (R 2 = 0.5) and 80% (R 2 = 0.8) of the variability of σΨb and θH, respectively.
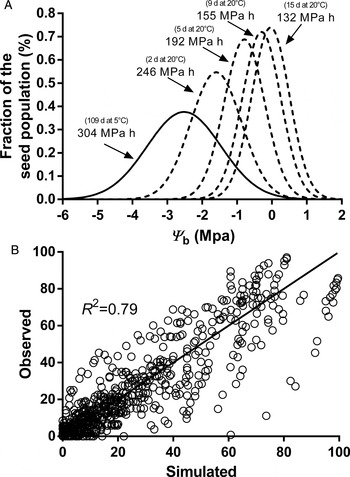
K values (i.e. the exponential increasing or decreasing rate) for each hydrotime model parameter showed an increasing trend with storage temperature which can be adequately described by adjusting a bi-linear model, in which the rate of increase was higher above 20°C than between 10 and 20°C (Fig. 4). This difference was more striking for σΨb and θH than for Ψb(50). Optimized K values and initial and final values of hydrotime model parameters were used together with equations 2, 3, 4 and 5 to predict germination time course curves at different temperatures and water potentials for seeds stored at 10, 15, 20 and 25°C for different time intervals. The developed model gave a good description of germination data showing a R 2 of 0.79 (Fig. 5B). It is important to note that values of Ψb(50) for seeds stored at 10°C and germinated at 10°C were not used to develop the model because they somehow overestimated dormancy induction rate at this temperature (Fig. 3); however, germination data for seeds stored and germinated at 10°C were included in Fig. 5B.
(A) Simulated progressive shifts in the distribution of the base water potential (Ψb) of the seed population and reductions in the hydrotime required for seed germination (θH) during dormancy induction at 20°C for seeds germinated at 10/20°C. Seeds were stratified for 109 days at 5°C (continuous line) and afterwards moist-stored for 2, 5, 9 and 15 days at 20°C (interrupted lines). Ψb distributions were simulated using equations 3 [Ψb(50)] and 5 (σΨb) with K values of 0.22 and 0.5, respectively, and Ψbi(50) of –2.52 MPa, Ψbf(50) of 0.05 MPa, σΨbi of 1.06 MPa and σΨbf of 0.54 MPa. θH values were simulated using equation 4 with a K value of 0.19, θHi of 304 MPa h and θHf of 122 MPa h. (B) Observed vs simulated germination data for previously stratified seeds (moist-stored for 109 days at 5°C) stored at 10, 15, 20 and 25°C for different periods and germinated at 10, 15, 20 and 10/20°C under water potentials of 0, –0.2 and –0.4 MPa (excluding data for seeds stored and germinated at 10°C, the R 2 is 0.85). Simulations were performed using equations 2, 3, 4 and 5. The values of K used in equations 3, 4 and 5 for each storage temperature were those presented in Fig. 4, while initial and final value of each parameter were those indicated in Table 2.

Discussion
For seed banks showing seasonal changes in their dormancy level, the possibility of predicting temporal patterns of seedling emergence depends on establishing a robust relationship between temperature and the rate of dormancy loss and induction. However, although the dormancy loss process has been extensively studied, less work has been advocated to the quantification of temperature effects on dormancy induction. In the present work we quantified temperature regulation of dormancy induction in Polygonum aviculare seeds using the hydrotime model.
To study induction into secondary dormancy seeds were previously released from primary dormancy through stratification at 5°C. Dormancy release during stratification was characterized by a decrease in the Ψb(50) of the seed population (Fig. 1; Table 1), as has been observed previously for P. aviculare (Batlla and Benech-Arnold, Reference Batlla and Benech-Arnold2004) and other species (Bauer et al., Reference Bauer, Meyer and Allen1998; Meyer et al., Reference Meyer, Debaene-Gill and Allen2000; Alvarado and Bradford, Reference Alvarado and Bradford2005; Gianinetti and Cohn, Reference Gianinetti and Cohn2007).
However, in the present work the rate of reduction in Ψb(50) was dependent on the thermal regime under which seeds were incubated during the germination test. Seeds incubated under alternating temperatures showed an almost linear decrease in Ψb(50) during stratification, reaching values significantly lower than the ones observed for seeds incubated under constant 15°C. This difference between incubation regimes could be attributed to the promotive effect of alternating temperatures over germination, as has been previously demonstrated for P. aviculare by Batlla et al. (Reference Batlla, Verges and Benech-Arnold2003).
On the contrary, storage of previously stratified seed under temperatures in the range 10–25°C caused a progressive decrease in germination percentage and velocity at all incubation temperatures, and consequently a progressive increase in Ψb(50) (Table 2; Figs 2 and 3). An increase in Ψb(50) during induction into secondary dormancy was previously reported for Jatropha curcas seeds by Windauer et al. (Reference Windauer, Martinez, Rapoport, Wassner and Benech-Arnold2012), and more recently by Hawkins et al. (Reference Hawkins, Allen and Meyer2017) in seeds of Bromus tectorum. The observed increase in Ψb(50) for seeds stored and germinated at different temperatures showed an exponential trend and was adequately described adjusting an exponential function where the parameter K quantified the exponential rate of increase in Ψb(50) (i.e. the rate of dormancy induction). The rate of increase in Ψb(50) (i.e. K values) showed a positive relationship with storage temperature. However, presented results showed the existence of a bi-linear relationship between temperature and rate of induction into secondary dormancy, where temperatures close to 25°C have a greater effect on dormancy induction than lower temperatures (Fig. 4). On the other hand, temperatures below 9°C showed null or minimum effects on dormancy induction. In a recent study, in which the effect of temperature on P. aviculare seed dormancy induction was evaluated through changes in the mean lower limit temperature for seed germination, a similar minimum value for dormancy induction was reported (7.9°C) (Malavert et al., Reference Malavert, Batlla and Benech-Arnold2017). Analogous values of minimum temperature for dormancy induction were reported for Polygonum persicaria (8.1°C) and Chenopodium album (8.9°C) by Vleeshouwers and Bouwmeester (Reference Vleeshouwers and Bouwmeester2001).
Observed changes in Ψb(50) during dormancy release and induction were dependent on incubation temperature (Tables 1 and 2). For example, during dormancy induction seeds incubated under lower temperatures or alternating temperature regimes showed lower values of Ψb(50) than those observed for seed incubated at higher temperatures (Table 2; Fig. 3). This incubation temperature-dependent response is due to the fact that in seeds of many weed species, as for example in P. aviculare, dormancy changes may occur during the germination test (Batlla et al., Reference Batlla, Grundy, Dent, Clay and Finch-Savage2009; Windauer et al., Reference Windauer, Martinez, Rapoport, Wassner and Benech-Arnold2012; Batlla and Benech-Arnold, Reference Batlla and Benech-Arnold2015). In P. aviculare seeds some dormancy release may take place when seeds are incubated at low temperatures, as for example at 10°C, while some dormancy induction might take place when seeds are incubated at higher temperatures. This result in lower Ψb(50) values for seeds incubated at lower temperatures. As mentioned above, the case of the alternating temperature regime can be explained by the fact that alternating temperatures promote germination in P. aviculare seed, although some dormancy release effect due to incubation at low temperatures (10°C) should not be discarded.
These changes in germination behaviour associated with dormancy effects during incubation precluded the possibility of performing a hydrothermal time analysis in which germination at different temperatures could be analysed altogether (the adjustment of a hydrothermal time model to germination data showed low R 2 values; data not shown). Based on the impossibility of using the hydrothermal time analysis we performed a hydrotime analysis for each incubation temperature and adjusted exponential functions to describe changes in Ψb(50) during storage. We also tested the possibility of using a thermal time index to relate changes in Ψb(50) to storage time and temperature (data not shown). However, the bi-linear nature of the relationship between the rate of change in Ψb(50) (i.e. K values) and temperature (Fig. 4) makes the present modelling approach more accurate. On the other hand, because seeds were stored in the dark (buried in the soil) possible changes in the effect of temperature on seed dormancy by prevailing light conditions cannot be ruled out. However, reported evidence showing that similar temperature-dependent dormancy changes can take place in P. aviculare seeds exposed to the light (Batlla et al., Reference Batlla, Grundy, Dent, Clay and Finch-Savage2009) suggest that, if there is any effect of light conditions, this is not significant.
Ψb(50) showed the higher level of variation during dormancy induction (coefficient of variation (CV) 176%); however, the other hydrotime model parameters (θH and σΨb), also varied during storage (CV 96 and 49%, respectively). Although changes in θH and σΨb depended on incubation temperature [as observed for Ψb(50)], in general θH and σΨb showed an increase during dormancy release and a decrease during dormancy induction (Tables 1 and 2; Fig 3); recent work by Hawkins et al. (Reference Hawkins, Allen and Meyer2017) also reported a decrease in the hydrothermal time required for seed germination (θHT) during dormancy induction in B. tectorum seeds. To our knowledge, the present study is the first work to show consistent changes in both parameters during dormancy release and induction. As observed for Ψb(50), changes in θH and σΨb during storage also showed an exponential trend that could be described using a single K value for each storage temperature (Fig. 3). The response of K to storage temperature was similar to the one observed for Ψb(50), in which the value of K was higher at 25°C than at temperatures below 20°C (Fig. 4), although differences between both thermal ranges were more striking than that observed for Ψb(50). These results show that at higher storage temperatures (i.e. 25°C) we should also take into account changes in θH and σΨb if we want to predict changes in seed germination behaviour.
Using the developed bi-linear equations relating K values for the different hydrotime model parameters to storage temperature (Fig. 4), and the exponential functions 3, 4 and 5, changes in the distribution of Ψb and θH during storage at different dormancy inductive temperatures can be predicted. An example of simulated progressive shifts in the distribution of Ψb to higher values together with a reduction in θH during dormancy induction for seeds stored at 20°C is shown in Fig. 5A. Simulated hydrotime model parameters were afterwards used to predict seed germination behaviour during dormancy induction under tested conditions (Fig. 5B). The developed model was able to give an acceptable simulation of seed germination behaviour, showing the validity of derived functions and parameters. The model was also tested letting Ψb(50) vary during dormancy induction and assuming fixed mean values of θH and σΨb for each incubation temperature (data not shown). However, letting the three hydrotime parameters vary gave a better fit to observed data (F-test (6.75), P < 0.0001; difference in corrected Akaike Information Criteria (AICc) of –287.02), indicating that taking into account changes in θH and σΨb was necessary to correctly predict changes in germination behaviour during dormancy induction.
In the present work, we used the hydrotime model to analyse the effect of temperature on P. aviculare seed germination behaviour during dormancy induction. Obtained results show that the rate of induction into secondary dormancy presents a bi-linear relationship to temperature, in which temperatures higher than 20°C cause a higher rate of dormancy induction than those below this value. In addition, the comparison of results obtained during dormancy release and induction shows that the rate of dormancy induction at high temperatures is more than one order of magnitude higher than the rate of dormancy release at low temperatures. For example, seeds stored for 46 days at 5°C incubated at 10/20°C showed a reduction in Ψb(50) of 0.91 MPa (from –0.14 to –1.05 MPa) (Table 1), while previously stratified seeds stored at 25°C for just 7 days incubated at 10/20°C increased Ψb(50) in 2.57 MPa (from –2.52 to 0.05 MPa) (Table 2D). This implies that, under field conditions, a few days of high temperatures during early spring can drastically increase the dormancy level of the seed bank. Thus induction into secondary dormancy could be playing a key role in determining the temporal patterns of weed emergence in the field, probably being as relevant as the dormancy release process.
Acknowledgements
We would like to thank Professor Roberto Benech-Arnold for valuable experimental advice and critical reading of previous versions of this manuscript.
Financial support
This work was supported by UBACYT no. 20020130100653BA from the Universidad de Buenos Aires and PICT 2015–3087 from ANCYPT (Agencia Nacional de Promoción Científica y Tecnológica), Argentina.
Conflicts of interest
None.
Supplementary material
To view supplementary material for this article, please visit https://doi.org/10.1017/S0960258517000198