Introduction
The average 14C production rate (2 atoms·cm−2·s−1; Castagnoli and Lal Reference Castagnoli and Lal1980) is influenced by fluctuations in cosmic flux intensity, which arise from phenomena such as solar proton events (SPEs), supernovae (SNe), and gamma-ray bursts (GRBs). These fluctuations are further modulated by variations in the intensity of solar, interplanetary, and terrestrial magnetic fields. To reconstruct historical changes in radiocarbon concentrations, which reflect both variations in production and shifts in the carbon cycle over the past 12,500 years, dendrochronologically dated tree rings have been utilized (Hogg et al. Reference Hogg, Heaton, Hua, Palmer, Turney and Wacker2020; Reimer et al. Reference Reimer, Austin, Bard, Bayliss, Blackwell, Bronk Ramsey, Butzin, Cheng, Edwards and Friedrich2020; van der Plicht Reference van der Plicht, Holloway and Elias2007). The advancement of AMS (accelerator mass spectrometry) techniques has significantly improved measurement resolution and precision while reducing the sample size required for analysis (Molnár et al. Reference Molnar, Rinyu, Veres, Seiler, Wacker and Synal2016; Synal et al. Reference Synal, Stocker and Suter2007), enabling to highlight short term production variations and the creation of calibration curves with annual resolution (Hogg et al. Reference Hogg, Heaton, Hua, Palmer, Turney and Wacker2020; Reimer et al. Reference Reimer, Austin, Bard, Bayliss, Blackwell, Bronk Ramsey, Butzin, Cheng, Edwards and Friedrich2020).
The first confirmed rapid increase in radiocarbon concentration, reported by Miyake et al. (Reference Miyake, Nagaya, Masuda and Nakamura2012), occurred between 774–775 CE. This event, marked by a significant 12‰ rise in Δ14C within a single year, has since been independently validated by multiple studies (Büntgen et al. Reference Büntgen, Wacker, Galván, Arnold, Arseneault, Baillie, Beer, Bernabei, Bleicher and Boswijk2018; Güttler et al. Reference Güttler, Adolphi, Beer, Bleicher, Boswijk, Christl, Hogg, Palmer, Vockenhuber, Wacker and Wunder2015; Jull et al. Reference Jull, Panyushkina, Lange, Kukarskih, Myglan, Clark, Salzer, Burr and Leavitt2014; Rakowski et al. Reference Rakowski, Krąpiec, Huels, Pawlyta, Dreves and Meadows2015) in dendrochronologically dated tree rings from diverse global locations, confirming its worldwide impact.
Subsequent studies have identified similar events at various time periods. An 11.3‰ Δ14C increase was recorded between 993–994 CE (Miyake et al. Reference Miyake, Masuda and Nakamura2013, Reference Miyake, Masuda, Hakozaki, Nakamura, Tokanai, Kato, Kimura and Mitsutani2014), later corroborated by Rakowski et al. (Reference Rakowski, Krąpiec, Huels, Pawlyta and Boudin2018), Fogtman-Schultz et al. (Reference Fogtmann-Schulz, Ostbo, Nielsen, Olsen, Karoff and Knudsen2017), and Büntgen et al. (Reference Büntgen, Wacker, Galván, Arnold, Arseneault, Baillie, Beer, Bernabei, Bleicher and Boswijk2018). A rapid increase around 660 BCE was confirmed by Park et al. (Reference Park, Southon, Fahrni, Creasman and Mewaldt2017), Rakowski et al. (Reference Rakowski, Krąpiec, Huels, Pawlyta, Hamann and Wiktorowski2019), Possnert et al. (Reference Possnert, Southon, Bard, ASTER and Muschler2019), and Sakurai et al. (Reference Sakurai, Tokanai, Miyake, Horiuchi, Masuda, Miyahara, Ohyama, Sakamoto, Mitsurani and Moriya2020), with sub-annual tree-ring data suggesting two phases: the first between 665–664 BCE and the second in late spring of 663 BCE (Rakowski et al. Reference Rakowski, Pawlyta, Miyahara, Krąpiec, Molnar, Wiktorowski and Minami2024).
Other notable events were observed between 814–815 BCE (Jull et al. Reference Jull, Panyushkina, Miyake, Masuda, Nakamura, Mitsutani, Lange, Cruz, Baisan, Janovics, Varga and Molnar2018), 1054–1055 CE (Terrasi et al. Reference Terrasi, Marzaioli, Bouompane, Passariello, Capano, Helama, Oinonen, Nojd, Uusitalo, Jull, Panyushkina, Baisan, Molnar, Varga, Kovaltsov, Poluianov and Usoskin2020), and during a series of events spanning 1261–1262, 1268–1269, and 1279–1280 CE (Miyahara et al. Reference Miyahara, Tokanai, Moriya, Takeyama, Sakurai, Ohyama, Horuchi and Hotta2022). Two rapid radiocarbon increases occurred in the mid-Holocene, around 5480 BCE (Miyake et al. Reference Miyake, Jull, Panyushkina, Wacker, Salzer, Baisan, Lange, Cruz, Masuda and Nakamura2017), and 7176 BCE, the latter comparable in magnitude to the 774–775 CE event (Brehm et al. Reference Brehm, Christl, Adolphi, Muscheler, Synal, Mekhaldi, Paleari, Leuschner, Bayliss, Nicolussi, Pichler, Schlüchter, Pearson, Salzer, Fonti, Nievergelt, Hantemirov, Brown, Usoskin and Wacker2021b). Recently, Bard et al. (Reference Bard, Miramont, Capano, Guibal, Marschal, Rostek, Tuna, Fagault and Heaton2023) reported another large 14C increase during the last deglaciation.
Most of these events have been attributed to SEPs, as evidenced by the increased production of isotopes like 10Be and 36Cl, supporting their solar origin (e.g., Mekhaldi et al. Reference Mekhaldi, Muscheler, Adolphi, Aldahan, Beer, McConnell, Possnert, Sigl, Svensson, Synal, Welten and Woodruff2015; Pavlov et al. Reference Pavlov, Blinov, Konstantinov, Ostryakov, Vasilyev, Vdovina and Volkov2013). However, the origins of events with lower magnitudes, such as those from 814–815 BCE (Jull et al. Reference Jull, Panyushkina, Miyake, Masuda, Nakamura, Mitsutani, Lange, Cruz, Baisan, Janovics, Varga and Molnar2018) and 1054–1055 CE (Terrasi et al. Reference Terrasi, Marzaioli, Bouompane, Passariello, Capano, Helama, Oinonen, Nojd, Uusitalo, Jull, Panyushkina, Baisan, Molnar, Varga, Kovaltsov, Poluianov and Usoskin2020), remain unclear due to the lack of 10Be and 36Cl production data. For the 1054–1055 CE event, the Crab Nebula supernova (SN 1054; Mayall Reference Mayall1939) has been proposed as a potential source of the increased radiocarbon production (Terrasi et al. Reference Terrasi, Marzaioli, Bouompane, Passariello, Capano, Helama, Oinonen, Nojd, Uusitalo, Jull, Panyushkina, Baisan, Molnar, Varga, Kovaltsov, Poluianov and Usoskin2020).
These rapid 14C fluctuations are critical for radiocarbon dating. They enhance our understanding of the phenomena affecting isotope production rates while improving the precision of calibration curves. This is particularly significant for dating short-lived materials, such as leaves or seeds, where unaccounted-for variations in Δ14C could yield erroneous calibrated ages.
Additionally, 14C peaks enable high-precision dating with annual resolution through wiggle-matching-like techniques. For example, Wacker et al. (Reference Wacker, Guttler, Goll, Hurni, Synal and Walti2014) used this approach to precisely date timber from the historical Holy Cross chapel in Val Müstair, Switzerland. Similarly, Krąpiec et al. (Reference Krąpiec, Rakowski, Pawlyta, Wiktorowski and Bolka2020) employed the Δ14C increase from 993–994 CE to establish an absolute calendar age for a 227-year-long pine dendrochronology scale spanning 859–1085 CE. Other studies (e.g., Hakozaki et al. Reference Hakozaki, Miyake, Nakamura, Kimura, Masuda and Okuno2018; Kuitems et al. Reference Kuitems, Wallace, Lindsay, Scifo, Doeve, Jenkins, Lindauer, Erdil, Ledger, Forbes, Vermeeren, Friedrich and Dee2022; Oppenheimer et al. Reference Oppenheimer, Wacker, Xu, Galván, Stoffel, Guillet, Corona, Sigl, Cosmo, Hajdas, Pan, Breuker, Schneider, Esper, Fei, Hammond and Büntgen2017; Philipsen et al. Reference Philipsen, Feveile, Olsen and Sindbaek2022) have also leveraged these events for precise chronological determinations using tree-ring sequences.
In this paper, we conduct measurements of annual 14C using tree rings of sub-fossil oak (Quercus robur) from southern Poland (1042–1062 CE) to constrain the time profile and the production rate of 14C around 1053–1055 CE.
Sample and methods
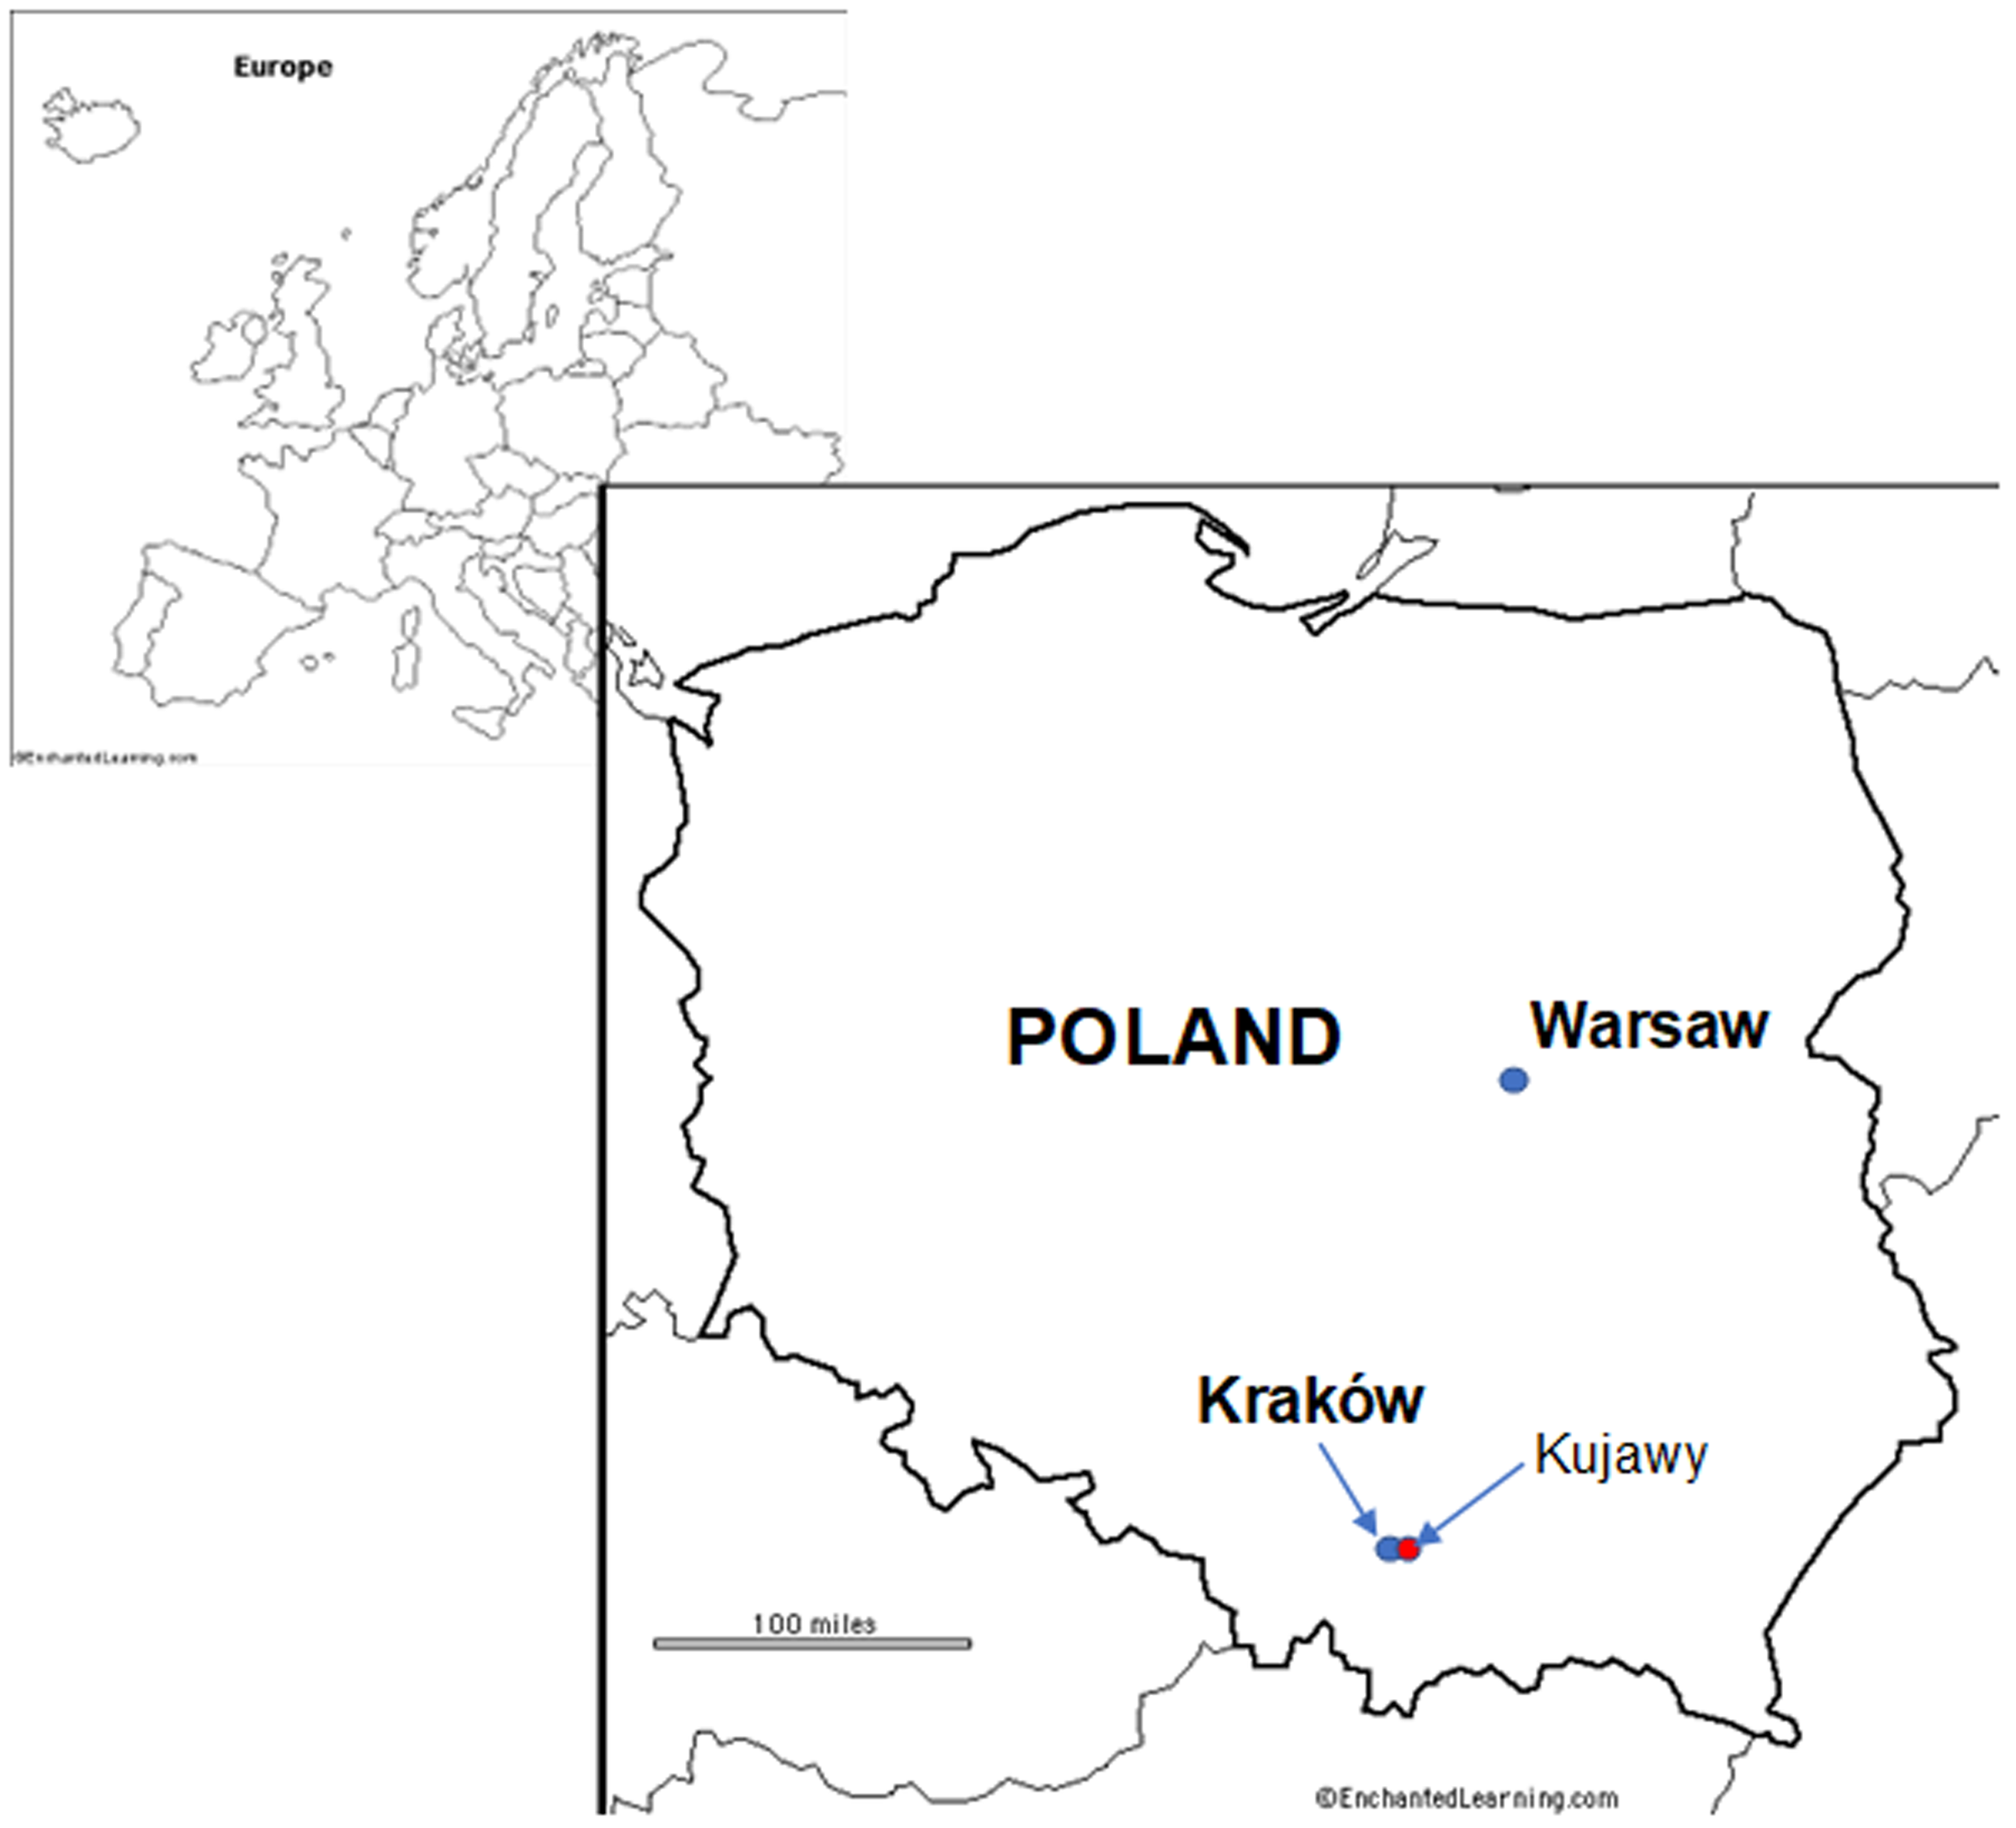
Sub-fossil oaks (Quercus robur L.) excavated from a gravel pit near the Vistula River in Kujawy, a village near Kraków (southern Poland; Figure 1), were utilized for this study. In the 1990s, 98 oak trunks were uncovered from the Vistula River’s alluvial deposits during the construction of a sewage treatment plant. All trunks underwent dendrochronological analysis. Based on the 73 best-correlated sequences, a local chronology spanning 387–1316 CE was established (Kalicki and Krąpiec Reference Kalicki, Krąpiec and Starkel1992; Krąpiec Reference Krąpiec2001). Sample KU43 was dendrochronologically dated to 944–1073 CE using the standard southern Poland oak chronology, POLSKA 2 (Krąpiec Reference Krąpiec2001), achieving a correlation significance of t = 9 and a Gleichläufigkeit (GI) value of 72%. The t-value measures the statistical correlation significance between two series, requiring a minimum threshold of 3.5 to ensure reliable dating (Baillie and Pilcher Reference Baillie and Pilcher1973). The GI, developed as a cross-dating tool, quantifies the similarity in trends of tree-ring widths, expressed as a percentage of intervals (Eckstein and Bauch Reference Eckstein and Bauch1969).
Location of Kujawy village, near Kraków, southern Poland (50.0522 N, 20.1035 E).

The annual tree-ring samples were processed for α-cellulose extraction following the protocol developed based on results presented in Michczyńska et al. (Reference Michczyńska, Krąpiec, Michczyński, Pawlyta, Goslar, Nawrocka, Piotrowska, Szychowska-Krąpiec, Waliszewska and Zborowska2018). Initially, the wood samples were dried, cut into shavings, weighed, and placed into glass tubes. The samples were treated with deionized water, sodium chlorite, and 1% HCl, then subjected to ultrasonic baths at 70°C for 1 hr. This procedure, designed to remove lignin, was repeated five times, followed by rinsing with hot deionized water to achieve a neutral pH. The remaining sample, primarily holocellulose, underwent further treatment:
-
1. 10% NaOH Treatment: Samples were immersed in a 10% NaOH solution in an ultrasonic bath at 70°C for 45 min, followed by rinsing with cold deionized water.
-
2. 17% NaOH Treatment: Samples were treated with a 17% NaOH solution at room temperature in an ultrasonic bath for 45 min, rinsed with hot deionized water, and adjusted to neutral pH.
Finally, the samples were treated with 1% HCl and rinsed to neutral pH. The extracted α-cellulose was dried overnight at 70°C.
The dried α-cellulose was combusted in evacuated, flame-sealed glass tubes containing manganese dioxide (MnO2) as an oxidizing agent (Janovics et al. Reference Janovics, Futó and Molnár2018). The tubes were evacuated and sealed before being combusted at 550°C for 12 hr. The resulting CO2 was purified in a vacuum line and transferred to a second tube containing zinc, titanium hydride, and iron. Graphitization involved a two-step heating process (Rinyu et al. Reference Rinyu, Molnár, Major, Nagy, Veres, Kimák, Wacker and Synal2013):
-
1. Initial heating at 500°C for 3 hr to release hydrogen and facilitate iron reduction.
-
2. Secondary heating at 550°C for 5 hr to reduce CO2 to graphite.
The graphite was then pressed into cathodes for measurement using the EnvironMICADAS AMS system at the ATOMKI in Debrecen, Hungary (Molnár et al. Reference Molnar, Rinyu, Veres, Seiler, Wacker and Synal2016). Measurement times were extended to achieve over 400,000 counts, ensuring uncertainties of better than ±2‰ for modern samples. Data acquisition was conducted using BATS software (Wacker et al. Reference Wacker, Christl and Synal2010). Radiocarbon content was reported as Δ14C (‰), calculated as deviations from the NBS oxalic acid standard (SRM-4990C; activity = 0.7459). Corrections for isotopic composition (δ1 3C, measured by AMS) and age were performed using the equations outlined by Stuiver and Polach (Reference Stuiver and Polach1977).
Results and discussion
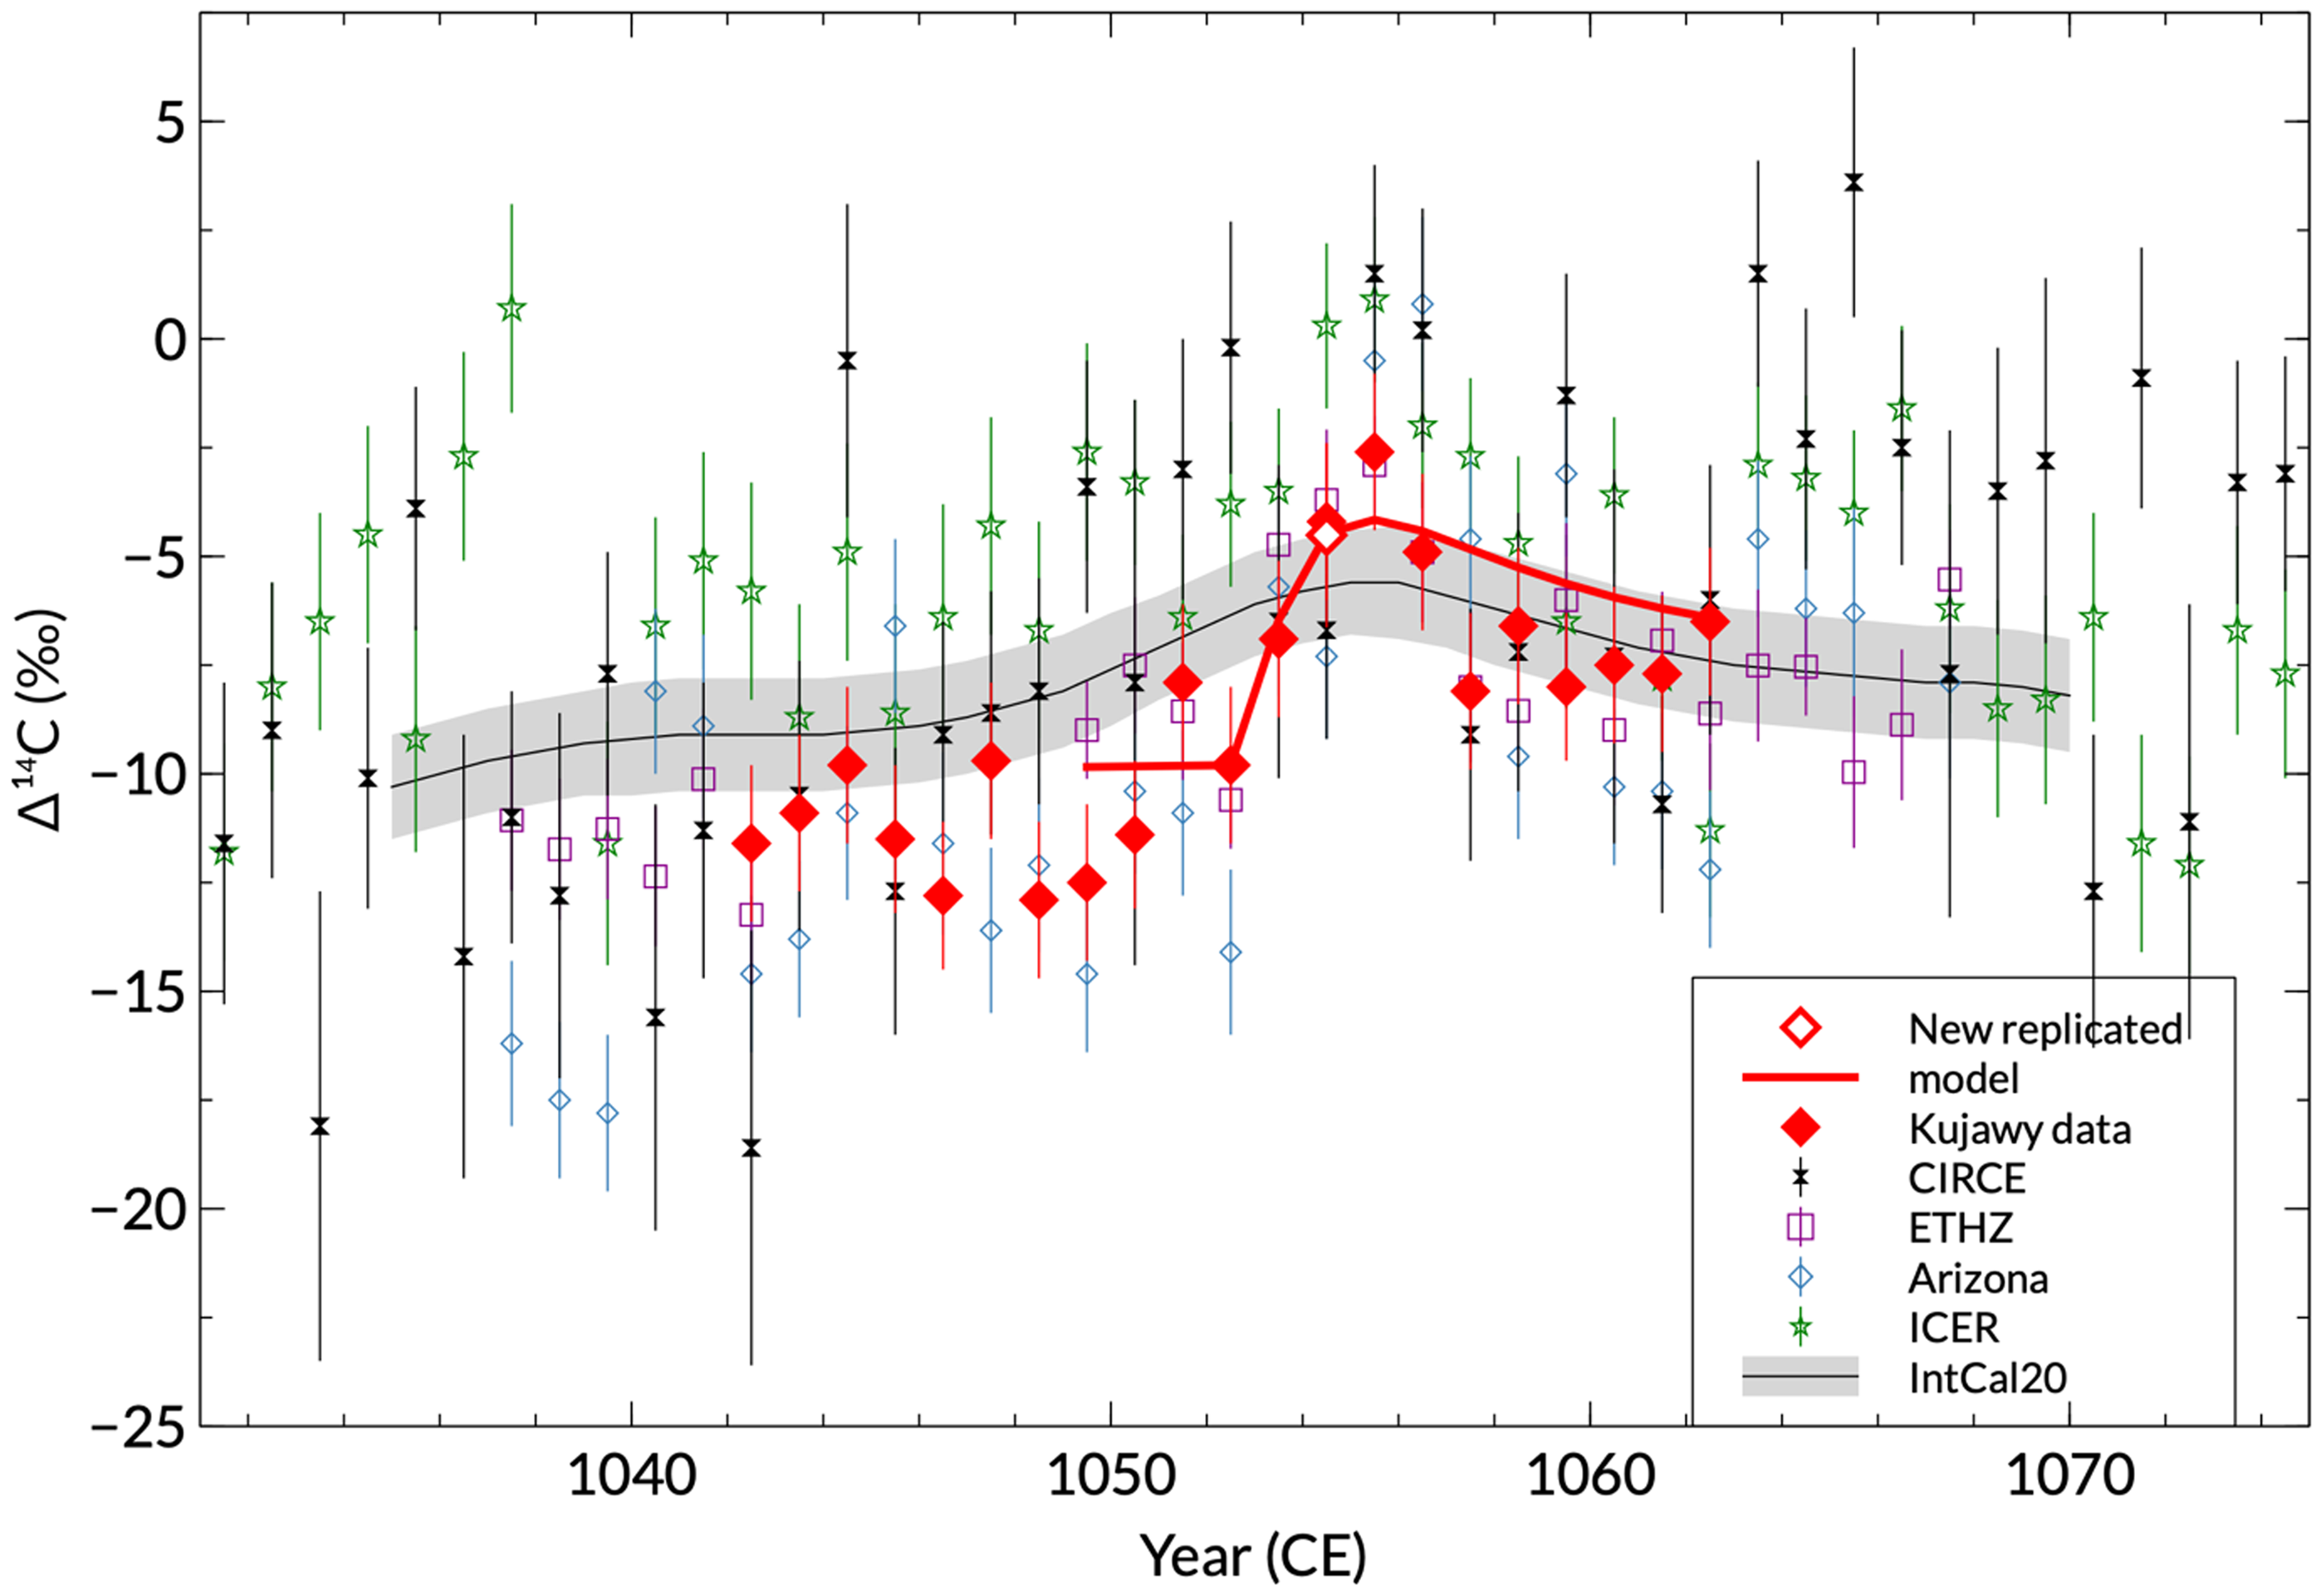
The results for the analyzed years 1042–1062 CE (pMC, Δ14C), along with their corresponding uncertainties, are presented in Table S1. Figure 1 displays Δ14C values from annual tree rings of sub-fossil oak (Quercus robur L.) from Kujawy village during this period. The figure also includes comparative data from Terrasi et al. (Reference Terrasi, Marzaioli, Bouompane, Passariello, Capano, Helama, Oinonen, Nojd, Uusitalo, Jull, Panyushkina, Baisan, Molnar, Varga, Kovaltsov, Poluianov and Usoskin2020, ICER EW, ICER LW, CIRCE), Brehm et al. (Reference Brehm, Bayliss, Christl, Synal, Adolphi, Beer, Kromer, Muscheler, Solanki, Usoskin, Bleicher, Bollhalder, Tyers and Wacker2021a, ETHZ), Eastoe et al. (Reference Eastoe, Tucek and Touchan2019, Arizona), and IntCal20 (Reimer et al. Reference Reimer, Austin, Bard, Bayliss, Blackwell, Bronk Ramsey, Butzin, Cheng, Edwards and Friedrich2020).
The annual data from Kujawy core KU43 reveal a sustained increase in Δ14C values between 1053 and 1055 CE, rising from −6.9 ± 1.8‰ to −2.6 ± 1.8‰. For the preceding period (1042–1052 CE), the average Δ14C value is −11.0 ± 1.9‰, indicating a significant increase of 8.4 ± 2.6‰ toward 1055 CE, with a confidence level of 3.4σ. This enhancement exceeds an ordinary variability level associated with solar cycles (Rakowski et al. Reference Rakowski, Krąpiec, Huels, Pawlyta and Boudin2018 and Brehm et al. Reference Brehm, Bayliss, Christl, Synal, Adolphi, Beer, Kromer, Muscheler, Solanki, Usoskin, Bleicher, Bollhalder, Tyers and Wacker2021a), although it has been suggested that GCR variability may become larger associated to the change in the heliospheric environment (Kataoka et al. Reference Kataoka, Miyahara and Steinhilber2012). Terrasi et al. (Reference Terrasi, Marzaioli, Bouompane, Passariello, Capano, Helama, Oinonen, Nojd, Uusitalo, Jull, Panyushkina, Baisan, Molnar, Varga, Kovaltsov, Poluianov and Usoskin2020) reported that the increase began in 1054 CE, with Δ14C values in the earlywood (EW) rising from −7.82 ± 2.04‰ in 1053 CE to −0.91 ± 2.04‰ in 1054 CE (see Figure 2).
Δ14C values for sub-fossil oak (Quercus robur L.) from the Kujawy site, spanning 1042–1062 CE (red diamonds). The figure also includes comparative data from Terrasi et al. (2020; ICER EW, ICER LW, CIRCE), Brehm et al. (Reference Brehm, Bayliss, Christl, Synal, Adolphi, Beer, Kromer, Muscheler, Solanki, Usoskin, Bleicher, Bollhalder, Tyers and Wacker2021a; ETHZ), Eastoe et al. (Reference Eastoe, Tucek and Touchan2019; Arizona), and IntCal20 (Reimer et al. Reference Reimer, Austin, Bard, Bayliss, Blackwell, Bronk Ramsey, Butzin, Cheng, Edwards and Friedrich2020). The red line represents the model used to estimate the total 14C production.

The average Δ14C values and the standard deviation of the mean for 1042–1052 CE were calculated as follows: −7.4 ± 2.7‰ (EW) and −8.5 ± 2.1‰ (LW) from Terrasi et al. (Reference Terrasi, Marzaioli, Bouompane, Passariello, Capano, Helama, Oinonen, Nojd, Uusitalo, Jull, Panyushkina, Baisan, Molnar, Varga, Kovaltsov, Poluianov and Usoskin2020), −7.5 ± 5.2‰ for Finnish pine (Terrasi et al. Reference Terrasi, Marzaioli, Bouompane, Passariello, Capano, Helama, Oinonen, Nojd, Uusitalo, Jull, Panyushkina, Baisan, Molnar, Varga, Kovaltsov, Poluianov and Usoskin2020), −9.8 ± 2.2‰ for English oak (Brehm et al. Reference Brehm, Bayliss, Christl, Synal, Adolphi, Beer, Kromer, Muscheler, Solanki, Usoskin, Bleicher, Bollhalder, Tyers and Wacker2021a), and −12.1 ± 2.4‰ for sequoia (Eastoe et al. Reference Eastoe, Tucek and Touchan2019). The increases in Δ14C values in 1055 CE were calculated as 9.5 ± 3.4‰ (EW), 8.8 ± 3.0‰ (LW) (Terrasi et al. Reference Terrasi, Marzaioli, Bouompane, Passariello, Capano, Helama, Oinonen, Nojd, Uusitalo, Jull, Panyushkina, Baisan, Molnar, Varga, Kovaltsov, Poluianov and Usoskin2020), 9.0 ± 6.0‰ (Finnish pine; Terrasi et al. Reference Terrasi, Marzaioli, Bouompane, Passariello, Capano, Helama, Oinonen, Nojd, Uusitalo, Jull, Panyushkina, Baisan, Molnar, Varga, Kovaltsov, Poluianov and Usoskin2020), 6.9 ± 2.5‰ (English oak; Brehm et al. Reference Brehm, Bayliss, Christl, Synal, Adolphi, Beer, Kromer, Muscheler, Solanki, Usoskin, Bleicher, Bollhalder, Tyers and Wacker2021a), and 11.6 ± 3.1‰ (sequoia; Eastoe et al. Reference Eastoe, Tucek and Touchan2019), aligning closely with the values obtained in this study.
A systematic offset is observed between our Δ14C data and previously published results. Compared to the EW ICER data (Terrasi et al. Reference Terrasi, Marzaioli, Bouompane, Passariello, Capano, Helama, Oinonen, Nojd, Uusitalo, Jull, Panyushkina, Baisan, Molnar, Varga, Kovaltsov, Poluianov and Usoskin2020), our values show an average shift of −2.9 ± 3.0‰, and −1.9 ± 2.1‰ when compared to LW ICER data (Terrasi et al. Reference Terrasi, Marzaioli, Bouompane, Passariello, Capano, Helama, Oinonen, Nojd, Uusitalo, Jull, Panyushkina, Baisan, Molnar, Varga, Kovaltsov, Poluianov and Usoskin2020). A similar offset of −2.3 ± 4.5‰ is observed against Finnish pine CIRCE data (Terrasi et al. Reference Terrasi, Marzaioli, Bouompane, Passariello, Capano, Helama, Oinonen, Nojd, Uusitalo, Jull, Panyushkina, Baisan, Molnar, Varga, Kovaltsov, Poluianov and Usoskin2020). However, negligible differences are noted when comparing our data with Δ14C values for English oak (Brehm et al. Reference Brehm, Bayliss, Christl, Synal, Adolphi, Beer, Kromer, Muscheler, Solanki, Usoskin, Bleicher, Bollhalder, Tyers and Wacker2021a; −0.3 ± 1.9‰) and sequoia (Eastoe et al. Reference Eastoe, Tucek and Touchan2019; 0.6 ± 3.4‰).
To estimate the event’s timing, we compared our data with those from other studies (Brehm et al. Reference Brehm, Bayliss, Christl, Synal, Adolphi, Beer, Kromer, Muscheler, Solanki, Usoskin, Bleicher, Bollhalder, Tyers and Wacker2021a; Eastoe et al. Reference Eastoe, Tucek and Touchan2019; Terrasi et al. Reference Terrasi, Marzaioli, Bouompane, Passariello, Capano, Helama, Oinonen, Nojd, Uusitalo, Jull, Panyushkina, Baisan, Molnar, Varga, Kovaltsov, Poluianov and Usoskin2020). Terrasi et al. (Reference Terrasi, Marzaioli, Bouompane, Passariello, Capano, Helama, Oinonen, Nojd, Uusitalo, Jull, Panyushkina, Baisan, Molnar, Varga, Kovaltsov, Poluianov and Usoskin2020) found that Δ14C values in sub-annual rings (ICER EW and ICER LW) of sequoia (Sequoiadendron giganteum L.) suggest the event occurred in 1054 CE. Finnish pine data also point to 1054 CE (Terrasi et al. Reference Terrasi, Marzaioli, Bouompane, Passariello, Capano, Helama, Oinonen, Nojd, Uusitalo, Jull, Panyushkina, Baisan, Molnar, Varga, Kovaltsov, Poluianov and Usoskin2020), while ETHZ data for English oak (Brehm et al. Reference Brehm, Bayliss, Christl, Synal, Adolphi, Beer, Kromer, Muscheler, Solanki, Usoskin, Bleicher, Bollhalder, Tyers and Wacker2021a) and sequoia data from Arizona (Eastoe et al. Reference Eastoe, Tucek and Touchan2019) indicate the event began between 1052 and 1053 CE. Our results from Kujawy also suggest a gradual increase beginning in 1052–1053 CE, peaking at −2.6 ± 1.8‰ in 1055 CE, supporting that the onset of the event may have been earlier than 1054 CE, although additional Δ14C data from sub-annual rings are required to pinpoint the event’s exact timing.
Assuming that this peak was caused by a transient event like a solar proton event, we estimated the total production of 14C using the 11-box carbon cycle model with parameters described in Güttler et al. (Reference Güttler, Adolphi, Beer, Bleicher, Boswijk, Christl, Hogg, Palmer, Vockenhuber, Wacker and Wunder2015). Data points for 1053 and 1054 CE were used to derive the total 14C production, resulting in 8.2 ± 4.5 kg (Figure 2 and Figure S2), consistent with the estimate by Brehm et al. (Reference Brehm, Bayliss, Christl, Synal, Adolphi, Beer, Kromer, Muscheler, Solanki, Usoskin, Bleicher, Bollhalder, Tyers and Wacker2021a). For this calculation, we assumed that the growing season of this tree lasts from April to September (6 months) and that the event occurred in January of 1053 CE with a duration of one month. A stratospheric to tropospheric production ratio of 0.9:0.1 was used for the calculation. Future improvements in data precision and resolution may enable more accurate timing of an event and its origin.
Conclusions
This study presents a new dataset of radiocarbon measurements from annual oak tree rings spanning 1042–1062 CE, sourced from Kujawy near Kraków, Poland. The data reveal a prolonged increase in Δ14C values between 1053 and 1055 CE, with values ranging from −6.9 ± 1.8‰ to −2.6 ± 1.8‰. The average Δ14C value for the preceding period (1042–1053 CE) was −11.0 ± 1.9‰, indicating a significant increase of 8.4 ± 2.6‰ toward 1055 CE, with a confidence level of 3.2σ. These enhancements are generally consistent with the findings reported in the previous papers (Brehm et al. Reference Brehm, Bayliss, Christl, Synal, Adolphi, Beer, Kromer, Muscheler, Solanki, Usoskin, Bleicher, Bollhalder, Tyers and Wacker2021a; Eastoe et al. Reference Eastoe, Tucek and Touchan2019; Terrasi et al. Reference Terrasi, Marzaioli, Bouompane, Passariello, Capano, Helama, Oinonen, Nojd, Uusitalo, Jull, Panyushkina, Baisan, Molnar, Varga, Kovaltsov, Poluianov and Usoskin2020). However, our results suggest that the enhancement of the radiocarbon had started before 1054 CE, and thus the event is unlikely to be significantly attributed to the supernova in the Crab Nebula occurred in July of 1054 CE (SN 1054: Mayall Reference Mayall1939).
Improvement in the precision of the radiocarbon data with sub-annual resolution are necessary for the further refinement of the event timing and for understanding the underlying mechanisms of this Δ14C anomaly.
Supplementary material
To view supplementary material for this article, please visit https://doi.org/10.1017/RDC.2026.10202
Acknowledgments
This work was partly supported by the National Science Centre, Poland, grant UMO-2022/45/B/ST10/02095, EUROPLANET24 grant 20-EPN2-018 and Nagoya University ISEE -International Joint Research Program-00027.