1 Introduction
Shallow-water tidal flow around islands or headlands produces recirculation zones in their wake that is well documented by satellite images and aerial photographs (e.g. Wolanski, Imberger & Heron Reference Wolanski, Imberger and Heron1984; Ingram & Chu Reference Ingram and Chu1987). These zones contribute substantially to the vertical (upwelling) and horizontal material transport. Numerous studies have identified the importance of complex flow features such as eddies and fronts (shear zones) for aggregating sediment and plankton (Wolanski et al. Reference Wolanski, Imberger and Heron1984; Ingram & Chu Reference Ingram and Chu1987; Pattiaratchi, James & Collins Reference Pattiaratchi, James and Collins1987). The upwelling of nutrient rich water into the surface layer (that has higher light intensity) has important ecological implications due to the increased primary productivity that results. This in turn can affect the distribution of benthic and higher-order pelagic organisms, that graze along these fronts and wakes, taking advantage of lower-trophic level food aggregations (Wolanski & Hamner Reference Wolanski and Hamner1988; Jenner, Jenner & McCabe Reference Jenner, Jenner and McCabe2001; Johnston & Read Reference Johnston and Read2007). The secondary circulation zones are complex, with a three-dimensional structure characterised by converging, diverging and curved flows (White & Wolanski Reference White and Wolanski2008). Observations of remotely sensed sea surface temperature data suggest that tidal mixing around islands in the Kimberley region of north western Australia is modulated by the spring-neap cycle and mixes sub-thermocline nutrient rich water to the surface in water depths of 60–80 m (Creswell & Badcock Reference Creswell and Badcock2000). Whilst the potential ecological significance of shallow island wakes has been recognised for several decades, to date no quantitative description of the upwelling characteristics of shallow islands as a function of the flow parameters has been established. Laboratory experiments and numerical simulations that can determine the unsteady, three-dimensional (3-D) velocity fields play an essential role in this quest. We utilise a simple circular island cross-section in this fundamental experimental study of the characteristics of shallow island wakes.
Unbounded cylinder wakes in oscillatory flow have been studied extensively (e.g. Williamson Reference Williamson1985; Sumer & Fredsøe Reference Sumer and Fredsøe2006) and demonstrate the importance of the ratio of the flow excursion to cylinder size as described by the Keulegan–Carpenter number
 $KC=U_{0}T/D$
, where
 $U_{0}$
is the amplitude of the sinusoidal velocity oscillation,
 $T$
is the oscillation period and
 $D$
is the cylinder diameter. The process of half-cycle interaction and pairing of vortices is fundamental to the observed wake patterns and, in turn, the fluid induced lift and in-line forces on the cylinder.
In shallow water, experimental, field and theoretical studies of island wakes (assuming steady flow) have demonstrated the governing role of bottom friction on the wake structure expressed by the stability parameter
 $S=c_{f}D/h$
where
 $h$
is the flow depth and
 $c_{f}$
is a bed friction coefficient (Chu, Wu & Khayat Reference Chu, Wu and Khayat1983; Chen & Jirka Reference Chen and Jirka1995; Lloyd & Stansby Reference Lloyd and Stansby1997; Negretti et al.
Reference Negretti, Vignoli, Tubino and Brocchini2006);
 $S$
can be derived from the balance of the advective and frictional terms of the two-dimensional, depth-averaged momentum equation (Pingree & Maddock Reference Pingree and Maddock1980). Laboratory studies of island wakes in turbulent, shallow flow have demonstrated that vortex shedding occurs for
 $S\lesssim 0.2$
, an unsteady bubble wake for
 $0.2\lesssim S\lesssim 0.5$
and, an attached, steady bubble wake for
 $S\gtrsim 0.5$
. Wolanski et al. (Reference Wolanski, Imberger and Heron1984) proposed a model of a wake recirculation region with an Ekman benthic boundary layer to describe the vorticity dynamics and characteristic length scale of the wake of Rattray Island in the Great Barrier Reef. That study proposed that the wake characteristics were governed by the island wake parameter
 $P=(Uh^{2})/(\unicode[STIX]{x1D708}_{T}D)$
where
 $U$
is the steady-flow velocity and
 $\unicode[STIX]{x1D708}_{T}$
is the turbulent vertical eddy viscosity. Vortex shedding is expected for
 $P\gg 1$
. Defining a quadratic bed friction coefficient as
 $c_{f}=(U/u_{\ast })^{2}$
(where
 $u_{\ast }$
is the friction velocity) and assuming that in shallow, steady flow
 $\unicode[STIX]{x1D708}_{T}\sim u_{\ast }h$
(Fischer et al.
Reference Fischer, List, Koh, Imberger and Brooks1979) leads to
 $S\sim \sqrt{c_{f}}/P$
(Chen & Jirka Reference Chen and Jirka1995). For laboratory studies when the flow is laminar, the diffusion of momentum is controlled by the molecular viscosity
 $\unicode[STIX]{x1D708}$
, the Reynolds number is
 $Re=UD/\unicode[STIX]{x1D708}$
and
 $P=Re(h/D)^{2}$
which is the controlling parameter for the cylinder wake in a Hele-Shaw cell (Riegels Reference Riegels1938).
Laboratory experiments of oscillatory, shallow-water island wakes are, however, rare. The wake forms and related horizontal velocity fields were determined from dye visualisation and particle tracking velocimetry (PTV) of surface floating particles by Lloyd, Stansby & Chen (Reference Lloyd, Stansby and Chen2001). Cylindrical and conical island geometries were investigated with wake form classification presented in the parameter space
 $S{-}KC$
. Four modes of wake form were identified for both geometries with wake asymmetry increasing for decreasing
 $S$
and increasing
 $KC$
. A two-dimensional (2-D) numerical simulation study of shallow-water headland wakes in tidal flow investigated a similar parameter space, a friction Reynolds number equal to
 $1/S$
, and the (dimensionless) wake length
 $KC/2\unicode[STIX]{x03C0}$
(Signell & Geyer Reference Signell and Geyer1991). That study also identified that the wake behaviour was predominantly governed through relative value of two length scales, a tidal excursion length
 $l_{t}=U_{0}T/2\unicode[STIX]{x03C0}$
and a frictional length
 $l_{f}=h/c_{f}$
. The island and headland wakes observed by Signell & Geyer (Reference Signell and Geyer1991) and Lloyd et al. (Reference Lloyd, Stansby and Chen2001) demonstrated the importance of bed friction on wake stability through the parameter
 $S$
and both studies conclude that the importance of transience in the wake development due to flow unsteadiness is quantified by
 $KC$
.
Whilst the wake stability controls the spatial distribution of the wake eddies, the ecologically important process (that has yet to be characterised) is the vertical transport in the island wake. In shallow flow, it is frequently argued that the vertical velocity is constrained due to the small aspect ratio
 $h/D$
. Despite this constraint, experimental studies on shallow vortices (Akkermans et al.
Reference Akkermans, Cieslik, Kamp, Trieling, Clercx and van Heijst2008), and more recently, shallow island wakes (Branson, Ghisalberti & Ivey Reference Branson, Ghisalberti and Ivey2019) have observed larger than expected vertical velocities and complex interactions between primary and secondary vortices. The near-bed stress at the base of a shallow vortex forms an Ekman boundary layer that is able to actively suck (and pump) fluid into (and out of) the benthic boundary layer (Greenspan Reference Greenspan1968). Numerical and analytical studies of decaying shallow vortices have demonstrated that the upwelling regime is controlled by the relative bottom boundary layer thickness within the vortex (Duran-Matute et al.
Reference Duran-Matute, Kamp, Trieling and van Heijst2012). However, an analytical solution for the scaling of upwelling was only possible in the viscous regime where vertical diffusion of momentum dominated over flow inertia. In contrast to isolated shallow vortices, in the island wake there is an interaction between the wake eddy structure and the scales of the external tidal flow (Branson et al.
Reference Branson, Ghisalberti and Ivey2019). A mechanistic description of the interaction between the external tidal flow field and the circulation in the island wake is needed to improve understanding of the topographically induced mixing.
The present paper utilises a novel experimental approach with three main objectives: (i) to determine consistent wake classification criteria for shallow, oscillatory flow around cylinders; (ii) to establish the 3-D near-wake flow field; and (iii) to establish scaling laws for lateral and upwelling velocities and the onset of vortex shedding.
2 Wake classification parameters
We demonstrate here that there exists an inverse dependence between
 $S$
and
 $KC$
that confounds the relative influence of water depth and transient bed friction (due to the Stokes boundary layer development). Furthermore, the relative length scales identified in Signell & Geyer (Reference Signell and Geyer1991) establish an additional parameter that directly links
 $KC$
and
 $S$
and expresses the role of vertical length scales on the wake characteristics.
The well-known Stokes boundary layer solution is (Batchelor Reference Batchelor2000):
 $$\begin{eqnarray}u(z,t)=U_{0}[\cos (\unicode[STIX]{x1D714}t)-\text{e}^{-kz}\cos (\unicode[STIX]{x1D714}t-kz)],\end{eqnarray}$$
where
 $U_{0}$
is the velocity amplitude outside of the boundary layer,
 $\unicode[STIX]{x1D714}$
is the radial frequency,
 $k=\sqrt{\unicode[STIX]{x1D714}/2\unicode[STIX]{x1D708}}$
is the wave number and
 $\unicode[STIX]{x1D6FF}=2\unicode[STIX]{x03C0}\sqrt{2\unicode[STIX]{x1D708}/\unicode[STIX]{x1D714}}$
is the wavelength, also referred to as the Stokes boundary layer thickness. Similarly, the boundary layer thickness defined by
 $\unicode[STIX]{x2202}u(z,t)/\unicode[STIX]{x2202}z=0$
, is
 $\unicode[STIX]{x1D6FF}_{BL}=(3/4)\unicode[STIX]{x03C0}\sqrt{2\unicode[STIX]{x1D708}/\unicode[STIX]{x1D714}}$
. The shear stress is
 $\unicode[STIX]{x1D70F}(z,t)=\unicode[STIX]{x1D707}(\unicode[STIX]{x2202}u(z,t)/\unicode[STIX]{x2202}z)$
where, for laminar oscillatory flow over a smooth boundary (which is the case in the present experiments), the bed shear stress (at
 $z=0$
) is
 $\unicode[STIX]{x1D70F}(t)=\unicode[STIX]{x1D707}U_{0}\sqrt{\unicode[STIX]{x1D714}/2\unicode[STIX]{x1D708}}(\cos \unicode[STIX]{x1D714}t-\sin \unicode[STIX]{x1D714}t)$
. The maximum bed friction coefficient is
 $$\begin{eqnarray}c_{f}=\frac{\unicode[STIX]{x1D70F}_{0}}{{\textstyle \frac{1}{2}}\unicode[STIX]{x1D70C}U_{0}^{2}}=\frac{2\unicode[STIX]{x1D708}/U_{0}}{\sqrt{2\unicode[STIX]{x1D708}/\unicode[STIX]{x1D714}}},\end{eqnarray}$$
where
 $\unicode[STIX]{x1D70F}_{0}$
is the peak in bed shear stress. This bed friction coefficient can be utilised in the calculation of
 $S$
. Substituting the expression for
 $c_{f}$
into that for
 $S$
yields
 $$\begin{eqnarray}S=\frac{\unicode[STIX]{x1D6FF}/h}{U_{0}T/D},\end{eqnarray}$$
demonstrating that
 $S$
is dependent on both the relative wake length
 $KC=U_{0}T/D$
and the ratio of boundary layer wavelength to flow depth
 $\unicode[STIX]{x1D6FF}^{+}=\unicode[STIX]{x1D6FF}/h$
.
It is of interest to point out that
 $S$
can also be expressed in terms of a Reynolds number (
 $Re=U_{0}D/\unicode[STIX]{x1D708}$
)
 $$\begin{eqnarray}S=\frac{4\unicode[STIX]{x03C0}}{\unicode[STIX]{x1D6FF}^{+}Re(h/D)^{2}},\end{eqnarray}$$
which demonstrates that
 $\unicode[STIX]{x1D6FF}^{+}$
is the non-dimensional parameter that links
 $S$
,
 $KC$
and
 $Re(h/D)^{2}$
(i.e.
 $P$
with
 $\unicode[STIX]{x1D708}_{T}=\unicode[STIX]{x1D708}$
) for oscillatory, shallow wake flow. Further, in terms of the parameters observed to predominantly govern headland wake behaviour (
 $l_{f}$
and
 $l_{t}$
), if
 $c_{f}$
is determined using (2.2),
 $\unicode[STIX]{x1D6FF}^{+}$
is equivalent to
 $l_{f}/l_{t}$
, consistent with the conclusions of Signell & Geyer (Reference Signell and Geyer1991). The parameter
 $\unicode[STIX]{x1D6FF}^{+}$
describes the relative scale of influence of bottom friction compared to the flow depth. When
 $\unicode[STIX]{x1D6FF}^{+}\gg 1$
the influence of friction is large and when
 $\unicode[STIX]{x1D6FF}^{+}\ll 1$
the influence of friction is small.
The two parameters (
 $KC$
and
 $\unicode[STIX]{x1D6FF}^{+}$
) that determine the stability parameter
 $S$
in oscillatory island wake flow can be independently varied, allowing examination of the influence of relative wake length and bed friction on the wake of a shallow island in a sinusoidal tidal flow.
3 Methods
3.1 Experimental conditions
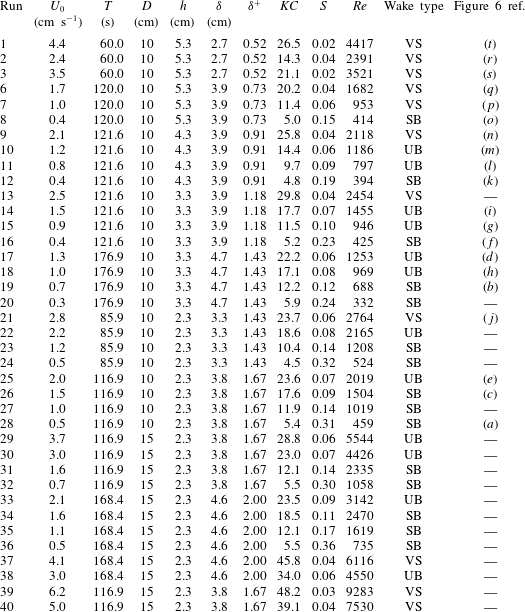
A total of 38 experiments were completed in this study (table 1). Circular cylinders of diameter 10 cm and 15 cm were utilised as an analogue for an island, with the flow depth (
 $h$
) varied from 2.3 to 5.3 cm, velocity amplitude (
 $U_{0}$
) from
 $0.4$
to
 $6.2~\text{cm}~\text{s}^{-1}$
and oscillation period (
 $T$
) from 60 to 177 s. This covered a wide range in the controlling parameters:
 $4.5<KC<48.0$
,
 $0.5<\unicode[STIX]{x1D6FF}^{+}<2.0$
and
 $0.02<S<0.36$
including several experiments with repeated
 $KC$
and
 $\unicode[STIX]{x1D6FF}^{+}$
but with differing tidal period (
 $T$
) and cylinder diameter (
 $D$
).
Conditions of the experimental runs,
 $\unicode[STIX]{x1D6FF}=2\sqrt{\unicode[STIX]{x03C0}\unicode[STIX]{x1D708}T}$
,
 $KC=U_{0}T/D$
,
 $\unicode[STIX]{x1D6FF}^{+}=2\sqrt{\unicode[STIX]{x03C0}\unicode[STIX]{x1D708}T}/h$
,
 $S=\unicode[STIX]{x1D6FF}^{+}/KC$
and
 $Re=U_{0}D/\unicode[STIX]{x1D708}$
. SB
 $=$
steady bubble, UB
 $=$
unsteady bubble and VS
 $=$
vortex shedding. The final column provides a cross-reference for the plots shown in figure 6.

3.2 Shallow tidal flow flume
Experiments were conducted in a recirculating glass flume with a working section 1.85 m wide, 6.00 m long and up to 0.35 m deep. The working section was elevated to allow optical access from below. The flume had a computer controlled variable frequency reversible pump that generated a barotropic reciprocating tidal flow of specified period and amplitude. The pump and drive system was able to generate a near-sinusoidal velocity signal. An array of polycarbonate flow straighteners and sponges were installed at each end of the flume to produce a near-uniform transverse velocity profile.
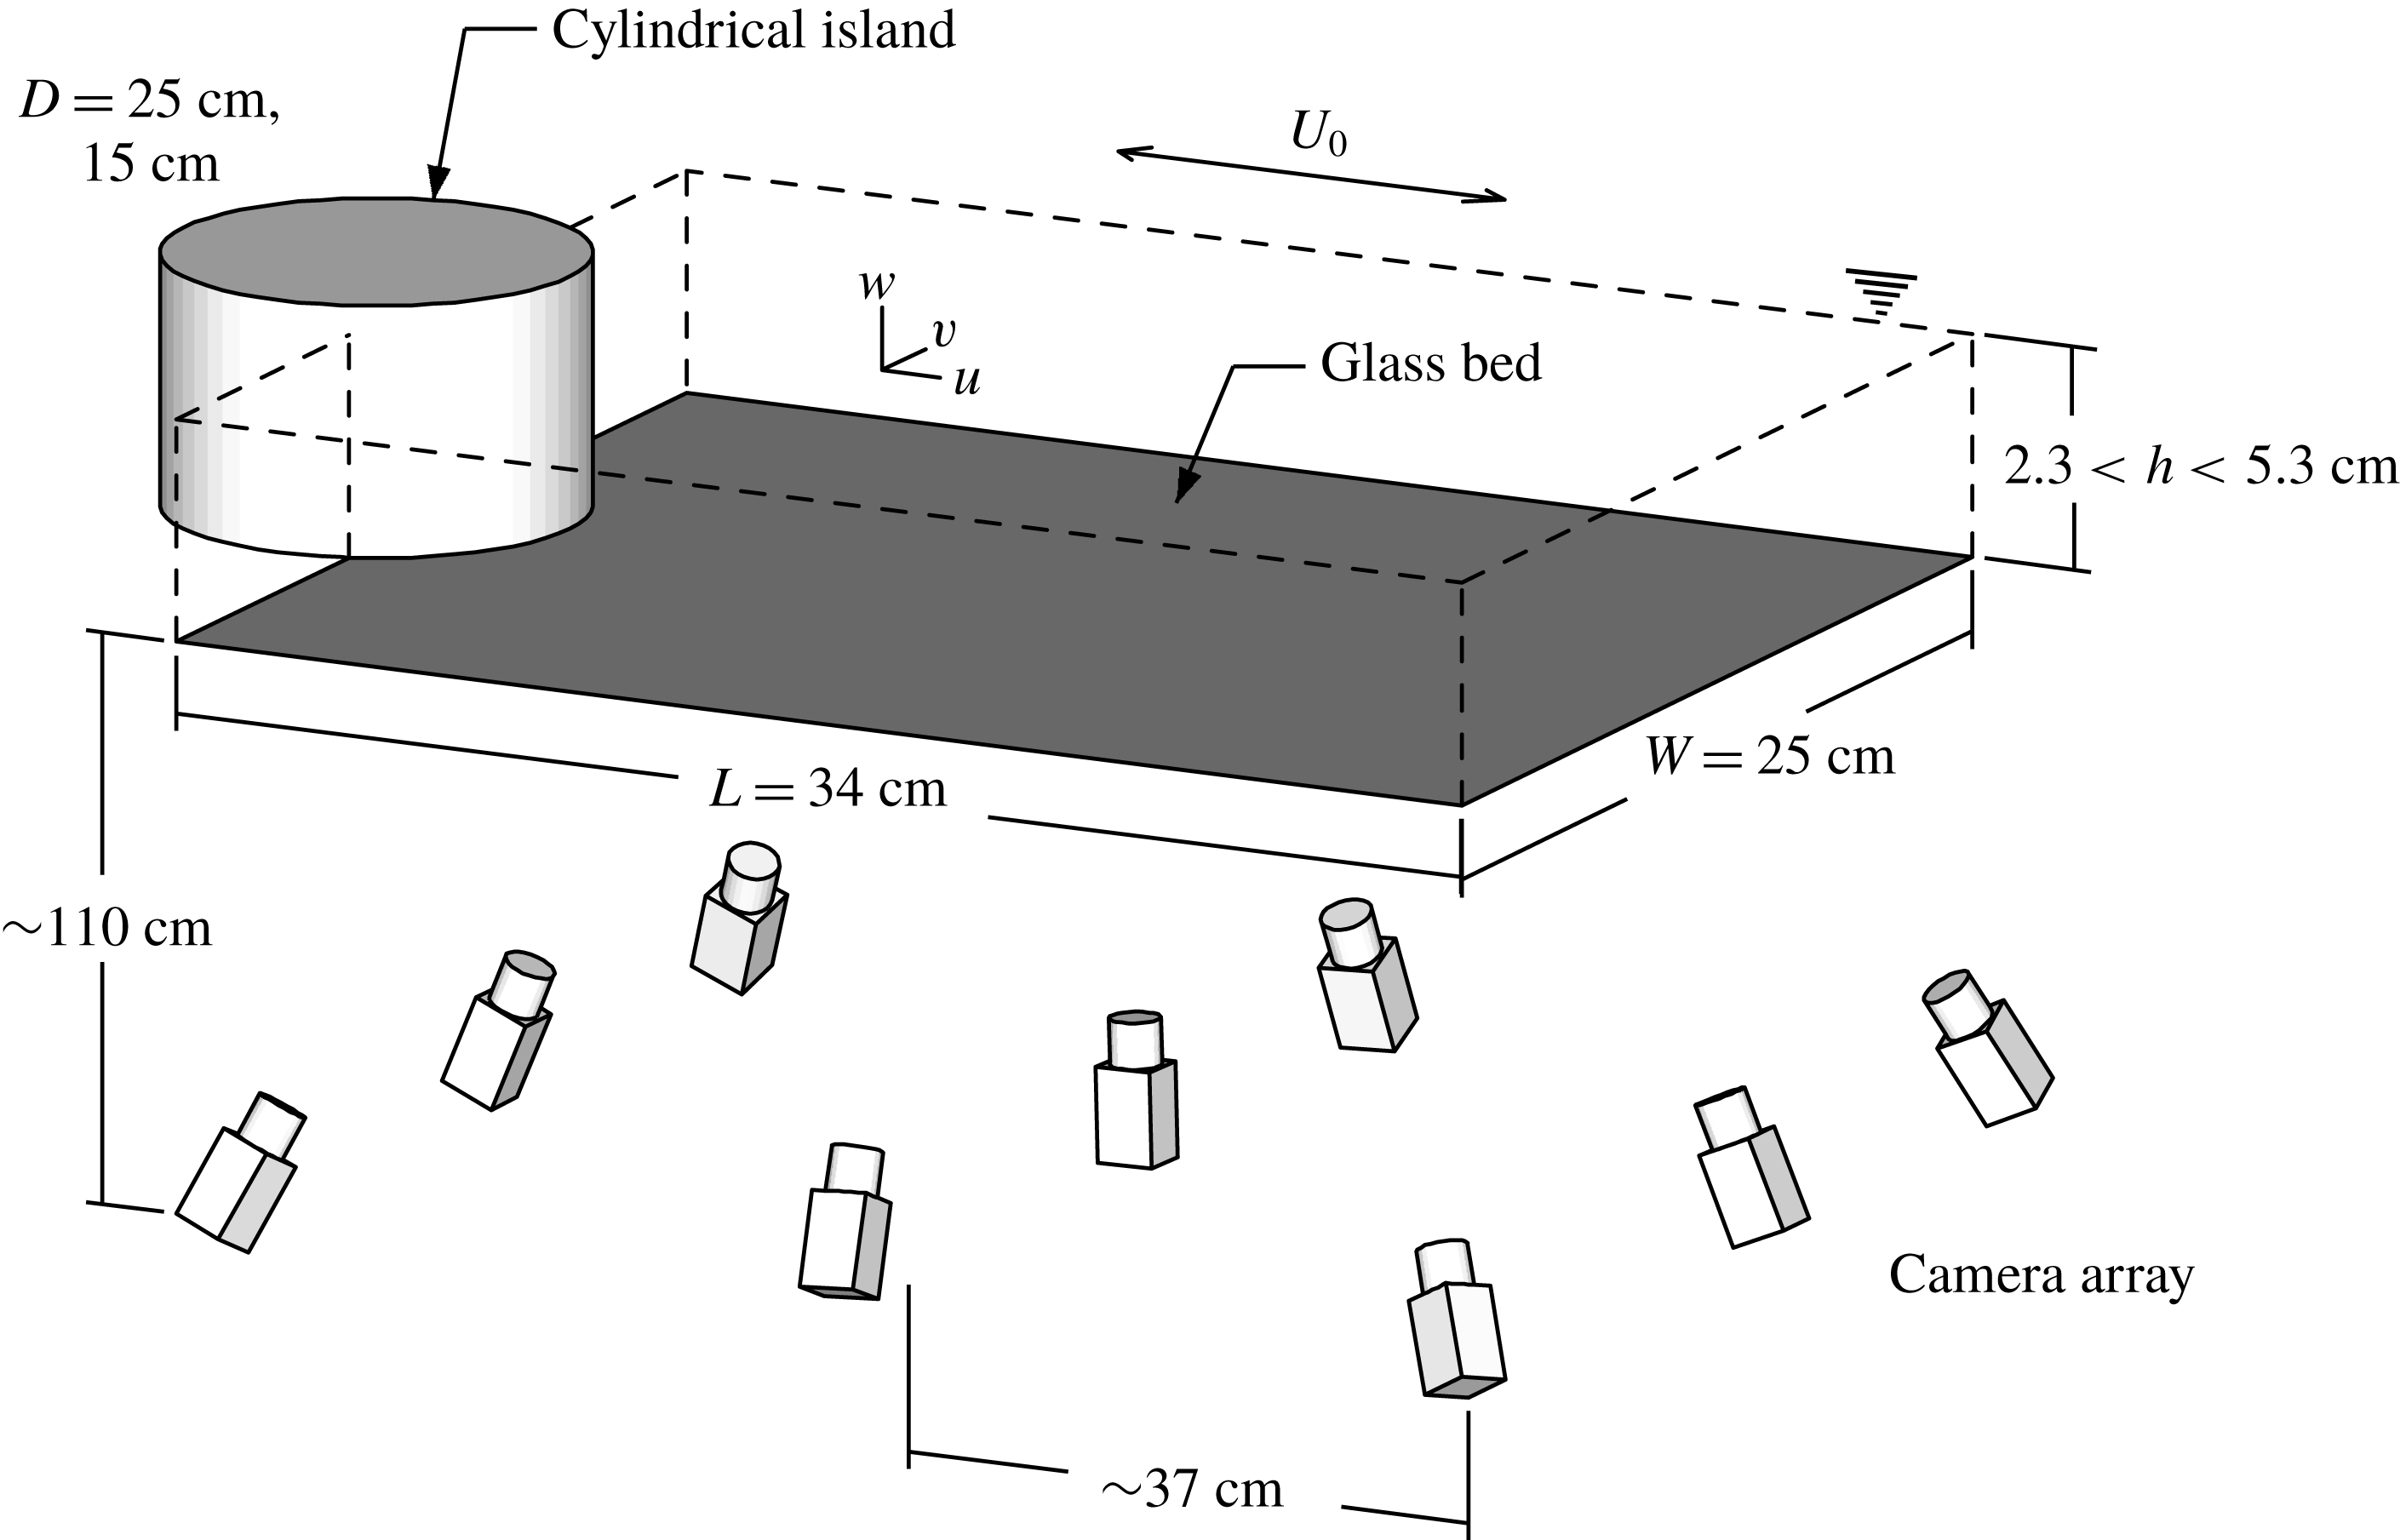
A schematic of the experimental set-up is shown in figure 1. The working fluid was salt water, buoyancy matched and seeded with
 $300{-}450~\unicode[STIX]{x03BC}\text{m}$
size particles of Pliolite AC80. The fluid was illuminated from the side with an array of high intensity light emitting diodes. The flow was imaged with an array of 9 Basler ACE acA1600-20gm 2.0 mega-pixel monochrome GigE cameras with a maximum frame rate of 20 f.p.s. The camera array was positioned below the flume at a distance of approximately 110 cm. The cameras were arranged in a
 $3\times 3$
grid layout with approximately 37 cm spacing between each camera. The cameras were aligned on a
 $34\times 25\times 6~\text{cm}^{3}$
measurement volume.
Schematic diagram of the experimental set-up for the 10 cm cylinder. The measurement volume (of length
 $L$
and width
 $W$
) is indicated by the dashed lines, with the island located at its edge. Oscillating sinusoidal flow was generated with a velocity amplitude of
 $U_{0}$
. The deepest and shallowest experimental depth conditions were 5.3 cm and 2.3 cm, respectively. A synthetic aperture camera array imaged neutrally buoyant Pliolite AC80 particles through the clear glass bed, with velocity estimates subsequently obtained using 3D-PIV. Note that the camera array is not shown to scale.

3.3 Synthetic aperture particle imaging velocimetry
The seeded flow was imaged from multiple points of view using the camera array and the three-dimensional volume of particles was reconstructed from the two-dimensional camera images for three-dimensional particle imaging velocimetry (3D-PIV). In this study we applied the synthetic aperture imaging technique for volume reconstruction. If the geometry of the imaging system is well known, it is possible to re-parameterise the scene (Isaksen, McMillan & Gortler Reference Isaksen, McMillan and Gortler2000) into a number of discrete focal planes located arbitrarily in the imaged volume using the Map-shift-average algorithm (Vaish et al.
Reference Vaish, Garg, Talvala, Antunez, Wilburn, Horowitz and Levoy2005). Belden et al. (Reference Belden, Truscott, Axiak and Techet2010) evaluated the synthetic aperture imaging technique for use in 3D-PIV and found that the reconstruction quality increased with the number of cameras (up to approximately 12). The multi-camera self-calibration technique of Belden (Reference Belden2013) was utilised to establish the geometry of the camera array, with a mean reprojection error of 0.11 px across the nine cameras in the array. The resulting horizontal and vertical size of each reconstructed voxel was 0.22 mm and 0.5 mm respectively, with a total volume size of 193.6 million voxels for the deepest flow condition (
 $h=5.3~\text{cm}$
).
After reconstruction of consecutive volumes an iterative, multi-grid, image deforming 3D-PIV algorithm was applied with ensemble averaging in the correlation space to overcome non-uniformity in seeding density (Raffel, Willert & Wereley Reference Raffel, Willert and Wereley2007) (due to the converging and diverging flows). Sub-pixel displacement estimates were obtained using a three point Gaussian fit to the correlation peak in three dimensions. The universal outlier detection algorithm of Westerweel & Scarano (Reference Westerweel and Scarano2005) was applied after each pass to remove spurious vectors. Finally, a three-dimensional Gaussian filter (
 $\unicode[STIX]{x1D70E}=0.5$
) was applied to reduce noise.
The iterative analysis was applied for a total of 8 passes, with the first three passes progressively refining the interrogation volume from
 $256\times 256\times 48$
voxels through to
 $96\times 96\times 12$
voxels with 75 % overlap. This resulted in a three-dimensional vector field of
 $64\times 48\times 32$
(98304) vectors sampled at 1 Hz with physical spacings of 5.3 mm horizontally and 1.5 mm vertically. Further details of the technique and validation of the 3-D velocity measurements against a co-located acoustic Doppler velocimeter (ADV) are provided in Branson (Reference Branson2018).
3.4 Measurement uncertainty
Particle imaging velocimetry measurement uncertainty has previously been investigated a priori using theoretical modelling (Westerweel Reference Westerweel1997) and Monte Carlo simulation of the measurement chain (e.g. Keane & Adrian (Reference Keane and Adrian1992) and others). These analyses have helped optimise the various aspects of the measurement chain, with most studies estimating the error at approximately 0.1 px (Raffel et al.
Reference Raffel, Willert and Wereley2007). Due to continuity, the divergence should be zero everywhere (i.e.
 $\unicode[STIX]{x1D735}\boldsymbol{\cdot }\boldsymbol{u}=0$
) in an incompressible flow. Thus, when a non-zero divergence is measured, the root mean square (r.m.s.) of the divergence can be evaluated as a measure of experimental error (e.g. Scarano & Poelma Reference Scarano and Poelma2009; Atkinson et al.
Reference Atkinson, Coudert, Foucaut, Stanislas and Soria2010). This approach allows for the measurement error to be assessed a posteriori and aggregates the systematic and random errors associated with the experimental apparatus and PIV algorithm. Previous studies have applied uncertainty analysis (Moffat Reference Moffat1988) and established that error in the divergence (indicated by non-zero measurement of divergence) can be expressed in terms of the random velocity error (Atkinson et al.
Reference Atkinson, Coudert, Foucaut, Stanislas and Soria2010; Earl, Paetzold & Cochard Reference Earl, Paetzold and Cochard2013)
 $$\begin{eqnarray}\unicode[STIX]{x1D716}(\unicode[STIX]{x1D735}\boldsymbol{\cdot }\boldsymbol{u})=\sqrt{\frac{3}{2\unicode[STIX]{x1D6E5}^{2}}}\unicode[STIX]{x1D716}(u),\end{eqnarray}$$
where
 $\unicode[STIX]{x1D6E5}$
is the characteristic length scale of the 3-D vector grid (in pixels). Whilst (3.1) provides an estimate of the absolute error relative to the PIV measurement resolution, we also assess the r.m.s. divergence relative to the magnitude of the measured vorticity; the latter is taken as the 99th percentile of the vorticity vector norm (
 $\Vert \unicode[STIX]{x1D74E}\Vert _{99}$
where
 $\unicode[STIX]{x1D74E}=\unicode[STIX]{x1D735}\times \boldsymbol{u}$
) for each experimental condition. The inter-frame time for the PIV analysis was adjusted for each experimental condition to minimise the random velocity error and relative divergence error. The r.m.s. divergence (
 $\unicode[STIX]{x1D716}(\unicode[STIX]{x1D735}\boldsymbol{\cdot }\boldsymbol{u})$
) varied from 2 % to 8 % (with an estimated random velocity error of 0.2–0.8 px). Normalising the r.m.s. divergence by the measured vorticity (
 $\unicode[STIX]{x1D735}\boldsymbol{\cdot }\boldsymbol{u}/\Vert \unicode[STIX]{x1D74E}\Vert _{99}$
) yields an error of 5 %–15 % which is comparable to other 3D-PIV studies of cylinder wakes (Scarano & Poelma Reference Scarano and Poelma2009).
3.5 Data analysis
In the presentation of the results, spatial averages are denoted by
 $\langle \ldots \rangle$
, long-term averages by an overbar (e.g.
 $\overline{u}$
) and phase averages by a tilde (e.g.
 $\tilde{u}$
) (for a particular tidal phase). Subscripts are utilised to indicate if a statistic other than the mean is calculated. For example, the time series of root mean square velocity is calculated as
 $$\begin{eqnarray}\langle u\rangle _{rms}(t)=\sqrt{\frac{1}{N}\mathop{\sum }^{x,y,z}u^{2}},\end{eqnarray}$$
where
 $N$
is the number of velocity samples within the measurement volume. The velocity,
 $u_{BL}$
, at the
 $\unicode[STIX]{x1D6FF}_{BL}$
boundary layer height is calculated as the spatially averaged horizontal velocity
 $\langle u\rangle$
at a height
 $z=\unicode[STIX]{x1D6FF}_{BL}$
for
 $x/D>2.5$
. The amplitude of the sinusoidal velocity (
 $U_{0}$
) is calculated from the
 $u_{BL}$
time series upstream of the cylinder. Due to the presence of the Stokes boundary layer there is a phase shift in the horizontal velocity with distance from the bed. To phase align the results, the time
 $t=0$
is defined at the first flow zero crossing of
 $u_{BL}$
. Thus, the phase of each experiment is defined as
 $\unicode[STIX]{x1D719}=t/T\;\text{mod}\;1$
. The wake ‘growth’ period is
 $0.0<\unicode[STIX]{x1D719}<0.5$
and the wake ‘decay’ period
 $0.5<\unicode[STIX]{x1D719}<1.0$
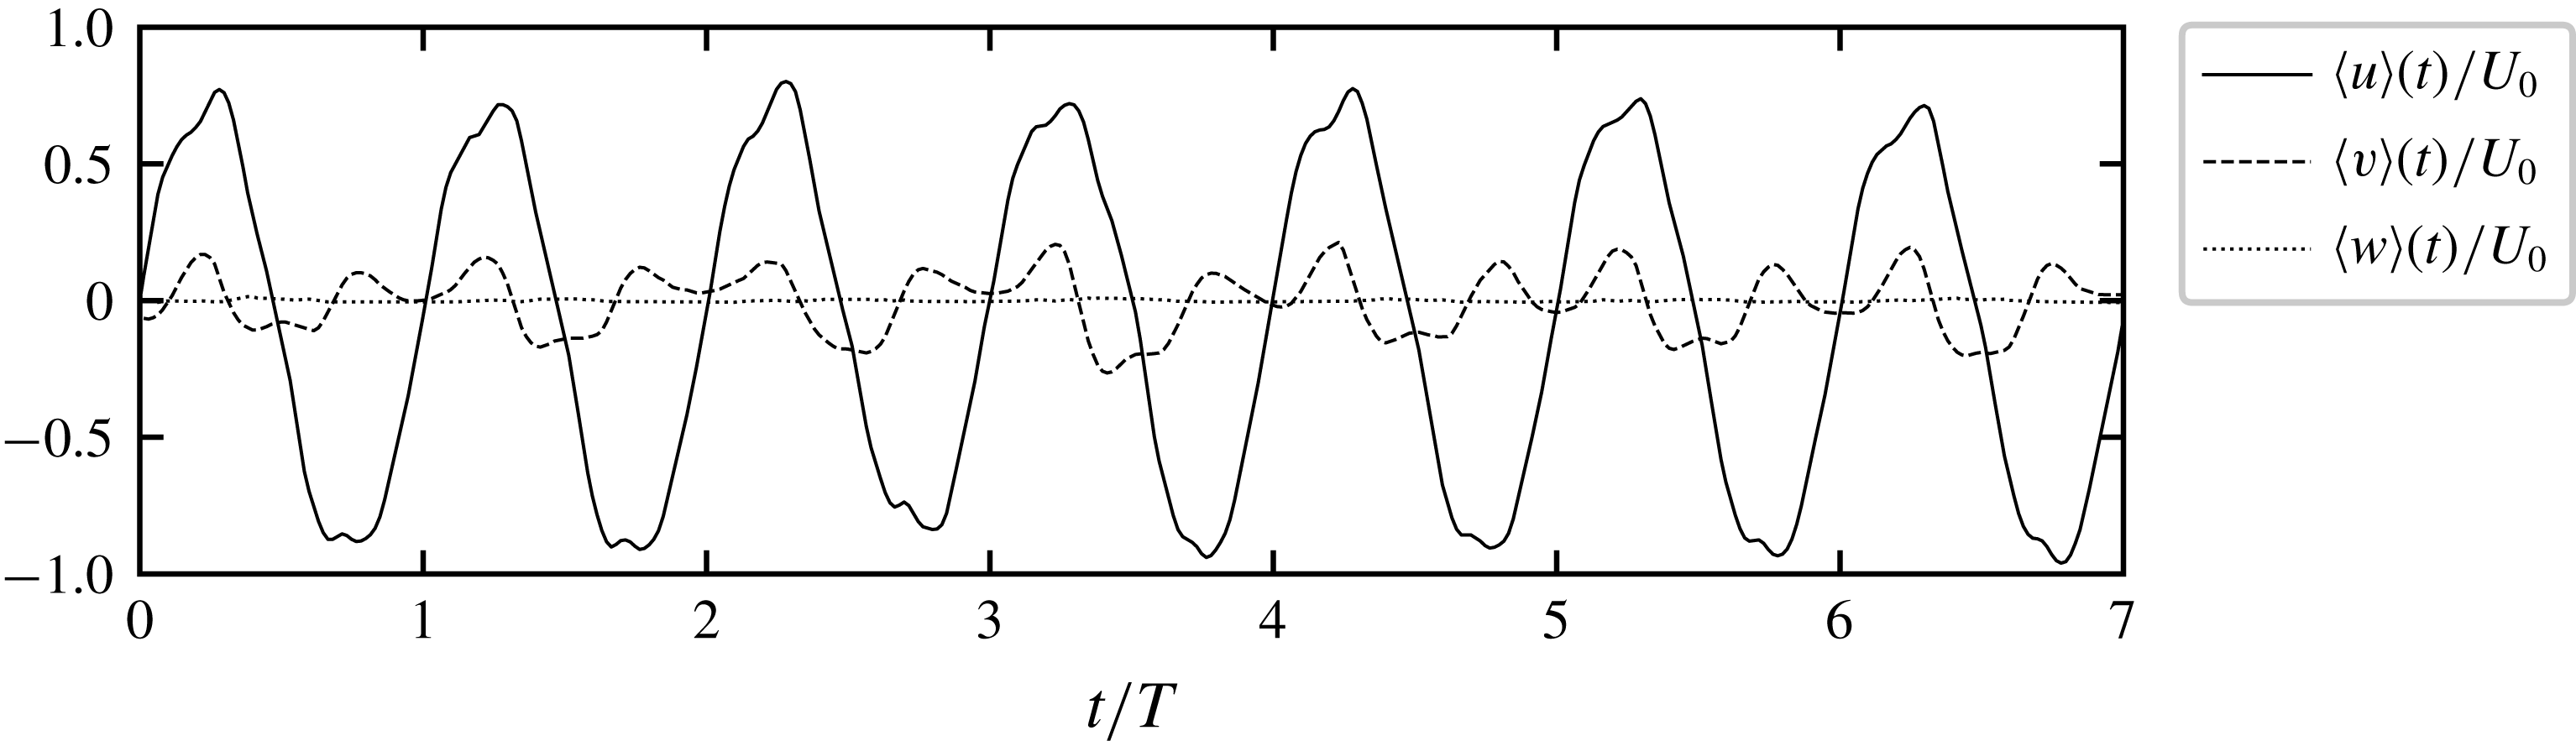
. An example of the volume averaged velocity for Run 1 is presented in figure 2. For this vortex shedding wake, perturbations in
 $\langle u\rangle$
and
 $\langle v\rangle$
are observed due the presence of wake eddies and wake oscillation. The value of spatially averaged
 $\langle w\rangle$
is approximately zero, as would be expected by conservation of mass in a shallow flow.
Example of time variation of the volume-averaged velocities
 $\langle u\rangle (t)$
,
 $\langle v\rangle (t)$
and
 $\langle w\rangle (t)$
for Run 1. Peak flow past the island occurs at
 $\unicode[STIX]{x1D719}=0.25$
and
 $0.75$
and the wake is generated in the measurement volume for
 $0.0<\unicode[STIX]{x1D719}<0.5$
. The amplitude of
 $\langle u\rangle (t)$
does not reach
 $U_{0}$
as
 $U_{0}$
is defined at a height of
 $z=\unicode[STIX]{x1D6FF}_{BL}$
, whilst
 $\langle u\rangle (t)$
is the volume average. Note the deficit in amplitude of
 $\langle u\rangle (t)$
during the wake generation half-cycle.

In this paper, we develop scaling relationships for the root mean square lateral
 $\langle \overline{v}\rangle _{rms}$
and vertical
 $\langle \overline{w}\rangle _{rms}$
velocities. These scaling relationships are established based on power laws. In log space, a power law can be represented as a general linear model of the form
 $$\begin{eqnarray}\log \boldsymbol{Y}_{i}=\unicode[STIX]{x1D6FD}_{0}+\unicode[STIX]{x1D6FD}_{1}\log \unicode[STIX]{x1D653}_{i1}+\unicode[STIX]{x1D6FD}_{2}\log \unicode[STIX]{x1D653}_{i2}+\cdots +\unicode[STIX]{x1D6FD}_{p}\log \unicode[STIX]{x1D653}_{ip}+\unicode[STIX]{x1D750}_{i},\end{eqnarray}$$
where
 $\boldsymbol{Y}$
is a series of
 $i$
observations,
 $\unicode[STIX]{x1D653}$
is a matrix of
 $p$
predictors (i.e.
 $KC$
,
 $\unicode[STIX]{x1D6FF}^{+}$
etc.),
 $\unicode[STIX]{x1D6FD}$
are scaling coefficients to be estimated and
 $\unicode[STIX]{x1D750}_{i}$
is a series of errors assumed to follow a log-normal distribution. The scaling coefficients and intercept (
 $\unicode[STIX]{x1D6FD}_{0}$
) can be estimated using ordinary linear regression with
 $p$
-values calculated using the
 $t$
test and 95 % confidence intervals of parameter estimates based on the Student’s
 $t$
distribution. However, ordinary linear regression only provides the single maximum likelihood estimate of the scaling coefficients. A Hamiltonian Monte Carlo (HMC) algorithm is applied to estimate the posterior distribution of the scaling coefficients. HMC is a Markov-chain Monte Carlo (MCMC) algorithm that is particularly suited to problems where correlation between predictors can be problematic for many MCMC methods. The No-U-Turn sampler (Hoffman & Gelman Reference Hoffman and Gelman2014) as implemented in the PyMC3 library (Salvatier, Wiecki & Fonnesbeck Reference Salvatier, Wiecki and Fonnesbeck2016) is utilised to sample the posterior distributions of the scaling coefficients. For all MCMC results presented in this study, four chains of 4000 samples with an initial tuning of 1000 samples were executed. Tuning samples were discarded and the potential for biased parameter estimates checked by examining the trace auto-correlation and trace divergence. The results of this analysis are presented in the supplementary material available online at https://doi.org/10.1017/jfm.2019.441.
4 Results
4.1 Velocity variations with
 $h/D$
,
$\unicode[STIX]{x1D6FF}^{+}$
and
$KC$


Field-averaged measures of
 $u$
,
 $v$
and
 $w$
provide a simple view of the overall wake dynamics, time variability and sensitivity to the controlling parameters
 $h/D$
,
 $KC$
and
 $\unicode[STIX]{x1D6FF}^{+}$
. The variation of
 $\langle u\rangle (t)/U_{0}$
,
 $\langle v\rangle _{rms}/U_{0}$
and
 $\langle w\rangle _{rms}/U_{0}$
with
 $KC$
and
 $\unicode[STIX]{x1D6FF}^{+}$
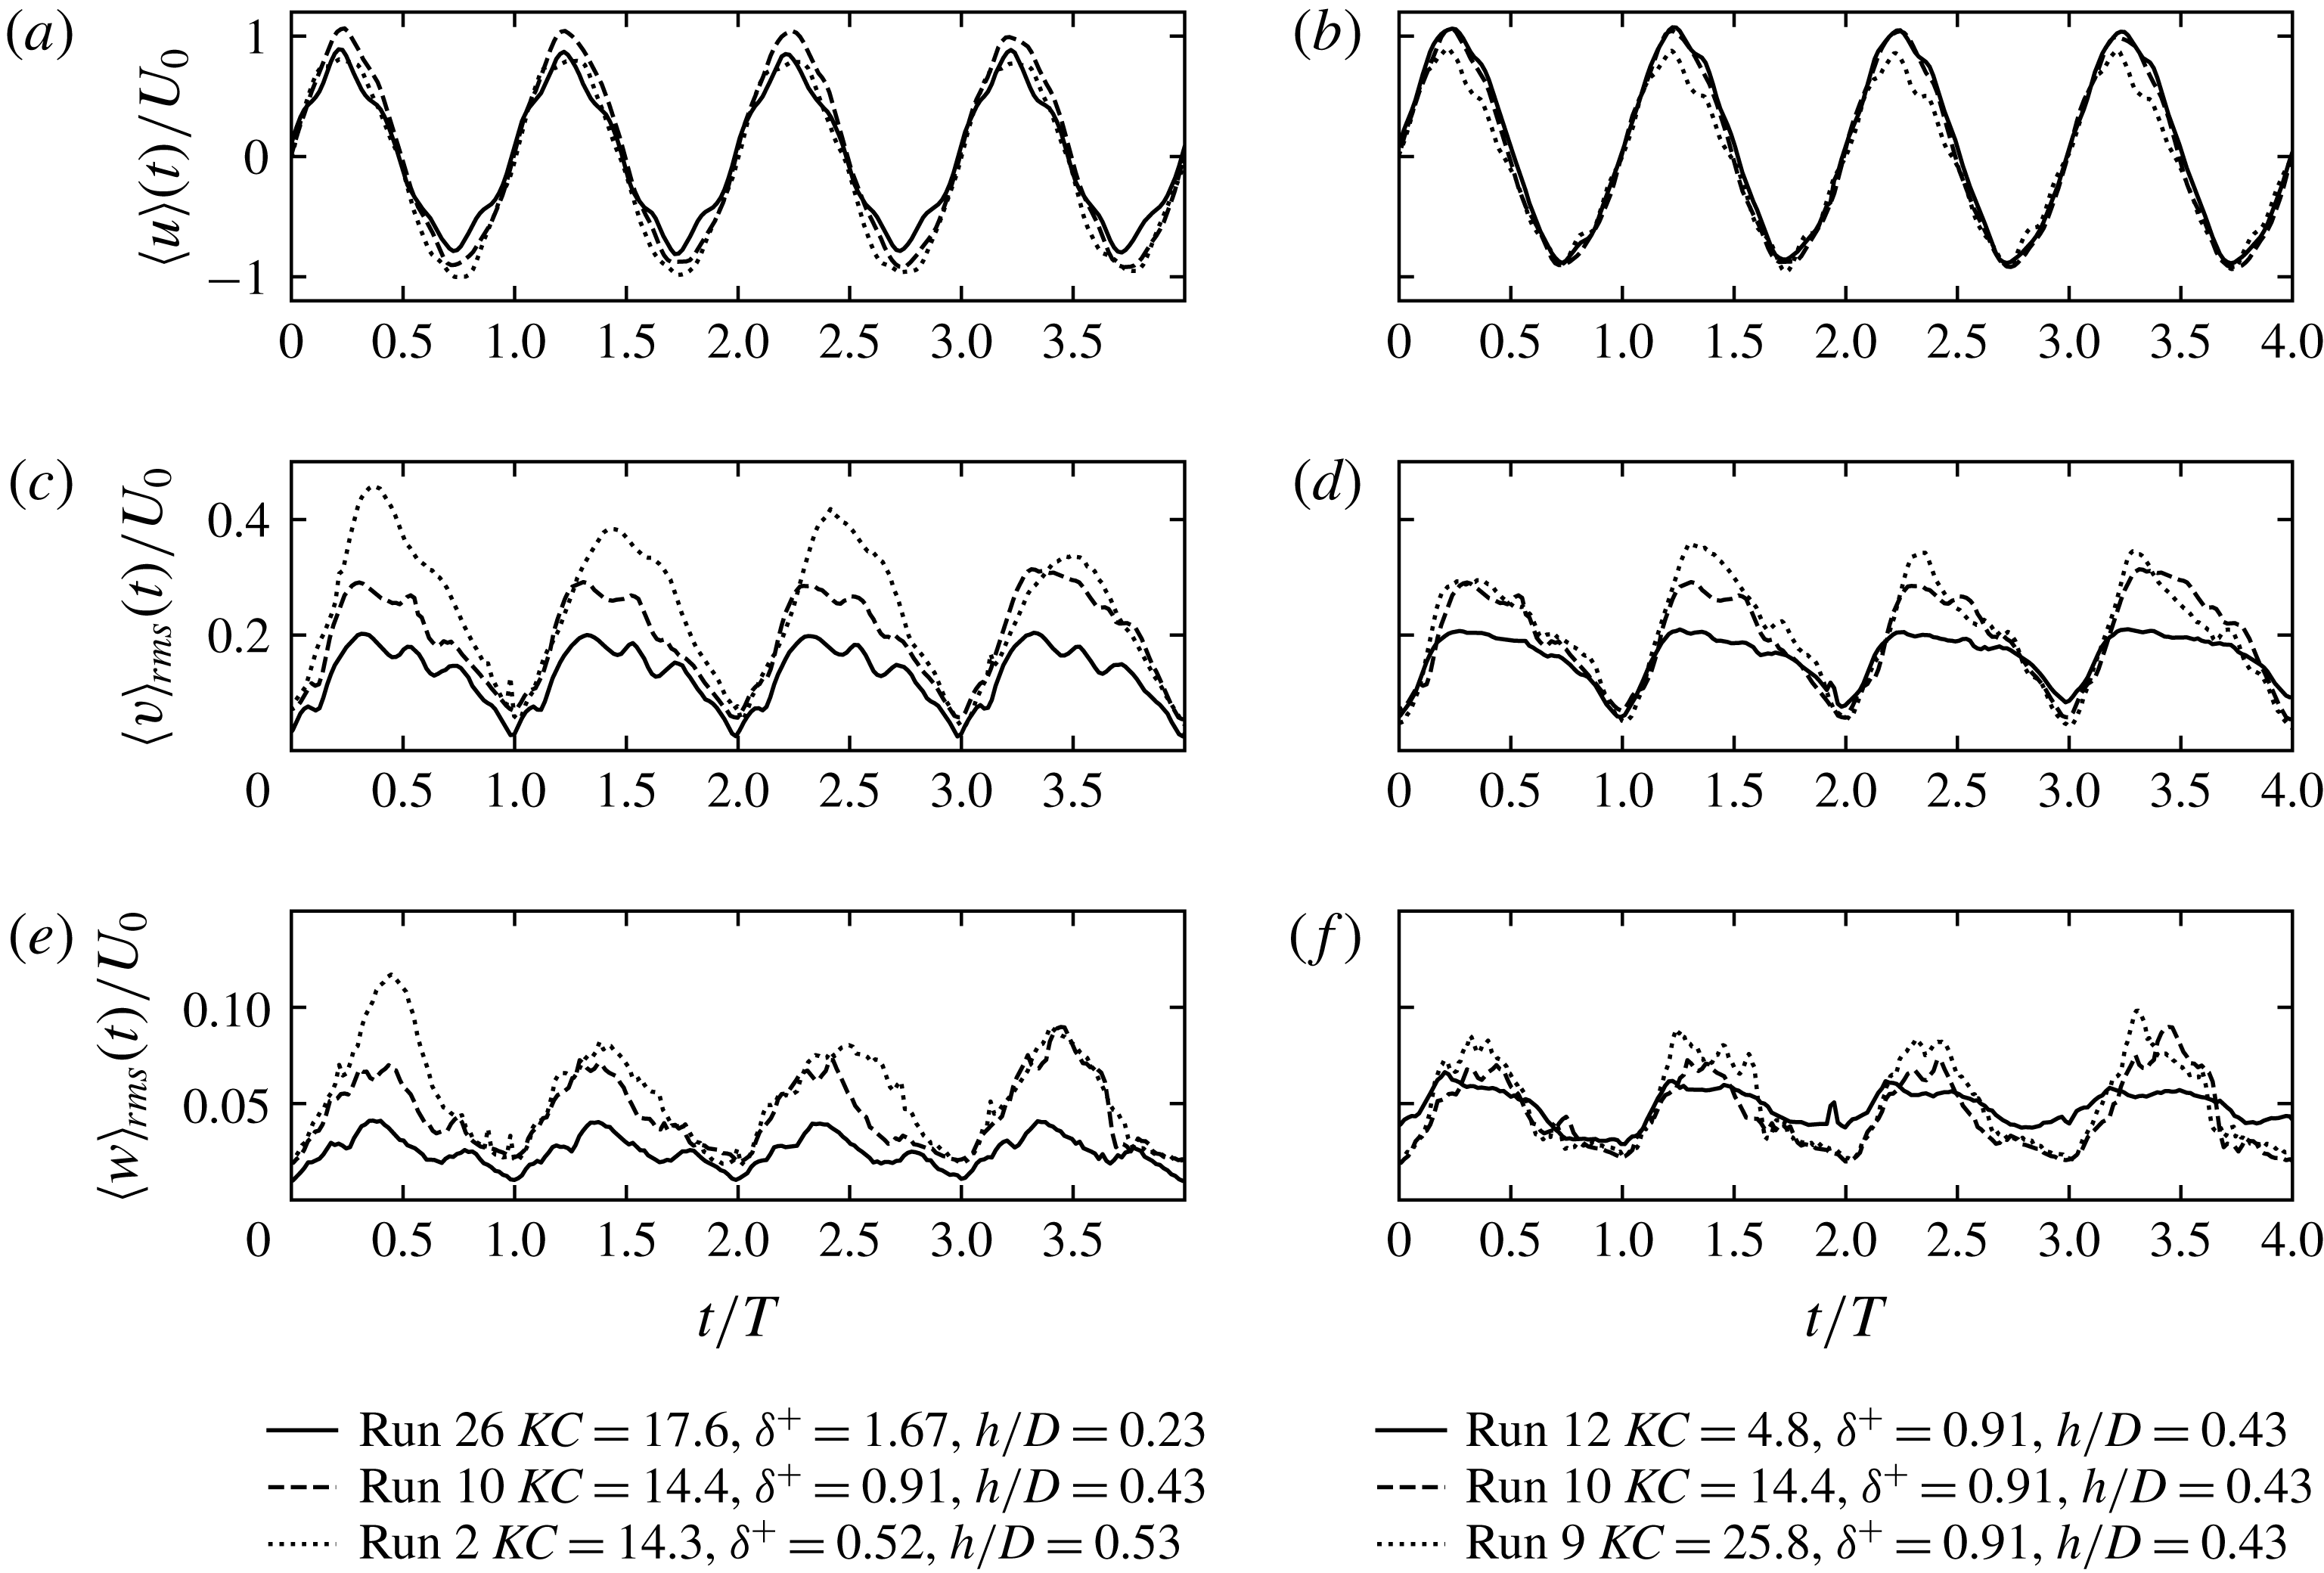
is shown in figure 3. The left column shows
 $KC\approx 15$
and the right column
 $\unicode[STIX]{x1D6FF}^{+}=0.91$
. For these flow conditions, changes in
 $\unicode[STIX]{x1D6FF}^{+}$
and
 $h/D$
are negatively correlated. However, this is not the case in the larger dataset of 38 flow conditions. This subset of 5 flow conditions will be utilised to make some general observations that will inform the development of the scaling arguments.
Example variation in
 $\langle u\rangle (t)/U_{0}$
,
 $\langle v\rangle _{rms}(t)/U_{0}$
and
 $\langle w\rangle _{rms}(t)/U_{0}$
with
 $KC$
and
 $\unicode[STIX]{x1D6FF}^{+}$
. (a,c,e) shows approximately constant
 $KC\approx 15$
and variable
 $\unicode[STIX]{x1D6FF}^{+}$
and (b,d,f) shows constant
 $\unicode[STIX]{x1D6FF}^{+}=0.91$
and variable
 $KC$
. There is an increase in magnitude and cycle-to-cycle variability in
 $\langle v\rangle _{rms}$
with decreasing
 $\unicode[STIX]{x1D6FF}^{+}$
. The dependence of
 $\langle v\rangle _{rms}$
on
 $KC$
is weak compared to the dependence of
 $\langle v\rangle _{rms}$
on
 $\unicode[STIX]{x1D6FF}^{+}$
. The vertical velocity
 $\langle w\rangle _{rms}$
increases with increasing
 $h/D$
with a weak dependence on
 $KC$
.

As expected, the depth-averaged parameter
 $\langle u\rangle$
decreases with increasing
 $\unicode[STIX]{x1D6FF}^{+}$
due to the increasing boundary layer thickness (figure 3
a). The velocity deficit during the wake growth period increases with increasing
 $KC$
(figure 3
b). Decreasing
 $\unicode[STIX]{x1D6FF}^{+}$
results in an increase in the magnitude and cycle-to-cycle variability of the normalised value of
 $\langle v\rangle _{rms}$
(figure 3
c). By contrast,
 $KC$
has a lesser influence on
 $\langle v\rangle _{rms}$
, with a nonlinear increase in
 $\langle v\rangle _{rms}$
from
 $KC=4.8$
to
 $KC=14.4$
, but minimal increase from
 $KC=14.4$
to
 $KC=25.8$
(figure 3
d). The magnitude of
 $\langle w\rangle _{rms}$
increases with increasing
 $h/D$
and decreasing
 $\unicode[STIX]{x1D6FF}^{+}$
(figure 3
e), with a weak dependence on
 $KC$
(figure 3
f). For the
 $KC=4.8$
example,
 $\langle w\rangle _{rms}$
is smaller during the peak generation of the wake, but sustained throughout the flow reversal and remainder of the tidal cycle. As observed in Branson et al. (Reference Branson, Ghisalberti and Ivey2019), this is due to vertical velocity associated with long,
 $x$
-aligned vortices that persist through the tidal cycle. These observations qualitatively support the hypothesis that the lateral and vertical velocity are governed by
 $h/D$
,
 $KC$
and
 $\unicode[STIX]{x1D6FF}^{+}$
.
4.2 Wake classification
In steady flow around an island, flow separation leads to the formation of a wake ‘bubble’, a region of low pressure in the lee of the island which results in the generation of counter-rotating vortices. When the counter-rotating vortices remain attached to the island, the wake is considered stable. In oscillating flow, wake stability has been considered less meaningful than in steady flow due to the free stream being unsteady which can result in the convection of vorticity back past the island (Lloyd et al. Reference Lloyd, Stansby and Chen2001). The convection of vorticity and half-cycle interaction lead to a wide range of wake regimes and vortex synchronisation patterns in unbounded oscillatory flow past a cylinder (Williamson & Roshko Reference Williamson and Roshko1988).
The dominance of the bottom boundary layer in shallow oscillatory flow (
 $h\ll D$
) fundamentally alters the wake characteristics due to the generation of vorticity in the bottom boundary layer and momentum transfer from the wake to the bed. Previous investigations in shallow, oscillatory island wakes have utilised four categories: (i) symmetric without vortex pairing; (ii) symmetric with pairing; (iii) sinuous with pairing; and (iv) vortex shedding (Lloyd et al.
Reference Lloyd, Stansby and Chen2001). In this study the wake classification of Branson et al. (Reference Branson, Ghisalberti and Ivey2019) has been utilised as it more clearly articulates the similarity to the stability criteria of shallow, steady wakes presented in Chen & Jirka (Reference Chen and Jirka1995, Reference Chen and Jirka1997). The four classes of Branson et al. (Reference Branson, Ghisalberti and Ivey2019) were: (i) symmetric; (ii) asymmetric; (iii) unsteady bubble; and (iv) vortex shedding.
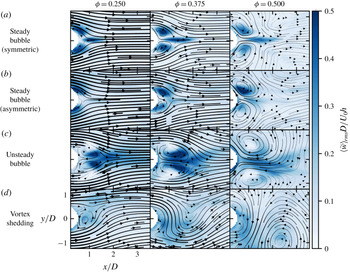
Evolution of oscillatory shallow island wake for
 $0.25<\unicode[STIX]{x1D719}<0.5$
. Examples of a (a) symmetric (Run 24) and (b) asymmetric (Run 12) steady bubble wake, (c) an unsteady bubble wake (Run 14) and (d) an unstable vortex shedding wake (Run 3). Streamlines show the depth- and phase-averaged velocity in the reference frame of the island. The streamline width indicates the relative magnitude of the horizontal velocity (normalised by
 $U_{0}$
). Shaded areas of large vertical advection shown by the normalised r.m.s. vertical velocity
 $\langle \tilde{w}\rangle _{rms}D/U_{0}h$
.

Examples of the streamline topology of the different wake classes are demonstrated through the depth- and phase-averaged 3D-PIV data presented in figure 4. Wake forms were classified based on visual observations during the experiments and through animation of instantaneous, depth-averaged velocity fields. We group the symmetric and asymmetric wakes into a single class: steady bubble. The asymmetric wake is present only for small
 $KC$
and low
 $\unicode[STIX]{x1D6FF}^{+}$
and is distinguished from the unsteady bubble wake by the lack of strong downwelling secondary vortices. Whilst the asymmetric wake has one wake eddy with a larger circulation than the other, it repeats consistently from cycle-to-cycle with little unsteadiness in the wake bubble within a half-cycle. Deflection of the secondary vortices (indicated by regions of enhanced vertical velocity) away from the wake centreline (
 $y/D=0$
) marked the transition from the steady bubble wake to the unsteady bubble wake. Finally, the transition to vortex shedding was indicated by the detachment of a primary vortex during the ‘growth’ period. Thus, the wake classes utilised here are (i) steady bubble (SB), (ii) unsteady bubble (UB) and (iii) vortex shedding (VS). Visually, the laminar wakes of this study are markedly different from the (equivalently named) turbulent wakes of Chen & Jirka (Reference Chen and Jirka1995). However, as will be demonstrated later, the wake classes are analogous from the perspective of the strength of the wake return flow and global stability of the wake.
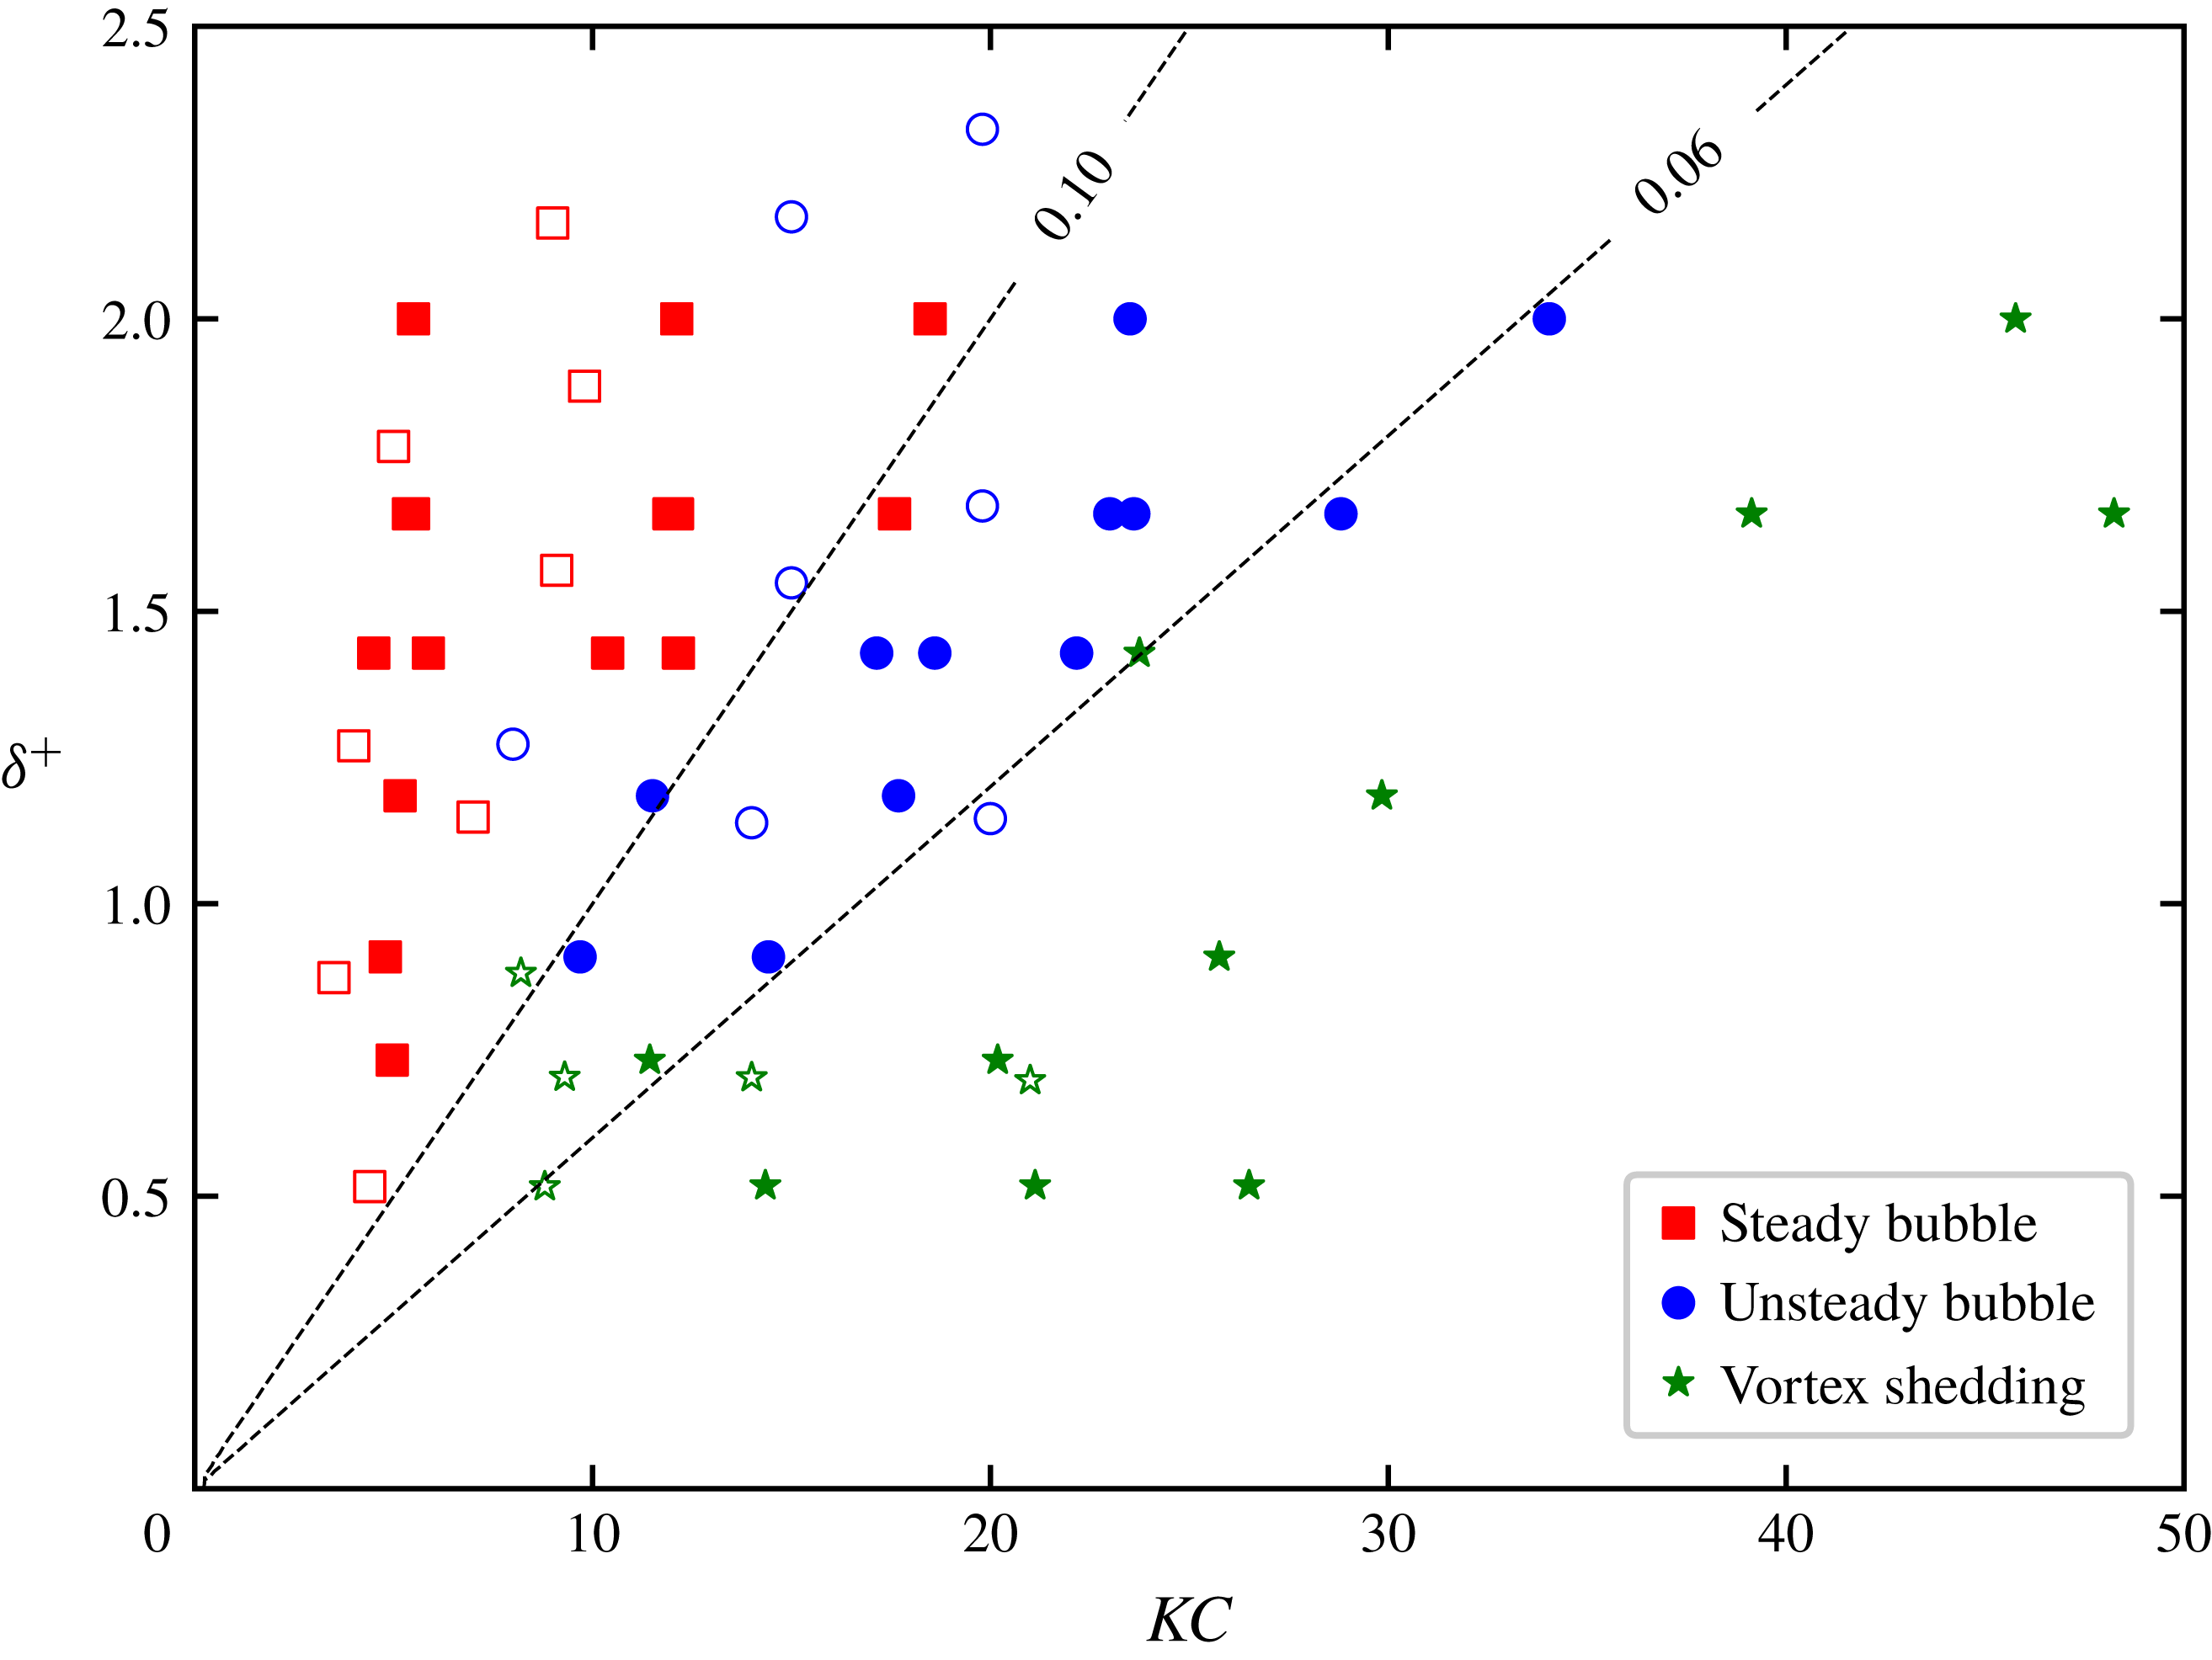
Presentation of the experimental conditions in
 $KC$
–
 $\unicode[STIX]{x1D6FF}^{+}$
space with labelled lines of constant
 $S$
shown. Filled markers refer to conditions in the present study and unfilled markers are those of Lloyd et al. (Reference Lloyd, Stansby and Chen2001). Marker type indicates the wake form.

In this study, vortex shedding was observed for
 $S\lesssim 0.06$
, the unsteady bubble wake for
 $0.06\lesssim S\lesssim 0.1$
and the steady bubble wake for
 $S\gtrapprox 0.1$
. The transition from one wake class to the next was observed to be gradual (figure 5). Experiments close to the transition to vortex shedding were observed to have cycle-to-cycle variability. That is, asymmetry was observed to grow over a number of cycles which may culminate in a vortex being shed only every few cycles. There is a complex inter-dependence between
 $KC$
and
 $\unicode[STIX]{x1D6FF}^{+}$
that governs the transition between wake classes. The pairing process documented in Lloyd et al. (Reference Lloyd, Stansby and Chen2001) (where a vortex from the previous half-cycle is advected back past the cylinder and pairs with a newly forming vortex on the next cycle) is observed in the present study for the SB wake (for
 $KC>7$
) and UB wake. However, due to the reduced field of view in these experiments, the vortex pairs advect beyond
 $x/D=3.5$
for large
 $KC$
. Figure 5 shows the wake classification, in conjunction with the experimental values of
 $S$
, in
 $KC$
–
 $\unicode[STIX]{x1D6FF}^{+}$
space. Here, the results of Lloyd et al. (Reference Lloyd, Stansby and Chen2001) have been reclassified by grouping the symmetric without vortex pairing and symmetric with pairing wakes as steady bubble, and the sinuous with pairing wake as unsteady bubble (noting also that the stability parameter of Lloyd et al. (Reference Lloyd, Stansby and Chen2001) has been recalculated here by dividing by
 $\sqrt{2}$
to reconcile differing definitions of
 $c_{f}$
). There is reasonable agreement between the results of Lloyd et al. (Reference Lloyd, Stansby and Chen2001) and this study.
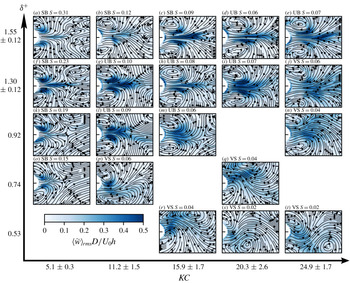
Streamlines of depth- and phase-averaged velocity in the reference frame of the flow. Phase average calculated over eight cycles for a phase of
 $\unicode[STIX]{x1D719}=0.375$
with shading indicating the depth- and phase-averaged vertical velocity normalised by
 $U_{0}h/D$
. Outer axes gives an indication of the approximate variation in
 $KC$
and
 $\unicode[STIX]{x1D6FF}^{+}$
across the presented runs. Stability increases from bottom right to top left. Inset title indicates the wake form (SB, UB and VS) with the field of view and labels as per figure 4.

According to (2.3), the wake stability in shallow oscillatory flow is governed by the two parameters
 $KC$
and
 $\unicode[STIX]{x1D6FF}^{+}$
. Figure 6 provides an overview of the wake forms in this
 $KC$
–
 $\unicode[STIX]{x1D6FF}^{+}$
parameter space. For each experiment the phase- and depth-averaged velocity is calculated at a phase of
 $\unicode[STIX]{x1D719}=0.375$
. Streamlines presented in the frame of reference moving with the flow, at a phase of
 $\unicode[STIX]{x1D719}=0.375$
, provided the clearest visualisation of the wake forms across all wake categories. From the cylinder wake structure of unbounded oscillating flow it is known that flow separation is initiated at
 $Re=O(10^{2})$
when
 $KC>3$
. For
 $Re>O(10^{3})$
flow separation occurs at
 $KC>2$
, consistent with the present results: in figure 6(o), for
 $KC=5.0$
and
 $Re=414$
flow separation is observed. For
 $KC<7$
, asymmetry commences when
 $\unicode[STIX]{x1D6FF}^{+}<1.0$
(compare figure 6
f,k). For smaller values of
 $\unicode[STIX]{x1D6FF}^{+}<0.5$
, asymmetry is likely to increase, as is the case in unbounded oscillatory wakes where vortex asymmetry begins when
 $KC>4$
. In unbounded cylinder wakes vortex shedding commences for
 $KC>7$
(Sumer & Fredsøe Reference Sumer and Fredsøe2006). For
 $KC<7$
, the time scale of vortex evolution
 $D/U_{0}$
is longer than the period of flow oscillation. This limits the growth of the wake vortices, with equivalent behaviour observed in this study for shallow island wakes.
The spatial distribution of vertical stirring in the wake, relative to the primary vortices visible in the streamline topology, is shown in the normalised, phase- and depth-averaged vertical velocity (figure 6). Upwelling and downwelling is more localised when the wake bubble remains steady and vortices attached to the island. For increasing
 $KC$
and
 $\unicode[STIX]{x1D6FF}^{+}\gtrsim 1$
(see figure 6
f–i) the dominant region of upwelling moves away from the centre of the primary wake vortices, towards two elongated secondary vortices (with axes of rotation aligned horizontally). These secondary vortices are associated with a zone flow convergence and divergence along the wake centreline. In the vortex shedding regime, upwelling is increasingly associated with long secondary vortices that extend laterally between the primary vertical vortices that are shed into the flow. Due to the transient, unsteady character of the secondary vortices, their influence is indicated by the diffuse regions of elevated
 $\langle \tilde{w}\rangle$
in figure 6(q–t).
For given
 $\unicode[STIX]{x1D6FF}^{+}\lesssim 1.0$
increasing
 $KC$
increases the number of vortices shed per cycle; however the number of vortices shed are fewer than unbounded cylinders due to the influence of bed friction. For example, for
 $\unicode[STIX]{x1D6FF}^{+}=0.74$
and
 $KC=21.2$
(figure 6
q) a single vortex is shed each half-cycle, whereas for unbounded flow two vortices are shed each half-cycle (Williamson Reference Williamson1985). Further, increasing
 $\unicode[STIX]{x1D6FF}^{+}$
decreases the shedding frequency (relative to
 $1/T$
) the lower limit of which is the complete suppression of vortex shedding (figure 6
i,d). For a given value of
 $S$
, for example
 $S=0.06$
(figure 6
d,j,m,p), wake symmetry increases with
 $\unicode[STIX]{x1D6FF}^{+}$
. This highlights the distinct mechanisms that establish wake stability: the relative length of the tide and the relative influence of the boundary layer, even as
 $S$
remains constant.
4.3 Temporal evolution of wake stability
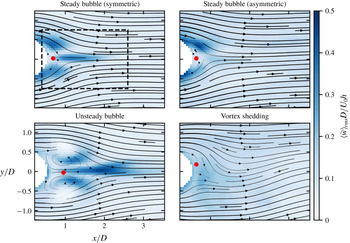
Example calculation of return velocity (
 $U_{m}$
) for the various classes of wake from phase (
 $0.0<\unicode[STIX]{x1D719}<0.5$
) and depth averaged velocity fields. The location of the peak return velocity (the minimum
 $\langle \tilde{u} \rangle (x,y)$
-velocity) is indicated with a red dot. The dashed box indicates the normalised (by
 $D$
) field of view for the larger
 $D=15~\text{cm}$
experiments.

In steady, shallow wake flow, the magnitude of the return velocity (the flow back towards the cylinder near the wake centreline) is a key indicator of the overall stability of the transverse profile of streamwise velocity (Grubišić, Smith & Schär Reference Grubišić, Smith and Schär1995; Chen & Jirka Reference Chen and Jirka1997). The depth- and phase-averaged
 $u$
-velocity is calculated for three different intervals of the phase during the ‘growth’ period. From the resulting fields of
 $\langle \tilde{u} \rangle (x,y)$
, the return velocity (
 $U_{m}$
) is identified as the minimum streamwise velocity in the wake. A negative value of
 $U_{m}$
indicates a return flow towards the island. Examples of the calculation of the return velocity for the different wake classes are shown in figure 7. The red dot indicates the location of
 $U_{m}$
(i.e. the reverse flow towards the cylinder) with
 $x_{p}$
and
 $y_{p}$
defined as the normalised coordinates of the position of
 $U_{m}$
.
Magnitude (
 $-U_{m}/U_{0}$
) and location (
 $x_{p}$
,
 $y_{p}$
) of the peak depth- and phase-averaged return flow (
 $U_{m}$
). (a–c) Growth period (
 $0.0<\unicode[STIX]{x1D719}<0.5$
), (d–f) accelerating stage of growth period (
 $0.0<\unicode[STIX]{x1D719}<0.25$
) and (g–i) decelerating stage of growth period (
 $0.25<\unicode[STIX]{x1D719}<0.5$
). Symbols indicate the wake forms as per figure 5 and colour indicates the value of
 $\unicode[STIX]{x1D6FF}^{+}$
.

The wake stability parameter,
 $S$
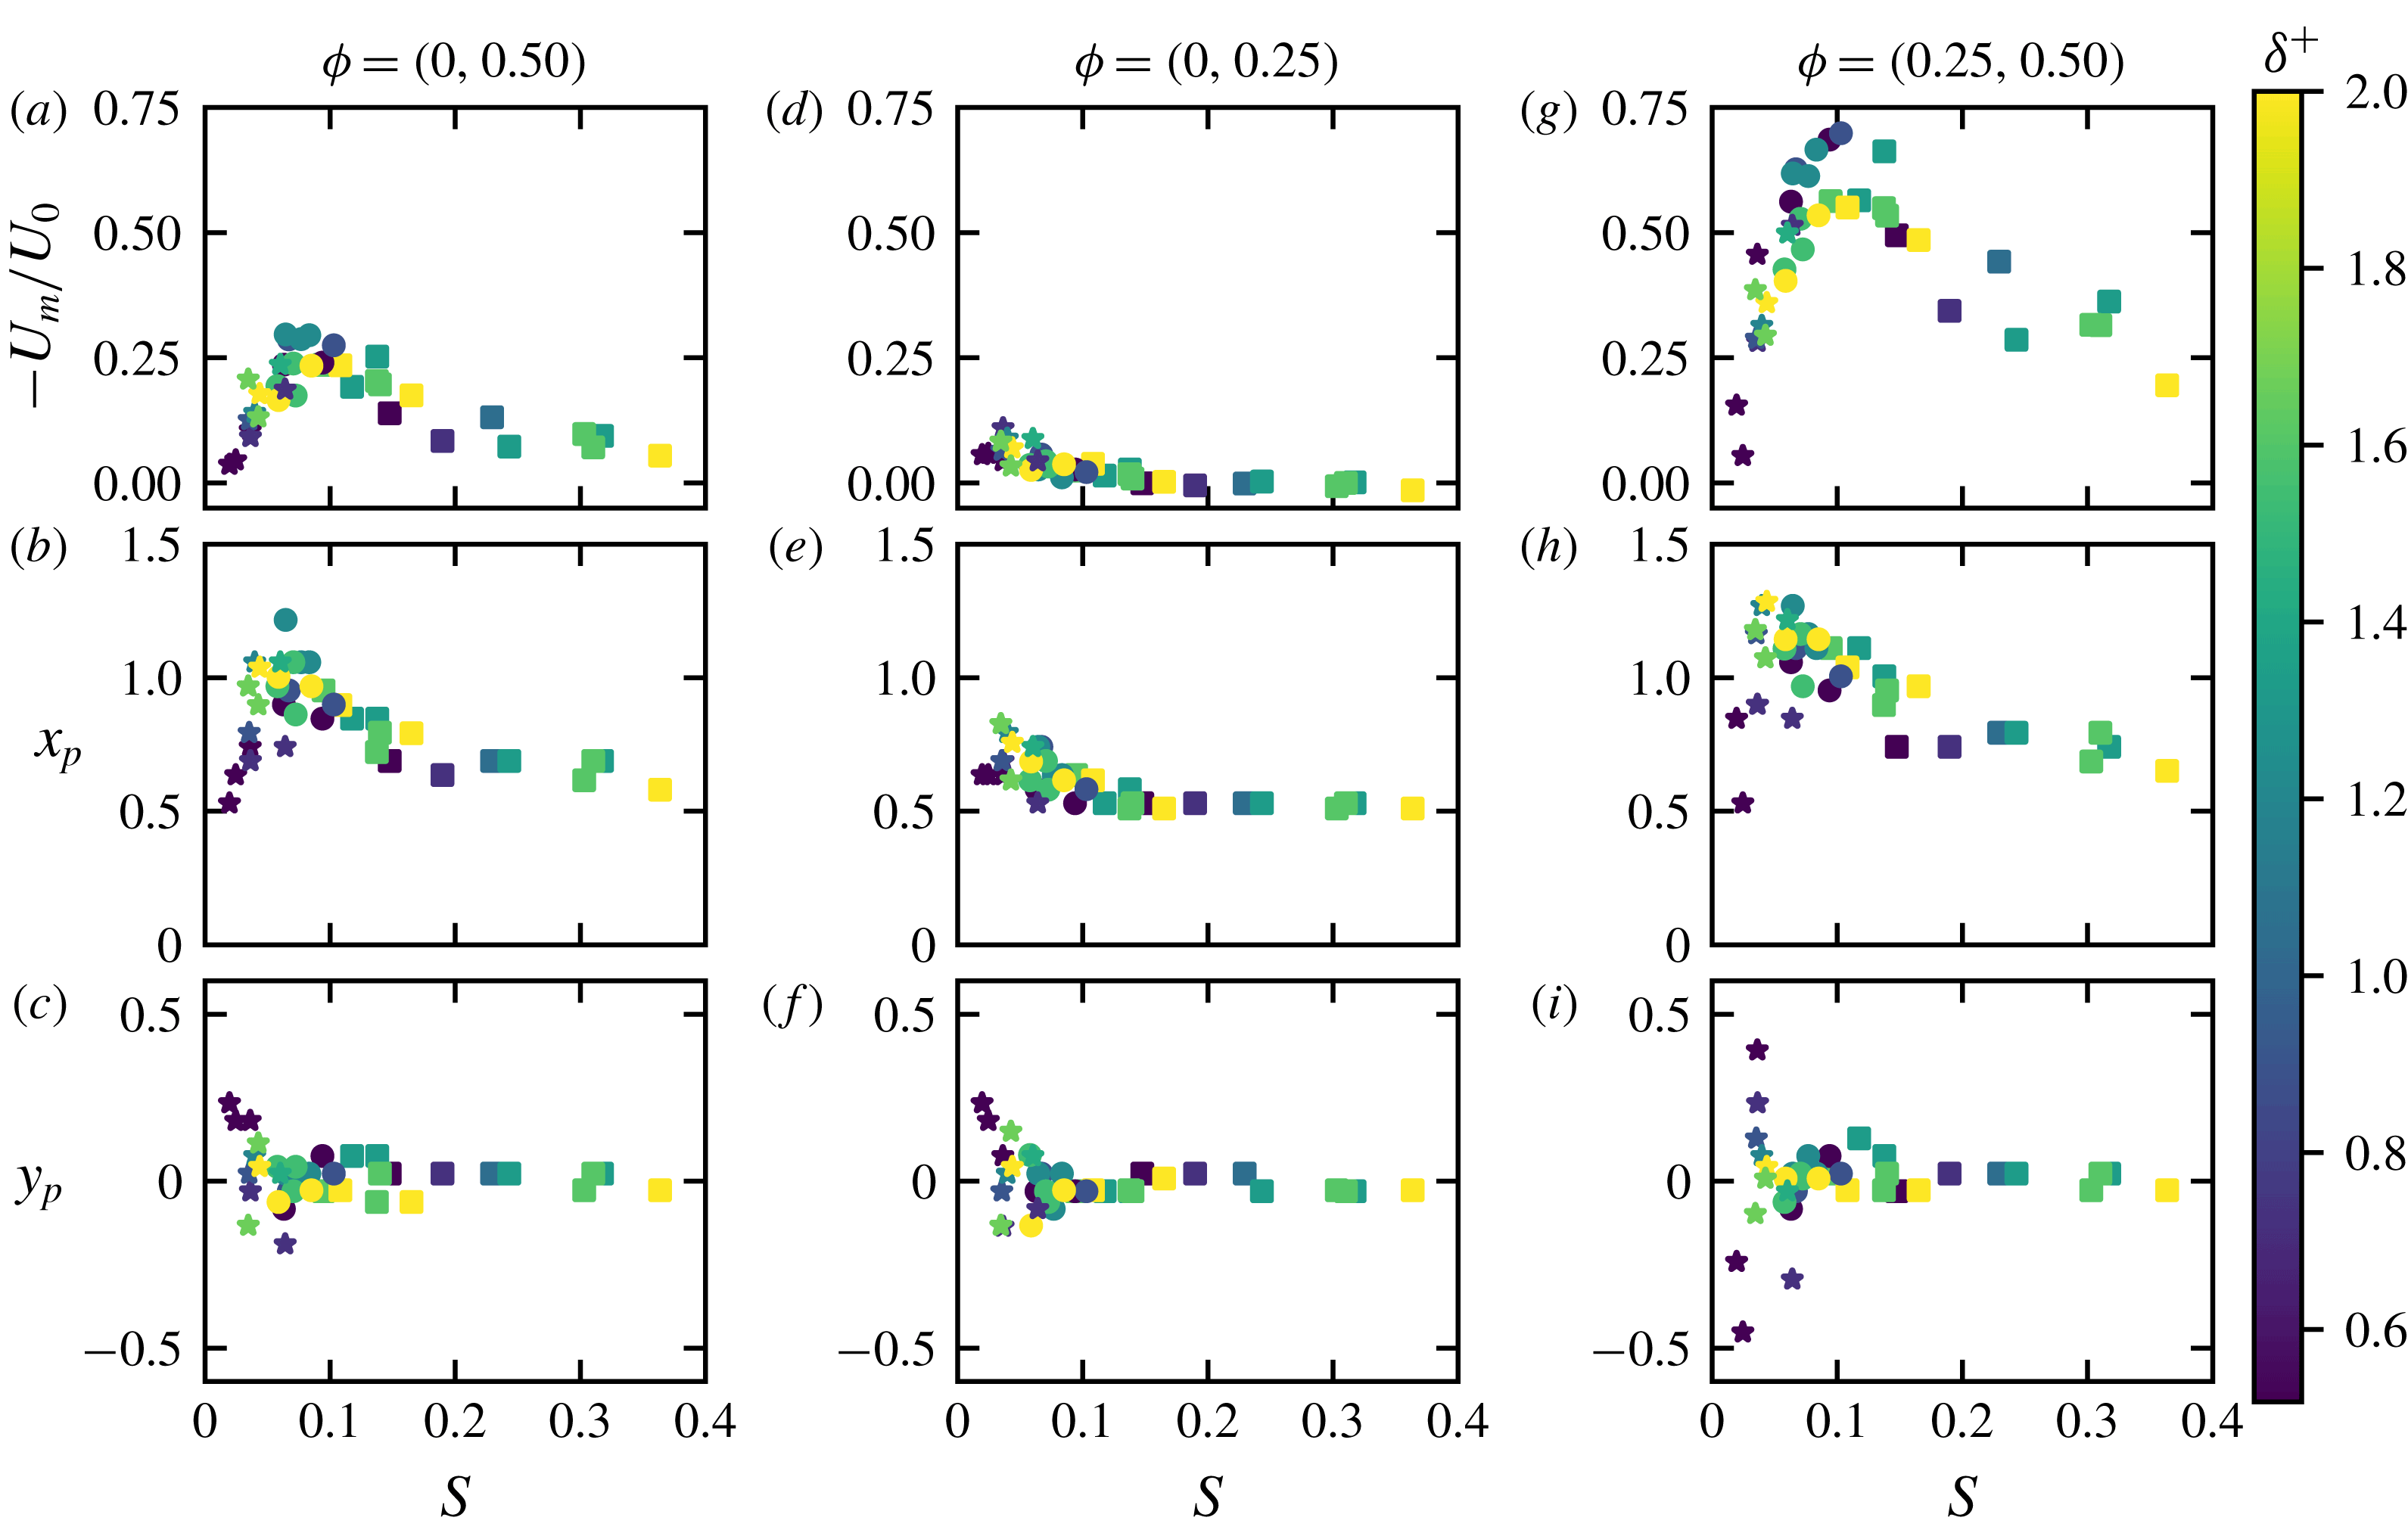
, controls the magnitude of the wake return flow (figure 8). For the growth period,
 $0.0<\unicode[STIX]{x1D719}<0.5$
, the magnitude of the depth-averaged return flow reaches a maximum of
 $-0.3U_{0}$
in the UB wake and decays exponentially with increasing stability (figure 8
a). Similarly, the maximum return flow for the UB wake in the steady-flow experiments of Chen & Jirka (Reference Chen and Jirka1995) was
 $-0.35U_{0}$
, with a rapid drop off for increasing
 $S$
. The peak in the return flow occurs around
 $x/D\approx 1$
(consistent with the steady-flow wake) and moves closer to the island for increasing wake stability (figure 8
b). With the onset of vortex shedding for
 $S\lesssim 0.06$
, the magnitude of the phase-averaged return flow reduces sharply. The deflection of the return flow, away from the wake centreline, highlights the asymmetry that results from vortex shedding (figure 8
c).
Vortex shedding wakes have a return flow that is established early in the growth period. The accelerating stage (
 $0.0<\unicode[STIX]{x1D719}<0.25$
) of the growth period exhibits a distinct trend of reducing return flow magnitude with increasing stability (figure 8
d), ultimately leading to the complete suppression of the return flow for
 $S\gtrsim 0.15$
. Similarly, the location of the maximum return flow shifts downstream as the strength of the return flow increases (figure 8
e). Vortex shedding commences when the return flow in the wake exceeds approximately
 $0.05U_{0}$
during the accelerating stage. The onset of increasing asymmetry, early in the tidal cycle, is demonstrated by the lateral variability of the location of maximum return flow (figure 8
f).
The dynamics of the wake alters significantly when the pressure gradient imposed by the external flow becomes adverse (for
 $0.25<\unicode[STIX]{x1D719}<0.5$
). The return flow induced in the wake is enhanced by the external pressure gradient and a strong return flow jet of up to
 $0.7U_{0}$
is present for
 $S\approx 0.1$
(figure 8
f). The strong return flow leads to earlier flow reversal at the island flanks also with a jet like character. There is a second-order influence on the strength of the return flow due to
 $\unicode[STIX]{x1D6FF}^{+}$
, where for a given
 $S\approx 0.1$
, a wake with smaller
 $\unicode[STIX]{x1D6FF}^{+}$
has a stronger return flow (figure 8
g). For
 $S<0.1$
, as the wake stability reduces, the magnitude of the return flow reduces. This is due to the wake centreline region being dominated by lateral flow associated with wake vortices. The lateral location of the return flow can vary widely for the vortex shedding wake at this stage of the tidal cycle (figure 8
i). This lateral variation is a distinguishing feature of the vortex shedding wake, compared to the unsteady bubble wake, which tends to maintain a strong return flow along the wake centreline (
 $y/D=0$
). The location of the maximum return flow is furthest downstream at the transition to vortex shedding,
 $S\approx 0.05{-}0.07$
(figure 8
h), even though the maximum return flow occurs at
 $S\approx 0.1$
.
In conjunction with observations of the wake form, the magnitude of the return flow at different stages of the tide gives an indication of the global stability of the wake circulation. The maximum growth rate of the absolute instability in the wake is controlled by the strength of the return flow with the downstream extent of the region of return flow indicative of the size of the region of absolute instability (Grubišić et al. Reference Grubišić, Smith and Schär1995). The fact that the location of the return flow is furthest from the cylinder at the transition to vortex shedding supports the concept that a region of absolute instability must grow sufficiently large within the tidal cycle for the onset of vortex shedding. Furthermore, when the external flow is unsteady, a return flow of sufficient strength must be established during the accelerating stage of the tide for the onset of vortex shedding. These results demonstrate that consideration of the tidal phase is crucial in interpreting observations of island wakes in tidal flow.
4.4 Scaling of lateral and vertical velocity
A novel and significant contribution of this study is the full 3-D velocity field measured over a wide range of parameters. This provides a solid basis for the scaling of lateral and vertical (upwelling) velocities in the tidally forced island wake. When a shear supporting boundary is present in conjunction with rotation of the flow a balance between bottom friction and pressure in the bottom boundary layer will drive net transport inwards towards the zone of low pressure. The radial net transport establishes zones of divergence and convergence that drive vertical transport through Ekman pumping (upwelling) and suction (downwelling). For shallow flow, where bottom friction is important, upwelling in the island wake is expected to be driven by the curl of stress at the bed associated with the wake eddies and the Ekman boundary layer in the wake. A simple Ekman pumping model is a reasonable approach to examine the scaling of vertical velocity. Integrating the momentum flux over the boundary layer thickness, the vertical Ekman velocity is (Cushman-Roisin & Beckers Reference Cushman-Roisin and Beckers2011)
 $$\begin{eqnarray}w_{E}=\frac{1}{\unicode[STIX]{x1D70C}}\boldsymbol{k}\boldsymbol{\cdot }\unicode[STIX]{x1D735}\times (\unicode[STIX]{x1D70F}_{b}/\unicode[STIX]{x1D714}_{e}),\end{eqnarray}$$
where
 $\boldsymbol{k}$
is the vertical unit vector,
 $\unicode[STIX]{x1D70F}_{b}$
is the bed shear stress and
 $\unicode[STIX]{x1D714}_{e}$
is a characteristic eddy rotational frequency. The bed stress will scale as
 $\unicode[STIX]{x1D70F}_{b}\sim \unicode[STIX]{x1D707}U_{e}/\unicode[STIX]{x1D6FF}_{E}$
, where
 $\unicode[STIX]{x1D6FF}_{E}$
is the thickness of the Ekman boundary layer and
 $U_{e}$
is a characteristic azimuthal velocity for the wake eddies. The eddy rotational frequency will scale as
 $\unicode[STIX]{x1D714}_{e}\sim U_{e}/L_{e}$
, where
 $L_{e}$
is a characteristic length scale of the wake eddies. The Ekman boundary layer thickness will scale as
 $\unicode[STIX]{x1D6FF}_{E}\sim \sqrt{\unicode[STIX]{x1D708}/\unicode[STIX]{x1D714}_{e}}$
. Letting the gradient scale as
 $\unicode[STIX]{x1D735}\sim 1/L_{e}$
and substituting into (4.1) gives
 $$\begin{eqnarray}w_{E}\sim \sqrt{\frac{\unicode[STIX]{x1D708}U_{e}}{L_{e}}},\end{eqnarray}$$
where
 $U_{e}$
and
 $L_{e}$
have an unknown functional dependence on the parameters
 $h/D$
,
 $KC$
and
 $\unicode[STIX]{x1D6FF}^{+}$
, such that
 $$\begin{eqnarray}U_{e}/U_{0}\sim f_{U}(h/D,KC,\unicode[STIX]{x1D6FF}^{+})=\unicode[STIX]{x1D6FD}_{0,f_{U}}(h/D)^{\unicode[STIX]{x1D6FD}_{h/D,f_{U}}}KC^{\unicode[STIX]{x1D6FD}_{KC,f_{U}}}(\unicode[STIX]{x1D6FF}^{+})^{\unicode[STIX]{x1D6FD}_{\unicode[STIX]{x1D6FF}^{+},f_{U}}},\end{eqnarray}$$
and
 $$\begin{eqnarray}L_{e}/D\sim f_{L}(h/D,KC,\unicode[STIX]{x1D6FF}^{+})=\unicode[STIX]{x1D6FD}_{0,f_{L}}(h/D)^{\unicode[STIX]{x1D6FD}_{h/D,f_{L}}}KC^{\unicode[STIX]{x1D6FD}_{KC,f_{L}}}(\unicode[STIX]{x1D6FF}^{+})^{\unicode[STIX]{x1D6FD}_{\unicode[STIX]{x1D6FF}^{+},f_{L}}},\end{eqnarray}$$
where
 $\unicode[STIX]{x1D6FD}_{p,r}$
are the scaling coefficients for parameter
 $p$
and scaling relationship
 $r$
.
Substituting (4.3) and (4.4) in (4.2) gives
 $$\begin{eqnarray}w_{E}/U_{0}\sim \frac{1}{\sqrt{Re}}\sqrt{\frac{f_{U}}{f_{L}}}\equiv \frac{h}{D}\frac{\unicode[STIX]{x1D6FF}^{+}}{\sqrt{KC}}\sqrt{\frac{f_{U}}{f_{L}}},\end{eqnarray}$$
where the scaling coefficients of
 $f_{U}$
and
 $f_{L}$
can be estimated from three-dimensional velocity measurements of the shallow island wake assuming that
 $U_{e}\sim \langle \overline{v}\rangle _{rms}$
and
 $w_{E}\sim \langle \overline{w}\rangle _{rms}$
.
The Bayesian statistical analysis (see supplementary material) indicates that there is a range of credible scaling coefficient values for
 $f_{U}$
and
 $f_{L}$
that can adequately describe the relationship between the eddy velocity and length scales that drive a vertical flux from the boundary layer via Ekman pumping. The posterior distribution of the scaling coefficients indicates that the effect size of the flow aspect ratio (
 $h/D$
) in
 $f_{U}$
and
 $f_{L}$
is likely zero. Examination of the remaining scaling coefficients (for
 $KC$
and
 $\unicode[STIX]{x1D6FF}^{+}$
) indicates that
 $\unicode[STIX]{x1D6FD}_{KC,f_{L}}\approx -\unicode[STIX]{x1D6FD}_{\unicode[STIX]{x1D6FF}^{+},f_{L}}$
which implies that
 $L_{e}\sim D.S^{\unicode[STIX]{x1D6FD}_{\unicode[STIX]{x1D6FF}^{+},f_{L}}}$
. Taking
 $\unicode[STIX]{x1D6FD}_{KC,f_{U}}=0$
,
 $\unicode[STIX]{x1D6FD}_{\unicode[STIX]{x1D6FF}^{+},f_{U}}=-2/3$
,
 $\unicode[STIX]{x1D6FD}_{KC,f_{L}}=-4/3$
and
 $\unicode[STIX]{x1D6FD}_{\unicode[STIX]{x1D6FF}^{+},f_{L}}=4/3$
as a particular model within the 95 % confidence intervals of the scaling coefficients gives
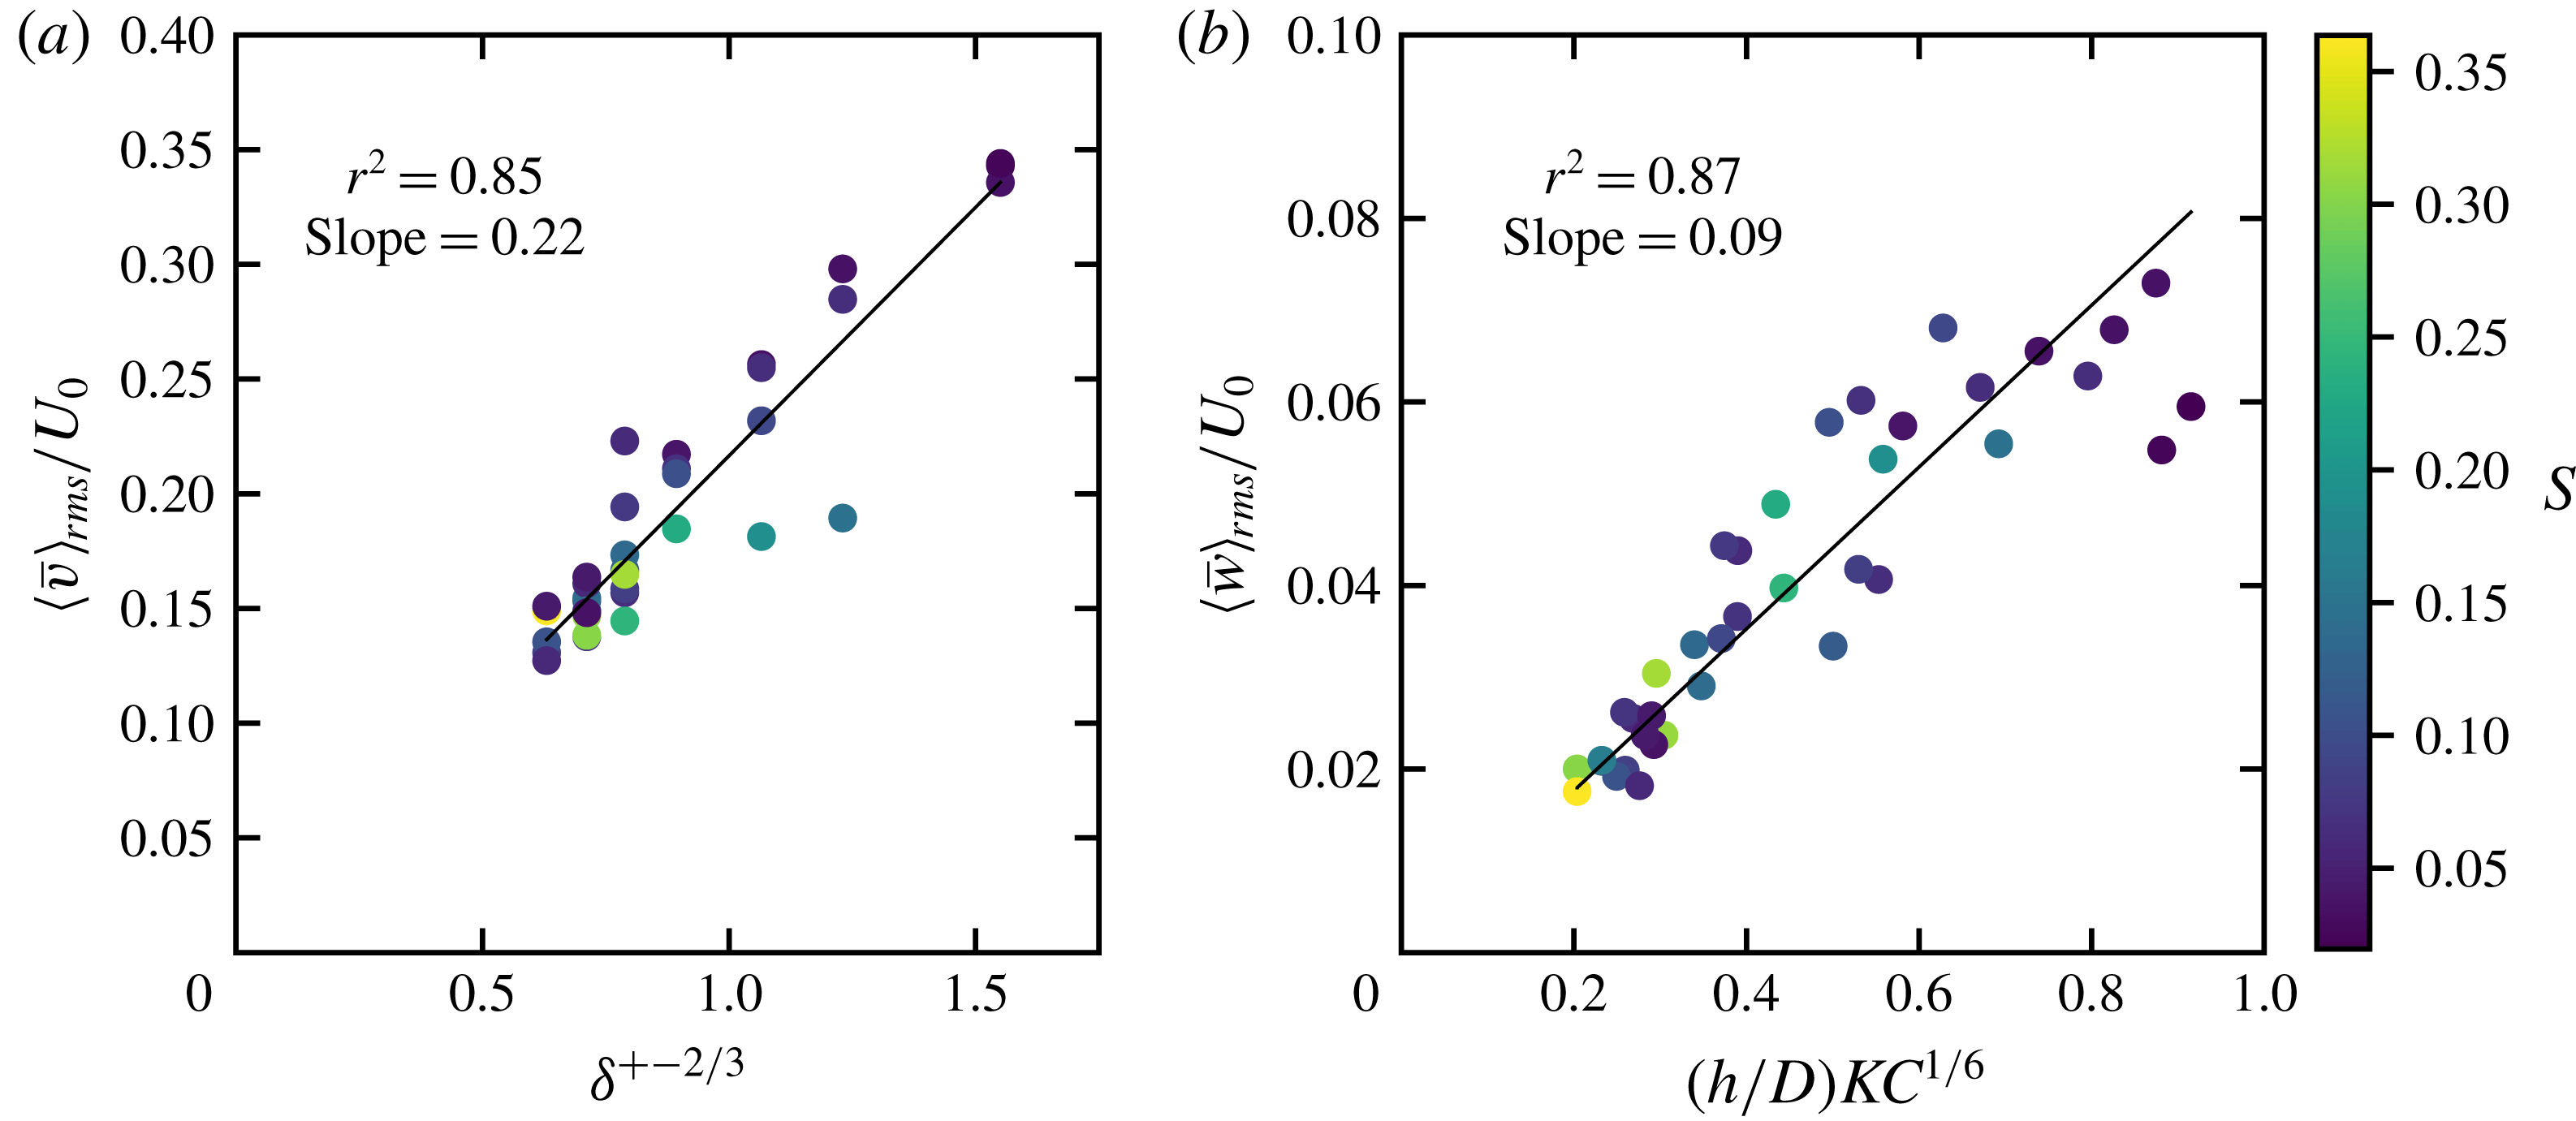
 $$\begin{eqnarray}\displaystyle & \langle \overline{v}\rangle _{rms}/U_{0}=0.22(\unicode[STIX]{x1D6FF}^{+})^{-2/3}, & \displaystyle\end{eqnarray}$$
 $$\begin{eqnarray}\displaystyle & \langle \overline{w}\rangle _{rms}/U_{0}=0.09(h/D)KC^{1/6}, & \displaystyle\end{eqnarray}$$
which predicts well the first-order scaling of
 $\langle \overline{v}\rangle _{rms}$
(
 $r^{2}=0.85$
) and
 $\langle \overline{w}\rangle _{rms}$
(
 $r^{2}=0.87$
) over the range of these experiments (figure 9). This demonstrates that in the island wake, the lateral velocity scales with the relative tidal boundary layer thickness, due to entrainment of the vertical structure of the external forcing flow into the wake. The upwelling velocity scales predominantly with the flow aspect ratio (as would be expected by conservation of mass) with a weak increase for increasing relative tidal excursion.
Scaling relationships for (a)
 $\langle \overline{v}\rangle _{rms}/U_{0}$
and (b)
 $\langle \overline{w}\rangle _{rms}/U_{0}$
based on a simple parametrisation of
 $U_{e}/U_{0}\sim f_{U}(\unicode[STIX]{x1D6FF}^{+})$
and
 $L_{e}/D\sim f_{L}(KC)$
. The black line indicates a 1 : 1 slope.

A number of observations can be drawn from the implied scaling relationships,
 $$\begin{eqnarray}\displaystyle & \displaystyle L_{e}\sim DS^{4/3}, & \displaystyle\end{eqnarray}$$
 $$\begin{eqnarray}\displaystyle & \displaystyle \unicode[STIX]{x1D714}_{e}\sim \frac{U_{0}}{D}\frac{KC^{4/3}}{(\unicode[STIX]{x1D6FF}^{+})^{2}}\equiv \frac{U_{0}}{D}\frac{1}{S^{4/3}(\unicode[STIX]{x1D6FF}^{+})^{2/3}}, & \displaystyle\end{eqnarray}$$
 $$\begin{eqnarray}\displaystyle & \displaystyle \unicode[STIX]{x1D6FF}_{E}\sim h\frac{(\unicode[STIX]{x1D6FF}^{+})^{2}}{KC^{7/6}}\equiv hS^{7/6}(\unicode[STIX]{x1D6FF}^{+})^{5/6}. & \displaystyle\end{eqnarray}$$
Firstly, the characteristic length scale of the wake eddies scales with the island diameter and increases with increasing wake stability, consistent with observations of wake eddies presented (Branson et al.
Reference Branson, Ghisalberti and Ivey2019). Secondly, the characteristic time scale of the wake eddies (
 $1/\unicode[STIX]{x1D714}_{e}$
) scales with
 $D/U_{0}$
(consistent with the unbounded cylinder wake) and increases with increasing stability and relative boundary layer thickness whilst decreasing with increasing relative tidal length. Finally, the wake Ekman boundary layer scales with the flow depth and increases with increasing stability, and relative tidal boundary layer thickness while decreasing with increasing relative tidal length (as expected with the decrease in characteristic eddy time scale).
4.5 Distribution of vertical velocity
For
 $(h/D)KC^{1/6}\gtrsim 0.6$
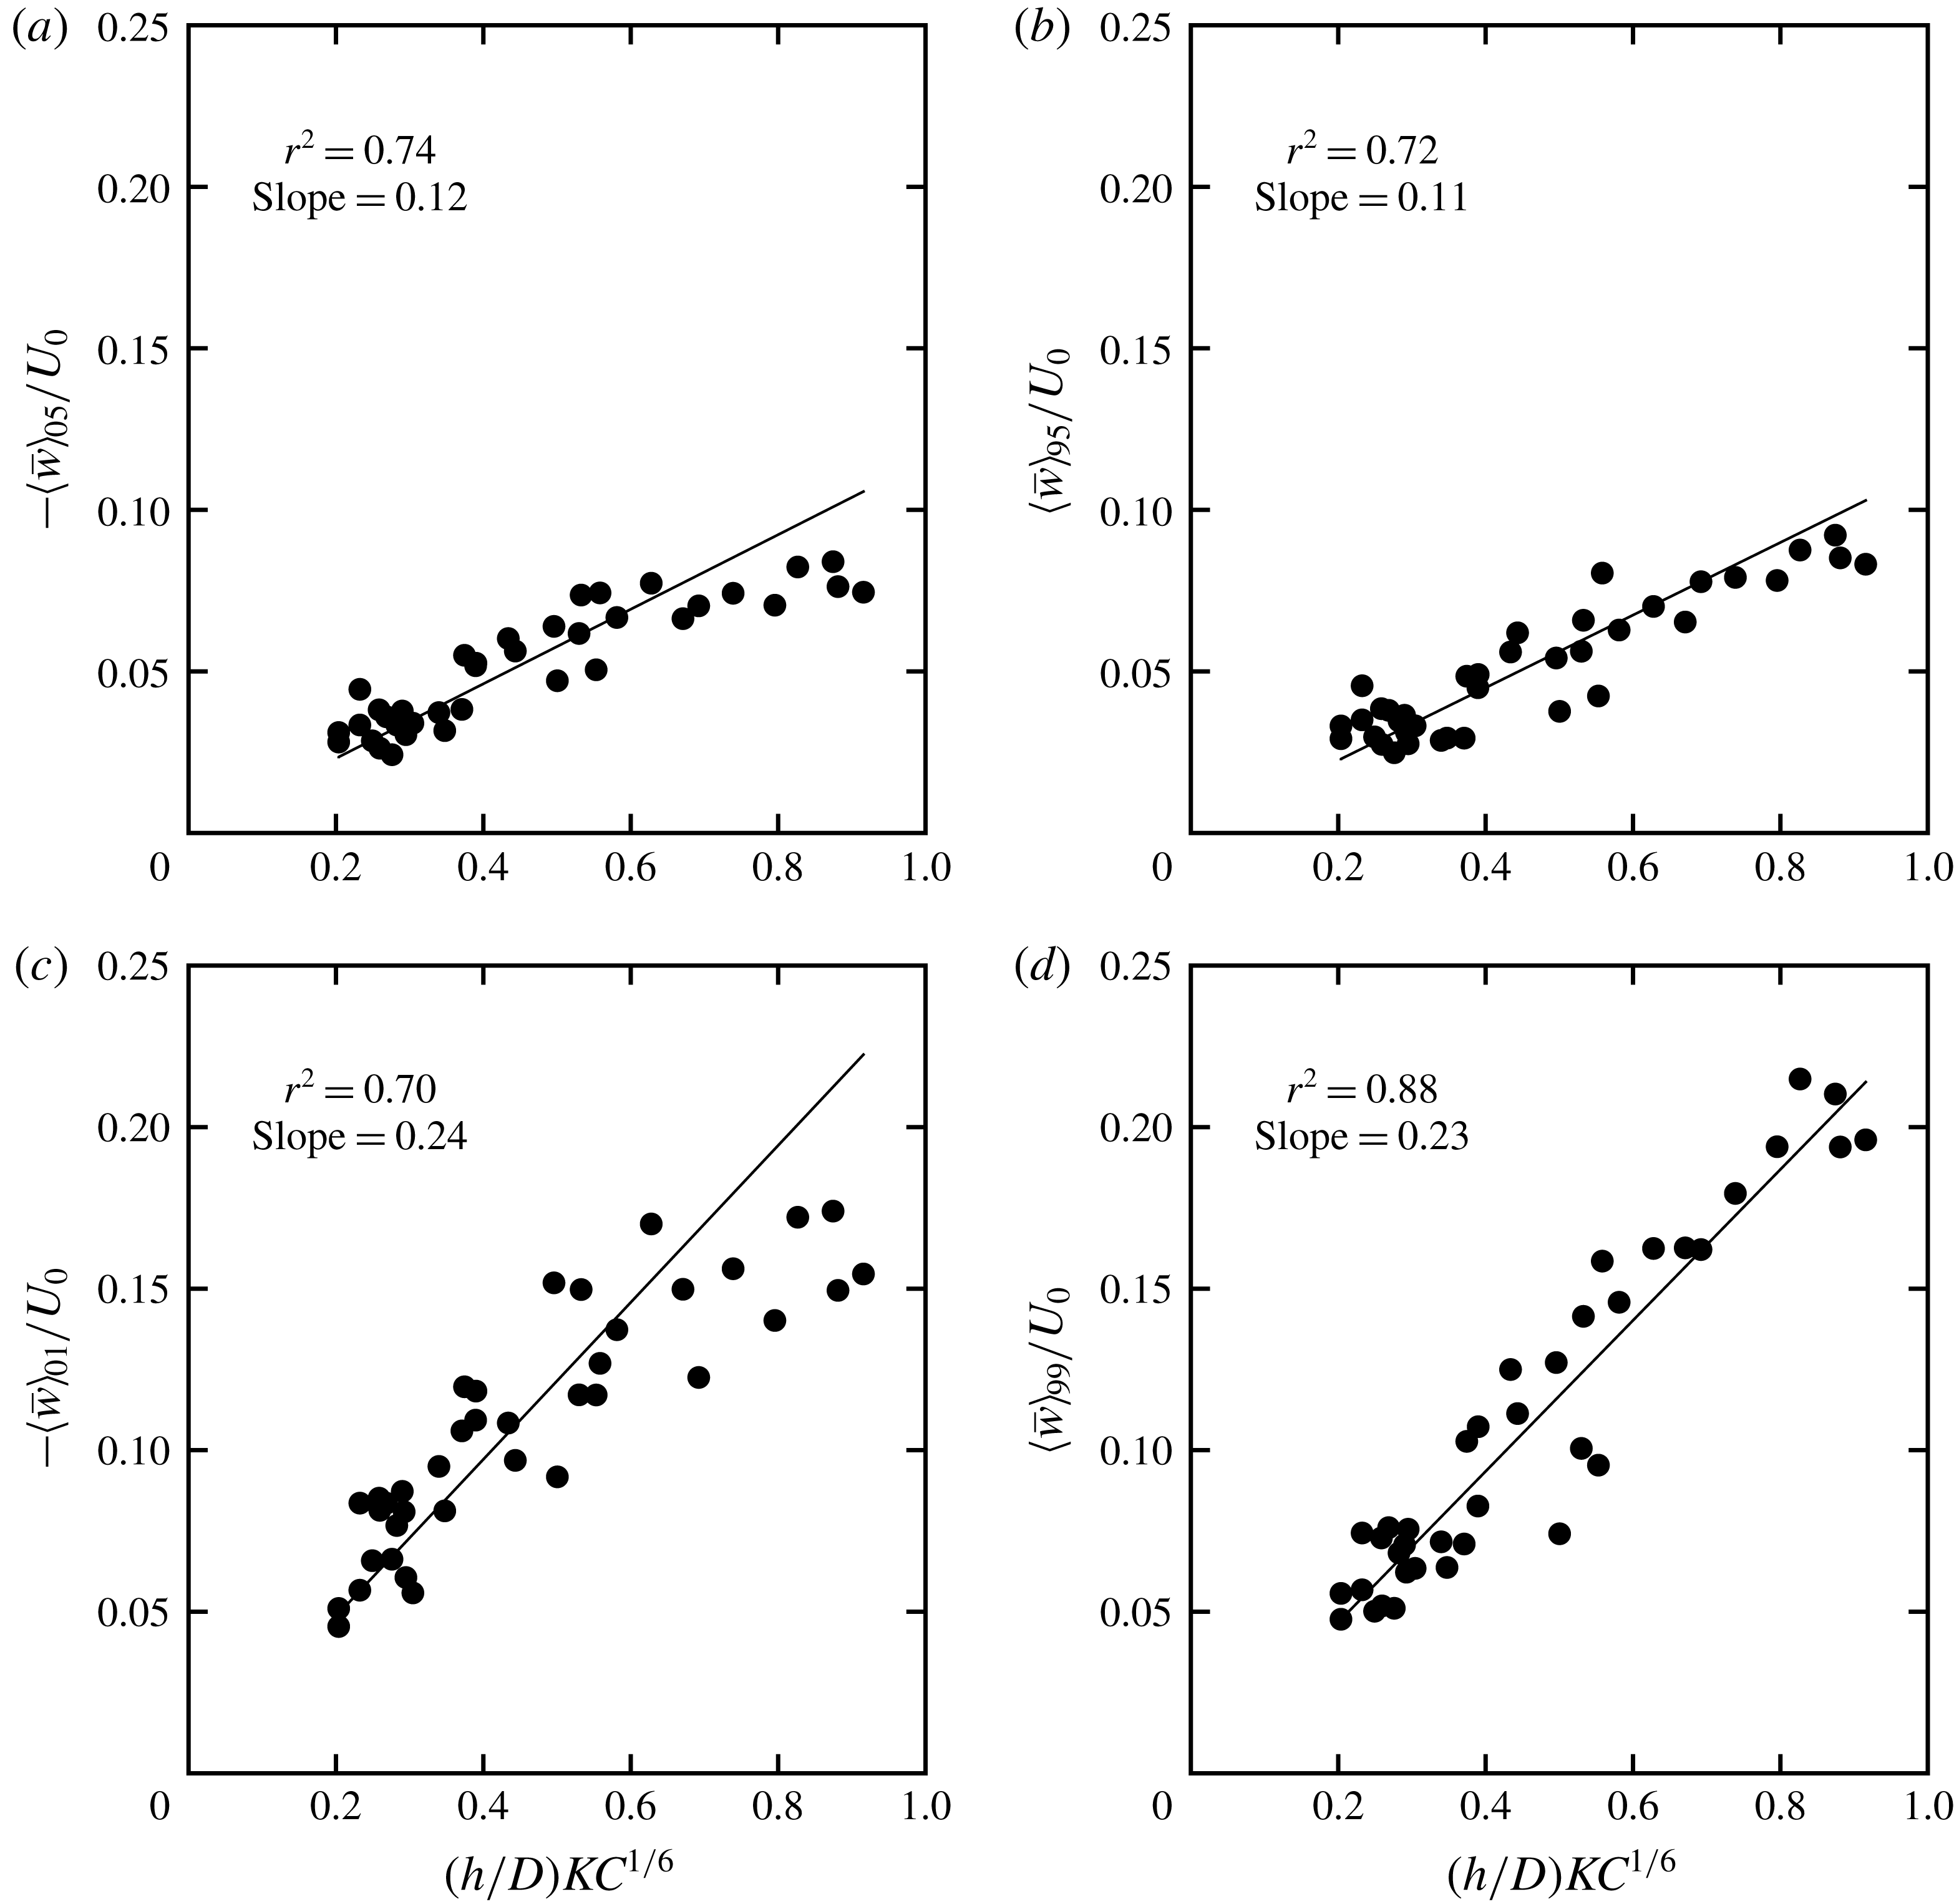
, a second-order influence on the scaling of the vertical velocity is suggested by a trend in the measured data away from the modelled line (figure 9). It is possible to examine skewness in the distribution of vertical velocity by examining the scaling of the peaks in the up- and downwelling velocity (which will have a strong influence on the r.m.s.). The vertical velocity scaling relationship given in (4.7) is robust for the peaks in the up- and downwelling velocity (figure 10). The distribution between up- and downwelling is reasonably symmetric, as indicated by the similar slope for the first, and ninety-ninth percentiles (
 ${\approx}0.24$
) and, the fifth and ninety-fifth percentiles (
 ${\approx}0.12$
). The deviation with increasing
 $(h/D)KC^{1/6}\gtrsim 0.6$
is greatest for the peaks in downwelling and not present for the peaks in upwelling. The dominant region of upwelling is in the centre of the primary wake eddies, where rotation is greatest. Downwelling tends to be associated with secondary vortices, in zones of flow convergence, strain and vortex stretching. The dynamics of the downwelling regions is most significantly influenced by the reduced flow stability associated with increasing relative tidal excursion. If the magnitude of the peaks in downward flux are reduced compared to upward flux, the integrated area of downward flux must also be larger (by conservation of mass).
Scaling relationships for the (a) fifth (downwelling) and (b) ninety-fifth percentile (upwelling) velocities and (c) first (downwelling) and (d) ninety-ninth percentile (upwelling) velocities. The black line represents the model estimate with the indicated slope.

5 Discussion
Vortex shedding is a mechanism by which wake eddy circulation is released from the low-pressure wake bubble region. Prior to the onset of vortex shedding we would expect the magnitude of the return flow
 $U_{m}$
to be a maximum when the tidal period
 $T$
is close to the time scale for a wake eddy to complete a revolution (i.e. through a resonance-like mechanism). Taking
 $U_{e}=0.22U_{0}\unicode[STIX]{x1D6FF}^{+(-2/3)}$
(assuming again that
 $U_{e}\sim \langle \overline{v}\rangle _{rms}$
), the upwelling velocity
 $w_{E}=\sqrt{2\unicode[STIX]{x1D708}\unicode[STIX]{x1D714}_{e}}=0.09U_{0}(h/D)KC^{1/6}$
, and the eddy azimuthal frequency
 $\unicode[STIX]{x1D714}_{e}=U_{e}/L_{e}$
with
 $L_{e}=c_{L}DS^{4/3}$
where
 $c_{L}$
is a constant, give
 $c_{L}\approx 1.76$
. The implied time for a wake eddy to complete a revolution is
 $T_{e}=2\unicode[STIX]{x03C0}L_{e}/U_{e}$
from which we can calculate the relative length of the tidal period to the eddy revolution time as
 $T^{\ast }=T/T_{e}$
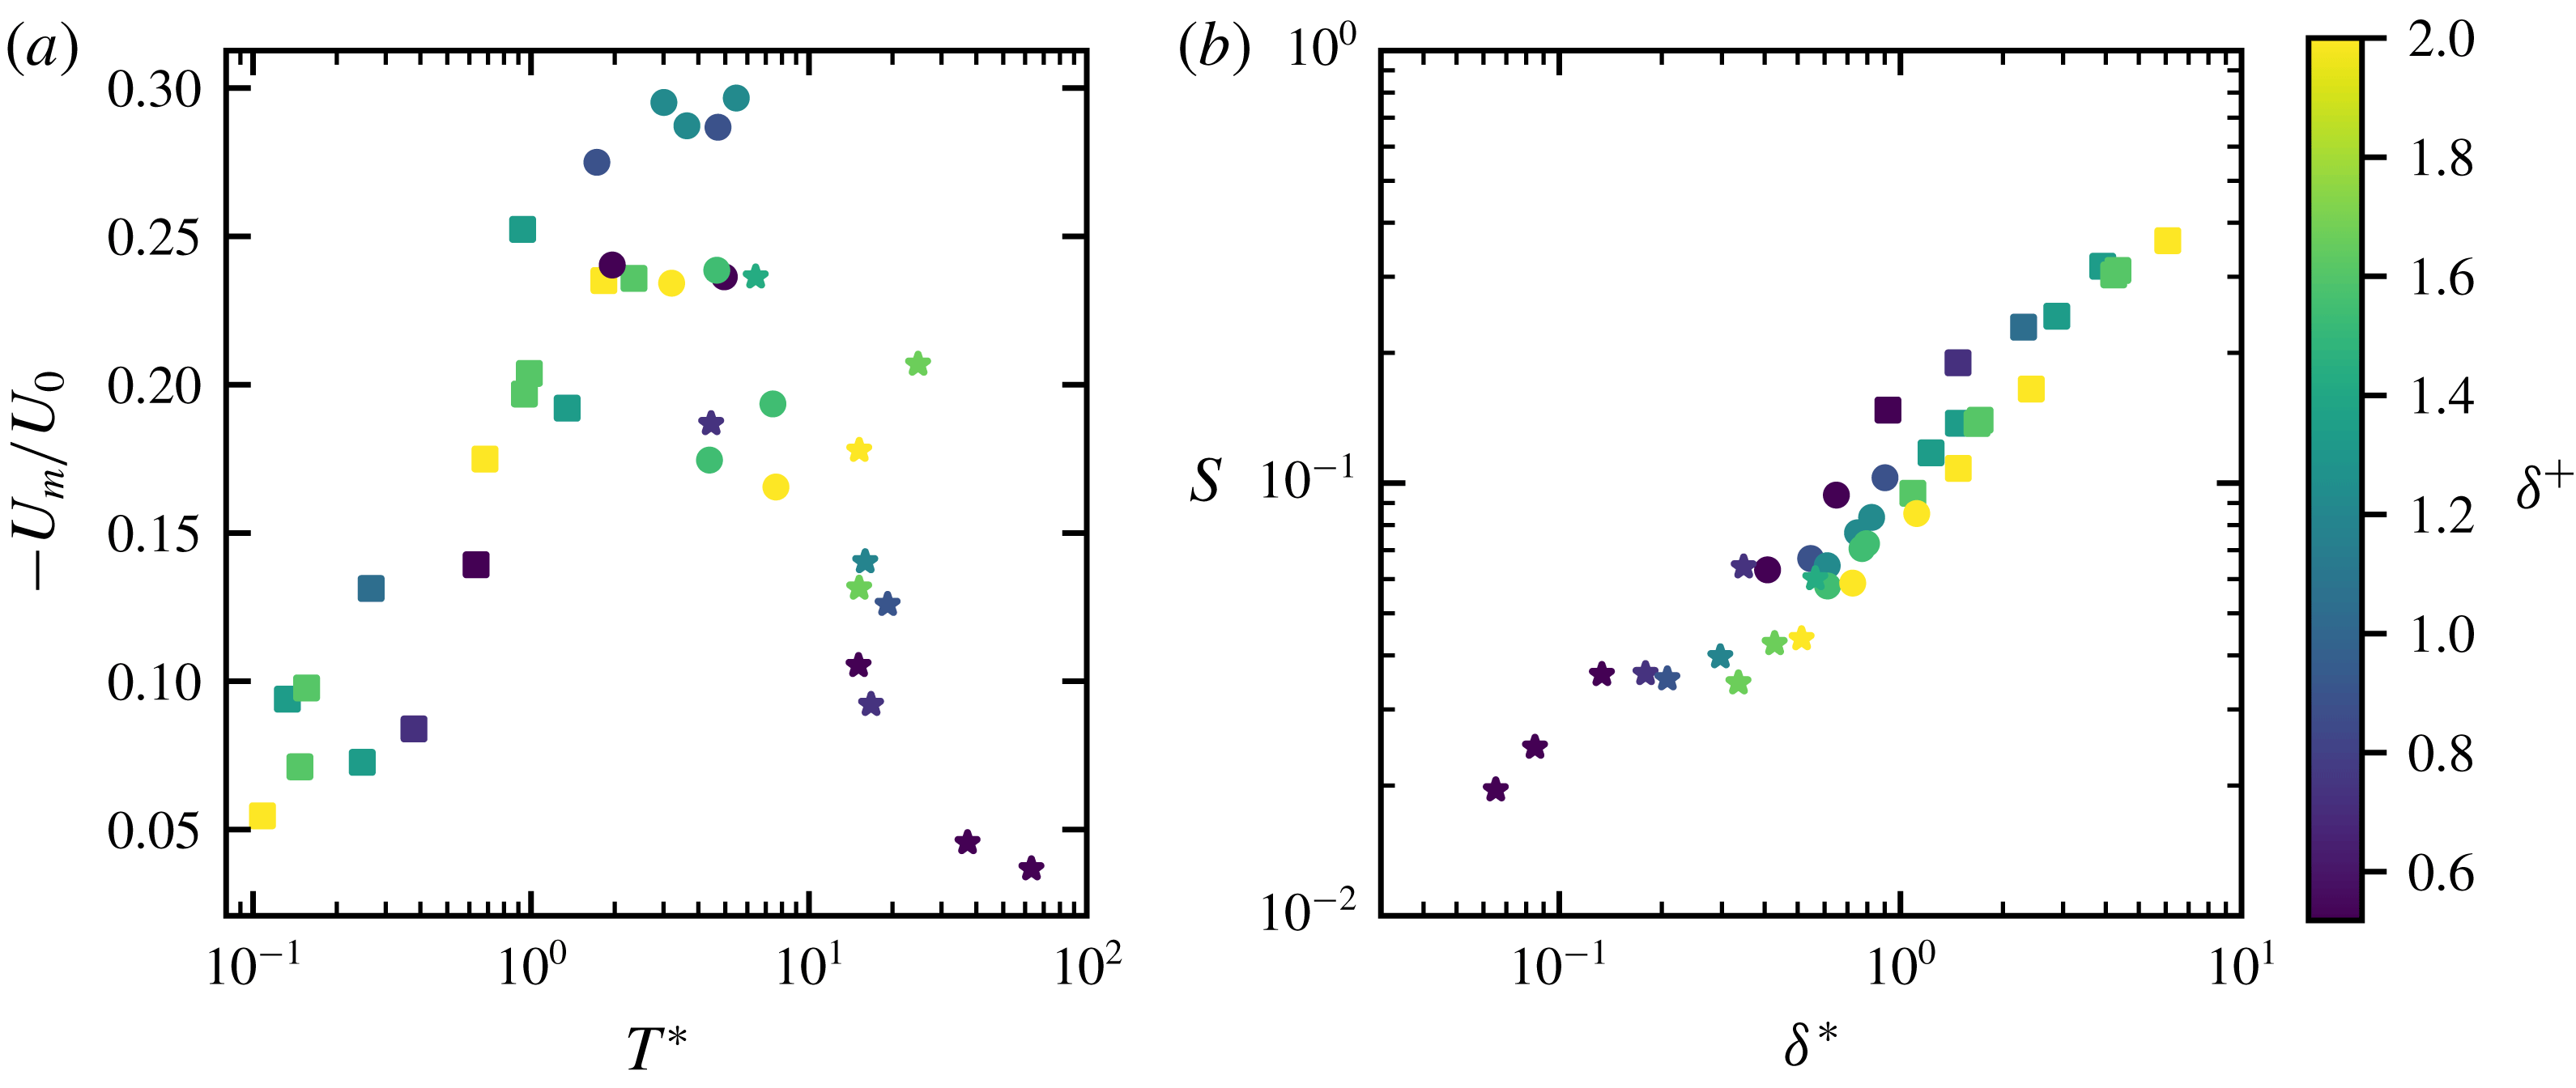
. The magnitude of the return flow (averaged for
 $0.0<\unicode[STIX]{x1D719}<0.5$
as per figure 8
a) increases as
 $T^{\ast }$
increases to 1 (figure 11
a). A transition in wake form, to the unsteady bubble wake, occurs for
 $T^{\ast }\approx 2$
. This stands to reason given the wake eddies are generated for each half-cycle of the tide. Finally, vortex shedding commences for
 $T^{\ast }\gtrsim 7$
, demonstrating that
 $T\ast$
in shallow flow is analogous to
 $KC$
in unbounded oscillatory flow.
(a) Variation of maximum wake return flow
 $-U_{m}/U_{0}$
with the relative eddy revolution time scale
 $T^{\ast }$
(for
 $U_{m}$
averaged over the phase interval
 $0.0<\unicode[STIX]{x1D719}<0.5$
) and (b) the wake stability parameter
 $S$
with the relative Ekman boundary layer thickness
 $\unicode[STIX]{x1D6FF}^{\ast }$
. Symbols indicate the wake forms as per figure 4 and colour indicates the value of
 $\unicode[STIX]{x1D6FF}^{+}$
. Transitions in the wake dynamics (indicated by the return flow) and wake form are predicted well by the implied eddy scales calculated from a model of wake upwelling driven by Ekman pumping.

It is also possible to examine the implied relative length scale of the Ekman boundary layer compared to the flow depth. Taking
 $\unicode[STIX]{x1D6FF}_{E}=\sqrt{2\unicode[STIX]{x1D708}/\unicode[STIX]{x1D714}_{e}}$
, with the relative Ekman boundary layer thickness given as
 $\unicode[STIX]{x1D6FF}^{\ast }=2\unicode[STIX]{x03C0}\unicode[STIX]{x1D6FF}_{E}/h$
, we see that
 $S$
in fact predicts the first-order change in relative Ekman boundary layer thickness (figure 11
b). At
 $S=0.1$
,
 $\unicode[STIX]{x1D6FF}^{\ast }=1$
which once again marks the transition to the UB wake. For
 $\unicode[STIX]{x1D6FF}^{\ast }\lesssim 0.5$
vortex shedding commences. The second order effect of
 $\unicode[STIX]{x1D6FF}^{+}$
on the wake stability is also nicely demonstrated. For fixed
 $S$
, increasing
 $\unicode[STIX]{x1D6FF}^{+}$
increases the Ekman boundary layer thickness (with the converse true for
 $KC$
by definition – see (2.3)). This explains the variation in wake character shown in figure 6 for fixed values of
 $S$
. When the relative Ekman boundary layer is smaller (for given
 $S$
), greater asymmetry is observed in the wake.
Importantly, these results support a model of island wake upwelling driven by Ekman pumping. It highlights that the global wake stability is intimately linked to the evolution of the wake eddies. The wake eddies grow, entraining the vertical structure of the external tidal flow across the separation shear layers at the island flanks. Disturbances introduced into the wake (sourced likely from the separated shear layers) are insufficiently damped when the eddy revolution time scale is shorter than the tidal period and the Ekman boundary layer thickness is smaller than the flow depth. This leads to growing asymmetry in the wake, with an increasingly strong return flow jet that is strongest during the decelerating stage of the tide. The return flow jet leads to earlier flow separation and a jet at the island flanks in the subsequent cycle. These jets, present at the island flanks during flow reversal, were observed to eject circulation away from the island. This appeared to be part of the mechanism by which the establishment of vortex shedding was suppressed for the unsteady bubble wakes that were close to vortex shedding. The wake (and shear layer separation) is convectively unstable, however excitation of a global mode of vortex shedding has not occurred. These intricate details of the half-cycle interactions for incipient vortex shedding is an interesting area of further research.
Vortex shedding commences if the wake eddies are able to attain sufficient circulation during the accelerating phase of the tide. This is indicated by the strength of the return flow established during the accelerating stage of the tide. At the transition to vortex shedding, one of the wake eddies attains sufficient circulation (and associated low pressure) to steer the return flow preferentially around a particular flank of the island. The return flow, in turn, causes the larger eddy to convect away from the island during flow reversal, releasing the circulation from the island wake generation zone. Close to the transition to vortex shedding this process may not occur every cycle. A lower-frequency beat-like modulation was observed for cases close to vortex shedding, where an eddy may be shed every few cycles.
The experiments of this study were at lower
 $Re$
(and thus smaller
 $\unicode[STIX]{x1D6FD}=Re/KC$
) than those of Lloyd et al. (Reference Lloyd, Stansby and Chen2001). For a given combination of
 $KC$
and
 $\unicode[STIX]{x1D6FF}^{+}$
(that establish
 $S$
) it is expected that
 $\unicode[STIX]{x1D6FD}$
will have an influence by altering the entrainment across the lateral shear layers that extend from the island flanks. We investigated the sensitivity of the wake return flow to
 $\unicode[STIX]{x1D6FD}$
for
 $\unicode[STIX]{x1D6FF}^{+}\gtrsim 1.4$
and found minimal influence with an increase of
 $\unicode[STIX]{x1D6FD}$
from 85 to 190. It is possible that the conflicting wake classifications (between this study and Lloyd et al.
Reference Lloyd, Stansby and Chen2001) at the transitions between wake forms are due to some sensitivity to
 $\unicode[STIX]{x1D6FD}$
(see figure 4). The independent influence of
 $\unicode[STIX]{x1D6FD}$
is an area for future work.
6 Application of laboratory results to island wakes
The knowledge gained from the laboratory study gives insight into expected behaviour in the field and, in particular, can be used to design field measurement and observation programs. The laboratory results identified the parameters that govern island wakes in tidal flow:
 $h/D$
,
 $KC$
and
 $\unicode[STIX]{x1D6FF}^{+}$
(with the wake stability parameter
 $S$
dependent on the ratio of
 $\unicode[STIX]{x1D6FF}^{+}$
and
 $KC$
). The aspect ratio
 $h/D$
and the Keulegan–Carpenter number
 $KC$
can be estimated from bathymetric survey, field measurements and knowledge of the local tidal characteristics. In the laboratory the forcing flow was laminar (with molecular viscosity); in the field the vertical eddy viscosity (over the thickness of the boundary layer) of momentum
 $\unicode[STIX]{x1D708}_{T}$
is needed to determine the maximum bottom boundary layer thickness, which is in turn required to calculate
 $\unicode[STIX]{x1D6FF}^{+}$
.
The vertical transfer of momentum is given by
 $\unicode[STIX]{x1D70F}=\unicode[STIX]{x1D70C}\unicode[STIX]{x1D708}_{T}\unicode[STIX]{x2202}\overline{u}/\unicode[STIX]{x2202}\overline{z}$
, where
 $\unicode[STIX]{x1D70F}$
is the total stress, and
 $\unicode[STIX]{x1D70C}$
the fluid density. When the flow is steady and shallow, with a logarithmic boundary layer that extends over the fluid depth,
 $\unicode[STIX]{x1D708}_{T}\sim u_{\ast }h$
where
 $u_{\ast }=\sqrt{\unicode[STIX]{x1D70F}_{b}/\unicode[STIX]{x1D70C}}$
is the shear velocity (Fischer Reference Fischer1973). When the flow is unsteady and deep, the transfer of momentum to the bed occurs across a turbulent bottom boundary layer with a characteristic length scale given by
 $\unicode[STIX]{x1D6FF}\sim u_{\ast }/\unicode[STIX]{x1D714}$
(Soulsby Reference Soulsby and Johns1983) and hence
 $\unicode[STIX]{x1D708}_{T}\sim u_{\ast }\unicode[STIX]{x1D6FF}$
(see, e.g. Jensen, Sumer & Fredsøe (Reference Jensen, Sumer and Fredsøe1989) and Cushman-Roisin & Beckers (Reference Cushman-Roisin and Beckers2011)). It is the transition from
 $\unicode[STIX]{x1D708}_{T}\sim u_{\ast }\unicode[STIX]{x1D6FF}$
to
 $\unicode[STIX]{x1D708}_{T}\sim u_{\ast }h$
with decreasing flow depth which must be resolved for tidal flows on continental shelves and warrants further investigation, particularly when
 $\unicode[STIX]{x1D6FF}\approx h$
. When
 $\unicode[STIX]{x1D6FF}\approx h$
the length scale of the largest eddy that transports momentum vertically will be influenced by both the flow depth and tidal period. To allow estimation of
 $\unicode[STIX]{x1D6FF}^{+}$
, it is clear that future field data collection exercises must seek to measure both the vertical structure of the mean horizontal velocity and turbulent stress of the incoming tidal flow. In addition, measurements of the vertical structure of the horizontal velocity, and turbulent stress in the wake return flow, will assist in evaluating the structure of the wake eddies and influence of tidal flow unsteadiness. By way of example, we consider two field sites where island wakes have been observed.
6.1 Observations of Rattray Island, Australian Great Barrier Reef
It is informative to evaluate the results of this study against field observations of island wakes in tidal flow. In this context, Rattray Island in the Australian Great Barrier Reef is one of the best studied, with detailed field observations presented in Wolanski et al. (Reference Wolanski, Imberger and Heron1984) and additional analyses in Wolanski et al. (Reference Wolanski, Asaeda, Tanaka and Deleersnijder1996, Reference Wolanski, Brinkman, Spagnol, McAllister, Steinberg, Skirving, Deleersnijder and Lakhan2003).
Wolanski et al. (Reference Wolanski, Asaeda, Tanaka and Deleersnijder1996) estimated an upwelling velocity of
 $0.002{-}0.004~\text{m}~\text{s}^{-1}$
based on the time it takes suspended mud to reach the surface in an eddy. The semi-diurnal tidal velocity during the study of Rattray Island was reported as
 $0.7~\text{m}~\text{s}^{-1}$
, with an island size of 1500 m. This gives
 $KC\approx 20$
. The scaling laws presented in figures 9 and 10 give a predicted r.m.s. and peak (95th percentile) upwelling velocity of 0.002 and
 $0.003~\text{m}~\text{s}^{-1}$
, respectively, in good agreement with field estimates.
In terms of the return flow, Wolanski et al. (Reference Wolanski, Brinkman, Spagnol, McAllister, Steinberg, Skirving, Deleersnijder and Lakhan2003) reported that the maximum velocity in the wake eddy at Rattray island was
 $0.5{-}0.75U_{0}$
occurring approximately 1 hour after peak tidal flow (Wolanski et al.
Reference Wolanski, Asaeda, Tanaka and Deleersnijder1996). Previous laboratory investigations of shallow island wakes in a steady external flow have reported an upper limit on the maximum return flow velocity of approximately
 $0.35U_{0}$
for unsteady bubble wakes (Chen & Jirka Reference Chen and Jirka1995; Wolanski et al.
Reference Wolanski, Asaeda, Tanaka and Deleersnijder1996). In this study, consistent with the field observations, a maximum return flow of
 $0.5{-}0.75U_{0}$
occurred after peak tidal flow for unsteady bubble wakes with
 $S\approx 0.1$
(figure 8). Wolanski et al. (Reference Wolanski, Imberger and Heron1984) assumed a quadratic bottom friction coefficient of
 $c_{f}=2.5\times 10^{3}$
, which from
 $u_{\ast }=\sqrt{c_{f}/2}U_{0}$
gives a friction velocity of
 $u_{\ast }=2.5\times 10^{-2}~\text{m}~\text{s}^{-1}$
. Assuming that
 $\unicode[STIX]{x1D6FF}=Cu_{\ast }/\unicode[STIX]{x1D714}$
, where
 $C=0.4$
is an empirically derived coefficent that depends on the vertical distribution of
 $\unicode[STIX]{x1D708}_{T}$
over the boundary layer thickness (see Soulsby Reference Soulsby and Johns1983, Cushman-Roisin & Beckers Reference Cushman-Roisin and Beckers2011), gives
 $\unicode[STIX]{x1D6FF}/h\approx 2.7$
and
 $S\approx 0.14$
, which is reasonably consistent with the observed magnitude of the return flow. This magnitude of return flow occurs due to the adverse external pressure gradient present after peak tidal flow and highlights the importance of incorporating flow unsteadiness in the study of shallow island wakes subjected to tidal forcing.
Wolanski et al. (Reference Wolanski, Imberger and Heron1984) estimated the turbulent horizontal eddy viscosity of the flow around Rattray Island as
 $O(1~\text{m}^{2}~\text{s}^{-1})$
by releasing groups of surface floating drogues. This suggests a Reynolds number (using the eddy viscosity) of
 $O(1000)$
and
 $\unicode[STIX]{x1D6FD}=Re/KC$
of
 $O(100)$
. This indicates that the values of
 $\unicode[STIX]{x1D6FD}$
achieved in this laboratory study (50–200) are comparable to the field range when an appropriate turbulent horizontal eddy viscosity is utilised (noting that the turbulent eddy viscosity is a function of the flow and will vary in space and time).
6.2 Observations of the wakes of islands in the Kimberley region of north western Australia
The laboratory experiments in this paper were undertaken with cylindrical islands that have vertical side walls. In the Kimberley region of north western Australia, the islands can have very steep sides due to the geomorphology of the region. In addition, the tidal range is very large,
 $O(10~\text{m})$
, with tidal currents that may exceed
 $2~\text{m}~\text{s}^{-1}$
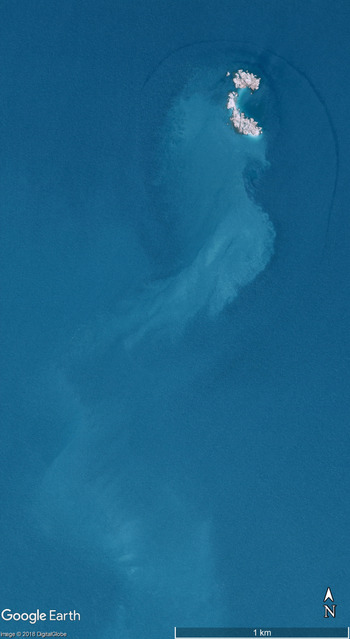
(Creswell & Badcock Reference Creswell and Badcock2000). During field data collection in the Kimberley region, large free surface perturbations associated with tidal eddies were observed (by the author), suggesting that non-hydrostatic processes may also be relevant at field scales when extreme tidal forcing is present. Remote sensing images also support this. Figure 12 shows a vortex shedding wake in the Kimberley region of Western Australia. The arc that outlines the northern side of the island indicates a sub-surface flow structure that is influencing the free surface (suggestive of the presence of a horseshoe vortex). This island is approximately 300 m in diameter with tidal currents assumed to be
 $2~\text{m}~\text{s}^{-1}$
with an estimate of
 $KC\approx 300$
. A recently developed bathymetric grid for northern Australia indicates that the island is present in water approximately 20 m depth. Assuming a quadratic bottom friction coefficient of
 $c_{f}\approx 2.5\times 10^{3}$
gives
 $u_{\ast }\approx 0.07~\text{m}~\text{s}^{-1}$
and
 $\unicode[STIX]{x1D6FF}\approx 200~\text{m}$
resulting in an estimate of
 $S\approx 0.03$
, suggesting an extensive vortex shedding wake which is consistent with figure 12. Remote sensing offers significant opportunities for the further study of shallow island wakes, with a recent study demonstrating the use of along track stereo images from the WorldView-3 satellite to obtain surface velocity measurements (Delandmeter et al.
Reference Delandmeter, Lambrechts, Marmorino, Legat, Wolanski, Remacle, Chen and Deleersnijder2017).
Satellite photo of an island in the Kimberley Region (
 $14.46\,^{\circ }\text{S}$
,
 $125.32\,^{\circ }\text{E}$
) on 19 March 2003 showing a vortex shedding wake. The darker arc indicates a region where the sub-surface flow is influencing the free surface roughness. From Google Earth with image © 2018 DigitalGlobe.

7 Conclusion
Three classes of wake form have been identified in the tidally forced, shallow island wake: (i) steady bubble, (ii) unsteady bubble and (iii) vortex shedding. The two parameters
 $KC$
and
 $\unicode[STIX]{x1D6FF}^{+}$
combine to establish the island wake stability
 $S$
for shallow tidal flow. The unsteady bubble wake is observed for
 $S\lesssim 0.1$
with the onset of the vortex shedding wake for
 $S\lesssim 0.06$
. The unsteady tidal flow establishes two distinct phases in the evolution of the shallow island wake, the accelerating stage, prior to peak tidal flow, and the decelerating stage where the external pressure gradient is adverse. Vortex shedding is only observed if a return flow region of sufficient size and strength is established during the accelerating stage.
Through the novel experimental technique applied in this study, the three-dimensional flow field of the unsteady, shallow island wake has been resolved. A model of wake upwelling based on Ekman pumping from the bottom boundary layer is established. Lateral (cross-stream) velocity in the wake scales primarily with
 $U_{0}(\unicode[STIX]{x1D6FF}^{+})^{-2/3}$
and is demonstrated to be an effective proxy for the wake eddy azimuthal velocity. Vertical velocity scales with
 $U_{0}(h/D)KC^{1/6}$
across a range of statistical measures of the mean and peak up- and downwelling velocity. Deviation from the scaling relationships is observed for
 $(h/D)KC^{1/6}\gtrsim 0.6$
, which is primarily associated with a reduction in the peak downwelling velocities. To lowest order, the upwelling magnitude is independent of the wake form, with the wake form primarily influencing the spatial distribution of the up- and downwelling regions relative to the island. The simple Ekman pumping model predicts the vertical transport for wake forms that have significantly different topologies of primary and secondary vortices.
Finally, an intrinsic link is demonstrated between the implied dynamical scales of the wake eddies (predicted by the Ekman pumping model) and the wake stability. The wake return flow is strongest when the time scale of wake eddy revolution is of the same order as the tidal period. The stability parameter
 $S$
predicts the relative thickness of the Ekman boundary layer to flow depth, with a secondary dependence on the relative value of
 $\unicode[STIX]{x1D6FF}^{+}$
and
 $KC$
.
Acknowledgements
This research was funded by the Australian Research Council (Discovery Project DP1095294). This work was supported by resources provided by The Pawsey Supercomputing Centre with funding from the Australian Government and the Government of Western Australia. E.J.H. acknowledges a Gledden Visiting Fellowship during his stay at The University of Western Australia. The authors wish to thank M. E. Negretti for helpful comments and suggestions on a first draft of the paper.
Supplementary material
Supplementary material is available at https://doi.org/10.1017/jfm.2019.441.