I. INTRODUCTION
Among the nitrides of iron (Fe), cobalt (Co) and nickel (Ni), the iron nitrides have attracted by far the largest scientific interest due to a myriad of already realized and potential, future applications, e.g., as hardReference Davis, Davidson, Lampman, Zorc, Daquila, Ronke and Henniger1 and ferromagneticReference Andriamandroso, Demazeau, Pouchard and Hagenmuller2 materials. Relatively little information is available on nickel and cobalt nitrides. In any case, as already apparent from the earliest preparative studies by Juza,Reference Juza and Sachsze3, Reference Juza and Sachsze4 the nickel and cobalt nitrides are less stable than the iron nitrides, and consequently more difficult to synthesize. This is indicated by the relatively narrow parameter windows for temperature and gas-phase composition pertaining to the gas treatments for preparation of pure nickel and cobalt nitride (powder) specimensReference Juza and Sachsze3, Reference Juza and Sachsze4; in particular application of very high NH3 contents in the atmosphere is necessary.
In recent years, research on nickel nitrides has been devoted to the development of various “chemical” preparation methods, especially for Ni3N.Reference Leineweber, Jacobs and Hull5–Reference Guillaume, Morniroli, Frost and Serghiou10 The production of thin nickel-nitride layers by deposition techniques, in particular by reactive sputtering and investigation of these layers has been considered as well.Reference Dorman and Sikkens11–Reference Popovic, Bogdanov, Goncic, Strbac and Rakocevic15 Notwithstanding this intense research activity, lack of fundamental knowledge on the intrinsic properties of the Ni-N system and the associated nitrides is evident. In particular, phase-diagram information is scarceReference Wriedt16; a calculation of phase diagram (CALPHAD) assessment thereof has only been possible on the basis of estimation of many important thermodynamic quantities.Reference Fernandez Guillermet and Frisk17 The available knowledge on the Ni-N system can be summarized as follows: the existence of the following Ni-N phases has been shownReference Wriedt16: Ni4N-I and Ni4N-II (both with Ni face-centered cubic (fcc); different ordering types of NReference Terao and Berghezan18–Reference Nagakura, Otsuka and Hirotsu20), Ni3N (Ni hexagonal close packed (hcp); ordered insertion of NReference Terao and Berghezan18–Reference Nagakura, Otsuka and Hirotsu20) and Ni2N (Ni: fcc; ordered insertion of NReference Dorman and Sikkens11). Ni3N produced by various chemical methods appears to have a very narrow composition range of around 25 at. % N, as suggested by a very small lattice-parameter range.Reference Leineweber, Jacobs and Hull5 In the case of Ni3N prepared by sputtering techniques, a much wider lattice-parameter range has been observed (e.g.,Reference Vempaire, Fettar, Ortega, Pierre, Miraglia, Sulpice, Pelletier, Hlil and Fruchart13, Reference Vempaire, Miraglia, Pelletier, Fruchart, Hlil, Ortega, Sulpice and Fettar14; but see comments in Sec. III. D of this paper).
The nickel nitrides (as the nitrides of Fe and Co) are unstable with respect to decomposition under formation of N2 at  ≤ 1 atm. Only at very high N2 pressures as recently achieved in heated diamond anvil cells (applied pressure P ≥ 10 GPa) Ni3N was directly produced from the elements.Reference Hasegawa and Yagi7, Reference Guillaume, Morniroli, Frost and Serghiou10 Instead of using N2, by using NH3/H2 gas mixtures (e.g., at 1 atm), very high virtual partial pressures of N2 can be applied. On this basis Ni3N can be produced starting from Ni metal and applying NH3-containing atmospheres.Reference Juza and Sachsze3 The nitrogen activity provided by a NH3/H2 mixture is at a given temperature proportional to the so-called nitriding potential r NReference Lehrer21, Reference Mittemeijer and Somers22:

For example, at 400 °C, an atmosphere having partial pressures of  , i.e., r N = 1.41 atm−1/2, provides a virtual N2 partial pressure of
 . Investigation of the equilibrium of a metal nitride of a given N content with an atmosphere of a given r N provides cardinal data for the thermodynamics behind a metal-nitrogen system. Such information has been made available for the Fe-N systemReference Lehrer21, Reference Mittemeijer and Somers22 and was the basis for the thermodynamic assessment of that system.Reference Kunze23, Reference Fernández Guillermet and Du24
The dearth of such fundamental knowledge on the Ni-N system provides the motivation for a systematic investigation of the nitriding behavior of nickel substratesusing NH3 + H2 gas mixtures. A preliminary account of some results has been given in a conference paper.Reference Leineweber, Lienert, Glock, Woehrle, Schaaf, Wilke and Mittemeijer25 In the present work, the preparation and properties of Ni3N layers thus produced on Ni plates is discussed. The stressed nature of the nitride layers is revealed by the lattice-strain data measured by x-ray diffraction. The corresponding interpretation of the state of strain and stress necessitated calculation of the single-crystal elastic constants of Ni3N by first-principles methods, which is also reported here.
II. EXPERIMENTAL AND THEORETICAL METHODS
A. Gaseous nitriding
Ni plates of 1 mm thickness (99.98 wt%, annealed, Goodfellow) were ground and polished prior to nitriding. Gaseous nitriding took place in a vertical quartz-tube furnace equipped with a water (flushed with N2) container for quenching. The specimen was suspended, using a quartz fiber, in the middle of the furnace, where the process temperature was controlled within ± 1 K. The gas atmosphere was composed of a mixture of ammonia (99.999 vol%, BASF) and hydrogen (99.999 vol%, Westfalen AG). The gas fluxes were controlled by mass-flow controllers such that an overall linear flow rate resulted of 8.1 mm/s (calculated for the gas volume at room temperature) through the quartz tube (diameter 28 mm). After the treatment time, the quartz wire was destroyed and the specimen fell into the above-mentioned water container, leading to quenching of the microstructure with its N content and phase distribution.
B. Specimen characterization
1. Microstructure characterization
The nitrided specimens were cut into pieces, which were used for different investigation techniques. For optical microscopy on metallographic cross sections some of these pieces were covered with an electrodeposited protective nickel layer and then embedded, ground and polished. Etching was conducted using a solution composed of 10 g CuSO4 · 5H2O, 50 mL HCl solution (37 mass%), 50 mL ethanol and 200 mL water. Optical microscopy was performed applying a Zeiss Axiophot microscope (Carl Zeiss AG, Oberkochen, Germany).
The layer thickness of the Ni3N layer of a given specimen was determined on the basis of six optical micrographs recorded with 1000-fold magnification at different locations of the polished cross section. The layer thickness was measured in each micrograph at 200 position along the specimen surface using the software analySIS.26 Values for the average layer thickness and its standard deviation were calculated from these 1200 thickness values.
Scanning electron microscopy (SEM) images from cross-sectioned specimens were recorded using a JSM 6400 (JEOL, Tokyo, Japan) apparatus. Electron backscatter diffraction (EBSD) patterns were recorded applying a Zeiss LEO 438 VP instrument (Carl Zeiss AG, Oberkochen, Germany) equipped with an EBSD system (TSL, EDAX, Inc., Mahwah, NJ). For the EBSD measurements, cross sections polished as described above were additionally polished using a colloidal silica suspension OPS (0.04 μm, Struers GmbH, Willich, Germany) for 5 min. The software OIM 4.5 was used for evaluation of the Kikuchi patterns.
2. X-ray diffraction and pattern decomposition
For phase identification x-ray diffractometry was conducted in Bragg-Brentano geometry in a Philips X’Pert MPD (PANalytical, Almelo, Netherlands) equipped with a Cu tube and a Johansson-type monochromator in the primary beam selecting the Kα1 component of the incident radiation (λα1 = 1.54056 Å). This setup implies that the diffraction vector is parallel to the surface normal of the specimen plate, i.e., the tilting angle amounts to ψ = 0.
For characterization of the state of macrostrain/macrostress of the Ni3N layers x-ray diffraction was performed using a PANalytical MRD (PANalytical, Almelo, Netherlands) equipped with a Eulerian cradle and using Cu Kα radiation (wavelengths λα1 = 1.54056 Å, λα2 = 1.54439 Å). The radiation from the point focus of the tube was converted by an x-ray lens into a quasi-parallel beam (divergence ≈ 0.3°). The diffracted beam passed a parallel plate collimator (0.27° acceptance angle) and a flat graphite monochromator before being detected by a gas proportional counter. To improve crystal statistics, the nitrided plates were placed on a specimen spinner with rotation axis coinciding with the specimen normal. Scans were recorded at tilt angles of ψ = 0, 20°, 40°, 60° and 80° with 20° ≤ 2θ ≤ 110°, covering nine well-separated reflections of Ni3N (and some further reflections of Ni, which were, however, not considered in detail in the present work). The reflection positions were  determined, for each ψ, by fitting with pseudo-Voigt functions using the TOPAS software.27
C. First principles calculation of single crystal elastic constants (SECs)
First-principles electronic structure calculations on hexagonal Ni3N (space group P6322) were performed using the projector-augmented wave methodReference Kresse and Joubert28 and the generalized gradient approximationReference Perdew, Burke and Ernzerhof29 as implemented in the VASP codeReference Kresse and Furthmüller30 by using a plane-wave energy cutoff of 520 eV and a reciprocal space k-point mesh of 15 × 15 × 15. By systematic variation of the crystallographic parameters the minimum-energy configuration of Ni3N was searched for. The same was then done for a series of different fixed unit-cell volumes around the minimum-energy volume to obtain data suitable for determining the bulk modulus by equations of state (EoS) fitting. The elastic constants pertaining to the minimum-energy configuration were determined by applying the stress versus strain methodReference Shang, Wang and Liu31 with a range of strains of ± 0.01, allowing for a given strained Ni3N structure for relaxation of the fractional coordinates; in these calculations reciprocal-space energy integration was performed using the Methfessel-Paxton technique,Reference Methfessel and Paxton32 followed by calculation of the stress by reciprocal-space integration using the tetrahedron method incorporating Blöchl corrections.Reference Blöchl, Jepsen and Andersen33 The stress-strain relationships obtained thus were used to calculate the elastic constants of Ni3N, in principle pertaining to a temperature of 0 K. More details regarding the calculations of elastic constants by first-principles can be found in e.g.Reference Shang, Wang and Liu31, Reference Nikolussi, Shang, Gressmann, Leineweber, Mittemeijer, Wang and Liu34–Reference Ganeshan, Shang, Wang and Liu36 Due to the possibly magnetically ordered nature of Ni3N, all first-principles calculations were performed with the spin-polarization approximation.
III. RESULTS AND DISCUSSION
A. SECs of Ni3N from first-principles calculations
The crystallographic parameters, the single crystal elastic constants (SECs), and the bulk moduli[from (i) SECs and (ii) fitting by the 4-parameter Birch-Murnaghan EoSReference Shang, Wang, Kim and Liu37 on the resulted energy versus volume data points] have been summarized in Table 1. The calculated crystallographic parameters of Ni3N agree well with the experimental data given in the footnote to Table 1.Reference Leineweber, Jacobs and Hull5 The two consistent values for the bulk modulus agree very well, indicating the consistency of the first-principles strain versus stress method with the strain versus volume method. The slightly smaller bulk modulus from the EoS is due to the relaxations of the cell shapes at each fixed volume, which are taken into account during the calculations used for determination of the EoS, whereas such shape changes are not considered upon calculating the bulk modulus from the SECs.Reference Shang, Wang and Liu31 In agreement with results from recent electronic structure calculations performed using other methods,Reference Vempaire, Fettar, Ortega, Pierre, Miraglia, Sulpice, Pelletier, Hlil and Fruchart13 according to the present calculations Ni3N has a magnetically non-ordered ground state, which is (also) in accordance with experimental data.Reference Vempaire, Fettar, Ortega, Pierre, Miraglia, Sulpice, Pelletier, Hlil and Fruchart13
Crystallographic parameters and SECs of hexagonal Ni3N, space group P6322, atomic sites Ni: xM, 0, 0, N: 1/3, 2/3, ¼.

a Bulk modulus estimated from Cij values.
b Bulk modulus predicted by 4-parameter Birch-Murnaghan EoS Reference Shang, Wang, Kim and Liu37 based on the first-principles calculated energy versus volume data points.
c Experimental values: a = 4.6224 Å, c = 4.3059 Å, and xM = 0.3279.Reference Leineweber, Jacobs and Hull5
Results from first-principles calculations, which further indicate that Ni3N is not magnetically ordered. The crystal structure data together with some details on the calculations have been deposited at Fachinformationszentrum Karlsruhe, d-76344 Eggenstein-Leopoldshafen (Germany) under the deposition number CSD-424084.
The elastic constants of Ni3N are very similar to those of ferromagnetic but otherwise isostructural ε-Fe3N.Reference Gressmann, Leineweber and Mittemeijer38 The elastic anisotropy contained in the SECs may be represented by the direction-dependence of the reciprocal Young’s modulus along the direction of a unit vector x, in the Cartesian crystal frame of reference

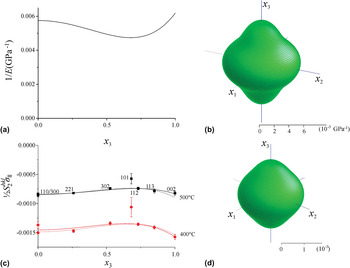
where Sij are the components of the 6 × 6 compliance matrix (the inverse of the Cij matrix of which the components have been listed in Table 1), and, where x 3 is the direction cosine of x with respect to the lattice vector c. Due to the hexagonal Laue-class symmetry of Ni3N, 1/E depends only on x 3. Hence, the direction-dependence of 1/E can be represented by plotting 1/E versus x 3; see Fig. 1(a). Moreover, the 1/E surface as function of x has been depicted in Fig. 1(b).
Comparison of (a and b) the direction-dependence in the crystal frame of reference of the reciprocal Young’s modulus of Ni3N with (c and d) the crystal-direction-dependences of the macrostress-induced macrostrain variation in the Ni3N layers (c and d). (a) Reciprocal Young’s modulus 1/E(x) as function of x 3 (direction cosine of the unit vector x with respect to the hexagonal c axis) and (b) 1/E(x) surface. (c) macrostrain variation (x being perpendicular to the hkl planes) as function of x 3. Values for were determined from the slopes of versus plots for specimens nitrided at 400 °C and 500 °C. The full lines shown represent fits to these data with according to Eq. (5), the dashed lines fits with according to Eq. (6). (d) surface obtained from the fit according to Eq. (5) for the specimen nitrided at 400 °C. The surfaces have been plotted using WinTensor.Reference Kaminsky39

As indicated by the small variation of 1/E with x 3, Ni3N exhibits only modest elastic anisotropy. Using a recently defined crystal-symmetry independent universal anisotropy index, A U,Reference Ranganathan and Ostoja-Starzewski40 one obtains A U = 0.13 from the Sij/Cij of Ni3N. This value for the hcp-based Ni3N is much closer to A U = 0, representing elastic isotropy, than e.g., the value of A U = 0.50 obtained from the Sij/Cij for the fcc-based interstitial compound γ′-Fe4N.Reference Gressmann, Wohlschlögel, Shang, Welzel, Leineweber, Mittemeijer and Liu41 A similar observation is made for pure metals: hcp metals are usually (at least those with c/a close to the ideal value of 1.633) elastically much less anisotropic than fcc metals, as demonstrated previouslyReference Ledbetter and Migliori42 using a different anisotropy measure and as confirmed using A U.Reference Ranganathan and Ostoja-Starzewski40 The lower elastic anisotropy of hcp metals as compared with fcc metals was attributed to a more homogeneous distribution of the orientations of the shortest metal-metal interatomic vectors in the hcp case.Reference Ledbetter and Migliori42, Reference Born and Huang43 This argument is also valid for Ni3N as compared with γ′-Fe4N, where Ni3N shows a more homogeneous orientation distribution of the shortest metal-metal and metal-nitrogen interatomic vectors.
B. Ni3N-layer formation
1. Microstructure of Ni3N compound layers
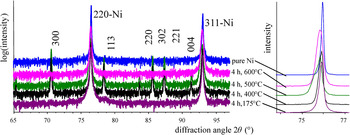
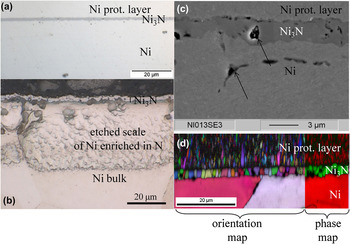
Nitriding of the Ni plates in pure NH3 for 4 h at 175 °C ≤ T ≤ 550 °C led to formation of Ni3N at the surface, as evidenced by x-ray powder diffraction, whereas this nitride did not develop upon similar treatment at 600 °C (Fig. 2). Light microscopy, SEM and EBSD investigation of cross sections of Ni plates thus nitrided at 300 °C ≤ T ≤ 550 °C reveal the presence of closed Ni3N layers (Fig. 3). Etching of the nitride layers turned out to be difficult, impeding characterization of their microstructure by light microscopy. EBSD analysis clearly reveals a columnar microstructure [Fig. 3(d)]. The EBSD analysis also shows that a specific crystallographic orientation relationship does not occur between the hexagonal Ni3N crystallites in the layer and the quite large fcc crystals of the Ni substrate.
X-ray diffraction patterns used for identification of phases formed at the surface of Ni plates by nitriding in pure NH3 at various temperatures. The ordinates have been scaled and shifted with respect to each other to facilitate comparison. hkl refer to Ni3N if not indicated otherwise. (a) Logarithmic intensity scale. The pattern recorded from the specimen nitrided at 175 °C shows a shoulder at the high-angles side of the Ni-220 reflection, which can be attributed to a 113 reflection pertaining to Ni3N. A 002 reflection of Ni3N occurring at about 42° (not shown) has been detected in this case, too. (b) Linear intensity scale with the enlarged 2θ scale in the range of the Ni-220 reflection showing the shift and/or broadening of this reflection towards lower 2θ angles indicative for lattice expansion due to incorporation of N in the solid solution Ni(N).

Cross-sectional images of Ni plates with Ni3N layers at the surface, produced by nitriding in pure NH3. Optical microscopy of specimens treated for (a) 4 h at 400 °C, as-polished, and (b) 4 h at 500 °C as-polished and afterwards etched with a Cu2+‐containing solution. The etching attacks a region in the Ni substrate adjacent to the Ni3N layer which is enriched with N. (c) Secondary-electron SEM image of a specimen treated for 16 h at 400 °C and (d) EBSD image of the same specimen with (left) each color representing a different crystallite orientation and with (right) each color representing a different phase.

Comparing the layers produced at 400 °C and 500 °C after nitriding for 4 h [see Figs. 3(a) and 3(b)] reveals a considerable porosity in the Ni3N layer for the specimen treated at 500 °C [arrow in Fig. 3(b)]. The origin of this porosity likely is formation of N2 inside the solid by decomposition of the metastable nitride,Reference Grabke, Strauss and Vogel44 which is a process known for much longer period in iron nitrides.Reference Prenosil45 As nitride decomposition and the associated pore formation is an irreversible process, even for a nitriding temperature of 400 °C, long-term nitrided specimens show significant porosity [Fig. 3(c), see arrows]. Pores can also form in the Ni(N) solid solution, as revealed by Fig. 3(c) (see arrow).
Upon nitriding at temperatures below 300 °C (175 °C and 250 °C) only very tiny amounts of Ni3N develop; see Fig. 2. Occurrence of the only visible reflections 002 and 113 suggests the presence of a 00l-like texture, in contrast with the largely untextured Ni3N layers produced at higher temperatures.
2. The nitriding potential at the Ni/Ni3N phase boundary
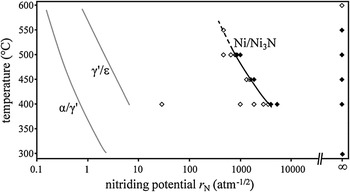
Nitriding in a pure NH3 atmosphere implies, in principle, imposition of the solid by an infinitely large nitriding potential [see Eq. (1)] and thus nitrogen activity,Reference Mittemeijer and Somers22 but see below. To apply well-defined values of r N, gas atmospheres corresponding to (100−n) % NH3 and n % H2 were used as well, keeping the overall gas flow constant (see Sec. II. A). Observing the formation or non-formation of a Ni3N surface layer after 4 h of nitriding as function of temperature (400 °C, 450 °C, 500 °C) and nitriding potential indicates the occurrence of a temperature-dependent threshold value of the nitriding potential, below which no Ni3N is formed, r N(Ni/Ni3N); see Fig. 4.
Formation (closed data points) and non formation (open data points) of Ni3N layers upon nitriding on Ni plates as function of the nitriding potential (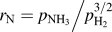 and the treatment temperature (4 h treatment time). The data for 400–500 °C were used to determine the threshold nitriding potential r N(Ni/Ni3N) required to form Ni3N. Extrapolation of r N(Ni/Ni3N) toward higher temperatures (dashed line) predicts Ni3N formation for some r N values, for which no Ni3N was observed in the present experiments. This is caused by NH3 decomposition in the gas phase according to Eq. (3), which increasingly takes place with increasing temperature. For comparison the threshold nitriding potentials for the α-Fe/γ′-Fe4N1-z and γ′-Fe4N1-z/ε-Fe3N1+x phase boundariesReference Mittemeijer and Somers22 have been indicated, too.

The phase boundaries r N(α/γ′) and r N(γ′/ε) of the so-called Lehrer diagram for the Fe-N systemReference Lehrer21 are shown as well in Fig. 4. The shapes of the T-r N relationships for the Fe-N and Ni-N systems appear to be similar. Clearly the boundary for formation of the “first” nitride phase after the solid solution occurs for the Fe-N system at much lower r N, and thus also at much lower chemical potentials of nitrogen, than for the Ni-N system. This is compatible with the general tendency of decreasing thermodynamic stability of the 3d-metal nitrides with increasing atomic number: Z Fe = 26 versus Z Ni = 28; see e.g.Reference Juza46 Reversely, going in the periodic table starting from iron to the left, i.e., to manganese (Z Mn = 25), the corresponding nitride phases (ζ and ε) can well be prepared from (manganese) metal and molecular N2 for  .Reference Gokcen47, Reference Leineweber, Jacobs and Kockelmann48 This is also the case for the 3d-metal nitrides of the metals of even lower atomic number.
Two effects may affect the experimentally determined location of the threshold r N(Ni/Ni3N):
(a) An incubation time larger than 4 h may occur for formation of a Ni3N layer so that Ni3N formation is not observed in the present experiments. However, experiments performed in the present project with varying treatment time indicate that the incubation time for formation of a Ni3N surface layer is negligible (see Sec. III. B. 3).
(b) Some of the thermodynamically driven decomposition of NH3 according to
(3)is expected to occur in the gas phase. This decomposition is catalyzed at the surface of the plate to be nitrided. As a result a stationary H2-partial pressure (depending on the flow rate in the quartz tube, see below) and thus a stationary r N occurs at the surface of the specimen, which is lower than that calculated on the basis of the gas fluxes provided by the mass-flow controllers, i.e., the values for r N as indicated in this work. In particular, for an initially pure NH3 atmosphere r N will not be truly infinitely large. As a consequence, the effect discussed explains that at 600 °C even for pure NH3 no Ni3N formation was observed. At 550 °C, moreover, Ni3N was formed only in pure NH3, but not in an atmosphere of an r N value a little larger than the value obtained by extrapolation of the boundary r N(Ni/Ni3N) determined for 400 °C-500 °C (compare Fig. 4).

A striking feature of the metallographic cross sections treated with the Cu2+-containing solution is the relatively strong etching of the substrate region underneath the Ni3N layer; see Fig. 3(b). This result suggests enrichment of the substrate by N in this region; i.e., formation of a Ni(N) terminal solid solution. Indeed, the x-ray diffraction patterns reveal for the reflections pertaining to fcc Ni considerable shifts and/or broadening toward lower 2θ angles (see Fig. 2). This indicates an increase of the lattice parameter of Ni close to the surface likely caused by interstitial dissolution of N (neglecting the possible effect induced by macrostresses in the corresponding region of the substrate). Similar etching and diffraction effects have been observed in the present project for nitrided Ni3N-layer-free specimens. Glow discharge optical emission spectrometry of nitrided Ni specimens including some of those used in the present study indicate that N contents well above 1.5 at.% can occurReference Leineweber, Lienert, Glock, Woehrle, Schaaf, Wilke and Mittemeijer25 in the Ni(N) solid solution scale as shown in Fig. 3(b). This is far more than indicated as possible in most previous works.Reference Wriedt16 Only a very early work suggested a similar order of magnitude for the nitrogen solid solubility.Reference Juza and Sachsze3
3. Ni3N layer-growth kinetics
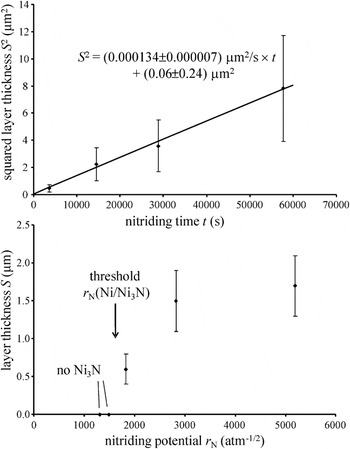
A parabolic time dependence of the thickness of the growing Ni3N layer on a Ni substrate using a pure NH3 atmosphere (r N = ∞) at 400 °C is demonstrated by the results shown in Fig. 5(a). The fitted straight line runs practically through the origin, indicating the absence of an early stage of layer growth with deviating growth kinetics, faster or slower than the same at the later stage, as observed for γ′-Fe4NReference Somers and Mittemeijer49 or Fe3CReference Gressmann, Nikolussi, Leineweber and Mittemeijer50, Reference Nikolussi, Leineweber and Mittemeijer51 layer growth, respectively, on pure α-Fe.
(a) The squared Ni3N-layer thickness as function of the time of nitriding of a Ni substrate in pure NH3 at 400 °C. The straight line represents the result of least-squares fitting of the expression S 2(t) = kt + S 2(t = 0) to the experimental data. (b) The Ni3N-layer thickness as obtained after nitriding t = 4 h at 450 °C as a function of the nitriding potential.

The layer thicknesses S observed after nitriding with variable r N for a constant nitriding time of 4 h at 450 °C have been plotted as a function of r N in Fig. 5(b). If parabolic growth prevails [see Fig. 5(a)], the parabolic growth constant k follows from k = S 2/t using the data shown in Fig. 5(b). Then it is tempting to analyze the r N (or N-activity) dependence of the parabolic growth constant, k, e.g., in terms of the underlying diffusion mechanism of N in Ni3N, e.g., in the way proposed in Ref. Reference Hillert, Höglund and Ågren52 for “close-to-stoichiometric” interstitial phases. However, the thermal decomposition of NH3 in the atmosphere (see point (b) in Sec. III. B. 2) obstructs knowing the true r N values imposed on the substrate, rendering such an analysis impossible.
C. Macrostress and intrinsic elastic anisotropy of Ni3N
X-ray diffraction texture measurements on the Ni3N layers, performed in the present project, indicate the absence of distinctly preferred orientation of the Ni3N crystallites. Moreover, x-ray diffraction measurements as function of the angle of rotation around the surface normal of the specimen show that the diffraction effects exhibited by the specimens are rotationally symmetric with respect to the surface normal. Accordingly, the specimens possess a state of planar, isotropic macrostress σ II parallel to the surface of the specimen, which justifies application of specimen rotation around the surface normal to improve crystal statistics during the stress measurements (see Sec. II. B. 2).
The diffraction-angle positions  measured at various ψ will be analyzed 2-fold. First it is demonstrated that the elastic anisotropy of Ni3N as predicted by the calculated values of the SECs is reflected by the results of the x-ray diffraction stress measurements. Second, a quantitative stress analysis on the basis of the measured
 values is conducted using the calculated SECs.
1. Experimental verification of the intrinsic elastic anisotropy
For a biaxially symmetric state of planar macrostress in the Ni3N layer, the d spacing measured (via)  of a reflection hkl at a tilt angle ψ complies withReference Welzel, Ligot, Lamparter, Vermeulen and Mittemeijer53
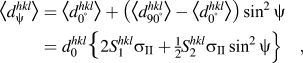
where  and
 are the d-spacings pertaining to ψ = 0° and 90°,
 is the stress-free lattice spacing,
 is the (mechanical) macrostress,
 and ¾
 are the x-ray elastic constants (XECs).Reference Welzel and Mittemeijer54 Plots of
 versus sin2ψ (not shown) are well linear with slopes amounting to
 [see Eq. (4)]. Division of the values of these slopes by
 , as calculated from the lattice parameters a and c from Ref. Reference Leineweber, Jacobs and Hull5, yields values of
 Whereas
 is a constant in the current consideration,
 depends on the reflection hkl used for the measurement (Note that this analysis does not consider the instrumental offset of the diffractometer and approximate lattice parameters for calculation of
 . However, it can be shown that the extracted values for
 are not at all very sensitive to these simplifications. Thus the evaluation in Sec. III. C. 1 constitutes a method to determine
 uninfluenced by the XECs, SECs, the diffractometer’s offset and the precise values of the lattice parameters).
The hkl-dependent  may be conceived as a measure for the macrostress-induced ψ-dependent macrostrain variation from ψ = 0° to ψ = 90°, with
 . In line with Ref. Reference Leineweber, Gressmann, Nikolussi and Mittemeijer55, the hkl (or x) dependence of
 can phenomenologically be described as a symmetry-invariant 4th-order polynomial in x 1, x 2 and x 3 which for hexagonal crystal symmetry reduces to a polynomial in x 3 only:
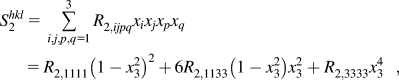
with R 2,1111, R 2,1133 (= R 2,3311 = R 2,1313 = R 2,3113 = R 2,3131 = R 2,1313) and R 2,3333 being phenomenological fitting parameters (all other R 2,ijpq = 0). The unit vector x [see also below Eq. (2)], which has here the function to describe the hkl dependence of  is oriented perpendicular to the respective set of planes hkl, i.e., parallel to the diffraction vector.
The experimental values for  have been plotted as function of x 3 in Fig. 1(c). On the basis of Eq. (5) values for the parameters,
 ,
 and
 can be obtained by fitting to the observed
 data as function of x 3. Using the values determined thus for these fit parameters, the dependence of
 on x 3 can be calculated. This dependence is represented by the full line in Fig. 1(c) and the
 surface in Fig. 1(d).
A good qualitative agreement of the crystallographic direction-dependence of the reciprocal Young’s modulus along x pertaining to a certain hkl, 1/Ehkl and the XEC ½ occurs: compare Figs. 1(a) and 1(b) as well as Figs. 1(c) and 1(d). The smallest absolute value of
 is measured for hkl reflections, which correspond to intermediate x 3 values, where Ni3N is expected to be least compliant as indicated by the 1/Ehkl data. Indeed,
 can be regarded as some average value of [(1+ν)/E]hkl measured along the diffraction vectorReference Howard and Kisi56 with ν as the more or less hkl-independent Poisson’s ratio (ν ≈ 0.3). Indeed, a similar agreement between the direction-dependences of 1/Ehkl and experimental values of
 has been observed previously: γ′-Fe4NReference Gressmann, Wohlschlögel, Shang, Welzel, Leineweber, Mittemeijer and Liu41 (AU = 0.50) and Fe3CReference Nikolussi, Shang, Gressmann, Leineweber, Mittemeijer, Wang and Liu34 (AU = 5.5).
2. Quantitative determination of the mechanical stress
A value for the macrostress  can be determined adopting the calculated values of the SECs (see Sec. III. A) for calculation of XECs for use in Eq. (4). To this end an effective grain-interaction model has to be chosen. Here an intermediate of the extremes Voigtian (‘isostrain’) and Reussian (‘isostress’) types of grain interaction is assumed, i.e.,

with a weighing factor w Reference Welzel, Ligot, Lamparter, Vermeulen and Mittemeijer53 and where for the XECs for the pure Voigt and Reuss cases relations according to Ref. Reference Howard and Kisi56 have been used.
In the course of the evaluation, the experimental diffraction-angle positions,  as function of ψ and hkl, were compared with calculated reflection positions
 . For a start, the latter were obtained taking estimated values for the (stress-free) lattice parameters a and c, for a 2θ-independent instrumental 2θ offset, for the weighting parameter w and for the macrostress
 . These initially estimated parameters were then refined by minimizing the sum of
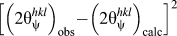 over all hkl and ψ (excluding the outlier hkl = 101). The results obtained for both specimens have been listed in Table II . The evolutions of
 calculated on the basis of the refined (using w) SECs well agree with the phenomenologically fitted evolutions according to Eq. (5) [compare Fig. 1(c)].
Results from the macrostress evaluation for two Ni3N layers produced by treatment of nickel plates for 4 h at the indicated temperatures followed by quenching.

a The layers are sufficiently thin such that the beam attenuation in the layer is so low that possible depth-dependences of, a, c and w are averaged out and the results represent arithmetic averages over the layer thickness.
b Compare Eq. (6).
All values pertain to measurement at ambient temperature.
The specimens nitrided at 400 °C and 500 °C both exhibit a compressive macrostress, which can be assumed to be of primarily thermal character. This implies that at the nitriding temperature plastic deformation allows relief of growth stresses such that the specimen is stress-free at the nitriding temperature. Upon quenching, the difference of the thermal expansion coefficients  of Ni3NReference Leineweber, Jacobs and Hull5, Reference Leineweber, Jacobs, Kockelmann, Hull and Hinz-Hübner57 and
 of nickelReference Kollie58 (the substrate) leads to a misfit of the thin Ni3N layer with the thick nickel substrate (remaining largely stress- and strain-free). Thus the Ni3N layer experiences a strain of
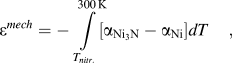
where for  a crystal-orientation averaged value is adopted (the degree of anisotropy is low; the thermal expansion of Ni is isotropic). One obtains εmech = −0.0013 for the specimen nitrided at 400 °C and εmech = −0.0018 for the specimen nitrided at 500 °C. If purely elastic strain accommodation has occurred, these values for εmech should correspond to the average (for the different hkl) of the macrostrain measured at ψ = 90°:
 . These measured average values are −0.0007 for the specimen nitrided at 400 °C and −0.0004 for the specimen nitrided at 500 °C. Hence, considerable plastic accommodation of the thermal misfit has occurred for both specimens, likely especially at the high temperatures at the beginning of the quenching process. Then, as expected, this strain relaxation is more pronounced for the specimen nitrided at 500 °C. Moreover, according to Fig. 3(b), the Ni3N layer of the specimen nitrided at 500 °C shows porosity, which may contribute to the reduction of the extent of elastic strain.
The values obtained for the weighting parameter w indicate a character of grain interaction intermediate of the Voigt and Reuss extremes. These w values are lower than the relatively high values (largely Voigtian) of w observed for γ′-Fe4N1-zReference Gressmann, Wohlschlögel, Shang, Welzel, Leineweber, Mittemeijer and Liu41 and Fe3CReference Nikolussi, Shang, Gressmann, Leineweber, Mittemeijer, Wang and Liu34 compound layers generated by similar gaseous treatment procedures. It should be recognized that, as compared to γ′-Fe4N1-z and Fe3C, the elastic anisotropy of Ni3N is modest (compare Sec. III. A) and thus changes in the XECs due to a change of w are relatively small in the present case. This makes the fitting performed in this section less sensitive to the type of grain interaction. Therefore, a detailed interpretation of the refined values of w is not possible.
Irrespective of the difference in the value of macrostress  for the specimens nitrided at 400 °C and 500 °C, the lattice parameters a and c determined for both specimens agree well with each other and with literature values (Table II). This confirms the small differences between values observed for the lattice parameters of chemically prepared Ni3N specimens (see Sec. I and III. D).
D. Comparison of Ni3N prepared by chemical and reactive sputtering; the Ni3N phase diagram
In the course of the present investigations only two Ni-N phases have been observed to occur between 175 °C to 600 °C: Ni3N and the terminal Ni(N) solid solution. The latter has definitely a larger homogeneity range than proposed previously (see Sec. III. B. 1).
In view of the constancy of the lattice parameters of Ni3N (see Sec. III. C. 2), a considerable compositional range of this nitride phase appears unlikely, in agreement with works from literature data for “chemically prepared” Ni3N. Note that such “chemically prepared” Ni3N does not only pertain to nitride prepared by reaction of Ni with NH3 but also to nitride produced by other “chemical” methods, e.g., thermal decomposition of precursors.Reference Leineweber, Jacobs and Hull5, Reference Choi and Gillan8 The absence of considerable (e.g., depth-dependent) compositional changes within the Ni3N layers of this study is also indicated by the quite narrow Bragg reflections of Ni3N observed in this study (see Fig. 2), which contrasts with the broad reflections usually observed for as-nitrided ε-Fe3N1+x layers.Reference Gressmann, Wohlschlögel, Shang, Welzel, Leineweber, Mittemeijer and Liu41
Much larger variations of the lattice parameters of Ni3N are observed for layers prepared by reactive sputtering, e.g., 4.60–4.65 Å for a and 4.27–4.29 Å for c Reference Vempaire, Miraglia, Pelletier, Fruchart, Hlil, Ortega, Sulpice and Fettar14 (since in the present paper the superstructure cell is used as unit cell for Ni3N, the a values from Ref. Reference Vempaire, Miraglia, Pelletier, Fruchart, Hlil, Ortega, Sulpice and Fettar14 have been multiplied by 31/2). Unfortunately, the corresponding diffraction data of Ref. Reference Vempaire, Miraglia, Pelletier, Fruchart, Hlil, Ortega, Sulpice and Fettar14 have been measured at fixed ψ, thus the peak positions and lattice parameters are affected by macrostress. Nevertheless, this observed considerable variation of the measured lattice parameter is unlikely attributable to variations of the macrostress in the nitride layers. Instead, as also observed for other systems, the sputter technique appears to promote an “extension of homogeneity ranges”Reference Chopra59: Ni solidifying on the surface of a substrate in the presence of a certain amount of N atoms, in the course of a sputter process, can lead to formation of a solid solution, which is metastable with respect to decomposition in the solid state. This decomposition can be kinetically hindered especially if two or more solid phases have to develop requiring long-range diffusion. A similar stabilization of a metastable phase (or phase composition) may explain the frequent observation of Ni4N in reactively sputtered layers, which has been observed applying chemical preparation techniques only in a few works.Reference Terao and Berghezan18–Reference Nagakura, Otsuka and Hirotsu20 As a matter of fact, Ni4N has never been observed in the present project.
IV. CONCLUSION
(i) Layers composed of the hexagonal Ni3N phase can be grown on pure Ni substrate plates in the temperature range of 175 °C ≤ T ≤ 550 °C by gaseous nitriding in NH3 + H2 atmospheres, provided a temperature-dependent value of a minimum nitriding potential
is surpassed. The formation of Ni3N on Ni requires much higher nitriding potentials than formation of iron-nitride phases, γ′-Fe4N1-z and ε-Fe3N1+x, on Fe: the nitrides of the “late” elements in the 3d-metal series are less stable than those of the “early” 3d metals.(ii) The single-crystal elastic constants (SECs) of Ni3N, predicted by the first-principles stress versus strain method, indicate a modest degree of elastic anisotropy with the highest compliances occurring along the [001] and [uv0] directions.
(iii) Ni3N layers obtained by nitriding at 400 °C and 500 °C exhibit distinct compressive residual macrostress parallel to the surface of the layers, leading to a hkl-dependent macrostrain showing an anisotropy (hkl dependence) compatible with the intrinsic elastic anisotropy described by the SECs of Ni3N. The macrostress originates from the thermal misfit between the nickel substrate and the Ni3N layer induced by quenching after nitriding. The absolute value of the macrostress, as observed at room temperature, is reduced due to some plastic deformation occurring in the high-temperature range during cooling and by the occurrence of pores in some of the Ni3N layers.
(iv) The (stress-free) lattice parameters of Ni3N of all specimens prepared by gaseous nitriding vary only a little indicating a very narrow homogeneity range of the Ni3N phase.
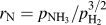 is surpassed. The formation of Ni3N on Ni requires much higher nitriding potentials than formation of iron-nitride phases, γ′-Fe4N1-z and ε-Fe3N1+x, on Fe: the nitrides of the “late” elements in the 3d-metal series are less stable than those of the “early” 3d metals.
ACKNOWLEDGMENT
The support of Dr. Ewald Bischoff (Max Planck Institute for Intelligent Systems; formerly Max Planck Institute for Metals Research, Stuttgart, Germany) by recording the SEM and EBSD data is gratefully acknowledged.