


1. Introduction
An integral part of the present climate system is the annual formation of sea ice in both polar regions, covering, at maximum extent, approximately 19 x 106 km2 of the Southern Ocean, and 14 X 106 km2 of the Arctic Ocean (Reference Gloersen, Campbell, Cavalieri, Comiso, Parkinson and ZwallyGloersen and others, 1992). The presence of the sea-ice cover is highly seasonal, influencing ocean/atmosphere interaction with in the sea-ice zone, and oceanic and atmospheric circulation in regions that extend well beyond the polar regions. The interaction between sea ice and global climate has been the focus of modelling studies for several decades, although most of these have focused on the ArctiC. These include both thermodynamic models (e.g. Reference Maykut and UntersteinerMaykut and Untersteiner, 1971) and dynamic/thermodynamic models (e.g. Reference HiblerHibler, 1980). Most recently, coupled models have been used to describe the global sea-ice distribution, and studies by Reference Ip, Hibler and FlatoIp and others (1991) and Reference Flato and HiblerFlato and Hibler (1992) have shown that dynamic/thermodynamic models can describe the observed seasonal cycle of ice extent and the location of the ice edge quite realistically. Flato and Hibler (1992) also examined the effect of sea-ice strength and ridge redistribution parameler-isations on the shape of the thickness distribution and abundance of ridged ice by separately accounting for the ridged and undeformed components of the Arctic pack.
The importance of comparing model output with observational data is summarised by Gates and others (1996), who stressed the importance of verifying the model treatment of thermodynamic growth and melting, ice dynamics and the effect of ocean and atmospheric circulation on ice deformation, using observational data, in particular ice thickness. in this paper we compare modelled output from a coupled sea-ice/atmospheric model with observational data from the Antarctic pack ice in the region 60-150° E.
2. Observational Work
Data on sea-ice thickness, concentration, snow cover and crystal structure were collected in the East Antarctic pack ice between 1986 and 1995. The data have been used to develop a climatology of the seasonally varying sca-icc characteristics in the region 60-150° E, described by Worby and others (1998).
The primary source of sea-ice thickness and concentration data is ship-based observations from 18 voyages to the pack ice. Many of the voyages were in spring, but there are sufficient data in 7 months of the year to provide statistically significant ice-thickness distributions of the pack. Table 1 provides a summary of the monthly mean ice-concentration values, and the level and deformed ice thickness with in the
Summary of the mean ice-concentration, and level and deformed (ridge-airrecled) ue-lhickness values determined from ship-based observations

pack. The level ice values are from the ship-based observations and include ice that may have been rafted but has no significant surface relief clue to ridging. These observations are made using an observational technique that involves estimating the thickness of floes as they are turned sideways by the passage of the ship, a technique which is much more effective in the Antarctic than in the Arctic due to the thickness of the ice. The ridged values are determined from the areal extent of surface ridging and mean sail height, as well as the level ice thickness. These observations are also made from the ship, and are used as input to a simple model formulation to determine the effective ice thickness within ridges. The model formulation is described in detail by Worby and others (1998), and shows that the effective thickness of the ice in the ridged component of the pack is, on average, 0.7 times the level ice thickness. This makes the total ice thickness, including ridges, 1.7 times the level ice thickness. A comparison of this methodology with laser and acoustic methods for determining ridge distributions and the volume of ice in ridges is presented in Worby and others (1996a), based on work conducted in the Bellingshausen and Amundsen Seas. Lytic and others (1998) also show that these results fall with in the range estimated from aerial photography of sea ice.
Latitudinal variations in ice thickness are apparent in the data, with the area-averaged level ice thickness in October-November (determined from ten voyages of data) increasing from around 0.2 m near the ice edge to 0.5-0.6 m in the central pack. Data from individual voyages show similar trends in other seasons, although a decrease in ice thickness close to the Antarctic coast is common due to the effects of katabatic winds and presence of coastal polynyas. Surface ridging also tends to increase with latitude.
In addition to the ship-based observations, in situ measurements of sea-ice crystal structure have been collected on eight voyages to the same region since 1991. These data provide an indication of the relative importance of sea-ice growth processes under different regimes of oceanic and atmospheric conditions, through the identification of frazil, congelation and snow ice within sea-ice cores. The core-structure data are also valuable for identifying the processes responsible for increasing ice thickness (either dynamic or thermodynamic) from the thickness and structure of different crystal layers with in the cores.
3. Model
The model we use is a coupled atmosphere-sea-ice model (Wu and others, 1997; Wu and Budd, 1998). The. atmospheric model is the Melbourne University 21-wave (R21), 9 (sigma)-level general circulation model (GCM) described by Reference SimmondsSimmonds (1985). It has been shown to produce creditable simulations of climate both globally and in the polar regions (Reference SimmondsSimmonds, 1990). The thermodynamic representation of the sea-ice model is similar to that of the Reference Parkinson and WashingtonParkinson and Washington (1979) model or the Reference SemtnerSemtner (1976) “zero layer” model. There is one mixed layer in the ocean (50 m), one ice layer and one snow layer. The atmospheric boundary layer is the lowest layer of the GCM. The boundary-layer scheme is based on the Monin-Obukhov similarity theory as described by Simmonds (1985). Simmonds and Budd (1990) give the application of this formulation to an ice/ ocean mixture, including the treatment of separate radiation balances for ice and water. Wu and others (1997) describe the lead parameterisation. Snow-ice is formed in the model due to sea water flooding the snow cover (Ledley, 1985).The model uses a “two level” ice-thickness distribution similar to Hibler (1980), such that the two ice thicknesses are the mean ice thickness and zero thickness. in our atmosphere-sea-ice model a simple ocean mixed layer parameterisation is used over the sea-ice zone and neighbouring ocean gridpoints ( Wu and others, 1997). The model has very simple dynamics, with only compressive stresses effective in the sea ice. At low concentration the sea ice moves in free drift from atmospheric wind forcing and moves at 2% of the wind speed with a turning angle of 25°, to the left of the wind in the Southern Hemisphere and to the right in the Northern Hemisphere. The resistance of sea ice at high ice concentrations is considered, and we include a parameterisation of the rafting processes as described in section 4.3. As described by Wu and others (1997), convergence stops when the ice concentration reaches 98%. The ice-model physical grid is identical to the physical grid of the GCM, with a resolution of approximately 3.3° latitude x 5.6° longitude.
The model is used to simulate the Antarctic sea-ice distribution under present climatic conditions, and the focus in this paper is the simulation in the East Antarctic region between 60” and 150° E. A number of numerical experiments have been performed with different rafting processes and compared with the results of observational studies in the same region. All experiments were run for 6 years with 15 min time-steps from 1 January, with the same initial conditions taken from an earlier quasi-equilibrium simulation. The first 2 year results are treated as an adjustment, and results shown here are 4 year averages from years three to six.
4. Comparison of Ship-Based Observations and Model Results
4.1. Ice concentration
The area-weighted average ice-concentration values from ship-based observations, special sensor microwave/image (SSM/I) (NASA TEAM algorithm) and the model are shown in Figure 1. The ship-based observations, from the region 60-150° E, show a high concentration of 93% in late winter which decreases almost linearly to 43% in early Summer. in contrast, the modelled values show a narrower range of concentration values that remain almost unchanged at around 80—85% for the period August-October and then decrease steadily to 60% in December. The observations therefore show a more extreme range of values for this period, and are slightly out of phase with the model results. The rapid decrease in ice concentration in the observations, particularly between August and October, is attributed to an increase in the open water fraction caused by divergence. While it is still cold enough for new ice to form in leads at this time of year, the divergence of the pack results in a nel decrease in ice concentration and area-averaged ice thickness that is not compensated by the amount of new ice growth. Worby and others (1998) showed that ice volume usually reaches a maximum in September, while maximum ice extent is commonly in October. The model is unable to parameterise these changes in the l hin component of the ice-thickness distribution, as shown in section 4.2, because it computes only a single average ice thickness for each gridcell. This limitation may also account for the lower ice concentration in the model in March April, when extensive new ice formation is common.
Modelled, observed, and SSM/I monthly ice concentrations. The SSM/I data are derivedfrom the NASA TEAM algorithm.
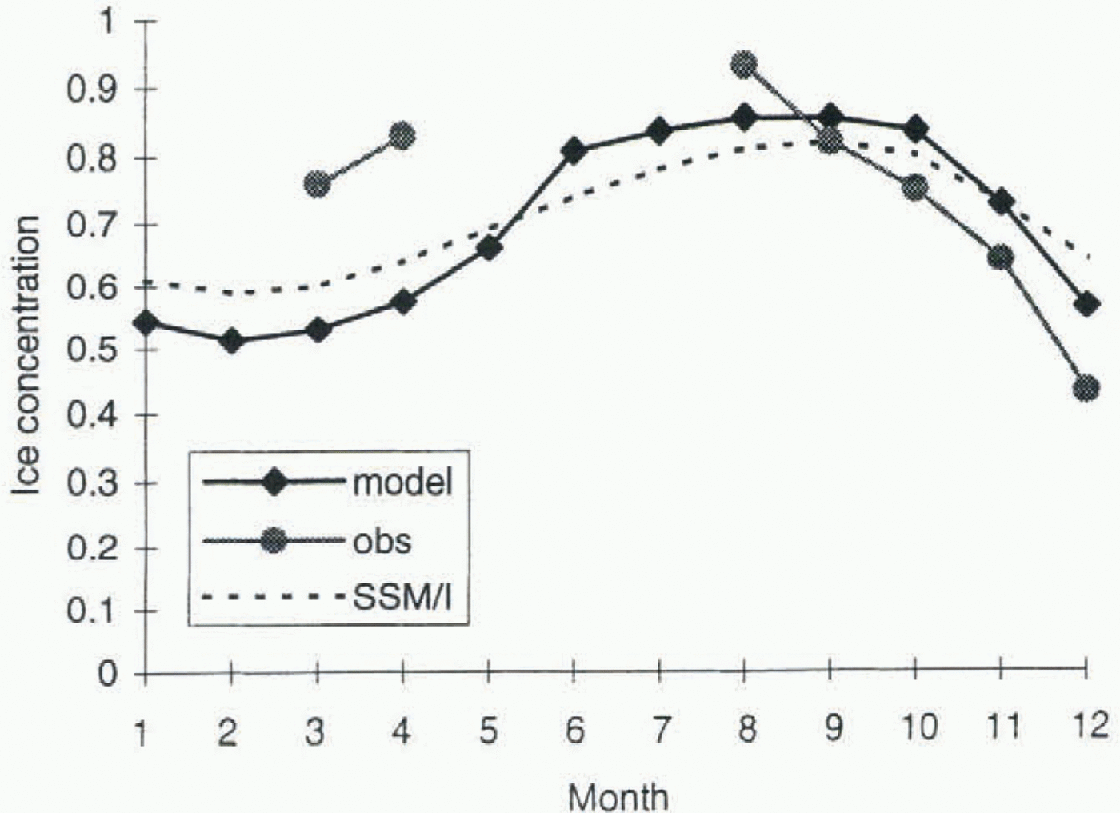
The model parameters for the partitioning scheme, described in section 4.5, are tuned so that the simulations agree with the SSM/I concentration, hence the good agreement between the model and SSM/I data shown in Figure 1. However, problems have been encountered estimating ice concentration from SSM/I data in regions of thin ice and brash (Worby, 1998), which are commonly observed in the East Antarctic sea-ice zone. A detailed examination of the ship-based ice-concentration data with the derived SSM/I ice concentration is the focus of a separate study.
4.2. Ice thickness
Sea-ice thickness in the Antarctic pack is determined by a complex interaction of thermodynamic and dynamic processes. Thermodynamic growth results in the refrcezing of leads and the accretion of ice at the base of floes, which in the absence of any dynamical influences would result in a level ice cover of uniform thickness, providing the forcing was spatially constant. Such forcing strives to maintain an equilibrium ice thickness by net accretion to thin ice and net ablation from thick ice (Reference Thorndike, Rothrock, Maykut and ColonyThorndike and others, 1975). Dynamical forcing has the opposite effect, in that it is responsible for the extremes of ice thickness found with in the pack, through the formation of thick pressure ridges and open water.
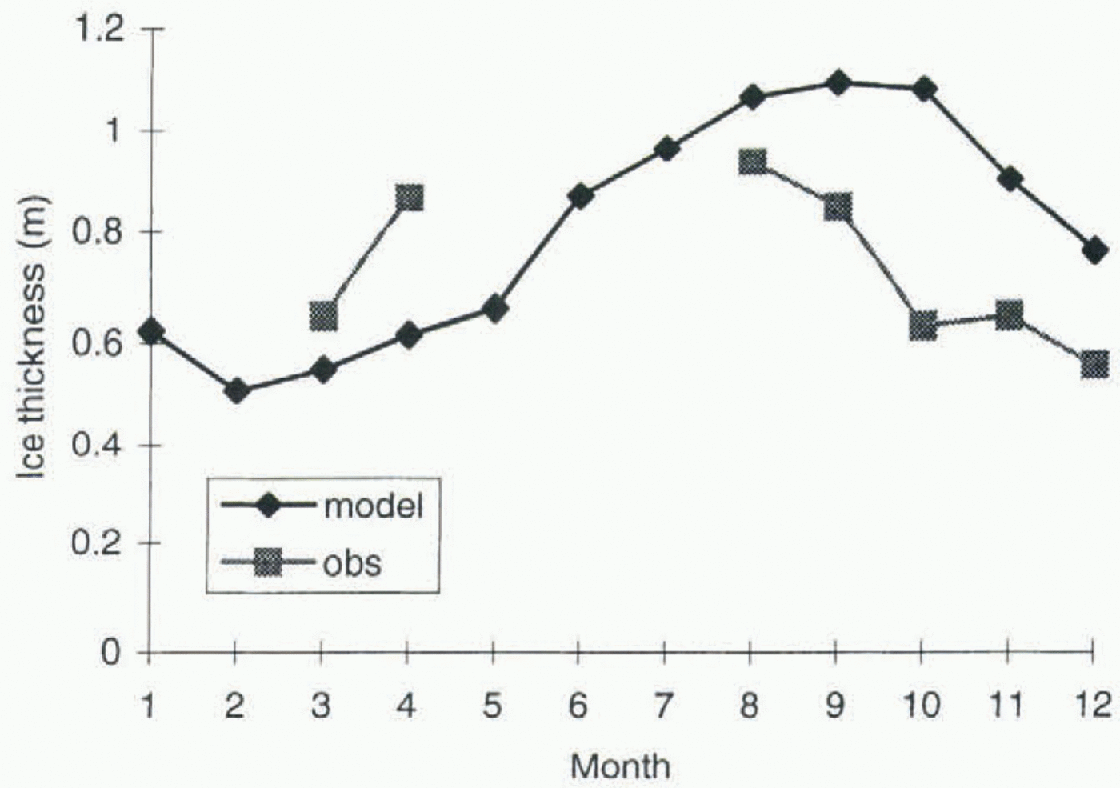
Figure 2 shows the seasonal cycle of sea-ice thickness for the 7 months described above. The observational data shown are the ridge-corrected, area-averaged ice thicknesses that best represent the ice thickness over the entire pack (sec section 2). While drilled measurements do not contribute directly to the dataset, they have been used in the development of the ridging parametcrisation to determine the effect of ridging on total ice thickness. The biases in both ship-based and drilled measurements are acknowledged and discussed in detail by Worby and others (1996a, b); however, recent comparisons between the ridge-corrected ship-based observations and upward-looking sonar (ULS) data in the East Antarctic show good agreement in mean ice thickness (Worby, 1998).
The observational ice-thickness data are considerably lower than the modelled ice-thickness values for the period August-December, and higher than the model values in March April.There are a number of shortcomings inherent in the two-layer model that will affect the growth and melt of the ice and its redistribution as discussed by Flato and Hibler (1992); however, the phase lag between the observed and modelled results may also be partly explained by the single average ice thickness computed by the model. A lag in ice-thickness decrease could be expected in the melt season due to the limited amount of ice that can melt from the sides and base of a single thick ice Hoe, compared with large areas of relatively thin ice. A similar lag in increasing ice thickness can be expected in the growth season. Changing the parameiers of the partitioning scheme as discussed in section 4.5 can make improvements in the simulation of ice concentration and thickness.
Modelled and observed sea-ice thickness. The observed values include the open-water fraction and contribution of ice in ridges.
4.3. Rafting
Dynamical forcing plays a particularly important role in determining the thickness distribution of Antarctic pack ice. Worby and others (1998) showed the mean drift speed of ice in the East Antarctic pack to be 0.22 m s−1 but highly variable on a daily basis. Worby and others (1996b) also showed that the pack-ice drift responds almost instantaneously to atmospheric forcing, and that cyclical changes in wind direction result in alternating periods of convergence and divergence with in the pack. It is these changing drift patterns that result in the formation of ridges and open water with in the pack. Worby and Massom (1995) showed from crystal-structure data from the East Antarctic that a floe may be deformed many times during its development, and that a high percentage of cores exhibit a layered crystal structure as a result of deformation. The distribution of the individual layers from 82 cores sampled on five voyages is shown in Figure 3, and shows that approximately 40% of the layers are less than 0.05 m thick, with a mean thickness of 0.11 m. This indicates the extent to which rafting occurs in thin sea ice, especially during the early stages of ice-floe development, and the importance of dynamic processes in determining the ice-thickness distribution.
The importance of rafting in the model for determining ice thickness and volume is tested in a sensitivity study.The rafting scheme used in the model is ice-thickness- and concentration-dependent but not shear-dependent. in sum-
Distribution of the thickness of individual layers in pack ice, determined from stratigraphie analyses of 82 cores from East Antarctica. All layers >1m thick are shown in the last category.

mary, converging sea ice in a region where ice concentration exceeds some critical value (chosen for the Antarctic to be 90%) causes rafting in the model as shown below in Equations (1)-(3) for the ratio of rafting (rc). rc is defined as the ratio of the volume of rafted to converged ice.

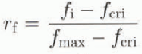

where rh in Equation (1) equals rh at hi = h1, i.e. rh1=kh1 −3. k is chosen to correspond to the value of compression al maximum sea-ice concentration, taken as fmax =98%. Rafting occurs only when the ice concentration exceeds 90% and there is convergence. When ice is thin (hi ≤ h0) all the converged ice is rafted; when it becomes sufficiently thick (hi > h1) rafting decreases linearly with h1 −3; and for ice thicknesses between h0, and h1 rafting decreases linearly with increasing ice thickness, as thin ice has less mechanical strength and should raft more readily (Hibler, 1980). in summary, rafting increases as ice concentration increases, but decreases as ice thickness increases. It should be noted that when the ice concentration exceeds fmax it is reset to fmax, and the ice thickness is recalculated in a way that conserves ice mass. The prescribed constants h0, h1 and k are not well known, a priori, for an arbitrary ice pack, but can be specified in order to test the model response to a range of settings.
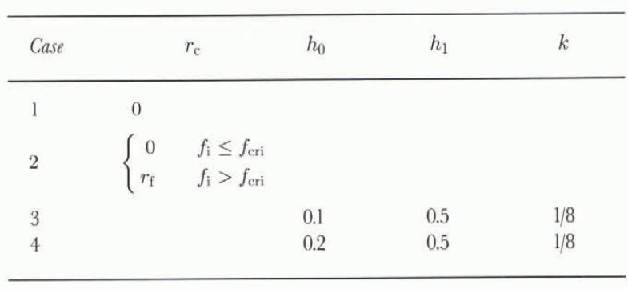
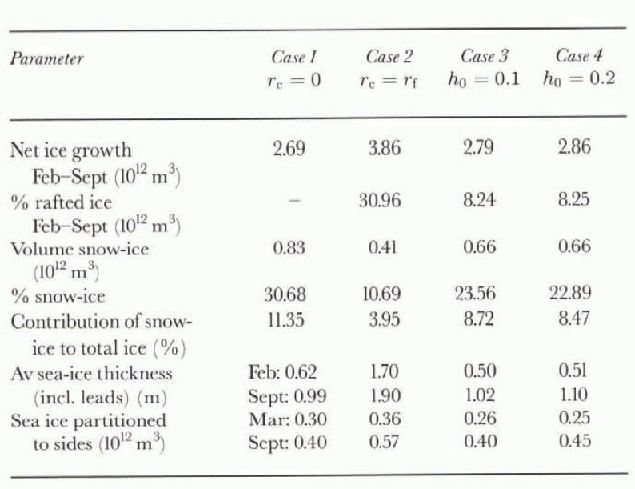
A sensitivity study of four different rafting paramctcrisa-tions is described in Table 2. Case 1 is for no rafting; case 2 is for rafting independent of ice thickness; and cases 3 and 4 have different thresholds for h0- The results are shown in Table 3; cases 1,3 and 4 are quite similar, i.e. it appears that the case for no rafting in the model gives similar mean results to a reasonable rafting parameterisalion. The main reason for this is that all four cases use the same partitioning scheme which represents the dynamic effect of rafting, but in a manner which is calculated thermodynamically (Wu and others, 1997, p. 596), by redistributing thin ice formed in leads to the sides and base of existing floes. Although the total ice volumes for cases 1 and 4 are very similar, Figure 4 shows that the incorporation of the ridging parameterisa-tion significantly affects the distribution of the ice. This is because sea-ice thickness and concentration are increased due to rafting, and this affects the resistance of the ice to subsequent divergence and convergence. The sea-ice distribution will also be affected by thermodynamic freezing in leads. The results of case 2 clearly show that too much ice is produced if the rafting parameterisalion is not ice-thickness dependent.
Sensitivity study of the rafting parameterisalion
Results of the sensitivity study of the rafting parameterisation
4.4. Ice volume
Worby and others (1998) estimated the maximum volume of sea ice with in the study region to be 3.6 x 10¹² m3 in September. This includes the multi-year ice component of the pack, estimated to be 1.4 x 10¹¹ m3, which subtracted from the total gives a net ice production during the growth season of 3.46 x 10¹² m3. These values were determined from ship-based observations of the ice-thickness distribution, and SSM/I data of the area of the pack in each month. The volume of multi-year ice was inferred from the thickest (>1m) component of the ice-thickness distribution in March.
The observations are in reasonable agreement with the model results which, for case 4 above, show a February minimum ice volume of 0.49 x 10¹² m3 and a September maximum of 3.35 x 10¹² m 3 The net ice production of 2.86 x 10¹² m3 is 83% of the value calculated from the observations.
Ice thickness for case 4 minus case 1. Contours are in metres.

4.5. Ice-crystal structure
The Antarctic pack ice differs markedly from the Arctic in that it comprises predominantly frazil ice. This is caused by differences in the growth environment, which in the Antarctic is more dynamic, resulting in extensive frazil-ice production and pancake-ice formation in the earliest stages of ice growth (Reference Wadhams, Lange and AcklcyWadhams and others, 1987). The dynamic environment is also responsible for stacking pancake ice, and thin first-year floes, to form thicker ice, thereby giving the ice the layered structure described in section 4.2.
The crystal-structure data from East Antarctic sea ice show it to be quite consistent with other areas of the Antarctic pack (Worby and others, 1998). It has a high percentage of frazil ice (47%) relative to congelation ice (39%), and a significant fraction of snow-ice (13%), with other ice types comprising 1%. It is currently very difficult to compare these data with the model output, because of the partitioning scheme used to grow or melt ice at the base and sides of floes. This partitioning scheme is dependent on the concentration and thickness of the ice at any particular time-step and is used to adjust the single ice thickness in the model in order to conserve ice volume. The ice partitioned at the base of floes might be taken as a proxy for congelation-ice growth and the ice partitioned to the sides as frazil; however, the parameterisation in the model does not reflect the processes that really determine the fraction of these ice types. Model results show that partitioning to sides increases steadily from March to September with the increase in sea-ice extent, but against the total ice volume the ratio decreases steadily from around 50% in March-April to 15% iii September as sea-ice volume and ice concentration increase over this period. Snow-ice, which forms at the ice surface as a result of flooding and refreezing of the base of the snow cover, can more readily be compared. The model grows sea ice as a result of sea-water flooding of the snow. For the freezing case the flooded snowr layer refreezes as sea ice, but for the melting case we follow the work of Ledley (1985), simply compressing snow into sea ice by conserving mass. The model shows that approximately 0.05 m of snow ice is formed each month throughout the growth season, with a cumulative total, again for case 3 above, of 24% of the total ice volume. While this is more than the observations in this region, other studies (e.g. Reference Jeffries, Worby, Morris and WeeksJeffries and others, 1997) have shown equally high fractions of snow-ice with in the Antarctic pack.
5. Conclusions
Comparing modelled and observed data is often not straightforward, for a variety of reasons. One of these is that field studies often provide only snapshots of local conditions, rather than long time scries of data that are more readily compared with model results. in this paper we have largely overcome that problem by using a climatology of ice thickness and structure based on 10 years of consistent observations.
A more complex problem is one of comparing real data with the output of models which are limited in their ability to parameterise physical processes. For example, the partitioning scheme used in the model allows redistribution of ice formed in leads to both the sides and base of floes, with redistribution to the base decreasing as ice thickness increases. The model parameters for the partitioning are currently tuned so thai simulations agree with the mean SSM/I ice concentrations. Hence, the partitioning is almost independent of thickness for ice less than 1 m, causing the ice-to be less compact and thicker than the observational data. A modified parameterisation will improve the simulation to allow the partitioning to the base to decrease monotonically with increasing ice thickness for all ice-thickness categories, and this will comprise future work.
The simple two-level sea-ice model described here is widely used and avoids the complexity of a full ice-thickness distribution and the associated parameterisations of ice strength and mechanical redistribution. However, the shortcoming is that only a crude estimation of the real thickness distribution is produced. Recent advances in computational methods (e.g. Reference Zhang and HiblerZhang and Hibler, 1997) may result in more advanced sea-ice models being coupled to GCMs in the near future.



