Intercropping, growing two or more crops in the same area at the same time, is a cultural management practice that can be used to suppress weeds through enhanced crop–weed competition (Bastiaans et al. Reference Bastiaans, Paolini and Baumann2008; Baumann et al. Reference Baumann, Bastiaans and Kropff2001). Intercropping has also been shown to increase yield stability (Bybee-Finley et al. Reference Bybee-Finley, Mirsky and Ryan2016), nutrient cycling (Hooper and Vitousek Reference Hooper and Vitousek1998; Vandermeer Reference Vandermeer1989), and other ecosystem services such as reduced insect pest and disease incidence and severity (Lin et al. Reference Lin2011; Sanderson et al. Reference Sanderson, Skinner, Barker, Edwards, Tracy and Wedin2004). Intercropping can increase overall crop productivity through both resource partitioning and facilitation. Resource partitioning (i.e., niche differentiation) occurs in intercropping systems as a result of combining crops with different resource acquisition traits (e.g., rooting depth, timing of soil nutrient uptake, etc.). Facilitation is often reported in perennial grass–legume intercrops as a result of cycling biologically fixed nitrogen. Intercropping benefits are more often seen under low–external input conditions where little or no synthetic fertilizers or pesticides are used (Brainard et al. Reference Brainard, Bellinder and Kumar2011; Liebman et al. Reference Liebman, Mohler and Staver2001), such as in smallholder and organic cropping systems (Willer et al. Reference Willer, Yussefi and Sorensen2010).
Resource partitioning in mixed intercropping systems allows crops to more fully use available resources such as light, water, and nutrients, thus reducing the amount of these resources available to support weed growth (Picasso et al. Reference Picasso, Brummer, Liebman, Dixon and Wilsey2008). Baumann et al. (Reference Baumann, Kropff and Bastiaans2000) reported that intercrops of leek and celery shortened the critical weed control period and reduced soil cover of weeds by 41% compared with leek monoculture. Hauggaard-Nielsen et al. (Reference Hauggaard-Nielsen, Ambus and Jensen2001) showed that intercropping pea (Pisum sativum L.) with barley (Hordeum vulgare L.) resulted in higher yields than either crop grown in monoculture and greatly reduced weeds compared with pea monoculture. Hauggaard-Nielsen (Reference Hauggaard-Nielsen, Ambus and Jensen2001) concluded that more of the inorganic nitrogen was being used by the barley crop than the weeds. Picasso et al. (Reference Picasso, Brummer, Liebman, Dixon and Wilsey2008), in an experiment using seven perennial species in 49 combinations in Iowa, showed that polycultures outyielded monocultures and weed biomass decreased exponentially with species richness. In that research, plots with both C3 grasses and legumes generally outyielded plots containing only legumes or only C3 grasses. Across a wide range of crops and environments, resource partitioning via intercropping leads to improved competition against weeds, with weed suppression being directly related to the degree to which different crops in the polyculture partition and use resources (Levine and HilleRisLambers Reference Levine and HilleRisLambers2009; Szumigalski and Van Acker Reference Szumigalski and Van Acker2005; Tilman et al. 1997).
Experiments aiming to test the relationship between diversity and productivity have often used species richness to measure diversity (Cardinale et al. Reference Cardinale, Matulich, Hooper, Byrnes, Duffy, Gamfeldt, Balvanera, O’Connor and Gonzalez2011; Waide et al. Reference Waide, Willig, Steiner, Mittelbach, Gough, Dodson, Juday and Parmenter1999). However, functional diversity has been shown to have advantages over species richness in explaining variance in productivity (Dalerum et al. Reference Dalerum, Cameron, Kunkel and Somers2010; Dı́az and Cabido Reference Dı́az and Cabido2001; Sanderson et al. Reference Sanderson, Skinner, Barker, Edwards, Tracy and Wedin2004; Tilman et al. Reference Tilman, Reich, Knops, Wedin, Mielke and Lehman2001). Functional diversity arises from differences in traits that allow plants to perform functions or obtain resources in a unique manner (Levine and HilleRisLambers Reference Levine and HilleRisLambers2009). For example, plant morphology, like height or branching traits, leads to different species occupying niches where individual plants can establish and thrive. By understanding how functionally diverse crops can be combined to partition resources and fill available niche space, cropping systems can be optimized to maximize resource utilization and reduce the need for direct weed control tactics such as herbicides or soil tillage.
Here, we report on the effects of intercropping on crop biomass production and weed suppression in an experiment that compared monocultures and three- and four-species mixtures of four warm-season annual crops: (1) pearl millet, (2) sorghum, (3) cowpea, and (4) sunn hemp. We selected these drought-tolerant crops because they differed in stature and nitrogen acquisition traits and could be grown together as a short-season forage crop or as a cover crop.
Pearl millet is a deep-rooted, tillering cereal crop that grows rapidly and performs well in poor soil, high heat, and drought conditions (Lee et al. Reference Lee, Wayne, Buntin, Dozier, Timper and Wilson2012; Newman et al. Reference Newman, Jennings and Blount2010). It matures relatively early, with approximately 50% of plants reaching reproductive maturity approximately 60 d after planting (Myers Reference Myers2002). Farmers in the northeastern United States currently grow pearl millet as a forage crop. Pearl millet can also be used as a cover crop and has been shown to suppress soil-borne diseases and root-lesion nematodes and increase soil organic matter (Ball-Coelho et al. Reference Ball-Coelho, Bruin, Roy and Riga2001; Newman et al. Reference Newman, Jennings and Blount2010; Sheahan Reference Sheahan2014).
Sorghum sudangrass is a cross between sorghum and sudangrass and can grow taller than pearl millet. The brown-midrib varieties with reduced lignin content can match corn (Zea mays L.) silage in terms of milk production (Ketterings et al. Reference Ketterings, Cherney, Godwin, Kilcer, Barney and Beer2007; Kilcer et al. Reference Kilcer, Ketterings, Cherney, Cerosaletti and Barney2005; Miller and Stroup Reference Miller and Stroup2003; Wright et al. Reference Wright, Wheeler and McKinlay1998). Because of its more rapid growth and uniform ground cover, soil erosion potential with sorghum sudangrass is less than half of conventionally tilled corn (Kilcer et al. Reference Kilcer, Ketterings, Cherney, Cerosaletti and Barney2005). Sorghum sudangrass is also commonly used as a summer cover crop and is known to secrete chemicals that suppress annual weeds and nematodes (Weston et al. Reference Weston, Harmon and Mueller1989).
Cowpea is an herbaceous legume crop with a growth habit that ranges from vining to erect and bushy; it typically does not grow taller than 1 m (Davis et al. Reference Davis, Oelke, Oplinger, Doll, Hanson and Putnam1991). Cowpea is considered an important food crop in many arid subtropical regions. In the United States, it is also known as black-eyed peas and is commonly grown as a grain and forage (McGiffen et al. Reference McGiffen, Ehlers and Aguiar2012). Despite its ability to provide a cost-effective source of high nitrogen forage in places such as the Southern Great Plains (Rao and Northup Reference Rao and Northup2009), it is not as widely grown in more northern regions. In addition to fixing nitrogen and improving soil health, cowpea attracts beneficial insects because of additional nectar-release sites on petioles and leaflets (Rao and Northup Reference Rao and Northup2009).
Sunn hemp is an herbaceous legume that can grow up to 3-m tall (Sustainable Agriculture Research & Education [SARE] 2012). It is grown extensively as a green manure and can fix a large amount of nitrogen (Food and Agriculture Organization of the United Nations n.d.). Sunn hemp is also used to suppress weeds and nematodes (Curto et al. Reference Curto, Dallavalle, Santi, Casadei, D’Avino and Lazzeri2015). In previous research in Alabama, sunn hemp was used as a winter cover crop and increased corn grain yield by 21% compared with fallow plots that did not have a cover crop (Balkcom and Reeves Reference Balkcom and Reeves2005). Riday and Albrecht (Reference Riday and Albrecht2008) successfully intercropped sunn hemp with corn in Wisconsin and found that it improved the forage quality of silage. If used for forage, the cultivar must have low alkaloid levels (e.g., ‘Tropic Sun’) or else it could be toxic to cows (SARE 2012).
The experiment was conducted at multiple sites in 2013 and 2014 for a total of 6 site-years across the Northeast to better understand the how weed suppression was affected by cropping treatment productivity and functional composition in monoculture and three- and four-species intercrops. We hypothesized that (1) crop biomass and weed suppression would be greater in grass–legume intercrops compared with the same crops grown in monocultures, and (2) weed biomass would decrease with increasing crop species richness.
Materials and Methods
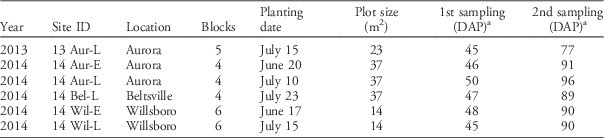
The experiment was conducted in 2013 and 2014 at (1) the Cornell Musgrave Research Farm in Aurora, NY (42.75°N, 76.58°W) on Honeoye (fine-loamy, mixed, semiactive, mesic Glossic Hapludalfs) and Lima (fine-loamy, mixed, semiactive, mesic Oxyaquic Hapludalfs) silt loam, U.S. Department of Agriculture (USDA) plant hardiness zone 5b; (2) the USDA Agricultural Research Service Beltsville Agricultural Research Center in Beltsville, MD (39.03°N, 76.90°W) on an Elkton silt loam (fine-silty, mixed, active, mesic Typic Endoaquults), plant hardiness zone 7a; and (3) the Cornell Willsboro Research Farm in Willsboro, NY (44.35°N, 73.38°W) on a Stafford fine sandy loam (mixed, mesic Typic Psammaquents), plant hardiness zone 4b. The experiment was repeated a total of six times with slight modifications to management practices, planting dates, and plot sizes across sites and years (Table 1).
Planting and sampling dates for years and field sites.

a DAP, days after planting.
In 2013 the Beltsville site included two trials with different planting dates: an early planting date in mid-June and a later planting date in mid-July (Table 1). In 2014 the Aurora and Willsboro sites each included two trials, again with different planting dates. The Aurora site in 2013 and the Beltsville site in 2014 were planted after winter wheat (Triticum aestivum L.) was harvested in mid-July. Each trial was assigned a descriptor to indicate that the trial was planted in June (E) or July (L). Planting date was not a treatment in this experiment but an artifact of when we were able to use the fields. As such, it was used to develop explanations for treatment outcomes and clarify the relevance of planting date in cropping systems management, with the earlier planting date corresponding to a cropping system management in which a farmer might plant an “emergency forage” crop, and the later planting date corresponding to a summer annual crop following a small grain harvest.
A randomized complete block design with four to six replications was used to compare four monoculture treatments and five intercrop treatments representing all combinations of three- and four-species intercrops. The four warm-season annual crops tested in monoculture and intercrops were obtained from King’s Agriseed (Ronks, PA) and include: (1) pearl millet ‘Wonderleaf’ (short, grass), (2) sorghum sudangrass ‘AS6401’ (tall, grass), (3) cowpea ‘Iron Clay’ (short, legume), and (4) sunn hemp ‘VNS’ (tall, legume).
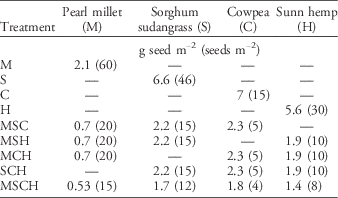
Intercropped seeding rates were based on a replacement series design such that each species included in an intercrop was seeded at the recommended monoculture rate divided by the number of species in the intercrop (Table 2). Pearl millet had the lowest seeding rate in terms of total mass and greatest seeding rate in terms of the number of seeds per square meter because of its relatively small seed size. Pearl millet, sunn hemp, and cowpea had germination rates of 80% and sorghum sudangrass had a germination rate of 85% according to the seed labels (King’s Agriseeds Inc., Ronks, PA). To ensure consistent targeted emergence rates among species, seeding rates were calculated on a live-seed basis.
Seeding rates used in the nine cropping treatments.Footnote a

a Seed costs: pearl millet, US$52.60 ha−1; sorghum sudangrass, US$205.10 ha−1; cowpea, US$253.30 ha−1; sunn hemp, US$255.00 ha−1. Prices are from 2013.
Fields were chisel plowed, disked, and cultipacked prior to the annual crops being planted, but field preparation varied slightly across sites. Prior to planting, 35 kg ha−1 of total nitrogen was broadcast in the form of poultry litter (5-4-3 in Aurora and Willsboro; 3-2-3 in Beltsville); however, in the 13 Aur-L site-year (see Table 1 for site-year abbreviations), nitrogen was applied as mineral fertilizer (10-20-20 in the form of urea–diammonium phosphorous–muriate potash). Although this is more nitrogen than would typically be applied before planting legume crops, it represents less than half of the recommended rate for sorghum sudangrass (Ketterings et al. Reference Ketterings, Cherney, Godwin, Kilcer, Barney and Beer2007). The legumes were inoculated with N-Dure rhizobium mixture (Verdesian Life Sciences, Cary, NC) suitable for cowpea and sunn hemp prior to planting. Crops were seeded from the large seed box to a depth of ~4 cm in 19-cm rows using a John Deere 1590 grain drill (John Deere, Moline, IL) at Aurora and Beltsville and a Great Plains grain drill (Great Plains, Duncan, OK) at Willsboro.
The first biomass samples were collected at 43 to 53 d after planting (DAP), and the second biomass samples were collected prior to seed maturation at 77 to 90 DAP (Table 1). Plants were clipped 10 cm above the soil surface, separated by crop species and weeds, dried at 60 C for up to 1 wk, and then weighed. In the few plots with missing crop plants, care was taken to collect biomass samples from areas that were not confounded by known mechanical or obvious environmental problems (e.g., areas where soil was eroded after intense rainfall shortly after planting).
Crop and weed biomass data were analyzed using JMP® Pro 10 software (v. 10, SAS Institute Inc., Cary, NC). A mixed-effect ANOVA was used to test for treatment differences for the response variables of crop biomass and weed biomass. The response variables were transformed for the ANOVA using the natural log; however, untransformed means are presented. Crop treatment, site-year, and their interaction were considered fixed effects, and block, nested within site-year, was considered a random effect. However, after a significant interaction between crop treatment and site-year was noted, each site-year was analyzed separately. Crop treatment was then considered the only fixed effect, and block was maintained as the only random effect. A Tukey honest significance difference test was performed to compare treatment means at α = 0.05. Orthogonal contrasts were used to assess differences between monoculture and intercropped crop treatments. Multiple regression was used to test the effects of species richness and crop biomass on weed biomass. Regression parameter P-values were used to determine the importance of each predictor.
Results and Discussion
Crop Performance
Our intention was to select and examine the growth of four crop species that differed in stature and nitrogen acquisition traits; however, the height of the two grasses was indistinguishable (unpublished data). Overall, the early seeding dates and more southern locations typically produced more biomass, which was likely due to greater growing degree day accumulation (Bybee-Finley et al. Reference Bybee-Finley, Mirsky and Ryan2016). The field used in the 14 Aur-L site-year had uneven field conditions with crops seeded immediately after wheat harvest. Crops there produced less biomass, which was likely due to nitrogen immobilization from wheat residue and strong competition from volunteer wheat. Generally, species that performed well early in the season continued to outperform other species later in the season (Figures 1 and 2).
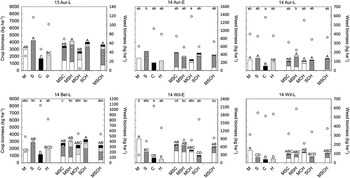
Crop and weed biomass by treatment for the first sampling across site-years. Within a panel, same uppercase letters above bars indicate no significant differences in total crop biomass at P<0.05 within a site, and no letters above bars indicate no significant difference in crop biomass between treatments. Weed biomass is plotted on a secondary axis, represented by circles for each treatment. Within a panel, same lowercase letters at the top of the bar chart indicate no significant differences in weed biomass at P<0.05 within a site, and no letters indicate no significant differences between treatments. M, pearl millet; S, sorghum sudangrass; C, cowpea; H, sunn hemp.

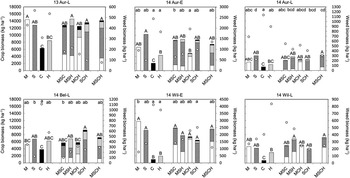
Crop and weed biomass by treatment for the second sampling across site-year. Within a panel, same letters above bars indicate no significant differences in total crop biomass at P<0.05 within a site. Weed biomass is plotted on a secondary axis, represented by circles for each treatment. Within a panel, same lowercase letters at the top of the bar chart indicate no significant differences in weed biomass at P<0.05 within a site, and no letters indicate no significant differences between treatments. M, pearl millet; S, sorghum sudangrass; C, cowpea; H, sunn hemp.

Monoculture Treatments
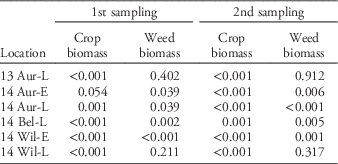
At the first sampling date (Table 3; Figure 1), sorghum sudangrass produced more biomass than pearl millet in 1 site-year (14 Bel-L), but pearl millet produced greater biomass than sorghum sudangrass in 2 site-years (14 Wil-E and 14 Wil-L). Both legume monocultures produced less biomass than the highest-yielding grass monoculture in 3 site years (13 Aur-L, 14 Wil-E, and 14 Wil-L), and no differences between the two legume monocultures were observed at the first sampling date. At the second sampling date (Table 3; Figure 2), no differences between the two grass monoculture treatments were observed, and both legume monoculture treatments produced less biomass than the highest-yielding grass monoculture in 3 site-years (13 Aur-L, 14 Wil-E, and 14 Wil-L).
Results from the ANOVA testing the effect of the crop treatment (monoculture and three-species and four-species intercrops) on crop and weed biomass separately by site-year.Footnote a

a See Table 1 for planting and sampling dates for years and field sites.
Intercrop Treatments
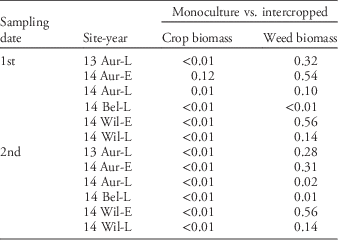
At the first sampling date (Table 3; Figure 1), there were no differences between the five intercrop treatments, except in the 14 Wil-E site-year, where the SCH treatment produced lower biomass than the intercrop treatments with two grasses (MSC, MSH, and MSCH; see Table 2 for cropping treatment abbreviations). At the second sampling date (Table 3; Figure 2), no differences were observed between intercrop treatments in 4 site-years. However, in the 14 Bel-L site-year, the SCH treatment produced more biomass than the MCH treatment. We found support for our hypothesis that crop biomass would be greater in intercrops than in monocultures. An orthogonal contrast between monocultures and intercrops showed differences at both sampling dates for each site-year (Table 4), apart from the 14 Aur-E site-year at the first sampling date.
Orthogonal contrasts between monoculture and intercropped crop treatments for crop and weed biomass by site-year for both sampling dates.

Grass monocultures and intercrops tended to produce similar amounts of biomass at both sampling dates (Figures 1 and 2). No differences were found between grass monocultures and intercrops, apart from in the 14 Bel-L site-year at the first sampling date. Typically, the intercrops containing two legumes did not produce less than the intercrops containing two grasses. Legume species were generally suppressed by the grass species when intercropped, which was previously quantified and described using partial land equivalent ratios (Bybee-Finley et al. Reference Bybee-Finley, Mirsky and Ryan2016). This is congruent with a meta-analysis conducted by Cardinale et al. (Reference Cardinale, Matulich, Hooper, Byrnes, Duffy, Gamfeldt, Balvanera, O’Connor and Gonzalez2011) of 574 independent manipulations of species richness, which found that intercrops rarely produce more biomass than the most productive species in that intercrop grown as a monoculture.
Weed Suppression
Two site-years (13 Aur-L and 14 Wil-L) at the first and second samplings had no differences in weed biomass between cropping treatments. This was likely due to a combination of low weed-seedbank density in those fields and the later planting date. All site-years produced greater weed biomass as the season progressed, apart from the 14 Bel-L site-year, which produced more weeds at the first sampling date than at the second sampling date. While this could be a sampling artifact, it was consistent across crop treatments. One potential explanation is that early-maturing weeds [e.g., yellow rocket (Barbarea vulgaris Ait. F.)] gained biomass quickly and then senesced prior to the second sampling date. Broadly, planting at a later date in mid-July after peak annual weed emergence, rather than mid-June, tended to result in lower weed biomass at the end of the season.
Most weeds observed were summer annuals. Common ragweed (Ambrosia artemisiifolia L.), redroot pigweed (Amaranthus retroflexus L.), and common lambsquarters (Chenopodium album L.) were the dominant species at most sites based on visual assessments of weed cover (unpublished data). In addition to these weeds, birdsrape mustard (Brassica rapa L.) was the most abundant weed observed in the 14 Aur-E site-year. Planting after the wheat harvest in the 14 Aur-L site-year resulted in relatively low weed biomass, but there were issues with volunteer wheat, particularly in the slower-growing monoculture legume plots.
We found partial support for our hypothesis that weed biomass would be lower in intercrops than in monocultures. Weed biomass was lower in intercrops than in monocultures in 1 site year (14 Bel-L) at the first sampling date and in 2 site-years (14 Aur-L and 14 Bel-L) at the second sampling date (Figures 1 and 2). Few differences between monocultures and intercrops were seen in an orthogonal contrast (Table 4). In general, grass monocultures and intercropped treatments produced similarly low weed biomass in all site-years. Greater weed biomass was observed occasionally in the intercrops containing two legumes compared with the intercrops containing two grasses (SCH at the first sampling in the 14 Wil-E site-year and MCH at the second sampling in the 14 Bel-L site-year). Interestingly, the four-species intercrop had the numerically lowest and consistently smallest range of weed biomass at the second sampling date across all site-years, suggesting that resources were more fully utilized by crops in this treatment. Our results are consistent with Liebman and Dyck (Reference Liebman and Dyck1993), who reviewed 24 studies about intercropping as a tool for weed management and found that, approximately half the time, intercrops of two or more “main” crop species suppressed more weeds than each of the species in monoculture.
Relationship between Crop and Weed Biomass
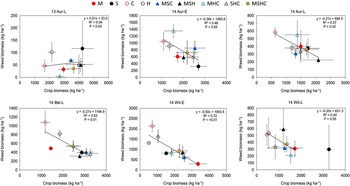
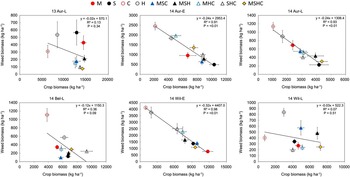
Consistent with the law of final constant yield (Weiner and Freckleton Reference Weiner and Freckleton2010), weed biomass tended to decrease as crop biomass increased (Figures 3 and 4). The relationship was more pronounced at the first sampling date with all but the 13 Aur-L site-year having a significant association between crop and weed biomass compared with half of the site-years at the second sampling date. The 14 Wil-E site-year illustrates the differences between the high weed–low crop biomass of legume monocultures and the high crop–low weed biomass of treatments containing grasses. In the site-years in which the regression analysis resulted in a significant relationship and a high coefficient of determination, the main factor limiting weed biomass production was crop–weed competition, whereas at the other sites with weaker relationships between weed and crop biomass, weed biomass, and therefore competition, was likely limited by low weed-seedbank density or low weed emergence due to later planting. In general, the legume monocultures were in the upper left quadrant, indicating a trend in low crop–high weed biomass (Figures 3 and 4). Previous studies on grass–legume intercropping have also shown that crop biomass and weed suppression tend to be lowest in legume monocultures (Akemo et al. Reference Akemo, Regnier and Bennett2000; Brainard et al. Reference Brainard, Bellinder and Kumar2011; Creamer and Baldwin Reference Creamer and Baldwin2000; Mohler and Liebman Reference Mohler and Liebman1987).
Mean crop biomass plotted with mean weed biomass for each treatment for the first sampling at each site-year. Horizontal error bars represent the SE for crop biomass, whereas vertical error bars represent the SE for weed biomass. A linear regression was fit to all treatments. M, pearl millet; S, sorghum sudangrass; C, cowpea; H, sunn hemp.

Mean crop biomass plotted with mean weed biomass for each treatment for the second sampling at each site-year. Horizontal error bars represent the SE for crop biomass, whereas vertical error bars represent the SE for weed biomass. A linear regression was fit to all treatments. M, pearl millet; S, sorghum sudangrass; C, cowpea; H, sunn hemp.

Crop Species Richness
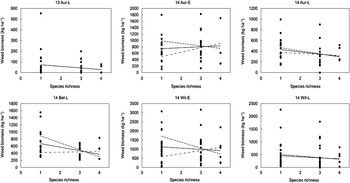
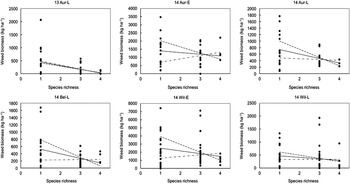
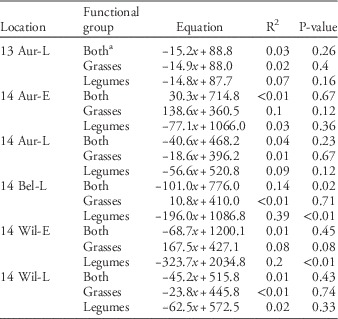
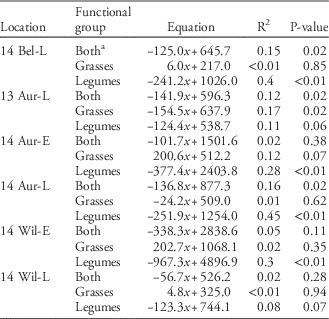
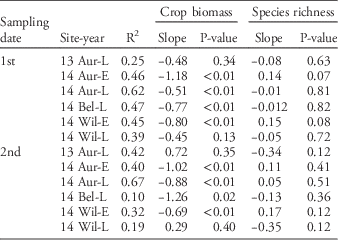
A negative relationship between species richness and weed biomass was seen across all but 1 site-year for the first and second sampling dates (Figures 5 and 6), with one-third of these linear relationships being significant in the second sampling date (Tables 5 and 6). Variability in weed biomass at the second sampling date differed greatly among sites but tended to decrease with increasing species richness. At the second sampling date, regression analyses showed that weed biomass was reduced between 56.7 in the 14 Wil-L site-year to 338.3 kg ha−2 in the 14 Wil-E site-year for each species added to the intercrop.
Relationship between weed biomass and crop species richness at the first sampling at each site-year (solid line). Only data from plots that contained pearl millet or sorghum sudangrass were included in the regression analysis of the grass functional group (dotted and dashed line), and only data from plots that contained cowpea or sunn hemp were included in the regression analysis of the legume functional group (dashed line). Equations for the lines can be found in Table 5.

Relationship between weed biomass and crop species richness at the second sampling at each site-year (solid line). Only data from plots that contained pearl millet or sorghum sudangrass were included in the regression analysis of the grass functional group (dotted and dashed line), and only data from plots that contained cowpea or sunn hemp were included in the regression analysis of the legume functional group (dashed line). Equations for the lines can be found in Table 6.

Results from regression analyses of species richness and weed biomass depicted in Figure 5 for the first sampling date for each location.

a “Both” indicates both grass and legume functional groups are included in the analysis (e.g., all data were used).
Results from regression analyses of species richness and weed biomass depicted in Figure 6 for the second sampling date for each location.

a “Both” indicates both grass and legume functional groups are included in the analysis (e.g., all data were used).
Although weed biomass decreased with increasing species richness, this effect was primarily a result of legume monoculture treatments producing relatively high levels of weed biomass. No relationship between species richness and weed biomass was seen across most locations for the grass functional group (Figures 5 and 6). The grass functional group had a weak positive relationship in half of the site-years at both sampling dates, but was not significant. This is in contrast to the legume functional group, which had a strong negative relationship in all site-years in the second sampling date due to the greater amount of weed biomass produced in legume monoculture compared with the intercrops. Our results show that adding a grass to a legume monoculture is more important, in terms of weed suppression, than adding a legume to a grass monoculture. We emphasize that it is important to consider the role functional groups play rather than crop species richness alone. Because the grass species contributed the majority of the biomass to the mixtures, examining these relationships by functional group (grass or legume) is a more meaningful approach to understand the effect of cropping treatment on weed biomass.
Using a multiple regression, we found that crop biomass was a more important predictor of weed biomass than species richness (Table 7). Our findings conflict with Picasso et al. (Reference Picasso, Brummer, Liebman, Dixon and Wilsey2008), who reported that weed biomass decreased exponentially with an increasing number of perennial forage crop species. With a shorter life cycle and growing period, the annual crops in our experiment were not affected by longer-term processes such as nutrient cycling and biological nitrogen fixation, which influence competition for soil nutrients.
Results from multiple regression analyses testing the effects of crop biomass and species richness on weed biomass by site-year for both sampling dates.

Our results are congruent with previous research showing that grasses are generally more weed suppressive than legumes because of their faster crop growth rate and ability to tiller (Brainard et al. Reference Brainard, Bellinder and Kumar2011; Bybee-Finley Reference Bybee-Finley, Mirsky and Ryan2016; Creamer et al. Reference Creamer, Bennett and Stinner1997; Haynes Reference Haynes1980; Poffenbarger et al. Reference Poffenbarger, Mirsky, Teasdale, Spargo, Cavigelli and Kramer2015; Trannin et al. Reference Trannin, Urquiaga, Guerra, Ibijbijen and Cadisch2000). Legumes, however, can form symbiotic relationships with rhizobacteria that fix nitrogen (Schipanski and Drinkwater Reference Schipanski and Drinkwater2012; Snapp et al. Reference Snapp, Swinton, Labarta, Mutch, Black, Leep, Nyiraneza and O’Neil2005). Low-input systems that use grass–legume intercrops have been shown to result in greater yield stability across environments, lower nitrogen immobilization, and higher-quality crop residues than grass monocultures (Brainard et al. Reference Brainard, Bellinder and Kumar2011; Bybee-Finley et al. Reference Bybee-Finley, Mirsky and Ryan2016; Snapp et al. Reference Snapp, Swinton, Labarta, Mutch, Black, Leep, Nyiraneza and O’Neil2005). Including grass–legume intercrops within a crop rotation can also help suppress a variety of other pests, including insects and diseases (Burdon et al. Reference Burdon, Thrall and Ericson2006; Knops et al. Reference Knops, Tilman, Haddad, Naeem, Mitchell, Haarstad, Ritchie, Howe, Reich, Siemann and Groth1999; Scherber et al. Reference Scherber, Mwangi, Temperton, Roscher, Schumacher, Schmid and Weisser2005; Teasdale Reference Teasdale1996). Thus, because including legumes in intercrops does not typically reduce yields, farmers might choose to include legumes for benefits other than weed suppression, although seed costs, which the authors consider an economic constraint rather than a biological impediment, and expected legume biomass production would need to be considered.
It is important to note that our analysis of the effect of crop species richness was confounded by the fact that the intercropped treatments contained both functional groups. Future research should explore the effect of crop species richness on weed suppression within grass and legume functional groups. Another factor to consider when intercropping is the proportion of each species in the mixture. In our research, we used a replacement series design based on recommended seeding rates for each species. However, the proportion of each species in the intercrop is likely a key determinant to intercrop performance, as a higher proportion of grasses in the intercrop will likely increase total crop biomass and weed suppression (Hayden et al. Reference Hayden, Brainard, Henshaw and Ngouajio2012; Schwinning and Parsons Reference Schwinning and Parsons1996; Trannin et al. Reference Trannin, Urquiaga, Guerra, Ibijbijen and Cadisch2000). While the benefits of intercropping, including increased crop productivity and yield stability, have been documented for these warm-season annual species, planting high-producing grasses will likely provide more economical weed suppression than more diverse intercrops.
Acknowledgments
We would like to thank Chris Pelzer, Ruth Mangum, Mike Davis, Paul Stachowski, Dave Wilson, and summer research assistants for their hard work with field research activities. We would also like to thank the two anonymous reviewers for their helpful comments and suggestions. This material is based upon work that was supported by the National Institute of Food and Agriculture, U.S. Department of Agriculture, Hatch Project 2013-14-425: “Expanding the Role of Cover Crops in Sustainable Cropping Systems,” and NE SARE Graduate Student Project GNE14-073: “Selecting Seeding Rates for Diverse Summer Annual Forage Crop Mixtures.”