INTRODUCTION
Commonly fish of a particular species do not occur in isolation from others, but as members of assemblages. A fish assemblage is defined as a group of fish that are present in the same space and at the same time and, irrespective of whether they interact or not, are phylogenetically related (Wootton, Reference Wootton1991; Fauth et al., Reference Fauth, Bernardo, Camara, Resetarits, Van Buskirk and McCollum1996). Assemblages have their own emergent properties that can be measured, quantified and analysed, such as species richness, abundance, biomass and biological indices (Magurran, Reference Magurran2005). Moreover, the study of the temporal variation in species within biological assemblages yields primary information that is needed for an understanding of the patterns of coexistence and interaction among the members so as to enable a management policy based on the structure of a given ecosystem (Jaureguizar et al., Reference Jaureguizar, Menni, Lasta and Guerrero2006).
Variations in the patterns of distribution and abundance—that, in turn, determine the composition and hierarchical dominance of species within site-specific assemblages—emerge as natural responses to the fluctuations in environmental conditions (Junk et al., Reference Junk, Bayley, Sparks and Dodge1989; Baber et al., Reference Baber, Childers, Babbitt and Anderson2002). The gradual change hypothesis predicts that temporal shifts in environmental conditions are coupled with variations in the structure of the fish assemblages (Connell, Reference Connell1978). For this reason, temperate marine areas are suitable systems for evaluating the effect of seasonal changes on fish assemblages, and how those variations are coupled with the influence of environmental conditions (Galván, Reference Galván2009). In the south-western Atlantic Ocean the key environmental parameters that have been reported as influencing the ichthyofaunal structure are water temperature, salinity and depth (Jaureguizar, Reference Jaureguizar2004; Jaureguizar et al., Reference Jaureguizar, Menni, Lasta and Guerrero2006; Galván et al., Reference Galván, Venerus and Irigoyen2009; García et al., Reference García, Jaureguizar and Protogino2010). Those studies, however, were done on the inner Argentine marine shelf and were based on samples of fish caught by trawling with commercial gear because of the great economic relevance of such fish as resources for commercial fisheries. In contrast, less consideration has been given to fish assemblages within inshore coastal areas (i.e. at <20 m depth) even though these areas (including bays) provide critical habitats for many valuable artisanal and recreational fish species because they are used as spawning and nursery sites (Blaber & Blaber, Reference Blaber and Blaber1980; Miller et al., Reference Miller, Redd, Pietrafase, McCleave, Arnold, Dodson and Neil1984).
These shallow systems are well represented along the coastal areas of Patagonia and, particularly Anegada Bay, act as feeding and nursery grounds for both teleosts and cartilaginous fish (Lucifora, Reference Lucifora2003; Lucifora et al., Reference Lucifora, García, Menni, Escalante and Hozbor2009a, Reference Lucifora, García and Escalanteb; Llompart, Reference Llompart2011; Molina & López Cazorla, Reference Molina and López Cazorla2011). Moreover, recreational and artisanal fisheries occur simultaneously in this bay (Colautti et al., Reference Colautti, Baigun, Lopez, Llompart, Molina, Suquele and Calvo2010; Llompart et al., Reference Llompart, Colautti and Baigun2012). Nevertheless, despite the significance of this coastal ecosystem, little is still known about how inshore fish assemblages respond to environmental variability on temporal and spatial scales and how this information might be useful to species conservation and resource management.
The objective of the present study was, therefore, to describe the coastal fish assemblage of Anegada Bay and its main ecological attributes, and to relate that structure to seasonal fluctuations in the environmental variables.
MATERIALS AND METHODS
Study area
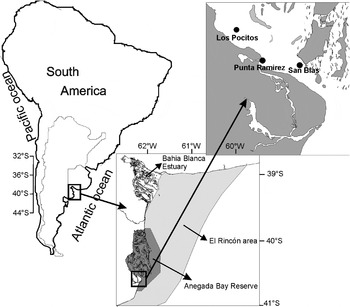
Anegada Bay (from 39.96°–40.60°S and from 62.10°–62.46°W) comprises a reserve designated in 2001 as a multiple-use zone and encompasses the southern part of the Buenos Aires Province (Argentina), North Patagonia (Figure 1). This bay, within the coastal area called El Rincón, includes several types of coastal environment—for example, marshes, tidal plains and sandy beaches (Penchaszadeh et al., Reference Penchaszadeh, Borges, Damboronea, Darrigan, Obenat, Pastorino, Schwindt and Spivak2003)—and also contains small islands. The bay's banks are connected by a diffuse network of channels, whose depths range from 10 to 30 m (Lucifora, Reference Lucifora2003; Cuadrado & Gómez, Reference Cuadrado and Gómez2010). The water temperature varies from 5°C in winter to 19.2°C in summer, and the salinity values fall between 32.5 and 35.0 psu (Borges, Reference Borges2006). The climate is dry (precipitation 300 mm/yr), with the prevailing winds coming from the north-west.
Geographical location of the study area and the sampling sites.

In the bay the tidal regime is predominantly mixed semidiurnal with a maximum amplitude of 2.56 m and minimum of 1.73 m (Servicio de Hidrografía Naval, 2009). The coastal sediments are composed of sand and gravel, with wave-cut platforms and marshes being present. Sandbars lie in the southern part of Anegada Bay and can become exposed during low tides.
A distinctive characteristic of the area is the presence of a tidal-inlet system connecting Anegada Bay with the outer sea and designated the San Blas Channel. This channel is 2.5 km wide and 12 km long with a maximum depth of 28 m. The current velocities therein reach 2 m/s during flood tides and drop to 1.8 m/s during ebb tides. The channel bottom is covered with unconsolidated sediments in the central regions and cohesive sediments toward the mouth (Cuadrado & Gómez, Reference Cuadrado and Gómez2011).
Anegada Bay is located near the boundary between the two major biogeographic provinces proposed for the Argentine Sea: the Argentine (from 30°–32°S to 41°–44°S) and the Magellanic (from 41°–44°S to 56°S) provinces (Balech & Erlich, Reference Balech and Ehrlich2008). Because of this proximity, in Anegada Bay, three kinds of fish associations can be found (Llompart et al., Reference Llompart, Molina, Cazorla, Baigún and Colautti2010): (a) typical cold-water or temperate–cold-water fish (e.g. Eleginops maclovinus (Cuvier, 1830) (López, Reference López1964)); (b) temperate–warm-water species occasionally entering into the Magellanic Province (e.g. Myliobatis goodei Garman, 1885, Pomatomus saltatrix (Linnaeus, 1766), Sympterygia acuta Garman 1877 and Sympterygia bonapartii Müller & Henle, 1841 (López, Reference López1964; Krefft, Reference Krefft1968)); and (c) typical warm-water fish belonging to the Argentine Province (e.g. Micropogonias furnieri (Desmarest, 1823), Paralichthys orbignyanus (Valenciennes, 1839), Brevoortia aurea (Spix & Agassiz, 1829) and Lycengraulis grossidens (Agassiz, 1829) (López, Reference López1964; Krefft, Reference Krefft1968)).
Sampling procedure
Three main sites were chosen for sampling the fish assemblage (Figure 1): (a) San Blas (SB; 40.53°S 62.22°W), located in the north flank of the San Blas Channel, a high-current environment near the channel's opening to the outer sea; (b) Punta Ramírez (PR; 40.52°S 62.31°W), located at the mouth of a secondary tidal channel, a tributary of the San Blas Channel; and (c) Los Pocitos (LP; 40.46°S 62.36°W), located in the south flank of the San Blas Channel in a lower-current environment and situated within Anegada Bay.
Each area was sampled seasonally from October 2007 to February 2009 by using seven bottom gill-nets, each with a length of 25 m and a height of 2 m. The gill-net gang contained different sizes between opposite knots, namely: 64, 70, 80, 105, 135, 150 and 170 mm. Sampling was always carried out during a nocturnal tidal cycle. After each haul, all the fish captured were identified to the lowest possible taxonomic level following Menni et al. (Reference Menni, Ringuelet and Aramburu1984), counted and weighed.
The water depth (m), temperature (°C), and salinity (psu) were measured at the beginning of the experimental fishing with a Horiba U-50 multiparameter water-quality meter.
Data analysis
Fish number (N) and weight (W) were estimated by standardizing each haul to 12 h of fishing time for the entire gang of gill-nets.
The ecological status of each fish species within the assemblage was established by means of the Olmstead Tukey's test (Sokal & Rohlf, Reference Sokal and Rohlf1979), where the (log) average of relative abundance of each fish is compared to their (log) percentage frequency of occurrence. This analysis enables the establishment of a quantitative classification of the species within the area on the basis of four ecological-use functional categories: (a) dominant: species with values of both the relative abundance and the relative frequency of occurrence higher than the respective arithmetic means for the two parameters; (b) common: species with only the relative frequency of occurrence higher than the corresponding arithmetic mean; (c) occasional: species with only the relative abundance higher than the corresponding arithmetic mean; and (d) rare: species with values of both the relative abundance and the relative frequency of occurrence lower than the respective arithmetic means for the two parameters.
The samples from each date and site were grouped by means of a CLUSTER analysis and then arranged in a 2-dimensional space through the use of a non-metric multidimensional scaling (nMDS) based on the Bray–Curtis (dis)similarity index. These matrices were calculated on log (x + 1) for the N and W data set, where x is species' value, in order to reduce the influence of the dominant species (Legendre & Legendre, Reference Legendre and Legendre1998; Podani, Reference Podani2000). Both multivariate techniques were applied simultaneously to give a greater robustness to the analysis, as suggested by Clarke & Warwick (Reference Clarke and Warwick2001). To test statistically for fuzziness in cluster groups a P(G° ≤ G*) analysis was used (Pillar, Reference Pillar1999). The resulting probability indicates whether the groups in the partition are sharp enough to reappear consistently in bootstrap re-sampling (N = 1000) where Ho means that the partition level is sharp.
The assemblage variables such as the total number of species (S), the Shannon–Wiener index (
 $\acute{H}$
), and the Pielou evenness (K) were calculated according to Magurran (Reference Magurran2005) with the subroutine DIVERSE of PRIMER 6 computer package (Clarke & Warwick, Reference Clarke and Warwick2001). These attributes were obtained for each group identified by the CLUSTER and nMDS analyses, and the existence of significant differences between sample groups evaluated by the Student's t-test (Zar, Reference Zar2010).
To determine whether or not significant shifts in assemblage structure had occurred between the fish assemblage groups, a non-parametric permutational multivariate analysis of variance (PERMANOVA) was used (Anderson, Reference Anderson2001; McArdle & Anderson, Reference McArdle and Anderson2001). A 10,000 permutation procedures was selected to obtain the null hypothesis distribution (indicated as ‘pseudo’ F) and P-values for the tests. The fish species most responsible for the multivariate pattern were identified by means of a similarity-percentages analysis (SIMPER). Species that contributed greatly to the dissimilarity were selected as those responsible for the assemblage differences. This multivariate technique was done with the PRIMER 6 statistics package (Clarke & Warwick, Reference Clarke and Warwick2001). Both tests were done using the Bray–Curtis (dis)similarities index applied on the N and W data set.
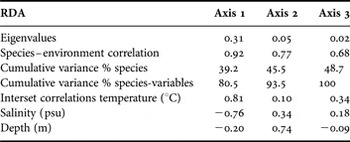
In addition, the variation in the fish assemblage over time in relation to the environmental variables measured was evaluated by direct gradient-redundancy analysis (RDA) through the use of the CANOCO 4.5 software package (Ter Braak & Smilauer, Reference Ter Braak and Smilauer2002). The decision to use the linear RDA was made in view of the lengths of the gradients in the DCA (<4; Leps & Smilauer, Reference Leps and Smilauer2003). The global model contained environmental variables (water temperature, salinity, and depth) transformed to log (x + 1), while the year and the sample location were used as covariates. Fish-abundance data were log-transformed, scaling was focused on interspecies correlations, the model was centred around the species, the species scores were divided by the standard deviation and the samples were not modified. The significance (P < 0.05) of the RDA gradient was assessed by Monte Carlo permutation tests (Ter Braak & Verdonschot, Reference Ter Braak and Verdonschot1995). These techniques yielded a so-called triplot, where the fish and species abundances and the sample stations (represented by acronyms), together with key environmental variables (represented by vectors) were displayed in an ordination diagram.
RESULTS
Fish-sample composition and representation
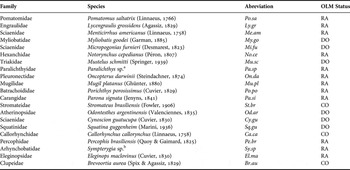
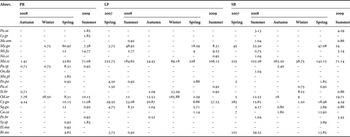
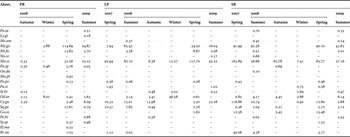
The samplings in spring 2007 and summer 2008 at the site PR and during autumn 2009 at the sites PR and LP were not completed because of bad weather conditions and thus were not included in the analysis. The use of experimental gill-nets provided a total of 4061 individuals and 21 marine coastal species (six chondrichthyans and 15 osteichthyans taxa) belonging to 21 genera and 19 families (Table 1). Chondrichthyans accounted for 67% of the abundance (N) and 77% of the weight (W; Table 2A, B). The Patagonian smoothhound (Mustelus schmitti Springer, 1939) was the most highly represented species in terms of both N (55%) and W (41%), followed by the eagle ray (Myliobatis spp.) at 9% and 30% N and W, respectively. Among the bony fish the most abundant species was the striped weakfish (Cynoscion guatucupa (Cuvier, 1830)) with respect to both N (14%) and W (12%), followed by the marine silverside (Odontesthes argentinensis (Valenciennes, 1835)) at respective N and W values of 9% and 4%. The Olmstead Tukey analysis indicated that 28% of the species should be considered as abundant, 14% as common, and 57% as rare, without any species being classified as occasional (Table 1).
List of species comprising Anegada Bay fish assemblage, their specific name abbreviated and ecological status: RA, rare; DO, dominant; CO, common.

a, Paralichthys orbignyanus + P. patagonicus; b, Sympterygia acuta + S. bonapartii
Standardized species abundance per year, season and sampling station: PR, Punta Ramírez; LP, Los Pocitos; SB, San Blas.

Standardized species weight (kg) per year, season and sampling station: PR, Punta Ramírez; LP, Los Pocitos; SB, San Blas.

Seasonal pattern based on abundance and biomass
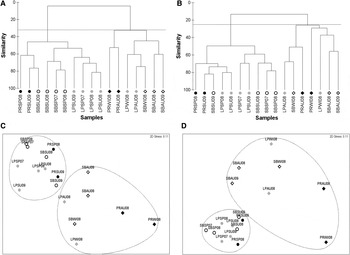
The CLUSTER analysis for the sampling sites as a function of fish number and weight defined two main groups following an intra-annual pattern (Figure 2A, B). The first group was composed of samples taken in the spring and summer (hereafter referred to as the warmer season) and the second by samples obtained during the autumn and winter (hereafter referred to as the colder season). This pattern, however, was practically independent of the sampling sites. The probability of P (G° ≤ G*) = 0.32 for the second partition level indicated that null hypothesis is accepted and the groups are really sharp. Moreover, the nMDS showed the same intra-annual pattern as the dendrogram with no overlap between groups and a stress value of 0.1, corresponding to a good ordination with no real prospect of a misleading interpretation (Clarke & Warwick, Reference Clarke and Warwick2001; Figure 2C, D).
Upper panels: CLUSTER analysis corresponding to fish number (A) and fish weight (B) for the fish assemblage in Anegada Bay. The dotted line represents the similarity level of the two main groups. Lower panels: nMDS analysis in number (C) and weight (D). The circles include the warmer-season group, the diamonds represent the colder-season group, and the grey scales correspond to the sampling sites. Codes: the first two letters represent the sampling stations (PR, Punta Ramírez; SB, San Blas; LP, Los Pocitos), the second ones indicate the sampling seasons (WI, winter; AU, autumn; SU, summer; SP, spring) and the three numbers correspond to the sampling years (07, 2007; 08, 2008; 09, 2009).

Difference between the warmer- and the colder-season groups
The species richness showed a strong pattern of annual variation, where the highest values were recorded during the warmer season (mean = 9.3, standard error ±0.59) and the lowest in the colder season (mean = 5.14, standard error ±0.76), with these values being statistically different (t = −4.32, P < 0.05). The minimum species richness was obtained at PR and LP during the winter (S = 3), whereas the maximum was found at PR during the summer (S = 12). In addition, the
$\acute{H}$
and K indices were significantly different between the two groups (t = −2.13, t = 2.38, P < 0.05), with the former parameter being higher during the warmer season (mean 1.25, standard error ±0.1 and mean 0.87, standard error ±0.08) and the latter higher during the colder season (mean 0.53, standard error ±0.06 and mean 0.39, standard error ±0.02). Finally, the fish compositions of the assemblages were significantly different between the two groups as well (PseudoF = 5.72 in N and PseudoF = 7.75 in W, P < 0.05).
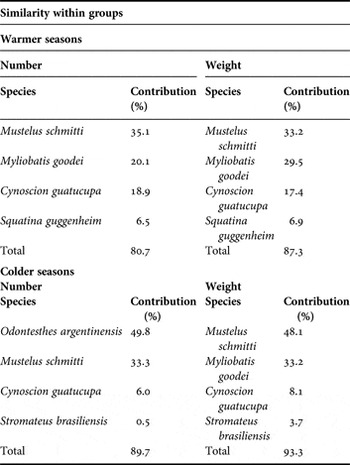
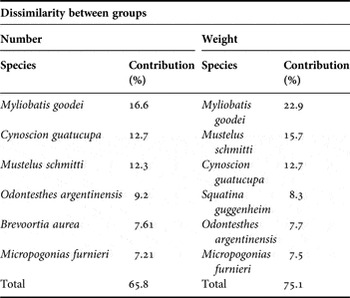
The SIMPER analysis indicated that the average similarity of each seasonal fish assemblage ranged between 64.43% in N and 64.42% in W for the warmer period and between 51.97% and 43.33%, respectively, for the colder. Mustelus schmitti, Myliobatis spp., and Cynoscion guatucupa were the species that mostly accounted for seasonal differences in the assemblage both in terms of N and W (Table 3). These species, along with Odontesthes argentinensis and Squatina guggenheim Marini, 1936, were, furthermore, those that mostly contributed to the dissimilarity between seasonal groups with respect to both N and W (Table 4).
Species contribution to similarity between the seasons based on fish number and weight as assessed by the SIMPER procedure.

Species contribution to dissimilarity between the seasons based on species number and weight as assessed by the SIMPER procedure.

Relationship between fish assemblages and environmental variables
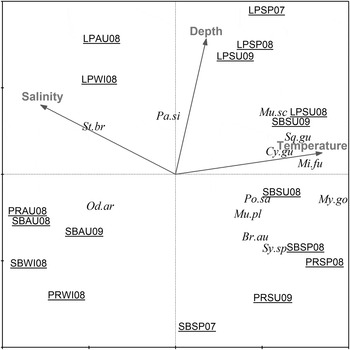
All the environmental parameters considered by RDA significantly influenced the fish assemblage (P < 0.05). The first two axes of the RDA on the number of data set accounted for 45.5% of the total variance, with both the first axis and the sum of all canonical being significant (P = 0.002). The first ordination axis accounted for 80.5% of the variance in the relationship between the species and environmental data, while the second axis explained only 13% (Table 5). Since after manual selection the third environmental variable (depth) added to the model entered with a limited α and was mainly correlated with the second canonical axis, the significance of this axis was evaluated by partial RDA (P > 0.05). Then, from the RDA-ordination diagram a single gradient observed separated the fish primarily on the basis of temperature, where the warmer seasons were located on the right side of the diagram and the colder on the left (Figure 3; only the species well-fitting to the gradient are shown). Here, only O. argentinensis and Stromateus brasiliensis Fowler, 1906 showed preferences for cold water, while the majority of the species appeared during the warm-water period. Within this group, the species most related to the high temperatures were M. goodei, C. guatucupa, S. guggenheim and M. schmitti. Salinity, in turn, appeared to be correlated with the first canonical axis but opposite to water temperature, while depth appeared as the least related variable and not strongly correlated with any particular species although Parona signata appears to use mid-depths.
Triplot diagram of the redundancy analysis for environmental variables and fish assemblages in Anegada Bay. The sample codes are as defined in Figure 2, while for the fish the first two letters of the genus plus the first two letters of the species name are used, separated by a period (see the species names listed in Table 1).

Summary statistics of the redundancy analysis for the fish assemblage and environmental factors in Anegada Bay.

DISCUSSION
This study investigated changes in the marine shallow-water fish assemblage from Anegada Bay over time in terms of variations in species richness, fish number and fish weight, in three different locations. Although species composition did not depart strongly from patterns predicted by zoogeographic studies for this region (Balech & Erlich, Reference Balech and Ehrlich2008), very shallow areas such as Anegada Bay can present distinctive patterns or new recorded species (Llompart et al., Reference Llompart, Molina, Cazorla, Baigún and Colautti2010). The core members of the Anegada Bay fish assemblage were represented by only a few species. Among those present, Mustelus schmitti, Micropoganias furnieri, and Cynoscion guatucupa belong to the varied coastal (variado costero) fishing group that consists of species inhabiting the coastal areas between 34° and 41°S and up to 50 m depth (Angelescu & Prenski, Reference Angelescu and Prenski1987; Carozza et al., Reference Carozza, Navarro, Jaureguizar, Lasta and Bertolotti2001a). These three species—identified as the most typical ones for the inner coastal assemblage of Argentina (Jaureguizar et al., Reference Jaureguizar, Menni, Lasta and Guerrero2006)—exhibit great economic relevance in Brazil and Uruguay (Haimovici et al., Reference Haimovici, Pereira and Vieira1989; Nion, Reference Nion and Shotton1999; Miranda & Vooren, Reference Miranda and Vooren2003; Vasconcellos & Haimovici, Reference Vasconcellos and Haimovici2006) as well as in Argentina, both nationwide (Carozza et al., Reference Carozza, Ruarte, Massa, Suquelli, Colautti, Giangiobbe, Arias and Hozbor2001b; Massa & Hozbor, Reference Massa and Hozbor2003; Perrota & Ruarte, Reference Perrotta and Ruarte2009) and at the local level, since the three are targeted by both recreational and artisanal fishing within Anegada Bay (Colautti et al., Reference Colautti, Baigun, Lopez, Llompart, Molina, Suquele and Calvo2010; Llompart et al., Reference Llompart, Colautti and Baigun2012). Another two abundant species in the Anegada fish assemblage were Myliobatis spp.—also well represented in the outer area of the Río de la Plata estuary (Rico Reference Rico2000; Jaureguizar et al., Reference Jaureguizar, Menni, Guerrero and Lasta2004)—and Odontesthes argentinensis—quite common in the coastal areas of Brazil, Uruguay, and Argentina (de Buen, Reference De Buen1953; Chao et al., Reference Chao, Pereira, Vieira and Yanez-Arancibia1985; Moresco & Bemvenuti Reference Moresco and Bemvenuti2006; Sampaio, Reference Sampaio2006). These last two species also represent a valuable fishery resource within Anegada Bay (Llompart, Reference Llompart2011; Llompart et al., Reference Llompart, Colautti and Baigun2012). Finally, Squatina guggenheim—classified as an endangered species by the International Union for Conservation of Nature (Chiaramonte & Vooren, Reference Chiaramonte and Vooren2007), despite still being one of the most common fish in the national market (Massa et al., Reference Massa, Hozbor, Lucifora and Colonello2003)—was not relevant to fishing in the present study area.
The composition of the coastal-fish assemblages at the three sites in Anegada Bay showed strong seasonal differences. These changes in fish composition allowed us to differentiate two groups, corresponding to the autumn–winter and the spring–summer seasons. The pattern of variation observed in the assemblage attributes along with several indices suggested the existence of two periods: one of warmer months (the spring–summer) when the species-abundance, diversity, dominance, and richness values were higher than those found during the second colder season (autumn–winter). This pattern was similar throughout the three years of the study—2007, 2008 and 2009—and at the three sampling sites, thus exhibiting a consistency over time and reproducibility among the three locations.
Since the temporal pattern assemblage species, should be in part to the population dynamics of each of them, we suggested that this intra-annual seasonal pattern can be produced by an admixture of oceanodromous migrant species and/or by seasonally breeding partial migrants (Chapman et al., Reference Chapman, Skov, Hulthén, Brodersen, Nilsson, Hansson and Brönmark2012a, Reference Chapman, Hulthen, Brodersen, Nilsson, Skov, Hansson and Brönmarkb).
Temporal variations in fish assemblages related to reproductive activities of particular species were mentioned in the temperate False Bay in South Africa, where abundance and species richness were highest during the period when most species recruit (Clark et al., Reference Clark, Bennett and Lamberth1996). Similarly, in Ardmucknish Bay on the west coast of Scotland, an increase in both numbers and species were caused mainly by the recruitment of young of the year (Gibson et al., Reference Gibson, Ansell and Robb1993). In addition, Layman (Reference Layman2000) working on the north end of Hog Island Bay in North America, showed that fish species richness and total abundance peaked in summer and were lowest in the winter due to migration of certain species to deeper waters or southward during cooler months. Furthermore, movements to inshore areas as a result of reproductive behaviour during the warmer months could have been one of the main influences on the coastal-fish assemblage, as had been previously noted by several studies done in the south-west Atlantic Ocean. Pinheiro et al. (Reference Pinheiro, Martins, Araujo and Pinto2009) and Rodrigues & Vieira (Reference Rodrigues and Vieira2013) worked in temperate and subtropical marine coastal areas of Brazil, respectively, and found intra-annual variation of fish assemblage related to seasonal presence of juveniles and reproductive adults due to the high reproduction activity in the spring/summer months. In our study, M. schmitti and C. guatucupa exhibited a well defined pattern characterized by the highest abundance during the warmer months and a decrease during the autumn and winter. Moreover, the seasonal migration of Mustelus schmitti in Anegada Bay had been investigated by Colautti et al. (Reference Colautti, Baigun, Lopez, Llompart, Molina, Suquele and Calvo2010) who found that adult smoothhounds entered the bay during the spring and remained until the summer for mating and reproduction, only to leave the area and return again the following year. The neonates and juveniles of this species, however, because of food availability, persisted during the entire year until reaching sexual maturity (Colautti et al., Reference Colautti, Baigun, Lopez, Llompart, Molina, Suquele and Calvo2010). For this reason Anegada Bay should be considered a nursery area (Molina & López Cazorla, Reference Molina and López Cazorla2011). Moreover, certain authors have suggested that the concentration of C. guatucupa through seasonal migration into the coastal areas between November and April likewise occurs for reproduction (Cosseau et al., 1986; López Cazorla, Reference López Cazorla1996). Similarly, a seasonal presence during the warmer part of the year, but an absence in autumn, was detected for S. guggenheim in Anegada Bay in the present study. This pattern could be related to a migration of part of the population towards shallower coastal waters (<40 m), where copulation and parturition take place between November and December (i.e. spring; Sunye & Vooren, Reference Sunye and Vooren1997; Colonello et al., Reference Colonello, Lucifora and Massa2007). Myliobatis sp., for its part, was identified as a marine migrant (Rico, Reference Rico2000) and was therefore more abundant during the spring season, as in the outer area of the Río de la Plata estuary (Jaureguizar et al., Reference Jaureguizar, Menni, Guerrero and Lasta2004)—there, however, the breeding site of this species remains unknown. The euryhaline and migrant species Brevoortia aurea, a spring–summer spawner (Acha & Machi, Reference Acha and Macchi2000), and Micropogonias furnieri—which reproduce between October and April (Militelli et al., Reference Militelli, Macchi and Rodrigues2012)—were not present in the bay during the colder seasons. Evidence was found for the presence in the bay of juveniles of C. guatucupa, S. guggenheim, Myliobatis goodei, B. aurea, and Micropogonias furnieri during the period of the sampling programme. By contrast, the marine silveride O. argentinensis evidenced the highest abundance during the autumn–winter season, even though reproducing in the spring (Llompart et al., Reference Llompart, Colautti, Maiztegui, Cruz-Jiménez and Baigun2013). The hypothesis that Anegada Bay is used seasonally during the warmer months by migrants entering for reproduction likewise agrees with the recorded arrival of the four large coastal sharks ((Carcharias taurus Rafinesque 1810, Carcharhinus brachyurus (Günther, 1870), Galeorhinus galeus (Linnaeus, 1758) and Notorynchus cepedianus (Perón, 1807)) from the outer areas during the spring–summer seasons for mating and breeding (Lucifora et al., Reference Lucifora, Menni and Escalante2002, Reference Lucifora, Menni and Escalante2005, Reference Lucifora, García, Menni and Escalante2006, Reference Lucifora, García, Menni, Escalante and Hozbor2009a, Reference Lucifora, García and Escalanteb).
The limited proportion of dominant species found in the fish assemblage of Anegada Bay agrees with a widespread and general pattern described for various taxa, including fish in shallow bay areas, estuaries and other coastal environments (Clark et al., Reference Clark, Bennett and Lamberth1994; Valesini et al., Reference Valesini, Potter, Platell and Hyndes1997) in which few species are dominant, others only moderately common, and the rest either uncommon or rare (Magurran et al., Reference Magurran, Khachonpisitsak and Ahmad2011). The species classified as dominant (e.g. Myliobatis spp., C. guatucupa and Mustelus schmitti) were also those that most greatly contributed to the dissimilarities between the fish fauna of the spring–summer and autumn–winter groups. Nevertheless, M. schmitti also made a high contribution to the similarities in both the warmer and the colder seasons since age-class abundances indicated great seasonal variation. According to this pattern, individuals smaller than 40 cm are present throughout the year, but the occurrence of individuals of length greater than 47 cm had been observed almost exclusively in the spring–summer seasons (Colautti et al., Reference Colautti, Baigun, Lopez, Llompart, Molina, Suquele and Calvo2010).
The RDA indicated that changes in the attributes of the assemblage were positively correlated with water temperature, and this parameter was therefore selected as the main environmental variable of relevance to the seasonal structuring of the Anegada Bay fish assemblage. Accordingly, water temperature had also been seen as the most consequential determinant of the structuring of the fish assemblages along the south-west continental shelf (Menni & Gosztonyi, Reference Menni and Gostonyi1982; Menni & López, Reference Menni and López1984). For example, Jaureguizar et al. (Reference Jaureguizar, Menni, Lasta and Guerrero2006) showed that the spatial distribution of the spring fish assemblages in the northern Argentine marine shelf (between 34° and 41°S) was explained mostly by the general water temperature, while Menni et al. (Reference Menni, Jaureguizar, Stehmann and Lucifora2010) found that depth and the bottom water temperature were the variables selected for their functional relevance in determining chondrichthyan-species composition (between 22° and 54°S). Salinity, in turn, plays a major role in structuring fish assemblages in estuarine environments (Jaureguizar et al., Reference Jaureguizar, Menni, Bremec, Mianzan and Lasta2003; Barletta et al., Reference Barletta, Barletta-Bergan, Saint-Paul and Hubold2005), but it is only of secondary relevance in coastal systems (Menni et al., Reference Menni, Jaureguizar, Stehmann and Lucifora2010). Since these variables covary, the interpretation of the effect of each one alone is difficult to assess (Jaureguizar et al., Reference Jaureguizar, Menni, Guerrero and Lasta2004).
Anegada Bay is influenced by the so-called Patagonian current (Brandhorst & Castello, Reference Brandhorst and Castello1971) that flows along the shoreline from south to north. That marine water mass receives the influence of freshwater discharges from the Negro River and, to a much lesser extent, from the Colorado River, both of which decrease the salinity levels (Guerrero & Piola, Reference Guerrero, Piola and Boschi1997). Despite this influence, the differences in the water-temperature conditions noted in our study reflect complex interactions and possible combinations of natural warming phenomena through seasonal changes (Boltovskoy, Reference Boltovskoy and Boltovskoy1981) and/or as a result of the warm marine current coming in a south-southwest direction that reaches the coast of the Buenos Aires province in the spring during October (Balech, Reference Balech1971, Reference Balech1986; Martos & Piccolo, Reference Martos and Piccolo1988). Those seasonal changes appear to be well reflected by the domination of the fish-assemblage composition by the presence of species adapted to migrate in accordance with temperature (and salinity) fluctuations. We thus suggest that the core species enter into the bay in the early spring as warming occurs abruptly during the warmer months and then leave the bay during the early autumn until the beginning of winter because the cooling process is more uniform and prolonged (Bianchi et al., Reference Bianchi, Massoneau and Olivera1982). These modifying environmental conditions coupled with a shallow depth furthermore provide suitable habitat characteristics for the accommodation of species that move to coastal areas for reproduction, so that the influences of both the biotic and the abiotic variables are seen to come into play in combination. The relative influence of the abiotic and biotic factors in structuring fish communities has received much attention in recent years. Large-scale distribution patterns of fish are believed to result primarily from species responses to their physical environment (Martino & Able, Reference Martino and Able2003), but biotic interactions and biological responses could influence the fish-distribution patterns and structure on a smaller geographical scale (Menge & Olson, Reference Menge and Olson1990).
Knowledge about the temporal and spatial distributions of marine species in areas of high ecological and economic value such as Anegada Bay is a significant issue, particularly if those patterns involve habitats that are critically linked to the species' life history cycles. Moreover, since the core species of the Anegada Bay assemblage represent valuable commercial and recreational targets sustaining different kinds of inshore fishing activities over the entire distribution range, studies related to those species' natural movements and abundance patterns can provide valuable information for developing regional conservation programmes within an ecosystem-based fisheries management framework. Specifically, as was showed in this study since the core assemblages species use the bay seasonally mainly for reproduction, a comprehensive management plan should include not only the Anegada Bay as a protected area but also other shelf areas that become critical to complete species life cycles. This is specially relevant in the case of Chondrichthyan species where size of reproductive stocks are a key factor for successful recruitments (Massa, Reference Massa2013).
In addition, San Blas Bay is considered as the most important marine recreational fishery in Argentina where the highest catch per unit effort values, fishing effort and monthly catches occur during warmer months (Llompart et al., Reference Llompart, Colautti and Baigun2012). These facts are directly related to the present findings of fish arrival during spring and their permanence until late summer. Therefore further studies should be oriented to relate fish assemblage attributes to specific management guidelines in Anegada Bay to accommodate anglers' and local economy requirements, but at the same time to assure that fish assemblages structure and natural environmental conditions are not impaired. To achieve such goal a co-management and adaptative framework is encouraged as a sound strategy to protect key species and promote new regulations mainly during the time periods where the Anegada Bay is used as a nursery ground and recruitment area (Colautti et al., Reference Colautti, Baigun, Lopez, Llompart, Molina, Suquele and Calvo2010). Such an approach, still unexplored for recreational and artisanal coastal marine fisheries in Argentina, could represent an innovative but suitable strategy to maintain the sustainability of coastal fisheries in healthy environments. Thus this contribution provides the first guidelines to approach a new management strategy for coastal fisheries settled in a protected area within the Argentinean seas.
ACKNOWLEDGEMENT
The authors wish to thank Dr Donald F. Haggerty for editing the final version of the manuscript.
FINANCIAL SUPPORT
Financial support from the PAE No. 22666/04–ANPCyT is gratefully acknowledged.