1. Introduction
The Grenville Province is the result of a billion-year-old terminal orogeny believed to have substantial similarities with the modern Himalayas. Like the Himalayas, the Grenville orogen experienced crustal thickening up to twice the normal thickness (c. 60–70 km), and underwent gravitational collapse by thrusting (Rivers, Reference Rivers2012). A major part of understanding the tectonic structure and history of such orogenic belts is therefore the mapping of thrust locations and the reconstruction of their movement history.
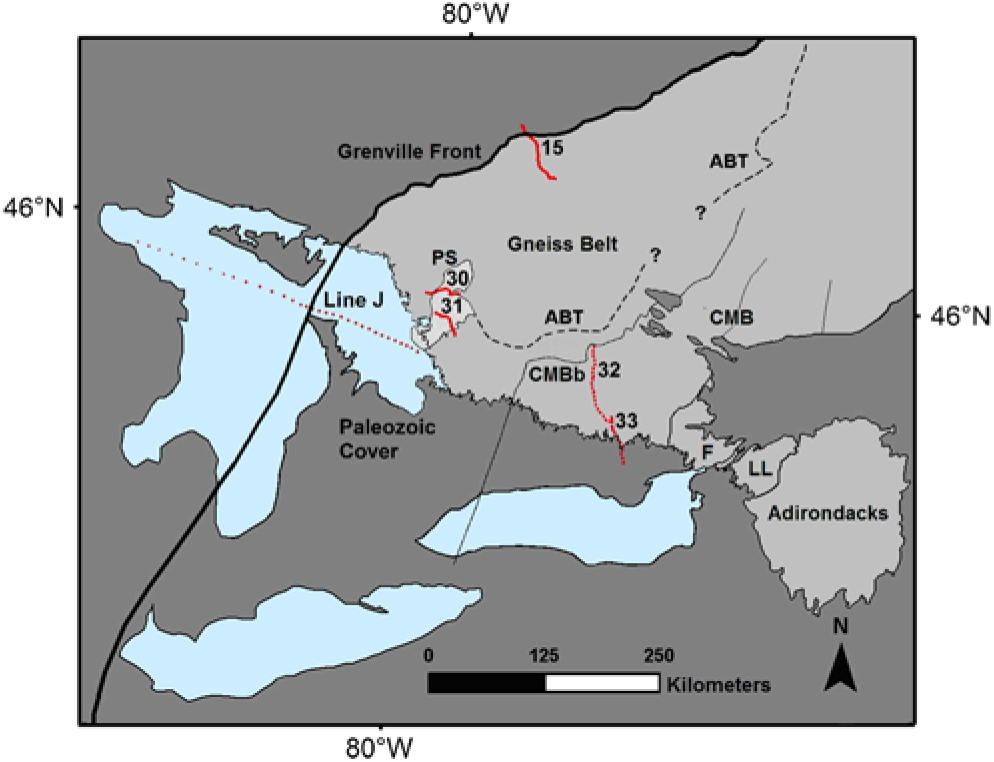
It is well established that the southern orogenic front of the Himalayas consists of a series of thrust sheets that progressively cut downwards into the foreland over several million years after the rapid rise of the Tibetan plateau and formation of an overcritical thrust wedge (Huyghe et al. Reference Huyghe, Galy, Mugnier and France-Lanord2001). However, the Grenville Province appears to have undergone multiple thrusting events over a much longer period of time and this has complicated our understanding of its tectonic history. Such problems are understandable in a complex orogenic belt such as the Grenville Province. However, more problematical is the lack of agreement about the present-day distribution and attitude of major crustal units that make up the Grenville Province. This disagreement comes into sharpest focus in the Ontario gneiss belt (Fig. 1), despite some of the most intensive geological study of any Precambrian orogen. Until the present-day configuration of crust in the Ontario Grenville Province is well established, it is difficult to make progress in understanding its geological evolution.
Map of the SW Grenville Province in Ontario and western Quebec showing the locations of seismic reflection profiles relative to the Grenville Front, the Central Metasedimentary Belt boundary (CMBb) and the Parry Sound domain (PS), and the location of the Allochthon Boundary Thrust (ABT) proposed by Rivers et al. (Reference Rivers, Martignole, Gower and Davidson1989).

Understanding the structure of an orogenic belt may be considered in two stages. The first stage involves mapping the surface configuration of lithotectonic units, such as structural domains and crustal terranes. However, such an understanding can only be considered mature when the three-dimensional (3D) structure of the crust can be specified with scientifically based confidence.
Neodymium isotope analysis has been shown to be a powerful tool for mapping crustal terranes in complex and deeply exhumed orogenic belts such as the Grenville Province (Dickin, Reference Dickin2018). While Nd isotope mapping in the Grenville Province has not been universally embraced, there has been no significant challenge in the published literature to the results and conclusions drawn from this work (Dickin, Reference Dickin2000; Dickin et al. Reference Dickin, Cooper, Guo, Hutton, Martin, Sharma and Zelek2012, Reference Dickin, Herrell, Moore, Cooper and Pearson2014). However, to claim a mature understanding of the orogen as a basis for understanding its tectonic evolution, it is important to present a detailed and well-justified 3D crustal model. This paper therefore presents a virtual 3D model of the Ontario gneiss belt using the software package SketchUp. The 3D model expands on the tectonic interpretation derived from seismic reflection profiles and detailed Nd isotope results of the Grenville Province in Ontario (Dickin et al. Reference Dickin, Strong, Arcuri, Van Kessel and Krivankova-Smal2017; Dickin & Strong, Reference Dickin and Strong2019). On the firmly demonstrated basis of this tectonic model, we go on to interpret the large-scale tectonic evolution of the Ontario Grenville Province, arguing that this involved top-down control of the locations of major thrusts which originated from the structure of a failed back-arc rift zone that forms parts of the Grenvillian Central Metasedimentary Belt.
2. History of Grenville research
In the early 1970s and 80s, geological mapping in the SW Grenville Province began to delineate major lithotectonic domains of the Grenville Province and their bounding shear zones. The earliest work (Wynne-Edwards, Reference Wynne-Edwards, Price and Douglas1972) recognized the importance of thrusting in the Grenville Front Tectonic Zone and the Central Metasedimentary Belt boundary thrust zone. This work was developed by Davidson (Reference Davidson1984, Reference Davidson, Tobi and Touret1985), who proposed the existence of a third major thrust underlying Parry Sound domain. A cross-section summarizing this work is shown in Figure 2a (as redrawn by Nadeau & Hanmer, Reference Nadeau and Hanmer1992). The ages on the cross-section show that thrusting on the Grenville Front was conceived as beginning earlier than the thrusts higher in the section (although the duration of thrusting was unknown). It was therefore reasonable that all three major thrust zones had a sub-parallel trajectory around the major deflection of the Grenville Province in Ontario, recognized as the ‘Big Bend’ (Schwerdtner, Reference Schwerdtner1987).
Cross-sections of the Ontario gneiss belt: (a) after Davidson (Reference Davidson1984) and Nadeau & Hanmer (Reference Nadeau and Hanmer1992), numbered according to their structural levels; and (b) after Rivers (Reference Rivers2008) and Rivers & Schwerdtner (Reference Rivers and Schwerdtner2015), with dotted units representing the distribution of coronitic olivine metagabbro.

Based on early fieldwork, it appeared that the deformation zone to the NW of Parry Sound domain might be correlative with a major thrust zone identified in the central and eastern parts of the Grenville Province (Rivers & Chown, 1986). Rivers & Chown termed the latter boundary the Allochthon Boundary Thrust, because it separated a belt of relatively in situ crust to the NW (the Parautochthonous Belt) from far-travelled thrust sheets to the SE, forming ‘allochthonous’ belts. However, use of this term does not mean that these thrust sheets are exotic to Laurentia.
This work led to the orogen-wide tectonic classification of Rivers et al. (Reference Rivers, Martignole, Gower and Davidson1989), including the Allochthon Boundary Thrust trajectory in Ontario shown in Figure 1. This mapping also identified areas of the SW Grenville Province that appeared not to have experienced any pre-Grenvillian metamorphism. These areas were identified as the Allochthonous Monocyclic Belt, and largely coincide with the Central Metasedimentary Belt of Wynne-Edwards (Reference Wynne-Edwards, Price and Douglas1972).
Seismic surveys began in the late 1980s as part of the Great Lakes International Multidisciplinary Program on Crustal Evolution (GLIMPCE). GLIMPCE produced several transects, one of which crossed Lake Huron and Georgian Bay, termed GLIMPCE line J (Green et al. Reference Green, Milkereit, Davidson, Spenser, Hutchinson and Cannon1988). GLIMPCE line J imaged the Grenville Front, Grenville Front Tectonic Zone and the Superior Province foreland (Fig. 1). In the 1990s the Lithoprobe programme continued this work. Lithoprobe Abitibi-Grenville seismic surveys used in the present study include lines 15, 31 and 32 (Fig. 1). Line 15 imaged the Grenville Front (Kellet et al. Reference Kellet, Barnes and Rive1994), while lines 31 and 32 transected the Parry Sound domain and the Central Metasedimentary Belt boundary (White et al. Reference White, Easton, Culshaw, Milkereit, Forsythe, Carr, Green and Davidson1994).
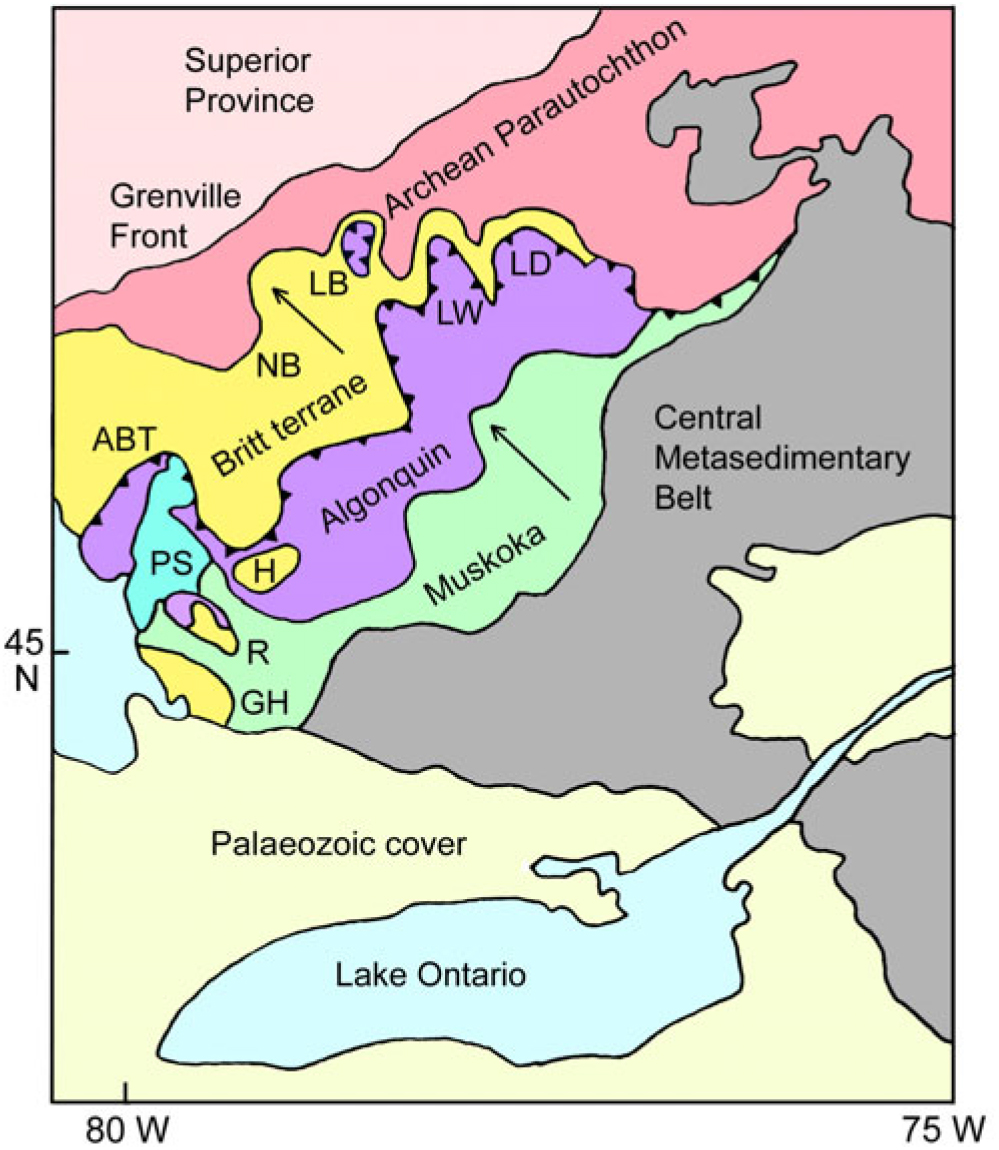
Examination of Lithoprobe line 31 across the Parry Sound domain showed that there was a significant reflector deeper in the section than the basal Parry Sound shear zone. White et al. (Reference White, Easton, Culshaw, Milkereit, Forsythe, Carr, Green and Davidson1994) correlated this reflector with a shear zone up to 30 km north of Parry Sound domain that had been identified in the field by Jamieson et al. (Reference Jamieson, Culshaw, Wodicka, Corrigan and Ketchum1992). On the basis of this correlation, Davidson (Reference Davidson1995) identified this shear zone as the local expression of the Allochthon Boundary Thrust, and proposed a modified tectonic framework for the SW Grenville province (Fig. 3).
Map of the SW Grenville Province redrafted after Davidson (Reference Davidson1995). The transport direction of thrusts is indicated by the arrows. ABT – Allochthon Boundary Thrust; PS – Parry Sound domain; LB – Lac Booth klippe; LW – Lac Watson nappe; LD – Lac Dumoine nappe; GH – Go Home window; R – Rosseau window; H – Huntsville window; NB – North Bay.

In this model, Davidson (Reference Davidson1995) proposed that the trace of the Allochthon Boundary Thrust identified north of Parry Sound (later termed the Shawanaga shear zone) could be correlated with the sole thrust of major nappes in Quebec, later termed the Lac Watson and Lac Dumoine nappes (LW, LD, Fig. 3). This promoted the idea of a complete trajectory for the Allochthon Boundary Thrust across Ontario (line of thrust (ABT) shown in Fig. 3). Davidson also subdivided the overlying Allochthonous Polycyclic Belt into two structural decks, forming the Algonquin and Muskoka domains (Fig. 3).
Davidson’s (1995) model identified windows through the Allochthonous Polycyclic Belt to the Parautochthonous Belt on the basis of correlated lithologies in the regions of Go Home, Rosseau and Huntsville. This model also recognized a tectonic outlier near Lac Booth (LB, Fig. 3) on the basis of previous geological mapping and Lithoprobe line 15 (Rive, 1981; Kellet et al. Reference Kellet, Barnes and Rive1994). The tectonic model was supported by the identification of retrogressed eclogite in the Lac Watson shear zone by Indares & Dunning (Reference Indares and Dunning1997). They reported an igneous precursor age of 1403+14–11 Ma, but a younger metamorphic age of c. 1050 Ma, suggesting that the formation of eclogitic mineral assemblages occurred during the Grenville Orogeny. The Lac Watson Shear Zone was therefore identified as the local expression of the Allochthon Boundary Thrust, and correlated with the Shawanaga shear zone on the shores of Georgian Bay (Culshaw et al. Reference Culshaw, Jamieson, Ketchum, Wodicka, Corrigan and Reynolds1997).
Due to multiple episodes of metamorphism and strong crustal exhumation, the Allochthon Boundary Thrust in Ontario juxtaposes high-grade gneisses on both sides of the boundary. This impedes lithological mapping of the boundary and the problem is exacerbated by extensive glacial cover, making it difficult to trace the shear zone across country. However, Culshaw et al. (Reference Culshaw, Ketchum, Wodicka and Wallace1994) had previously proposed that the different geological histories of terranes on opposite sides of the Allochthon Boundary Thrust could be used as proxy mapping tools in order to trace the boundary.
Ketchum & Davidson (Reference Ketchum and Davidson2000) developed this approach based on the occurrence of distinct suites of metabasic rocks on either side of the Allochthon Boundary Thrust. They argued that lateral equivalents of 1240 Ma Sudbury diabase were restricted to the Parautochthon, whereas retrogressed eclogites and 1170–1150 Ma coronitic olivine metagabbros were restricted to the Allochthonous Polycyclic Belt. Ketchum & Davidson also observed that rock types characteristic of the allochthonous belt were abundant in the North Bay area (NB, Fig. 3). As a result, Ketchum & Davidson (Reference Ketchum and Davidson2000) included this area as part of the allochthon, and proposed a new trajectory for the Allochthon Boundary Thrust that was much further to the north than previously conceived. This trajectory was adopted by Rivers et al. (Reference Rivers, Ketchum, Indares and Hynes2002) and subsequent papers by these authors, including Rivers (Reference Rivers2008) and Rivers & Schwerdtner (Reference Rivers and Schwerdtner2015). It led to the cross-section shown in Figure 2b, where the Allochthon Boundary Thrust is drawn essentially sub-parallel to the Grenville Front Tectonic Zone, with a relatively smooth SE-wards dip across the whole Ontario gneiss belt. However, the scientific basis for this northerly trajectory of the Allochthon Boundary Thrust was always speculative, since metabasic rocks are very sporadically distributed in the gneiss belt as a whole, making this a weak basis for correlating the Allochthon Boundary Thrust across large distances.
3. Nd isotope mapping
Another proxy tool that can be used to map major lithotectonic boundaries is the Sm-Nd isotope method. Nd isotope mapping is based on the depleted mantle model of DePaolo (Reference DePaolo1981), which allows precise estimates to be made of the formation ages of crustal terranes provided they have distinct mantle or crustal reservoir sources. The mapping of Grenvillian terranes in Ontario is based on evidence that they were part of a long-lived Proterozoic continental margin, which saw the accretion of progressively younger terranes on its outboard edge (Dickin & McNutt, 1990; Slagstad et al. Reference Slagstad, Culsha, Daly and Jamieson2009). This composite margin was telescoped by the Grenville Orogen between c. 1.2 and 1.0 Ga, juxtaposing terranes with distinct formation ages along major shear zones. The distinct Nd isotope signatures of different terranes therefore allow for the clear determination of the lithotectonic boundaries between them (Dickin, Reference Dickin2000).
Because crustal formation ages can be determined on most granitoid orthogneisses, Nd isotope mapping can be applied with high spatial resolution to almost any bedrock exposure of the gneiss belt. For example, Nd isotope mapping was used in the North Bay area to show that the allochthonous crustal domain with eclogites and coronitic olivine metagabbros identified by Ketchum & Davidson (Reference Ketchum and Davidson2000) is surrounded by Palaeoproterozoic gneisses of the Parautochthonous Belt (Dickin & McNutt, Reference Dickin and McNutt2003). The allochthonous crust at North Bay is therefore a tectonic outlier, analogous to the previously identified Lac Booth klippe in Quebec. This is one of several klippen that have been identified in the SW Grenville Province, on the basis of detailed Nd isotope mapping (Fig. 4; Dickin et al. Reference Dickin, Herrell, Moore, Cooper and Pearson2014).
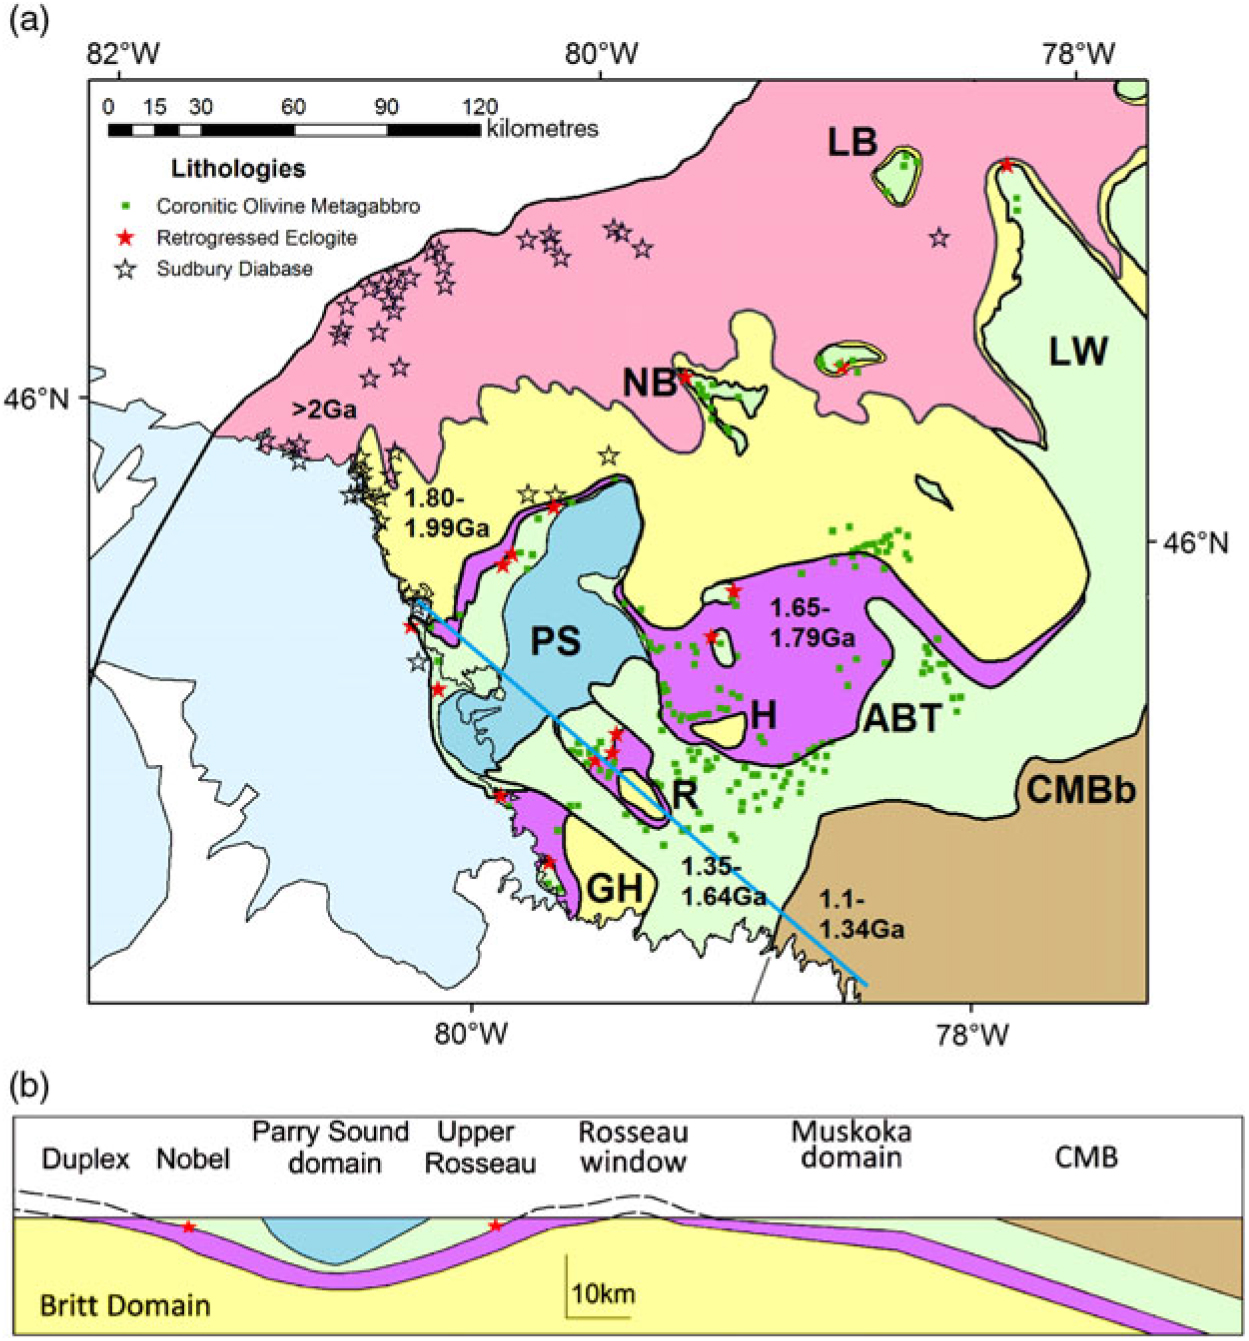
(a) Tectonic map of the SW Grenville Province showing terranes categorized by depleted mantle model (TDM) ages: pink, > 2 Ga; yellow, 1.8–1.99 Ga; mauve, 1.65–1.79 Ga; green, 1.35–1.64 Ga. Red stars, eclogite; transparent stars, Sudbury metadiabase; green squares, coronitic olivine metagabbro. CMBb – Central Metasedimentary Belt boundary. Other abbreviations as for Figure 3. (b) Cross-section with no vertical exaggeration along the solid blue line in (a).

Figure 4a is a map of the crustal structure of the SW Grenville Province, based on Nd isotope mapping summarized by Dickin et al. (Reference Dickin, Strong, Arcuri, Van Kessel and Krivankova-Smal2017). This work showed that the surface trajectory of the Allochthon Boundary Thrust is close to the position originally proposed by Rivers et al. (Reference Rivers, Martignole, Gower and Davidson1989), along the basal shear zone of the Mesoproterozoic Muskoka domain. On the corresponding cross-section (Fig. 4b), the Allochthon Boundary Thrust has an overall ramp-flat structure (Dickin et al. Reference Dickin, Herrell, Moore, Cooper and Pearson2014), modified by the loading effect of dense rocks in Parry Sound domain. The terminology ‘ramp-flat’ was originally applied as a geometrical description to the Allochthon Boundary Thrust in the eastern Grenville Province (Rivers et al. Reference Rivers, Ketchum, Indares and Hynes2002, Reference Rivers, Culshaw, Hynes, Indares, Jamieson, Martignole, Percival, Cook and Clowes2012). This description was extended into the SW Grenville Province after reinterpretation of Lithoprobe line 31 (Dickin et al. Reference Dickin, Herrell, Moore, Cooper and Pearson2014). Red stars on the cross-section indicate retrogressed eclogite, and their location shows that the Allochthon Boundary Thrust was a locus of exhumation on a crustal-scale ramp (Rivers et al. Reference Rivers, van Gool and Connelly1993; Indares & Dunning Reference Indares and Dunning1997). Seismic reflection evidence supports a model in which the main ramp of the Allochthon Boundary Thrust lies only a few kilometres down-section from the Central Metasedimentary Belt boundary, contradicting the model of Rivers (Reference Rivers2008) and Rivers & Schwerdtner (Reference Rivers and Schwerdtner2015), which places the Allochthon Boundary Thrust sub-parallel to the Grenville Front Tectonic Zone along a shallow dipping trajectory (Fig. 2b).
The large-scale structural context in Figure 4 (colour online) shows that the rocks of Algonquin domain (purple colour) are strictly neither parautochthonous nor allochthonous, but form a duplex that underlies the main allochthon. This structure is more clearly seen in the northeastern part of Figure 4a, where the duplex forms a narrow strip of Palaeoproterozoic crust (yellow shading) between Archean basement (pink) and the overlying allochthon (green). However, the duplex structure NW of Parry Sound has younger crustal formation ages than at Lac Watson because the more southerly crustal units around Parry Sound were generated outboard of the Archaean craton on the Proterozoic active continental margin (Dickin et al. Reference Dickin, Strong, Arcuri, Van Kessel and Krivankova-Smal2017). As a result, the deepest structural level around Parry Sound has a Nd model age range of 1.82–2.0 Ga (Dickin & McNutt, Reference Dickin and McNutt1989; Dickin et al. Reference Dickin, McNutt and Clifford1990), while the duplex in this vicinity has a model age range of 1.65–1.79 Ga and the allochthon has a model age range of 1.35–1.65 Ga (Dickin & North, Reference Dickin and North2015).
Windows through the allochthon and tectonic duplex expose crust with model ages of greater than 1.8 Ga in the regions of Go Home, Rosseau and Huntsville (GH, R, H, Fig. 4a) which is typical of Parautochthonous crust to the north. The existence of these tectonic windows is important for understanding the large-scale structure of the crust, because they constrain the location of the main ramp of the Allochthon Boundary Thrust on the west side of the Central Metasedimentary Belt (Fig. 4b, cross-section). This is necessary, because there is no seismic reflection profile near the line of section in Figure 4a. On the other hand, Lithoprobe line 32 provides detailed evidence for the crustal structure further east.
4. Seismic reflection cross-section
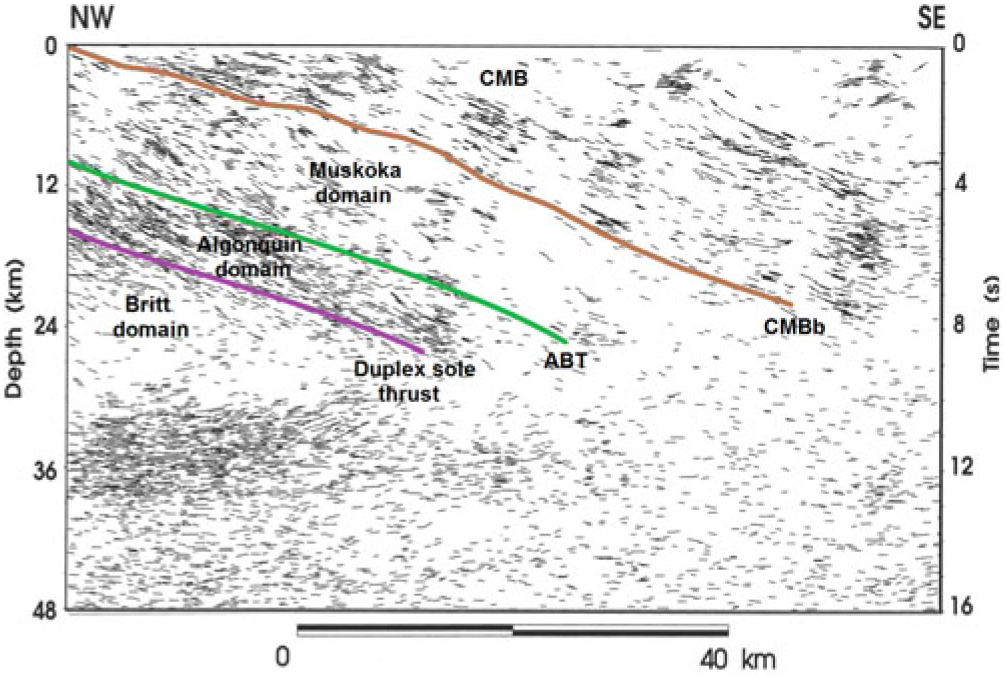
The Lithoprobe line 32 reflection profile (for location see Fig. 1) provides more detail on the crustal structure inferred from Nd isotope mapping as a result of strong reflectors highlighting the high-strain zones. This profile is shown in Figure 5 as a high-resolution line drawing of the migrated, coherency-filtered seismic data (White et al. Reference White, Easton, Culshaw, Milkereit, Forsythe, Carr, Green and Davidson1994; Davidson, Reference Davidson1995).
High-resolution migrated, coherency-filtered line drawing of Lithoprobe line 32 showing the location at depth of the Central Metasedimentary Belt boundary (CMBb), Allochthon Boundary Thrust (ABT) and Duplex sole thrust. Modified from Davidson (Reference Davidson1995) and first published by White et al. (Reference White, Easton, Culshaw, Milkereit, Forsythe, Carr, Green and Davidson1994).

On this profile the Central Metasedimentary Belt boundary is easily identifiable below a thick (c. 6 km) band of strong reflectivity that dips coherently at 20–25° to the SE. The highly reflective band is probably formed by marble tectonites and straight gneisses. Below the Central Metasedimentary Belt boundary, the main body of the allochthon (Muskoka domain) forms a 9–10 km thick package with slightly sinuous but generally weak reflectivity. It is important to note that the Muskoka domain has a constant thickness from just below the surface to mid crustal depths. This shows that the Central Metasedimentary Belt boundary and the Allochthon Boundary Thrust are parallel thrust planes, and gives us confidence that the Muskoka domain can be extrapolated laterally as a sheet of approximately constant thickness. On the other hand, the upper 2 km of the Central Metasedimentary Belt boundary may have a slightly lower dip on the seismic section due to the deflection in its boundary to the west of the seismic profile (Fig. 1).
Below the Allochthon Boundary Thrust is a much more strongly reflective layer about 5 km thick which we interpret as a tectonic duplex (Algonquin domain) that underlies the main allochthon. The base of the highly reflective layer is interpreted as the sole thrust of the duplex, overlying the much less reflective rocks of the parautochthonous Britt domain. The reflectivity within the duplex is steeper than its upper and lower bounding thrusts, suggesting that it consists of an imbricated stack of small slices, consistent with the conventional definition of a duplex (Boyer & Elliott, Reference Boyer and Elliott1982; Mitra & Boyer, Reference Mitra and Boyer1986). The imbricate structure of the duplex is supported by structural mapping north of Parry Sound identifying a small SE-plunging cylindrically folded window of Parautochthon within the duplex (Culshaw et al. Reference Culshaw, Ketchum, Wodicka and Wallace1994) from thrust patterns in the Algonquin domain identifying a series of overlapping (imbricated) sub-domains (Culshaw et al. Reference Culshaw, Foster, Marsh, Slagstad and Gerbi2016), and by new Nd isotope mapping in Algonquin Park (Dickin & Strong, Reference Dickin and Strong2019).
The base of the duplex is well exposed in the Huntsville area, where moderately foliated gneisses of the Parautochthon are seen in a window (Fig. 4a). Overlying this window in the vicinity of Highway 60, the overlying duplex (Algonquin domain) consists of highly strained orthogneisses that are quarried for use as flagstone. This section was described by Nadeau & Hanmer (Reference Nadeau and Hanmer1992) as a “5km thick zone of penetratively developed granoblastic mylonites”. Elsewhere, the top of the duplex (representing the Allochthon Boundary Thrust) is best exposed on the eastern shore of Georgian Bay, where it carries several large eclogite pods (Fig. 4a). The highly strained character and widespread imbrication of the duplex highlights its role as a zone of diffuse shear separating the deeply exhumed rocks of the allochthon from the largely in situ rocks of the Parautochthon.
The trajectory of the Allochthon Boundary Thrust was mapped in detail from Georgian Bay to Highway 69 by Culshaw et al. (Reference Culshaw, Corrigan, Ketchum, Wallace and Wodicka2004). This locality is also important for a correct understanding of the distribution of metabasic rocks. A U–Pb dated locality of coronitic olivine metagabbro is located within the duplex, structurally below the mapped location of the Allochthon Boundary Thrust (Heaman & LeCheminant, Reference Heaman and LeCheminant1993; Culshaw et al. Reference Culshaw, Corrigan, Ketchum, Wallace and Wodicka2004). This is consistent with the widespread distribution of coronitic olivine metagabbro within both the Algonquin and Muskoka domains (Fig. 4), representing the duplex and the main allochthon, respectively. The coherent picture of the tectonic structure for the SW Grenville Province, based on seismic, petrological and isotopic observations, provides the basis for our 3D model.
5. SketchUp visualization
SketchUp is freeware that was developed to construct 3D 1:1 real-world structures using lines and closed polygons to create surfaces (Trimble Navigation Limited, http://www.sketchup.com). Using SketchUp, it is possible to manipulate polygons and surfaces in Cartesian xyz space, allowing the depiction of complex structures with measurable dimensions. Surfaces can be uniquely textured, so that 2D images such as seismic reflection profiles can be represented in 3D space (Strong, Reference Strong2015).
The tectonic boundaries imaged on regional seismic transects were anchored to the Nd isotope boundaries using SketchUp. First, seismic fences of the GLIMPCE and Lithoprobe surveys were placed in 3D space. Following the set-up of surface boundaries and seismic fences, subsurface tectonic boundaries in the seismic transects were correlated with the Nd isotope boundaries at the surface. Using this approach it was possible to visualize the major lithotectonic boundaries of the SW Grenville Province for the first time in 3D (Strong, Reference Strong2015).
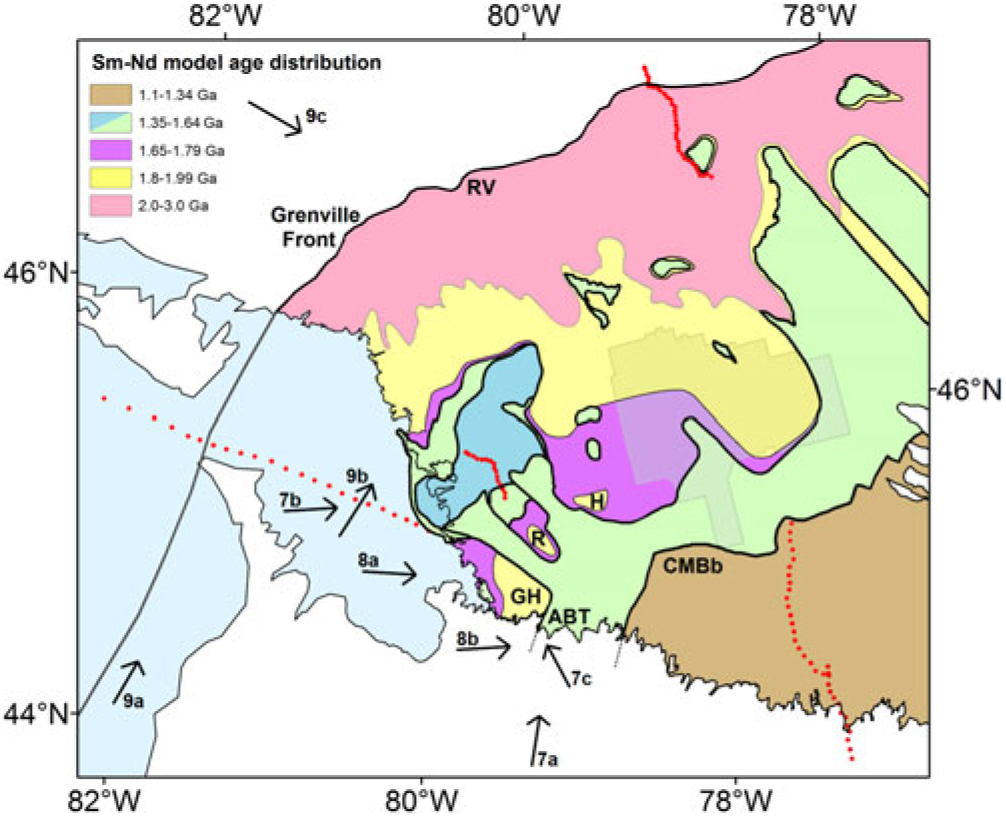
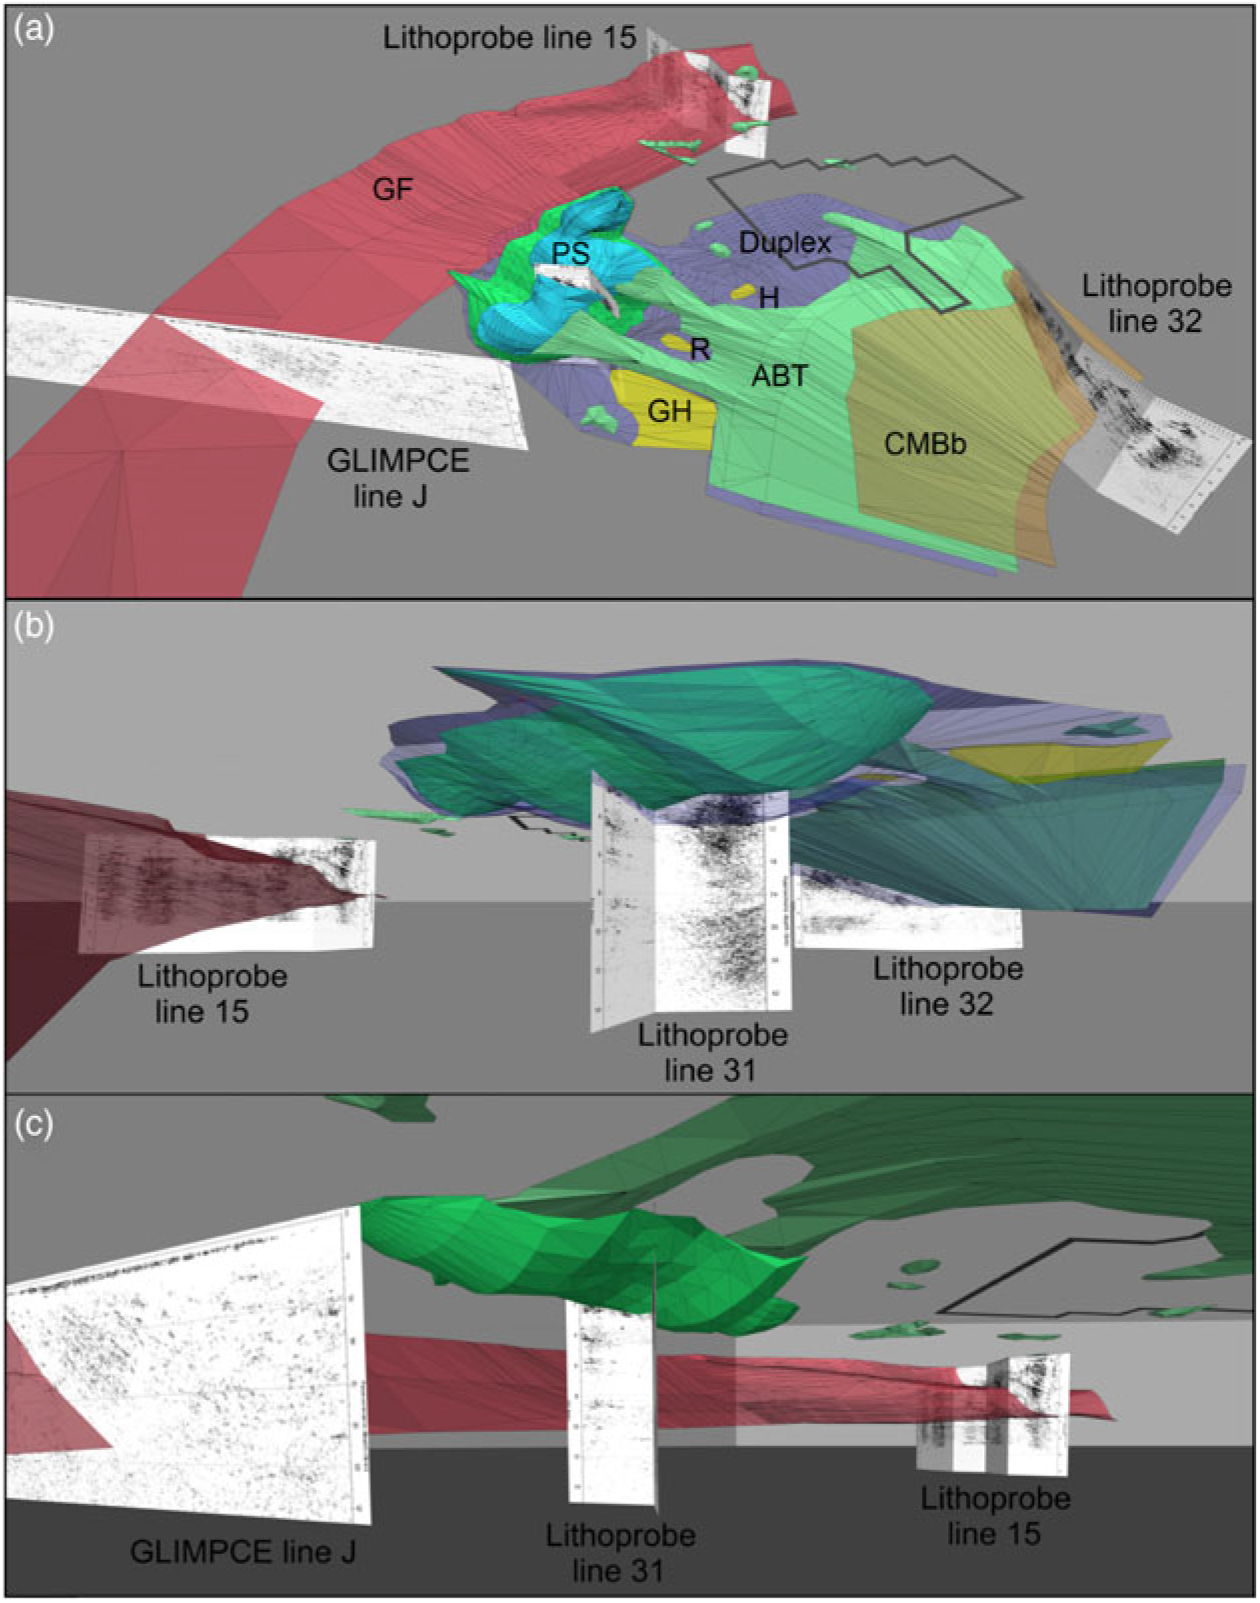
The results are shown as a series of snapshots of the 3D model and in the online supplementary material as a fly-through animation (available at http://journals.cambridge.org/geo). In the discussion, we describe the structural understanding of the SW Grenville Province that is embodied in the 3D model. Figure 6 displays the approximate location and direction for views of the 3D model in Figures 7, 8 and 9.

Overview of the 3D model and the subsurface geometry of the Parry Sound domain and underlying allochthonous thrust sheets. Overview of the model from (a) south of Georgian Bay above the surface; (b) west of Parry Sound and below the surface; and (c) south and below the surface of Parry Sound excluding the duplex. See Figure 6 for viewing direction. Abbreviations as for Figures 3 and 4.

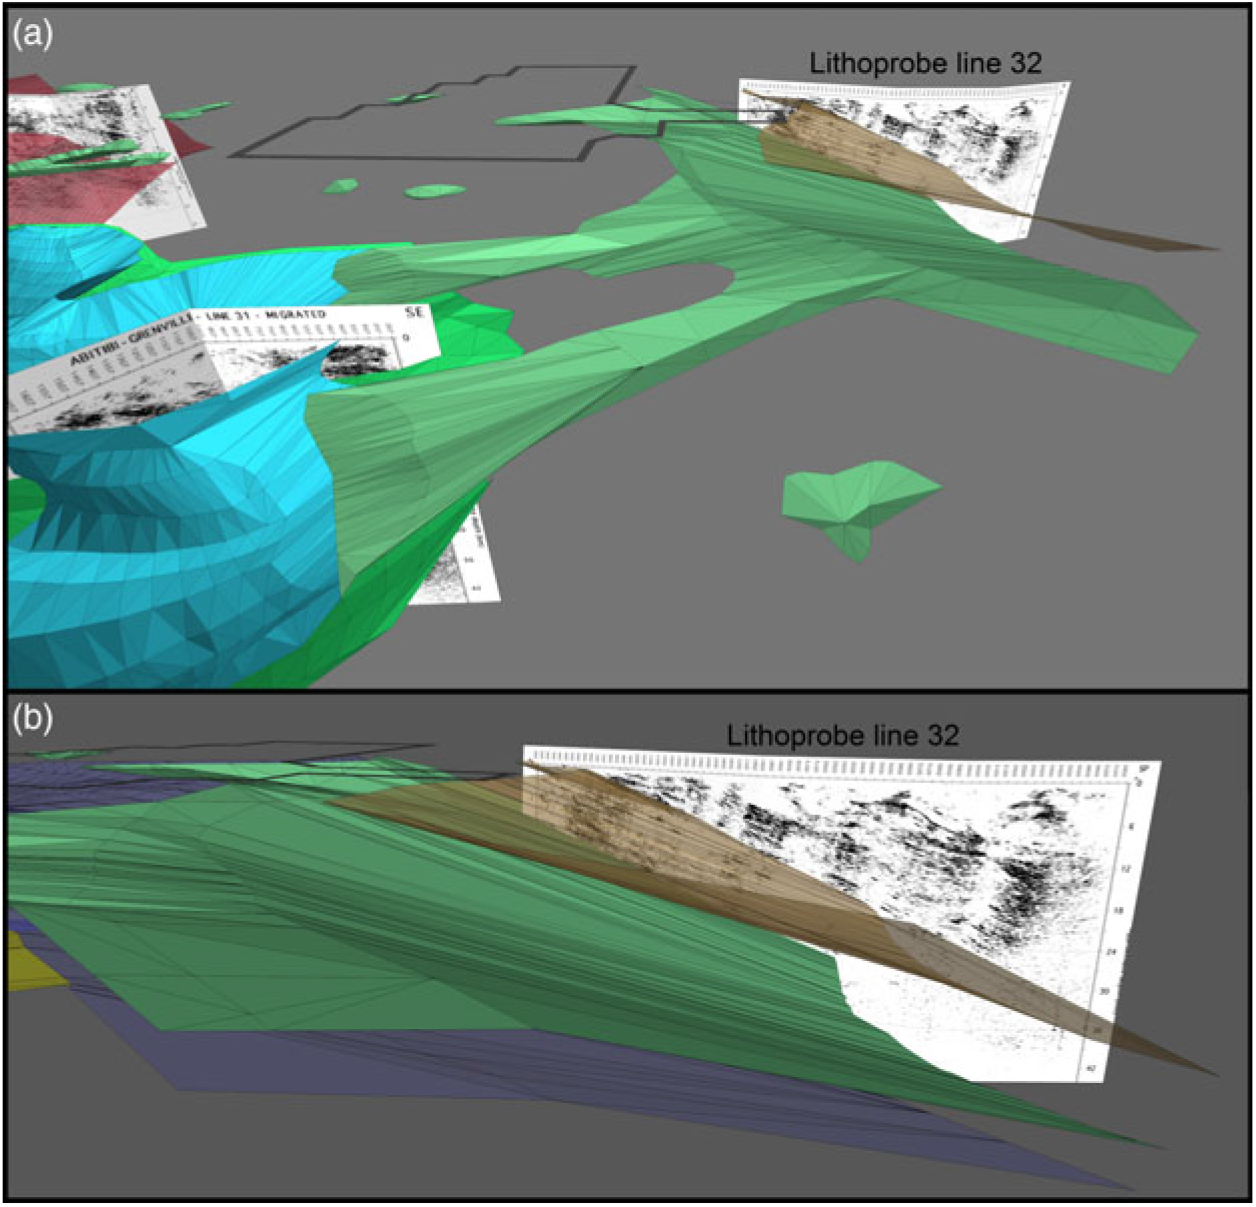
Views of the tectonic windows, the duplex sole thrust, the Allochthon Boundary Thrust and the Central Metasedimentary Belt boundary: (a) from above the Parry Sound domain looking towards the Central Metasedimentary Belt and down the main ramps; and (b) from above the surface from the west of the Go Home window looking towards the sub-parallel main ramps. See Figure 6 for viewing direction.

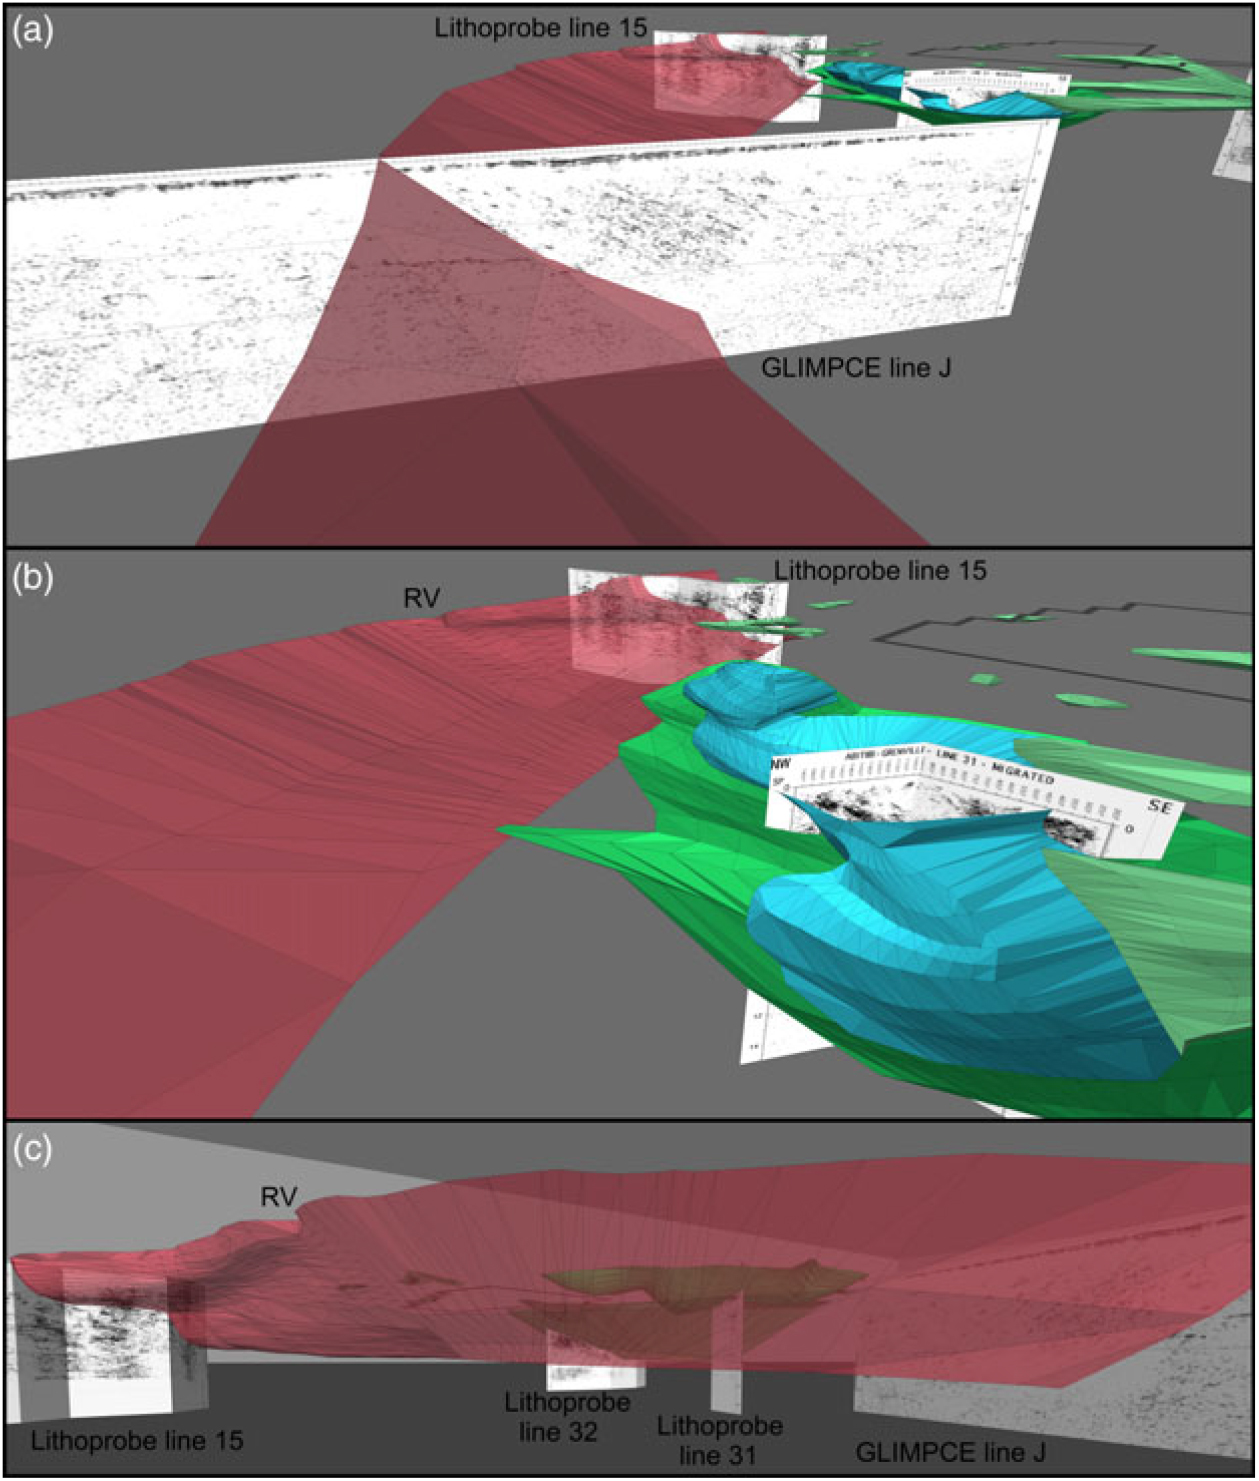
View of the Grenville Front: (a) GLIMPCE line J from the south and above the surface; (b) Lithoprobe line 15 from west of the Parry Sound domain and above the surface; and (c) the curvature of the Grenville Front in the Big Bend from the north and below the surface. See Figure 6 for viewing direction.

This visualization begins with the Parry Sound domain, which has a well-understood multi-lobed structure with an abundance of high-density mafic lithologies. These high-density lithologies gave rise to well-defined basal reflectors on Lithoprobe line 31 (White et al. Reference White, Easton, Culshaw, Milkereit, Forsythe, Carr, Green and Davidson1994), which can be coupled with gravity surveys (Lindia et al. Reference Lindia, Thomas and Davidson1983) to enable tracing of the basal shear zone in 3D. The Parry Sound domain was used to test the 3D visualization of crustal-scale geological structures using SketchUp (Strong, Reference Strong2015). Figure 7a is a wide-angle view from above the surface of the SW Grenville Province showing the Central Metasedimentary Belt boundary, the basal Parry Sound shear zone, the Allochthon Boundary Thrust, the duplex sole thrust and the Grenville Front. Figure 7b shows the deflection of the Allochthon Boundary Thrust and duplex sole thrust below the Parry Sound domain, which resembles an orogenic-scale load cast with three distinct synformal lobes (Strong, Reference Strong2015). The duplex is removed in Figure 7c to allow for a clearer view of the Allochthon Boundary Thrust below the Parry Sound domain.
Key evidence in the form of tectonic windows places the Allochthon Boundary Thrust ramp to the SE of these windows and sub-parallel with the Central Metasedimentary Belt boundary. The windows require that the Allochthon Boundary Thrust and duplex sole thrust ramps reach an inflection point where the shear zones change from SE-dipping ramps to sub-horizontal thrust sheets. The Allochthon Boundary Thrust ramp dips 20–25° to the SE and becomes a sub-horizontal thrust sheet to the NW of the inflection point (Fig. 8a). Further east, the Allochthon Boundary Thrust ramp is observed on Lithoprobe line 32 as the upper boundary of a zone of strong SE-dipping reflectors, starting at c. 9–10 km depth at the northern end of the profile (Fig. 5). These seismic reflectors anchor the angle of the Allochthon Boundary Thrust, which runs sub-parallel to the duplex sole thrust (Fig. 8b). The 3D visualization therefore shows how these boundaries follow in a sub-parallel manner round the NW end of the Central Metasedimentary Belt.
The Central Metasedimentary Belt boundary thrust represents the reactivated margin of an Elzevirian-age back-arc continental rift (Dickin & McNutt, Reference Dickin and McNutt2007). The back-arc rift consisted of a series of en échelon segments where the c. 90° bend of the Central Metasedimentary Belt in Ontario (Fig. 1) represents the northern termination of one N-trending rift segment (Dickin et al. Reference Dickin, Hynes, Strong and Wisborg2016). The segmented geometry of the Central Metasedimentary Belt back-arc rift was preserved by the reactivation of marginal listric faults during the first (Shawinigan) phase of the Grenville Orogeny. Further reactivation of the Central Metasedimentary Belt boundary controlled the location and structure of the underlying Allochthon Boundary Thrust ramp and duplex sole thrust in the second (Ottawan) phase of the Grenville Orogeny. Evidence for the timing of these events is discussed in more detail below.
Dickin & North (Reference Dickin and North2015) argued that the Central Metasedimentary Belt boundary, Allochthon Boundary Thrust and Grenville Front represent a series of structures with progressively gentler curvature that controlled the shape of the Big Bend. The Central Metasedimentary Belt boundary exhibits the tightest curvature with the oldest metamorphic age, the Allochthon Boundary Thrust displays intermediate curvature and intermediate metamorphic age, while the Grenville Front has the most gentle curvature and youngest metamorphic age (Fig. 4). The correlation between sharpness of curvature and metamorphic age of thrusting is the result of progressive NW-directed migration of the locus of thrusting during the Grenville Orogenic Cycle (Rivers, Reference Rivers2008). This NW-directed migration of the locus of thrusting also affected the 3D structure of the major lithotectonic boundaries by superimposing the thrust structure from the top-down. The top-down superimposition of thrust structure has resulted in widespread ramp-flat geometry of the major lithotectonic boundaries in the SW Grenville Province.
The Grenville Front formed in the final event of the Grenville Orogenic Cycle (Rivers, Reference Rivers2008), implying it was likely influenced by tectonic structures that developed in preceding orogenic events. In addition to its surface trajectory that forms the Big Bend, the Grenville Front also displays changing subsurface geometry between GLIMPCE line J and Lithoprobe line 15. This subsurface geometry transitions from parallel linear dipping reflectors in GLIMPCE line J to a truncated ramp-flat geometry in Lithoprobe line 15 (Fig. 9a–b). The transition likely occurs in the vicinity of the River Valley complex (RV, Fig. 9b) where rocks of the River Valley complex are imbricated with rocks of the Huron Supergroup (Davidson, Reference Davidson1986), causing the expression of a narrow fold-thrust belt such that the northern boundary of the Grenville Front Tectonic Zone is located 4 km south of the Grenville Front (Rivers et al. Reference Rivers, van Gool and Connelly1993), coinciding with a decrease in shear towards the east of the River Valley complex (Dickin, Reference Dickin1998).
Based on the 3D model the structural transition of the Grenville Front in the River Valley area is correlated with the proximity of allochthonous crust to the Grenville Front. For example, the allochthonous Lac Booth klippe is located c. 50 km from the Grenville Front (Fig. 9b), whereas along Georgian Bay the allochthonous units are c. 100 km from the Front. These factors suggest the Grenville Front begins to step down below the surface towards the east of the River Valley complex, forming the truncated ramp-flat geometry imaged on Lithoprobe line 15 (Fig. 9b–c).
6. Metamorphic age progression
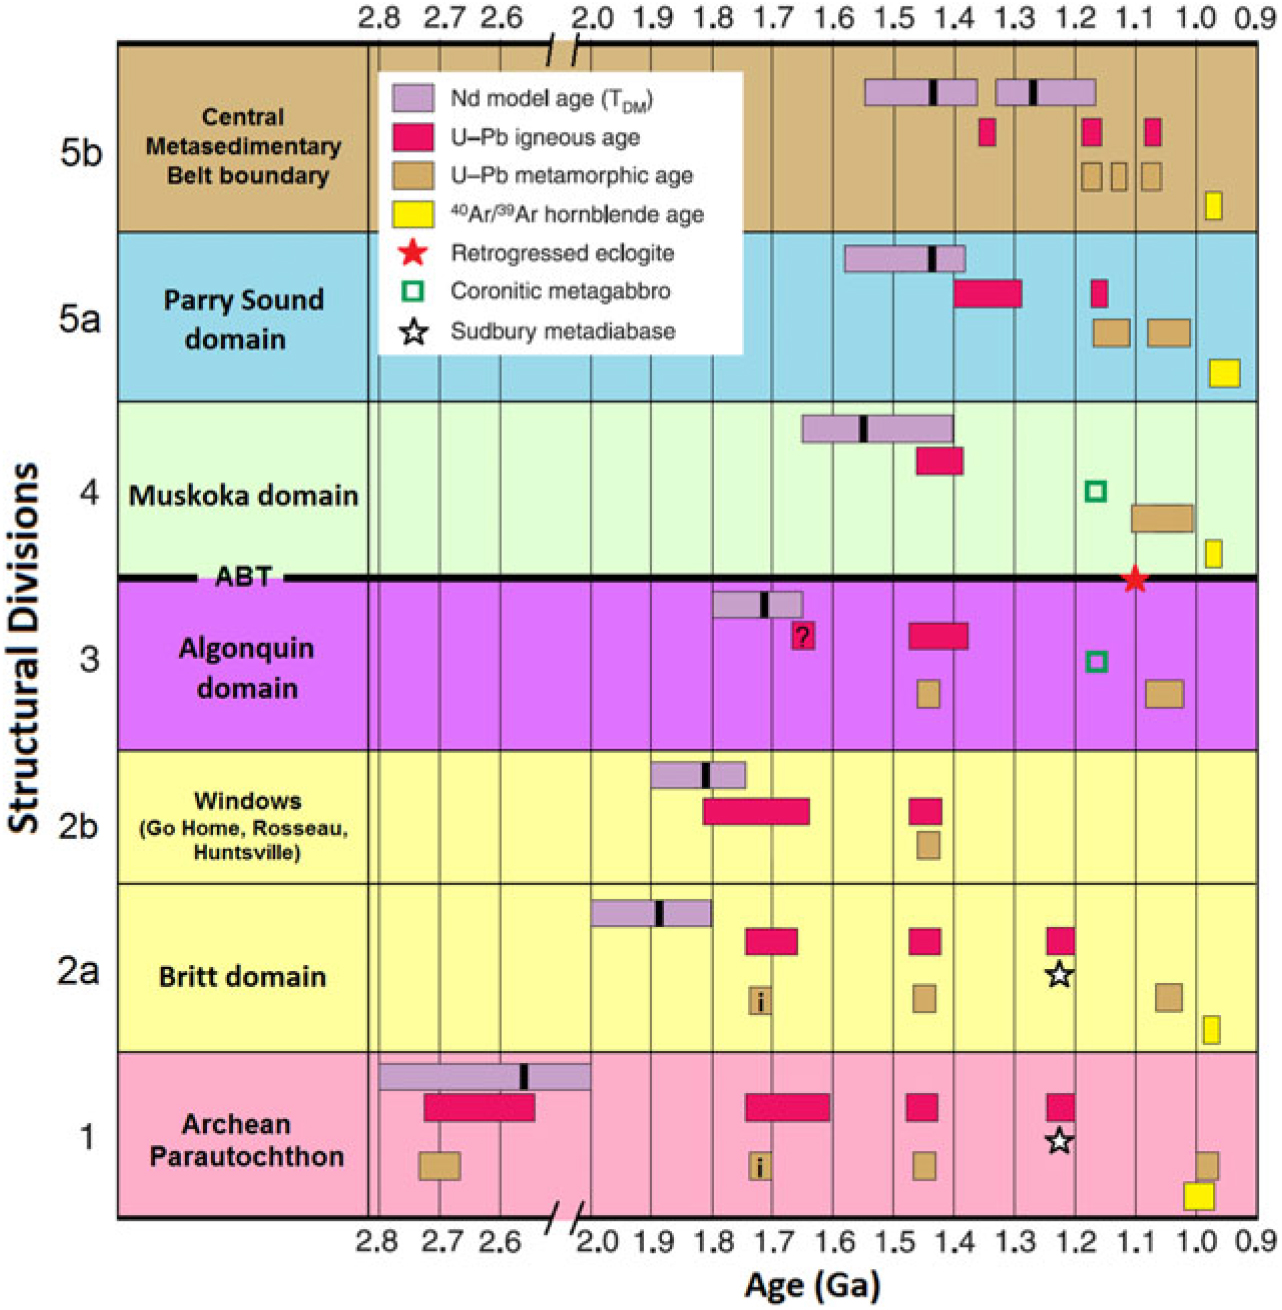
The proposed 3D relationships between the Central Metasedimentary Belt boundary, the Allochthon Boundary Thrust and the Grenville Front are consistent with published ages of metamorphism along these boundaries. The data are shown in Figure 10 as a chart of the structural divisions, showing U–Pb zircon ages, Ar–Ar hornblende cooling ages and Nd model age ranges. For a full summary of events and sources refer to the online supplementary material (available at http://journals.cambridge.org/geo).
Chart displaying age ranges for Sm–Nd whole-rock, U–Pb igneous/metamorphic and Ar–Ar hornblende geochronology for each structural division in the SW Grenville Province. The averages of the Nd model age distributions are shown with a solid vertical bar. ?, inferred igneous event based on field relations; i, inferred metamorphic event based on field relations. See online supplementary material for summary of events and sources.

Grenvillian metamorphism occurred in three main phases: the Shawinigan pulse at 1190–1150 Ma, the Ottawan pulse at 1080–1040 Ma and the Rigolet pulse at 1000–980 Ma (Rivers, Reference Rivers1997). In the Central Metasedimentary Belt boundary, the 1190 Ma crystallization ages of syntectonic granite sheets from the northern Central Metasedimentary Belt boundary indicate the beginning of ductile thrusting and crustal thickening (McEachern & van Breemen, Reference McEachern and van Breemen1993). There is also evidence for metamorphism on the Central Metasedimentary Belt boundary around 1130 Ma (Agustsson et al. Reference Agustsson, Johnston, Peck and Kylander-Clark2013). In the Parry Sound domain, metamorphic zircon from Parry Sound domain granulite at c. 1150 Ma dates the time of cooling from peak metamorphic conditions (Marsh et al. Reference Marsh, Gerbi, Culshaw, Johnson, Wooden and Clark2012). During this first phase coronitic olivine metagabbros extensively intruded the Muskoka and Algonquin domains during 1170–1150 Ma, but these igneous intrusions are absent from the overlying Central Metasedimentary Belt and Parry Sound domain (Davidson & van Breemen, Reference Davidson and van Breemen1988).
The second metamorphic phase (1080–1040 Ma) involved further transport to the NW of the Parry Sound domain and Central Metasedimentary Belt. Zircon from the Central Metasedimentary Belt boundary and basal Parry Sound shear zone depict metamorphic reactivation during 1080–1060 Ma (McEachern & van Breemen, Reference McEachern and van Breemen1993; Marsh et al. Reference Marsh, Culshaw and Gerbi2013). Leading up to this 1080–1060 Ma metamorphic reactivation, thrusting had already begun for the underlying Muskoka domain. This is demonstrated by eclogite pods in the shear zone of the Allochthon Boundary Thrust containing metamorphic zircon with ages of c. 1090 Ma (Marsh & Culshaw, Reference Marsh and Culshaw2014). The chemical composition of the metamorphic zircon is indicative of growth within eclogite facies assemblages, interpreted as the time of high-grade metamorphism prior to or during major uplift along the Allochthon Boundary Thrust.
U–Pb data are fairly scarce in the Algonquin domain, but one amphibolite dyke from central Algonquin Park contains metamorphically rimmed zircon with an upper intercept of 1078 ± 29 Ma and a concordant cluster of zircon mantles defining a discordia with an upper intercept of 1458 ± 100 Ma (Culshaw et al. Reference Culshaw, Foster, Marsh, Slagstad and Gerbi2016), suggesting this is not a 1240 Ma Sudbury diabase. The metamorphic rim age is interpreted as high-grade Ottawan metamorphism prior to or during uplift on the duplex sole thrust (Sample CA17, Culshaw et al. Reference Culshaw, Foster, Marsh, Slagstad and Gerbi2016).
The Grenvillian metamorphic history in the Britt domain begins with late Ottawan 1062–1050 Ma mylonitization and metamorphic zircon growth near Pointe-au-Baril (Ketchum et al., Reference Ketchum, Heaman, Krogh, Culshaw and Jamieson1998). The age of thrusting is poorly constrained, but 1035 Ma monazite ages record cooling below 725 °C (Corrigan et al. Reference Corrigan, Culshaw and Mortensen1994). This suggests thrusting can be bracketed between 1062 and 1035 Ma in the Britt domain. Unfortunately, the metamorphic histories of the tectonic windows in structural division 2b (Fig. 10) are relatively unknown due to lack of sampling.
The Archean Parautochthon is mostly associated with late Grenvillian thrusting or gravitational collapse during the Rigolet pulse (1000–980 Ma). Sudbury diabase in the Grenville Front Tectonic Zone record c. 1000 Ma metamorphism (Dudàs et al. Reference Dudàs, Davidson and Bethune1994), while most other reported Grenvillian ages from the Grenville Front Tectonic Zone and Grenville Front are between 1000 and 980 Ma (Krogh, Reference Krogh1991, Reference Krogh1994; Chen et al. Reference Chen, Krogh and Lumbers1995).
As outlined above, the structural divisions have metamorphic imprints corresponding to their position in the thrust stack. The 3D structure of thrusts and their metamorphic histories illustrates superimposition of tectonic boundaries from the top-down.
7. Conclusions
The subsurface structure of the Central Metasedimentary Belt boundary, Allochthon Boundary Thrust, duplex sole thrust and Grenville Front have been visualized in 3D to provide a new perspective on the tectonic structure in the SW Grenville Province.
The trajectories of the Central Metasedimentary Belt boundary and Grenville Front have long been known, but erroneous trajectories for the Allochthon Boundary Thrust have hampered a proper understanding of the structure of the gneiss belt in Ontario. Based on the integration of Nd isotope mapping with seismic reflection profiles using SketchUp, the Allochthon Boundary Thrust exhibits a ramp-flat geometry with an estimated horizontal throw of c. 200 km from the main ramp to the most northerly klippe. The location of the ramp is constrained by windows through the allochthon, identified by Nd isotope mapping. The windows and overlying allochthonous domains are exposed as a repetitive antiform-synform pattern perpendicular to the orogen (Dickin et al. Reference Dickin, Strong, Arcuri, Van Kessel and Krivankova-Smal2017).
All of the major thrusts in the Big Bend are structurally linked through top-down superimposition, highlighted by the curvature of each major structure and their metamorphic ages (providing estimates of the timing of tectonic activity). The sub-parallel thrust surfaces of the Central Metasedimentary Belt boundary, Allochthon Boundary Thrust and Algonquin duplex in Ontario depict a crustal-scale thrust stack which largely controlled the structure and tectonism of the underlying Parautochthon during the Grenville Orogeny.
The Central Metasedimentary Belt boundary is structurally at the top of the orogen and exhibits the tightest curvature in the Big Bend, with the oldest metamorphic age of thrusting. The Allochthon Boundary Thrust is in the middle and displays moderate curvature in the Big Bend, with an intermediate metamorphic age of thrusting. The Grenville Front is the basal thrust and has the gentlest curvature in the Big Bend, with the youngest metamorphic age. This supports top-down superimposition of thrust geometry from the overlying older thrusts onto the underlying younger thrusts during the Grenville Orogeny. This top-down style of thrusting is seen in modern-day Himalayan thrust regimes (DeCelles et al. Reference DeCelles, Robinson, Quade, Ojha, Garzione, Copeland and Upreti2001).
Author ORCIDs
Jacob W.D. Strong, 0000-0002-8324-6254
Supplementary Material
To view supplementary material for this article, please visit https://doi.org/10.1017/S0016756819000517.
Acknowledgements
The author acknowledges scholarship support from McMaster University. We are grateful for assistance from the journal editor, and we appreciate the constructive comments from Bob Hatcher, Walfried Schwerdtner and one anonymous reviewer. I also thank my parents for their support throughout the completion of this project.