Introduction
Sampling issues have received special attention from paleontologists because of their potential to distort our understanding of the history of life (Raup Reference Raup1972; Smith and McGowan Reference Smith, McGowan, McGowan and Smith2011). Raup (Reference Raup1976) first demonstrated that temporal trends in raw fossil diversity paralleled trends in outcrop area, a relationship that was later found to hold for other proxies of rock quantity (Peters and Foote Reference Peters and Foote2001; Smith and McGowan Reference Smith and McGowan2007; Wall et al. Reference Wall, Ivany and Wilkinson2009), raising the possibility that sampled diversity patterns merely reflect geological factors (Peters and Foote Reference Peters and Foote2001) or that evolutionary processes are not independent of rock volume (i.e., common cause hypothesis; Peters and Foote Reference Peters and Foote2001). Unfortunately, these direct comparisons of sampled diversity and rock availability do not completely capture the actual nature of paleontological sampling. To comprehend sampling of the fossil record, paleontologists must analyze patterns based on sampled rock volumes (together with taphonomic and lithologic information) rather than on the basis of raw estimates of rock volume and diversity, because diversity varies for both biological and sampling-related reasons (Magurran Reference Magurran2004; Hayek and Buzas Reference Hayek and Buzas2010).
Disentangling the effects of sampling is important, because paleontological sampling may also underlie broadscale environmental and ecological trends through the Phanerozoic, such as the frequency of bottom-level anoxia in the seas (Peters Reference Peters2007) and/or the filling of habitats as marine life diversified (Smith and McGowan Reference Smith and McGowan2008). Peters (Reference Peters2007) proposed that units may be barren of fossils due to habitat harshness and that the decrease of barren units over time was due to a decline in anoxia. By contrast, Smith and McGowan (Reference Smith and McGowan2008) proposed that the same trend reflected progressive invasion of habitat as marine life diversified. Both Peters (Reference Peters2007) and Smith and McGowan (Reference Smith and McGowan2008) interpreted the Phanerozoic decline in the proportion of barren units as a biological reality. However, it the degree to which sampling effects play a role is as yet unclear, because these former studies did not differentiate between the sampled and unsampled rock volume.
Here, we focus on two specific, underexplored issues related to paleontological sampling. First, the type and degree of sampling effects may vary over time as the relative proportions of carbonate and siliciclastic marine sedimentary rocks change (Peters Reference Peters2006). Paleontological sampling differs between these lithologies due to variation in the degree of lithification, which affects the ability to collect fossils (Hendy Reference Hendy2009; Hawkins et al. Reference Hawkins, Kowalewski and Xiao2018; but also see Daley and Bush Reference Daley and Bush2020) and causes the loss of small fossils (Sessa et al. Reference Sessa, Patzkowsky and Bralower2009; but see Nawrot Reference Nawrot2012). Carbonates may also be prone to early diagenetic dissolution, which may reduce the proportion of fossil-bearing carbonate rocks (Kidwell et al. Reference Kidwell, Best and Kaufman2005; Best Reference Best2008), although significant disintegration also occurs in siliciclastic sediments (Aller Reference Aller1982; Tomašových et al. Reference Tomašových, Kidwell, Alexander and Kaufman2019). Previous analyses using the Paleobiology Database (PBDB) have shown that paleontological sampling has high geographic coverage (Alroy Reference Alroy2010b), but lithologic coverage has received less attention. Consequently, it is not yet clear, in a global sense, how temporal variation in the geographic extent of lithology and/or sampling of those lithologies affects secular diversity patterns. A case study from the late Paleozoic showed that marine diversity was controlled by the changing proportion of carbonate and siliciclastic rocks (Balseiro and Powell Reference Balseiro and Powell2020); this work extends some of those implications to the entire Phanerozoic.
Second, by focusing our analysis on the marine record, we can differentiate sampling effects that are specific to that realm, augmenting studies that described trends for the rock record as a whole (Peters and Heim Reference Peters and Heim2010). The marine and nonmarine fossil records differ in their stratigraphic architectures (Catuneanu Reference Catuneanu2006), taphonomic pathways (Behrensmeyer et al. Reference Behrensmeyer, Kidwell and Gastaldo2000), and the stratigraphic and geographic nature of sampling between vertebrate (mostly continental) and invertebrate (mostly marine) faunas (Holland and Loughney Reference Holland and Loughney2021; Holland Reference Holland2022). Hence, to understand sampling patterns, it is necessary to analyze how paleontological sampling varies within a major environment (marine or nonmarine).
Here, we follow the method developed by Peters and Heim (Reference Peters and Heim2010) by joining a stratigraphic database (Macrostrat) with a paleontological database (PBDB) to better understand how the changing proportion of carbonate and siliciclastic marine sedimentary rocks affects the North American marine invertebrate fossil record of four diverse and well-preserved major fossil taxa. We quantify temporal trends in sampled fossiliferous volumes within and between lithologies, focusing on the proportion of total available volume sampled (i.e., completeness; Peters and Heim Reference Peters and Heim2010).
Data and Methods
We estimated the sampled, fossiliferous proportion of carbonate and siliciclastic rocks as:
 $$ \eqalign{ \kappa = \; & ( {{\rm volume\ of\ sampled}, \; {\rm fossiliferous\ rock}} ) / \cr & ( {{\rm total\ available\ volume}} ) $$
that is, the proportion of the available rock record that has yielded identifiable fossils that have been entered into the PBDB. This relationship has been termed “geological completeness” by Peters and Heim (Reference Peters and Heim2010). Although the calculation is a simple proportion, we refer to it here with precision to avoid confusion with “percent fossil-bearing,” which would also include unsampled, fossiliferous rock. (Because of potential uncertainty in estimating rock volume, we also calculated sampled fossiliferous proportion using sediment coverage area; see Supplementary Material.)
κ (kappa) was calculated for siliciclastic and carbonate volumes separately as well as for total rock volumes. We expressed the relative sampled fossiliferous proportion of carbonate (κc) and siliciclastic (κs) sedimentary rocks over time using a ratio, which is the base 2 logarithm of carbonate sampled fossiliferous proportion divided by siliciclastic sampled fossiliferous proportion:
 $$\kappa {\hbox -}{\rm ratio } = {\rm lo}{\rm g}_2( {\kappa_c/\kappa_s} ) $$
Positive values indicate time periods when a greater proportion of the carbonate record has been sampled and entered into the PBDB than the siliciclastic record (carbonate oversampling), whereas negative values indicate the opposite. A ratio of 1 indicates that κ of the best-sampled lithology is double that of the other lithology, while a value of 2 indicates that it is four times higher.
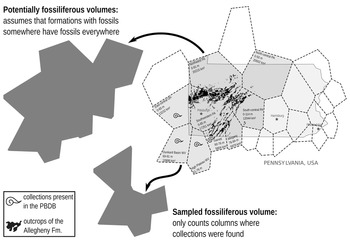
We estimated sampled and total rock volumes for 12,083 strictly marine units in 863 columns from the Macrostrat database (https://macrostrat.org) limited to North America, which we operationally defined as continental United States (i.e., excluding Hawai'i and U.S. territories) and Canada. Macrostrat columns are geographic regions defined using a Delaunay tessellation (also known as Voronoi diagrams of Thiessen polygons) (Peters and Heim Reference Peters and Heim2010). Columns are divided into units, which are genetically, lithologically, or chronologically distinct bodies of rock within the column (Peters et al. Reference Peters, Husson and Czaplewski2018); Macrostrat units usually correspond to a geographic subset of a formal stratigraphic unit, such as a formation (Fig. 1). Macrostrat records both outcropping and subsurface units, but given that sampling of macrofossils is essentially limited to outcrops, we eliminated all subsurface units from the analyses. We calculated rock volumes as the stratigraphic thickness of a unit within a time interval multiplied by the area of the Macrostrat column in which it occurred (Balseiro and Powell Reference Balseiro and Powell2020). Units that crossed an interval boundary were proportionally allocated to each interval based on its duration within each interval. Durations of units are calculated using Macrostrat's continuous-age model (Peters et al. Reference Peters, Husson and Czaplewski2018). The volume of carbonate or siliciclastic rocks within each time unit was estimated by multiplying the total volume of a unit by the proportion of each lithology that is recorded in Macrostrat. This methods allows estimation of individual carbonate and siliciclastic volumes from mixed carbonate/siliciclastic units.
Illustrated example of the method used to estimate sampled and potentially fossiliferous volumes using the Allegheny Formation in Pennsylvania. Created based on data from USGS, Macrostrat, and Pennsylvania Bureau of Topographic and Geologic Survey.

Fossil occurrences of trilobites, brachiopods, mollusks, and cnidarians were obtained from the PBDB (https://paleobiodb.org). We restricted our analysis to these four clades because they are the most abundant taxa in the PBDB, have similar preservation potential, and do not depend on exceptional preservation to be taxonomically identifiable at the genus level, as is the case for some echinoderms. We then joined the paleontological data with the stratigraphic data from Macrostrat based on the collection identification number (Peters and Heim Reference Peters and Heim2010).
The lithology of each collection was characterized as carbonate or siliciclastic. Carbonates were defined as lithologies containing the words “carbonate”, “limestone”, “reef rocks”, “bafflestone”, “bindstone”, “dolomite”, “framestone”, “grainstone”, “lime mudstone”, “packstone”, “rudstone”, and “wackestone”. Siliciclastics were defined as lithologies containing the words “shale”, “siliciclastic”, “breccia”, “claystone”, “conglomerate”, “gravel”, “mudstone”, “quartzite”, “sandstone”, “siltstone”, and “slate”. We coded for carbonate or siliciclastic lithology when the two primary lithology fields in the PBDB did not record different lithologies or specify the lithology from which the fossils came (Balseiro and Powell Reference Balseiro and Powell2020). We then discarded all collections that did not come from fully marine Macrostrat units. The final dataset consists of 25,455 collections from 2557 Macrostrat units from the Fortunian (lowermost Cambrian) to Piacenzian (Pliocene).
We divided the Phanerozoic into similar time bins of 10 Myr duration (Supplementary Material). Mean duration of bins is 9.83 Myr, with maximum duration of 19.2 Myr (Visean) and minimum duration of 5 Myr (Ladinian); 80% of the bins are within ±2 Myr of the mean.
Using this dataset, we estimated sampled fossiliferous volumes as the sum of volumes of units that recorded at least one paleontological collection (Fig. 1). Carbonate and siliciclastic volumes were similarly calculated as the volumes of units that recorded paleontological collections from each lithology. In the case of mixed carbonate/siliciclastic units, we computed only the volume of the lithology corresponding to the collections present in the unit. In other words, if a mixed unit contained only siliciclastic collections, then only the siliciclastic volume of the unit was computed as sampled. Sampled volumes calculated this way are approximations of the minimum rock volume that has been actually sampled, because many localities with sampled fossils are either unpublished or have not been registered in the PBDB (Marshall et al. Reference Marshall, Finnegan, Clites, Holroyd, Bonuso, Cortez, Davis, Dietl, Druckenmiller, Engo, Garcia, Estes-Smargiassi, Hendy, Hollis, Little, Nesbitt, Roopnarine, Skibinski, Vendetti and White2018), and because we eliminated all collections that lacked lithologic information or that could not be undoubtedly identified as either siliciclastic or carbonate. To overcome these limitations, we also calculated potentially fossiliferous volumes, which assumed that lithostratigraphic formations with at least one fossiliferous unit recorded in the PBDB were fossiliferous in every unit of that formation. Potentially fossiliferous volume was calculated by summing the volumes of all Macrostrat units that belong to the same formal lithostratigraphic unit, where at least one of those Macrostrat units recorded at least one PBDB collection (Fig. 1).
We tested whether time series of κc, κs, and κ-ratio were best explained by a random process, a directional trend, a stable dynamic, or a complex combination of these (Hunt et al. Reference Hunt, Hopkins and Lidgard2015) adopting a full maximum-likelihood approach using the paleoTS package for R (Hunt Reference Hunt2021). A fully random dynamic would be modeled as an unbiased random walk (URW), a directional trend as a generalized random walk (GRW), and a stable dynamic as stasis (Hunt Reference Hunt2008), whereas a combination of these possibilities implies a shift in the underlying dynamic. We estimated the variance needed for the analysis by bootstrapping columns 1000 times. Akaike weights based on Akaike information criterion corrected for small sample sizes (AICc) were used to select the most-supported models given the data. Akaike weights can be interpreted as the probability that a given model is the best one among a set of models analyzed, given the data (Burnham and Anderson Reference Burnham and Anderson2002).
All analyses were carried out in R (R Core Team 2018). Data and R scripts used in the analysis are available as Supplementary Material.
Results
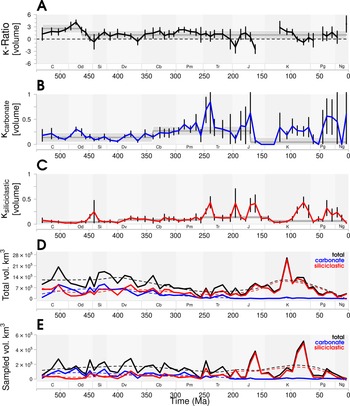
Carbonate rocks were sampled more intensively than siliciclastic rocks throughout most of the Phanerozoic (Fig. 2A). The average κ-ratio for all intervals was 1.14, indicating that κc was 2.2 times higher than κs rocks, overall. Only two brief intervals exhibited more than one consecutive epoch of greater κs: the first centered near the Triassic/Jurassic boundary (Triassic 5–Jurassic 1), in which the average κ-ratio was −1 (i.e., κs was one time higher than κc), and the second centered on the Late Cretaceous (Cretaceous 6–Cretaceous 7), in which the average κ-ratio was −0.42 (i.e., κs was 1.3 times higher than κc). A third longer interval, spanning the Late Jurassic–Early Cretaceous, is also relevant, as the κ-ratio should be highly negative but cannot be computed because κc is 0. When these intervals are excluded from the calculation, the average κ-ratio for the remainder of the Phanerozoic was 1.3, indicating that κc was 2.5 times higher than κs. Geologically brief intervals of higher κs occurred in Silurian 1 and Devonian 5. The time series analysis indicates that the mean higher κc during most of the Phanerozoic is not caused by chance alone, but responds to a stable pattern that fluctuates around 1 (i.e., κc is 2 times higher than κs; Table 1, but see Supplementary Material for further analysis.). The early Paleozoic (Cambrian 1–Ordovician 4) shows an even higher κ-ratio, with a trend around 2.58.
A, κ-ratio trend. B, Sampled proportion (κ) of carbonate rocks. C, Sampled proportion (κ) of siliciclastic rocks. Whiskers indicate 1 SD. Best-supported time series models are shown as dark gray lines with 95% probability envelopes in light gray. D, Available total marine sedimentary rock volume. E, Sampled marine sedimentary rock volume. Dashed lines are loess regressions, a local polynomial regression, with a smoothing parameter (alpha) of 0.4. Data plotted at interval midpoints.

Results of the maximum-likelihood estimates for time series modeling; boldface indicates the most-supported model. AICc, Akaike information criterion corrected for small sample sizes; κ, sampled fossiliferous proportion; GRW, general random walk (i.e., directional trend); URW, unbiased random walk (i.e., random trend); GRW-stasis, combination of an initial directional and a later stable trends; URW-stasis, an initial random dynamic followed by a stable trend; Stasis-GRW, an initial stable trend followed by a directional trend; Stasis-URW, an initial stable trend followed by a random trend.

Carbonate and siliciclastic rocks exhibited somewhat dissimilar patterns of κ (the correlation of κc and κs was just 0.39). Carbonate rocks exhibited high κc during Permian 1–Jurassic 4, during which average κc rose to 37%, compared with the Phanerozoic average of 25%, and even exceeded 70% during Triassic 1–Triassic 2 (Fig. 2B,C). Carbonates also exhibited higher κc during Paleogene 3–Neogene 3, when the average value rose to 47%. By contrast, there were few sustained intervals of unusually high κs, which on average was 13%, exhibited isolated spikes of higher values in Triassic 1–Triassic 2, Jurassic 1, Jurassic 4–Jurassic 5, Cretaceous 6–Cretaceous 8, and Paleogene 4–Neogene 1. Average κs during these time intervals was 33% and reached a Phanerozoic maximum of 42% during Triassic 2. This conclusion is supported by time series analyses, which show that both trends are best explained by complex models including two or more shifts between stable sampling trends (stasis; Table 1). The shifts, however, are not coincident between lithologies, suggesting the absence of a single explanation.
Inspection of sampled fossiliferous volume and total available volume shows that the incongruent patterns are caused by opposite underlying dynamics: κc is driven primarily by changes in total volume, whereas κs is driven primarily by changes in sampled volume (Fig. 3). The average total carbonate volume during Permian 1–Jurassic 5 (85,880 km3) was 39% of the Phanerozoic average (230,324 km3), whereas during that same time interval the average sampled carbonate volume (31,295 km3) was 78% of the Phanerozoic sampled average (40,282 km3). In other words, carbonate sampled volume was relatively unchanged even as its total volume decreased. Siliciclastic rocks experienced the opposite pattern. During intervals of unusually high κs, total volumes were only slightly above the Phanerozoic average, by 17% (584,380 km3 compared with the average of 499,252 km3), while sampled volumes increased by 178% (to 188,884 km3 compared with the average of 67,683 km3).
Scatter plot of available and sampled volumes. A, Carbonate rocks. B, Siliciclastic rocks.

In a general sense, variation in sampled volumes can be explained by variation in total rock volumes, as shown by the correlation between first differences of these metrics (r = 0.63, p = 2 × 10⁻⁷), indicating that rock availability controls paleontological sampling at a large scale, as originally suggested by Raup (Reference Raup1972, 1976; see also Peters and Heim Reference Peters and Heim2010). However, this general relationship obscures the fact that sampling of carbonate and siliciclastic lithologies is significantly different. Notably, carbonate rocks are consistently more fossil-bearing (in that they have a higher κ throughout the Phanerozoic), and the sampled fossiliferous proportion (κ) of each lithology appears to have different underlying drivers.
Discussion
We consider four hypotheses to explain the oversampling of carbonate rocks relative to siliciclastic rocks (Table 2). Some were previously discussed by Peters and Heim (Reference Peters and Heim2010) but deserve additional scrutiny, as the factors accounting for unequal κ by lithology (κc and κs) might differ greatly from those accounting for a trend of increasing κ through the Phanerozoic. Moreover, the difference in κ between lithologies is much larger than the previously described difference between mean Paleozoic κ and Cretaceous–Cenozoic κ (Peters and Heim Reference Peters and Heim2010).
Factors affecting sampled fossiliferous volume addressed in this study.

Barren Units
A possible explanation for greater κc than κs is that the original siliciclastic depositional environments were relatively devoid of macroscopic life. Peters (Reference Peters2007) described this as the “problem with the Paleozoic” and hypothesized that barren units were due to the anoxia of Paleozoic epeiric seas. However, any factor that may account for environmental harshness can explain the pattern described by Peters (Reference Peters2007). It is plausible that the effect of environmental harshness is greater for siliciclastic environments, because nearly all carbonate sediments are biogenic (although not necessarily of invertebrate origin), and because carbonate sediments are deposited in shallow-marine conditions that are more likely to be suitable for life. The observed trend in the κ-ratio (Fig. 2) does support Peters's (Reference Peters2007) proposition, given that carbonates are particularly oversampled during the Paleozoic. However, the hypothesis is difficult to test directly, because the data do not distinguish between barren units and those that are merely unsampled; both are recorded as Macrostrat units without an associated PBDB collection.
We attempted to differentiate barren and unsampled units by calculating “potentially fossiliferous volume,” which classifies units as fossiliferous if the unit belongs to a lithostratigraphic formation that has at least one other fossiliferous Macrostrat unit, even if that specific unit had no PBDB collections associated with it. (The approach assumes that formations are equally fossiliferous everywhere they occur.) Carbonate and siliciclastic rocks have similar κ when calculated this way, as the κ-ratio (1) follows a stable trend very close to zero (~0.3) (Fig. 4A, Table 1), (2) has values closer to zero in each interval (paired Wilcoxon signed-rank test V = 1008, p = 1.4 × 10⁻⁵), and (3) is less variable (F-test: F = 2.5, p = 0.001) than raw values. This indicates that higher κc is due to undersampling of fossiliferous siliciclastic formations, rather than a greater number of barren siliciclastic formations. This conclusion is further supported by the fact that unpublished gray data in museum collections cover a much larger geographic and stratigraphic extent than published data (Marshall et al. Reference Marshall, Finnegan, Clites, Holroyd, Bonuso, Cortez, Davis, Dietl, Druckenmiller, Engo, Garcia, Estes-Smargiassi, Hendy, Hollis, Little, Nesbitt, Roopnarine, Skibinski, Vendetti and White2018), which suggests that much of the supposedly unfossiliferous stratigraphic record is actually unpublished or unsampled, rather than truly barren. This reinforces the idea that the described lithologic inequality is a consequence of greater carbonate sampling, given that the formation-scale estimation is, potentially, less influenced by unsampled units. Finally, it is unlikely that uninhabited environments were widespread enough geographically or temporally to explain a consistent pattern over much of the Phanerozoic. Therefore, a pervasive effect of environmental harshness is unlikely to be a main driver of lower κs.
A, Trend in κ (sampled proportion) ratio estimated with potentially fossiliferous volumes. B, κ for marine sedimentary rocks. Whiskers indicate 1 SD. Best-supported time series model is shown as a dark gray line with 95% probability envelopes in light gray.

An additional potential driver of barrenness is that sedimentation rates can be very high in certain siliciclastic environments (Sadler, Reference Sadler1981), raising the possibility that the observed lower κs is due to “dilution” of fossiliferous zones by sediment. Siliciclastic units in our data do have higher mean sedimentation rates (44.3 m/Myr for carbonates vs. 70.7 m/Myr for siliciclastics; t = −8.2, p < 2 × 10⁻¹⁶) and marginally lower collection densities (0.18 collections per meter for carbonates vs. 0.14 collections per meter for siliciclastics; t = 1.4, p = 0.16). However, dilution can only affect our results if more barren siliciclastic units had been defined per unit of time, which would inflate total available volume; intra-unit collection density does not factor into our calculation. Siliciclastic units exhibit longer mean time durations than carbonate units (6.0 Myr for carbonates vs. 6.9 Myr for siliciclastics; t = −4.6, p = 5 × 10⁻⁶), indicating that siliciclastic units are not subdivided more than carbonate units.
Taphonomic Effects
Early diagenetic dissolution is quite common in Paleozoic sediments (Cherns and Wright Reference Cherns and Wright2009, Reference Cherns, Wright, McGowan and Smith2011) and has been identified as the cause of barren intervals in siliciclastic sedimentary successions (Schovsbo Reference Schovsbo2001). If early diagenetic dissolution was more common in siliciclastic than in carbonate sediments (Alexandersson Reference Alexandersson1976), siliciclastic rocks would appear to be less fossiliferous. This possibility is unlikely, given that carbonate rocks may be more likely to experience dissolution (Kidwell et al. Reference Kidwell, Best and Kaufman2005; Best Reference Best2008; Foote et al. Reference Foote, Crampton, Beu and Nelson2015; but see Tomašových et al. Reference Tomašových, Kidwell, Alexander and Kaufman2019) or can be subjected to other mechanisms contributing to disintegration, such as bioerosion (Best and Kidwell Reference Best and Kidwell2000), and that genus-level taxonomic identification may be made from molds. Nevertheless, we tested the hypothesis by analyzing the sampled, fossiliferous proportion of aragonitic and calcitic fossils separately. Because aragonite is less stable than calcite (Cherns and Wright Reference Cherns and Wright2000), a pattern of preferential dissolution in siliciclastic sediments should be stronger in aragonitic than calcitic fossils. Aragonitic taxa, however, have higher κs than κc, (Fig. 5), indicating that, if there is any dissolution effect, it is against carbonate facies (paired Wilcoxon signed-rank tests: total, V = 745, p = 0.056; Paleozoic, V = 238, p = 0.042, post-Paleozoic, V = 139, p = 0.7). This reinforces the described pattern of higher carbonate oversampling.
A, Scatter plot of sampled proportion ratios for calcitic and aragonitic fossils. Dashed line indicates a perfect 1:1 relationship; in the lower triangle, aragonitic fossils record lower κ-ratio (i.e., proportionally higher siliciclastic sampled proportion relative to carbonate sampled proportion) than calcitic fossils. B, Box plots of paired differences between κ-ratio estimated with aragonitic and calcitic fossils. Negative values indicate that aragonitic fossils record lower κ-ratio.

Data Entry Effects
κs could be lower if paleontologists are less likely to report in the literature, or to enter into the PBDB, the lithology of siliciclastic fossiliferous beds. The systematic exclusion of lithologic information from originally siliciclastic collections in the dataset would reduce κs, because these collections would not be classified as siliciclastic based on our analytical protocol. We tested this possibility by reanalyzing κs after relaxing the definition of siliciclastic collections, including all non-carbonate lithologies as siliciclastic whether or not they were specifically identified as such. This increased the number of occurrences considered to be siliciclastic by 56%, from 54,907 to 85,663. Although this approach reduced the κ-ratio for some Paleozoic intervals, overall it yielded results very similar to the previously described patterns (Fig. 6, r = 0.93, p = 2 × 10⁻¹⁶). Differences in Phanerozoic median values are not significant based on a Wilcoxon signed-rank test (W = 1530, p = 0.054), nor are differences in the variance of κ-ratio values (F-test: F = 1.04, p = 0.88). Even in this very improbable scenario (there is no a priori reason to suspect such a strong bias on the original description of lithologic information or during compilation of the PBDB), κc still exceeds κs in many intervals. A systematic bias in data entry, even if present, cannot be strong enough as to explain the observed high differences in κ between lithologies.
Scatter plot of raw κ-ratio and κ-ratio estimated with relaxed lithologic identification (i.e., all non–strictly carbonate fossiliferous beds coded as siliciclastic beds). Dashed line indicates a perfect 1:1 relationship. Black dots are Paleozoic intervals, white dots are post-Paleozoic intervals.

Publication Effects
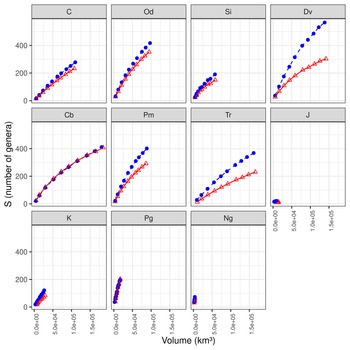
Because the PBDB is based primarily on published data, the observed inequality between κc and κs may also result from more publications of fossil data from carbonate rocks. This would be unexpected, given that carbonates are more difficult to sample than siliciclastic rocks (Hendy Reference Hendy, Allison and Bottjer2011). However, if the evenness of taxonomic occurrences is greater in carbonate environments, then more new taxa will be recovered at equal sampling effort (Powell and Kowalewski Reference Powell and Kowalewski2002). If new taxa are more likely to be published in the literature than previously discovered taxa, as is known for the paleontological literature (Alroy Reference Alroy, Alroy and Hunt2010a; Close et al. Reference Close, Evers, Alroy and Butler2018), this would lead to a publication bias in favor of carbonate rocks. A simple triple rarefaction, equalizing the amount of Macrostrat columns, sampled volumes, and collections, shows that carbonate rocks usually record higher diversity than siliciclastic rocks at the same sampling effort (Fig. 7). Therefore, carbonate rocks are more likely to contain previously undiscovered taxa, increasing the number of places where this lithology has been reported in published data. This possible explanation is bolstered by the observation that published records cover less area than museum collections (Marshall et al. Reference Marshall, Finnegan, Clites, Holroyd, Bonuso, Cortez, Davis, Dietl, Druckenmiller, Engo, Garcia, Estes-Smargiassi, Hendy, Hollis, Little, Nesbitt, Roopnarine, Skibinski, Vendetti and White2018); that is, many of the unpublished occurrences in museums probably belong to taxa already known elsewhere.
Triple-rarefaction curves for period-length bins. Dots and dashed lines are carbonate rocks, and triangles and continuous lines are siliciclastic rocks. Rarefactions account for an equal amount of Macrostrat columns, sediment volumes, and collections.

Because of the complexity of factors that affect fossil sampling and the limitations of fossil data, our analysis cannot rule out a role for any specific factor, and probably all of them contribute to some extent. Overall, however, our analysis finds little to support relative oversampling of carbonate rocks being a consequence of a greater proportion of barren siliciclastic units, greater dissolution of fossils from siliciclastic rocks, or biased data entry errors and omissions when reporting siliciclastic lithologies. We do find support that differences between carbonate and siliciclastic environments in the taxonomic distribution of occurrences may favor greater relative publication of fossils coming from carbonate environments.
Variable sampled fossiliferous proportion over time and carbonate relative oversampling could affect estimates of regional and global diversity. The available methods to overcome sampling intensity biases when analyzing diversity (Alroy Reference Alroy2020) do not solve for variable sampling coverage, which is a first-order control on diversity even after standardizing for sampling intensity (Wall et al. Reference Wall, Ivany and Wilkinson2009). Therefore, if we want to comprehend diversity changes related to the fluctuating inhabited areas (e.g., Balseiro and Powell Reference Balseiro and Powell2020), we should evaluate diversity from areas proportional to their original extent. The sampled fossiliferous proportion (κ) seems sufficiently stable (Fig. 5B) at the temporal and geographic scales of the current analysis for us to believe that there is no significant bias in the original data. However, within more specific time intervals, it may be advantageous to consider geological completeness when comparing diversity between intensively sampled intervals (e.g., Late Cretaceous) relative to poorly sampled intervals (e.g., Early Cretaceous). Moreover, differences in sampling across environments/regions can further skew diversity estimation (Wall et al. Reference Wall, Ivany and Wilkinson2009). Because many taxa are substrate specialists (Foote Reference Foote2006; Hopkins et al. Reference Hopkins, Simpson and Kiessling2014), considerable differences in the carbonate–siliciclastic κ-ratio can bias both composition and diversity. Therefore, it would also be good to evaluate the effect of variable κc and κs when studying biotic trends.
The Phanerozoic trend in total sampled fossiliferous proportion also bears on the issue of a marine or terrestrial origin for the documented increase sampling coverage of the fossil record as a whole, first noted by Peters and Heim (Reference Peters and Heim2010). Our results localize this increase to the terrestrial record, because κ of the marine fossil record shows no evident increase through the Phanerozoic, except for a rise limited to the Permian–Jurassic (Fig. 5B, Table 1). Such a trend contrasts with the results of Peters and Heim (Reference Peters and Heim2010), who described a rise in κ during the Late Cretaceous and a steady high level of sampling during the Cenozoic. The difference between results could be caused by new collections that have been added to the PBDB in the decade between our studies. However, κ for the marine geological record estimated using occurrences entered before 2010 is highly correlated with our current results (first differences r = 0.87, p = 2 × 10⁻¹⁶), indicating that new occurrences are unlikely to account for the discrepancy. Instead it appears that increasing κ of all rocks is likely limited to the continental fossil record included in Peters and Heim's (Reference Peters and Heim2010) analysis. Indeed, Peters and Heim (Reference Peters and Heim2010) already raised the possibility that the continental record was responsible for their observed increase in κ, but dismissed it due to the stable trend in the number of fossiliferous continental stratigraphic units during the post-Paleozoic. Our analysis, however, confirms that the rise is likely to be limited to the nonmarine stratigraphic record, as the marine fossil record shows a stable pattern (Fig. 4B).
Acknowledgments
This contribution was made possible thanks to the ANPCyT (MINCyT, Argentina) financial support and Juniata College's lodging facilities and assistance in Huntingdon, PA. D.B. thanks the Powell-Miller family for their generosity and warm reception. We thank associate editor A. Tomašových (Slovak Academy of Sciences), S. Holland (University of Georgia), and two anonymous reviewers for their thoughtful suggestions, which significantly improved this contribution. This is Paleobiology Database official publication no. 453.
Declaration of Competing Interests
The authors declare no competing interests.
Data Availability Statement
Additional analyses, data and R scripts used in this article are available as online Supplementary Material, which is available in the Digital repository of the Universidad Nacional de Córdoba at: http://hdl.handle.net/11086/ 546892 .