

Introduction
Arvanitoyannis and Ladas (Reference ARVANITOYANNIS and LADAS2008) concluded that ‘food and agro-allied industries produce large amounts of waste and, where adequate disposal systems are unavailable, such wastes cause environmental problems’. Moreover, both processing per se and further processing of poultry are major contributors to this waste (Arvanitoyannis and Ladas, Reference ARVANITOYANNIS and LADAS2008). The carcass represents a greater percentage of live weight (70%) for broiler chickens (Aberle et al., Reference ABERLE, FORREST, GERRARD, MILLS, HENDRICK, JUDGE and MERKEL2001) than for cattle (62%) (Holland et al., Reference HOLLAND, LOVEDAY and FERGUSON2006; Jayathilakan et al., Reference JAYATHILAKAN, SULTANA, RADHAKRISHNA and BAWA2012). Processing waste includes blood, liver, kidneys, fat, skin, feet and the gastro-intestinal tract together with intestinal contents. Animal by-products represent both an economic resource when used as a co-product, for instance, with blood, feathers, fat and offal (Jones and Kerns, Reference JONES and KERNS1974). However, these by-products may ‘cause serious environmental pollution’ (Jayathilakan et al., Reference JAYATHILAKAN, SULTANA, RADHAKRISHNA and BAWA2012).
This review provides a quantitative analysis of the production of waste from poultry processing globally, and energy costs of processing are addressed. In addition, both the environmental impacts of processing of poultry and alternative uses of poultry processing by-products are considered. It is important to define the terms used in this review. Waste is defined as unused, unwanted or under-used solids or liquids. It is superfluous material from a process and is frequently discarded and requires a specific approach to reduce its impact on the environment. Examples of waste from poultry processing and further processing can be offal, heads and bones when these are disposed of as waste in land-fills. A by-product is a secondary product of either positive or negative value from a process; in the case of the latter necessitating input of energy, labour and capital equipment for its disposal. An example of a by-product is waste water from processing. A co-product is a valuable product derived from a process, such as collagen. This is in addition to the primary product. The difference between a co-product and a by-product is the much greater value of the co-product.
Quantification of the impact of poultry processing
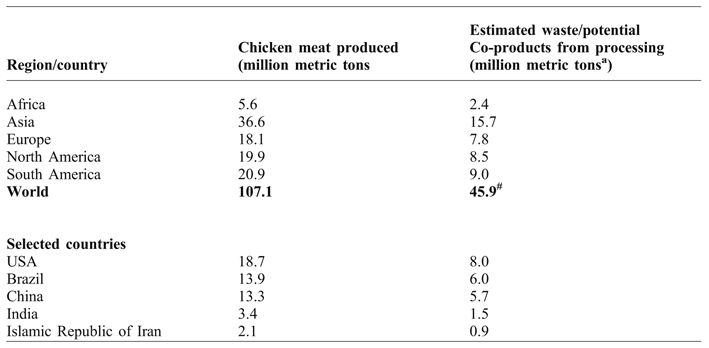
Processing poultry results in the production of large amounts of waste (blood, bones, feathers, offal and trim). These can be viewed as by-products or potential co-products. It was estimated that there are 45.9 million metric tons of solid processing waste produced globally (Table 1).
Estimated production of waste from chicken meat globally together with top three countries together with other selected countries in 2016 (calculated from FAOSTATS).

aCalculated from chicken meat production data as presented by FAOSTAT and the assumption that the carcass represents 70% of live weight
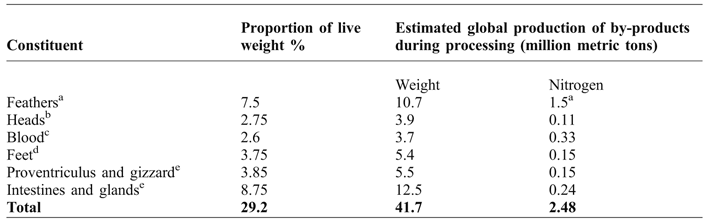
The amount of waste from processing chickens was calculated using an average 70% yield (Aberle et al., Reference ABERLE, FORREST, GERRARD, MILLS, HENDRICK, JUDGE and MERKEL2001) and data from FAOSTAT (2018) for chicken meat production. Estimates for processing solid waste in selected countries and regions are shown in Table 1. This solid waste/by-product consists of different compounds with estimates of global production of each shown in Table 2.
Proportion of live weight of broiler chickens considered as waste and the estimated global production of these products (calculated from Sams and McKee, Reference SAMS and MCKEE2010 and Jayathilakan et al., Reference JAYATHILAKAN, SULTANA, RADHAKRISHNA and BAWA2012).

aFeathers >14.4% nitrogen (Fisher et al., Reference FISHER, LEESON, MORRISON and SUMMERS1981); bAssumed as bone 2.9% nitrogen (Cansu and Boran, Reference CANSU and BORAN2015); cBlood 0.9% (calculated from Sorapukdee and Narunatsopanon, Reference SORAPUKDEE and NARUNATSOPANON2017 and assumes blood is 90% water); dFeet 2.8% nitrogen (Liu et al., Reference LIU, LIN and CHEN2001); eGizzard 2.8% Intestine 1.9% nitrogen (Seong et al., Reference SEONG, CHO, PARK, KANG, PARK, MOON and BA2015).
Processing waste has high nutritional value to both domestic animals and people. Parenthetically, the use of processed solid waste as animal feed is limited by law in some countries (World Bank Group, 2007; Williams, Reference WILLIAMS2013). This may be without merit, as rendering destroys both viruses and bacteria (Williams, Reference WILLIAMS2013). Moreover, prions have not been found in poultry (Williams, Reference WILLIAMS2013). The nitrogen in processing waste and by-products globally is estimated as 1.3 million metric tons (Table 1) assuming waste averages 2.85% nitrogen (Chambers and Fortin, Reference CHAMBERS and FORTIN1984; Coufal et al., Reference COUFAL, CHAVEZ, NIEMEYER and CAREY2006).
Yield efficiency and poultry production processing
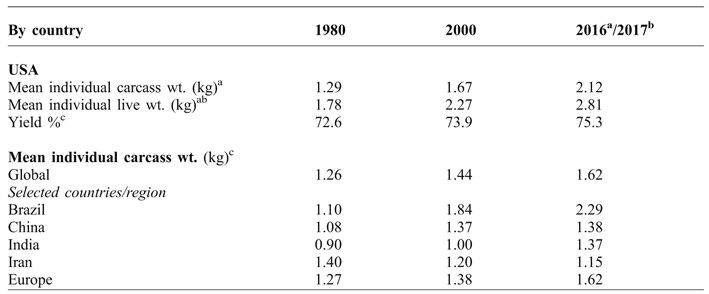
It is reasonable to question the assumed yield percentage (70% based on Aberle et al., Reference ABERLE, FORREST, GERRARD, MILLS, HENDRICK, JUDGE and MERKEL2001) for broiler chickens. In the USA, average yields have markedly increased between 1980 and 2017 (Table 3).
Changes in the carcass weight, live-weight and percentage yield over time in the USA with carcass weight globally and in selected countries shown for comparison.

aGlobal and selected country data from FAOSTAT (2018) for 1980, 2000 and 2016
bUS data from USDA Economic and Statistics Service 1981; USDA National Agricultural Statistics Service 2001; 2018 for, respectively, the years 1980, 2000 and 2017
cNet yield calculated from data from USDA Economic and Statistics Service 1981; USDA National Agricultural Statistics Service 2001; 2018 for, respectively, the years 1980, 2000 and 2017 and includes pre- and post mortem condemnations
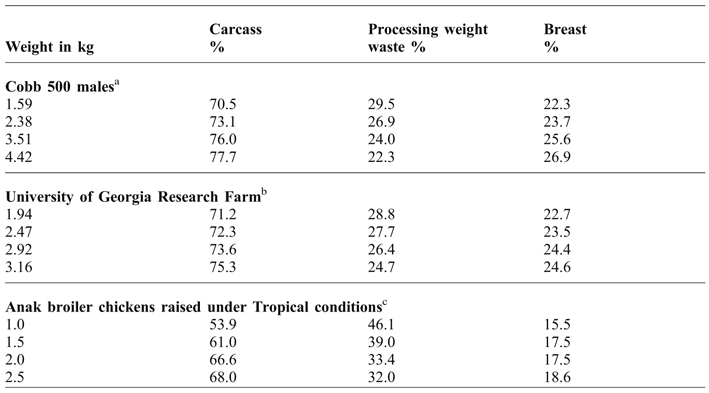
Effect of body weight at marketing on yield (dressing percentage), processing waste and breast percentage.

aCobb, 2018; bData from Buhr et al., Reference BUHR, WALKER, BOURASSA, CAUDILL, KIEPPER and ZHUANG2014; cData on defeathered broiler chickens - Omojola et al., Reference OMOJOLA, ADESEHINWA, MADU and ATTAH2004.
Thus, processing waste estimates for North America (Table 1) are an over-estimate. The improvement in yield can be attributed to the increase in live-weight at marketing in the USA (Table 3); there being a clear link between body weight and yield (Table 4). A similar situation is predicted to exist in Brazil where there have also been large increases in average carcass weight (Table 3). Low yields have been reported in one study from a tropical country, Nigeria (Table 4). Similarly, low carcass yields (54%) were reported for ~1 kg broiler chickens (lines: Cobb 500, Hubbard Classic and Arbor Acres) in another tropical environment (Bangladesh; Rokonuzzaman, Reference ROKONUZZAMAN2016). This would suggest that the estimates for processing waste (Table 1) for some regions are under-estimates. This indicates that there is even greater scope for improving yield, increasing meat availability and reducing processing waste.
The increase in size of chicken carcasses are attributable to improvements in both genetics, nutrition and husbandry. With increasing body weights, there are proportional decreases in the percentage weights of liver, gizzard and heart (body weight 1 kg; 7.3% aggregate, >2 kg; 4.5% aggregate) (Marapana, Reference MARAPANA2016). There are obvious economic gains in both improvements in yield and in percentage breast muscle (Table 4). The increases in carcass weight has other advantages, including increased product relative to fixed costs (both equipment and labour) together with reduced clean water used and waste per unit of product. It has been calculated that if the yield was raised to 75% globally, then the amount of processing waste would be reduced by 10.2 million metric tons.
There is another issue with the estimate of waste. The carcass consists of muscle/meat plus skin and bone. People eat the meat (white and dark meat) together with, in some cases, skin but not bone. Thus, in further processing, skin and bone are removed (Sams and Owens, Reference SAMS and OWENS2010) and might be considered waste. However, both skin and bone can be hydrolysed to generate potentially valuable co-products.
Environmental and other impacts of poultry processing
The three methods of disposal of solid waste are incineration, land burial, and rendering (Haines, Reference HAINES2004). A valuable co-product is generated by rendering. In contrast, there is no co-product produced from either incineration or land burial. Instead, there are labour, energy and capital costs.
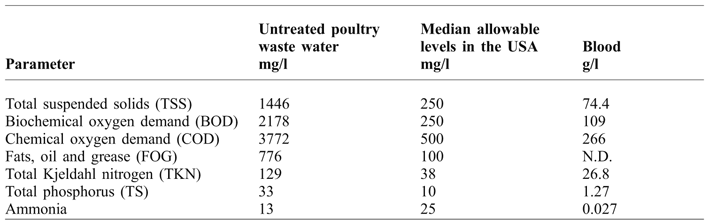
Offal (Table 5) is recovered from poultry processing water by sieving through rotary screens, frequently three in a series, such that particulates that are less than 500-μm in diameter are recovered (Kiepper et al., Reference KIEPPER, MERKA and FLETCHER2008). There is then chemical or biological treatment of waste water before effluent discharge (Kiepper et al., Reference KIEPPER, MERKA and FLETCHER2008). Solid waste from poultry processing is largely rendered in developed countries. By contrast, in developing countries, burial in land-fills is commonly practiced (reviewed: Du et al., Reference DU, KHIARI, PIETRASIK and BETTI2013; Williams, Reference WILLIAMS2013) as observed in Iran, hence there can be problems of environmental contamination and loss of a potentially valuable co-product.
Composition of untreated waste water from poultry processing and comparison with acceptable levels in the USA and chicken blood (Based on Merka, Reference MERKA1991; Kiepper et al., Reference KIEPPER, MERKA and FLETCHER2008; Garcia et al., Reference GARCIA, NIEMAN, HAYLOCK, ROSENTRATER and PIAZZA2016).

N.D. Non-detectible
It is critically important that poultry processing is conducted to assure food safety (Kiilholma, Reference KIILHOLMA2007). For instance, in an FAO publication, it is noted that ‘where carcasses are rinsed (with a shower or spray), the water used should be of drinking quality. Washing with cold water reduces the quantity of microorganisms on the carcass in the slaughter process.’ and ‘for good hygiene, and to wash away all the dirt and bacteria, etc., a regular supply of clean water is essential’ and ‘…in tropical countries, the ambient temperature is usually above 20°C, with a high degree of humidity creating favourable conditions for the multiplication of most bacteria. During the hot season, increased numbers of bacteria are found on poultry carcasses’ (Da Silva, Reference DA SILVA2013). There is considerable scope for cross-contamination, for instance, on picker fingers (Arnold, Reference ARNOLD2007).
What are the consequences of this need for large quantities of potable water? It is estimated that the waste water from poultry processing is 35.2 litres per bird (range 15.9 to 87.1) litres per bird (USEPA, 1975). This is similar to estimates of the water used during processing in the USA. Potable water used in poultry processing has been estimated as 26.5 litres per bird for broiler chickens (US Poultry and Egg, 2017). Other estimates of water use in US poultry processing are 26.8 litres (calculated from Kiepper, Reference KIEPPER2003) and 26.0 litres (Northcutt and Jones, Reference NORTHCUTT and JONES2004). Untreated process water should not be disposed of in rivers and streams (World Bank Group, 2007). In the USA, treated wastewater from poultry processing plant is discharged under environmental permits or sewer use ordinances, with municipal sewer systems being employed by 60% of processing plants, land applied by 40% of processing plants and surface water employed by 17% of processing plants (Kiepper, Reference KIEPPER2003). Phosphate, together with nitrogen, in the discharge water may contribute to eutrophication in lakes, rivers and streams. Moreover, it is not clear whether estimates of the global water footprint of broiler chickens from UNESCO includes potable water needed for processing or the impact of processing waste water (Mekonnen and Hoekstra, Reference MEKONNEN and HOEKSTRA2010; Reference MEKONNEN and HOEKSTRA2012; Hoekstra and Mekonnen, Reference HOEKSTRA and MEKONNEN2012).
Waste water from livestock and poultry processing plants contain organic matter and, hence, have high chemical oxygen demand (COD) and biochemical oxygen demand (BOD) (e.g. Sirianuntapiboon and Yommee, Reference SIRIANUNTAPIBOON and YOMMEE2006). Waste water from poultry processing plants is treated in systems including rotary and static screens, equalisation tanks, dissolved-air flotation, up-flow anaerobic sludge blanket reactors, anaerobic ponds and facultative ponds (Del Nery et al., Reference DEL NERY, DE NARDI, DAMIANOVIC, POZZI, AMORIM and ZAIAT2007; Reference DEL NERY, DAMIANOVIC, POZZI, DE NARDI, CALDAS and PIRES2013; Reference DEL NERY, DAMIANOVIC, MOURA, POZZI, PIRES and FORESTI2016). These act in series to reduce organic overload, low chemical oxygen demand (COD) and biochemical oxygen demand (BOD) (Table 5). Some water waste is subjected to anaerobic or aerobic digestion before being deposited into the municipal sewerage systems (Haines, Reference HAINES2004).
Approaches to reduce the impact of poultry processing
There are multiple approaches being employed to reduce the environmental and other impacts of poultry processing. These include:
1. Increasing use of co-products in manufactured food.
2. Improved line efficiency and effectiveness of disposal systems in poultry processing plants.
3. Poultry genetics and nutrition for increased yield.
4. Superior poultry management allowing efficient production of larger birds.
It has been argued that increases in size of birds can have a marked effect on both the amount of both chicken meat produced and processing waste. There is always some processing waste and this needs to be viewed as a resource.
Production of co-products
An important approach to co-products is rendering. Advantages of rendered animal products include their high concentrations of crude and digestible protein together with their relatively low cost. Thermal treatment during rendering has been demonstrated as effective in destroying protozoa, bacteria and viruses (WHO, 2002; Haines, Reference HAINES2004) including RNA viruses such as avian influenza (Leaphart et al., Reference LEAPHART, SCOTT, CHAMBERS, BRIDGES and GREENE2012). However, rendering may not be effective in destroying prions, as there is evidence that these can survive for an hour at 360°C (WHO, 2002). It has been questioned whether this is a problem for poultry processing co-products. Prion-based diseases have not been identified in birds. Avian scavengers may spread prions, particularly from deer and elk (Fischer et al., Reference FISCHER, PHILLIPS, NICHOLS and VERCAUTEREN2013), However, the chances of spreading prions to poultry are extremely unlikely. The WHO (2002) concluded that ‘meat and bone meal of ruminant origin must not be fed back to ruminants’ but they can be used for pigs and poultry, as can poultry meat and bone meal (WHO, 2002).
In the USA, 21.3 million metric tons of animal organs/mortalities/food waste is rendered per year (Becker, Reference BECKER2004). This generates 3 million metric tons of meat and bone meal (MBM) and 1.8 million metric tons of poultry by-products, valued at US$3 billion (Becker, Reference BECKER2004).
Feathers are a co-product of poultry production (see Table 2). The energy in feather meal (FM) is relatively high due to its lipid content (Dale, Reference DALE1992). At least 10% of crude protein in diets can be provided by FM in chickens (Baker et al., Reference BAKER, BLITENTHAL, BOEBEL, CZARNECKI, SOUTHERN and WILLIS1981). FM production was estimated as 0.34 million metric tons in 2003 in the USA (Becker, Reference BECKER2004). FM from 15 rendering plants in the USA had the following composition: crude protein 87.8%, available protein 64.6% and fat (as ether extract) 10.0% (Cotanch et al., Reference COTANCH, GRANT, DANN and DARRAH2002). Average digestive absorption of amino-acids from FM in chickens is about 50% but varies between 20-70% (Baker et al., Reference BAKER, BLITENTHAL, BOEBEL, CZARNECKI, SOUTHERN and WILLIS1981; Bielorai et al., Reference BIELORAI, HARDUF, IOSIF and ALUMOT1983). FM is a useful source of nitrogen in livestock with amino-acid digestibilities between 85 and 95% in steers (Klemesrud et al., Reference KLEMESRUD, KLOPFENSTEIN and LEWIS2000) and is a good source of sulphur amino-acids, such as cysteine, in growing steers (Klemesrud et al., Reference KLEMESRUD, KLOPFENSTEIN and LEWIS2000). However, FM did not improve weight gain when employed as a source of valine (Southern et al., Reference SOUTHERN, LEMIEUX, MATTHEWS, BIDNER and KNOWLES2000). However, feathers can accumulate drugs and hormones and there is evidence of arsenic in FM (44 - 4100 μg/kg) (Nachman et al., Reference NACHMAN, RABER, FRANCESCONI, NAVAS-ACIEN and LOVE2012). Other contaminants in FM include drugs such as caffeine, acetaminophen and antibiotics (Love et al., Reference LOVE, HALDEN, DAVIS and NACHMAN2012).
FM can be used as an organic fertiliser (e.g. Hadas and Kautsky, Reference HADAS and KAUTSKY1994; Vann et al., Reference VANN, BENNETT, FISHER, REBERG-HORTON and BURRACK2017), and contains about 15% nitrogen predominantly as non-soluble keratin (Hadas and Kautsky, Reference HADAS and KAUTSKY1994). This nitrogen is released slowly from FM, enhancing its potential as an organic fertiliser (Hadas and Kautsky, Reference HADAS and KAUTSKY1994). FM contains lipids with the fat content varying between 1.8% to 12% (Dale, Reference DALE1992), which can be converted to biodiesel, generating potentially two thirds of a billion litres of biodiesel in the USA and over 2.2 billion litres globally (Kondamudi et al., Reference KONDAMUDI, STRULL, MISRA and MOHAPATRA2009).
Other value-added products and potential uses
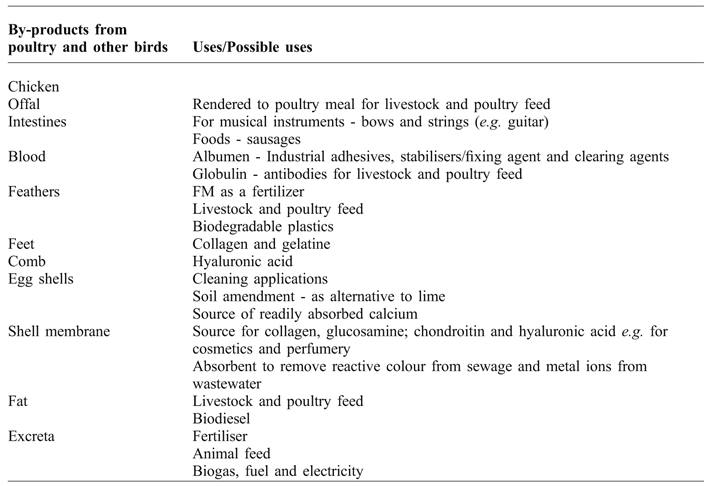
There are presently multiple value-added co-products from poultry processing but there is considerable scope for further such products. Co-products are used for human foods, products for food processing such as gelatine, health related products/pharmaceuticals such as collagen, gelatine and glycosaminoglycans, biodiesel, biogas (e.g. Elasri and El Amin Afilal, Reference ELASRI and EL AMIN AFILAL2016) and as fuel to generate heat for brooding and/or electricity. Table 6 summarises present and potential uses of chicken co-products.
Present and potential uses of chicken by-products.

Human consumption of co-products
Some waste from processing poultry can be consumed by people. Giblets consisting of the gizzard, the liver without the gall bladder and the heart (Sams and McKee, Reference SAMS and MCKEE2010), are used widely in human foods. The giblets are chilled quickly after removal, and are considered nutritious containing high quality proteins together with vitamins. There may be food safety issues due bacterial and other contamination, particularly if there is inadequate cooking, for example there have been outbreaks of campylobacteriosis in the United Kingdom following consumption of chicken liver pâté (Edwards et al., Reference EDWARDS, MILNE, MORROW, SHERIDAN, VERLANDER, MULLA, RICHARDSON, PENDER, LILLY and REACHER2014). However, there is now a method to ensure the safety of chicken liver pâté (Hutchison et al., Reference HUTCHISON, HARRISON, RICHARDSON and TCHÓRZEWSKA2015). Salmonella typhimurium was reportedly found in over 40% of liver and hearts purchased in Egypt (Abdel-Aziz, Reference ABDEL-AZIZ2013). Moreover, aflatoxin B1 contamination has been documented in almost 40% of liver samples and 14% of gizzards in Mozambique (Sineque et al., Reference SINEQUE, MACUAMULE and DOS ANJOS2017).
Other tissues that are eaten include feet, paws (feet with skin and nail sheaths removed), neck, abdominal fat pad (or leaf fat), small intestines (edible viscera) and skin. Chicken intestines are used in some local dishes such as the Filipino dish ‘Isaw ng Manok’ (grilled chicken intestine). Poultry fat is used in other cuisines, for instance, shmalz is a mixture of rendered poultry and pig fat used in German cuisine. Moreover, schmaltz, a staple of Ashkenazi Jewish and Eastern European cooking, is made from kosher poultry fat and is made by rendering/clarifying chicken or goose fat. Schmaltz is used to make matzo balls, chopped liver, chicken soup and also for baking. Gribenes are crispy chicken or goose skin after frying in Shmalz. Chicken feet are a common and popular dish in China.
Health related co-products
Chicken collagen and gelatine are very useful co-products from processing. Global production of gelatine was 0.349 million metric tons in 2011 (Widyasari and Rawdkuen, Reference WIDYASARI and RAWDKUEN2014). It is used in the food industry and to produce capsules for supplements and pharmaceuticals. The major source of gelatine is collagen in skin, bones and hooves from cattle and pigs. Gelatine can also be extracted from collagen in chicken bones (Eyre and Glimcher, Reference EYRE and GLIMCHER1974; Rammaya et al., Reference RAMMAYA, YING and BABJI2012; Cansu and Boran, Reference CANSU and BORAN2015), feet (Liu et al., Reference LIU, LIN and CHEN2001; de Almeida et al., Reference DE ALMEIDA, CALARGE and SANTANA2013) or heads (Du et al., Reference DU, KHIARI, PIETRASIK and BETTI2013). Chicken gelatine is considered Halal by Moslems. There is a need to replace bovine and/or porcine gelatines in foods and pharmaceuticals due to religious prohibitions, as both Muslims and Hindus are unable to consume, respectively, porcine and bovine gelatine (Du et al., Reference DU, KHIARI, PIETRASIK and BETTI2013). This provides a reason for replacing beef/pork gelatine with another source, and chicken gelatine provides an excellent candidate.
Poultry co-products can be used as supplements to improve joint health. These include mixtures of nutrients such as chicken collagen, glycoaminoglycans (polysaccharides with multiple units D-glucuronic acid and N-acetylglucosamine e.g. chondroitin sulphate) and amino sugars such as glucosamine and galactosamine (Deal and Moskowitz, Reference DEAL and MOSKOWITZ1999).
The chicken comb is one of the richest sources of hyaluronic acid and is used as a source for purified hyaluronic acid (da Rosa et al., Reference DA ROSA, TOVAR, MOURÃO, PEREIRA, BARRETO and BEIRÃO2012). Hyaluronic acid is employed in human medicine such as addressing pain and other problems associated with osteoarthritis (e.g. Kalman et al., Reference KALMAN, HEIMER, VALDEON, SCHWARTZ and SHELDON2008; Migliore and Procopio, Reference MIGLIORE and PROCOPIO2015). Moreover, it can be used to augment soft tissues, for instance, when injected into the dermis after degeneration due to aging (Manna et al., Reference MANNA, DENTINI, DESIDERI, DE PITÀP, MORTILLA and MARAS1999). Moreover, hyaluronic acid is used in cosmetically increase the thickness of the lips.
Uses of chicken fat in oleo-chemicals and biodiesel
Chicken fat (considered offal) can be used for human food, livestock feed, pet food and biofuels. Moreover, further processing of chickens generates skin as a co-product. Broiler skin without adipose tissue contains high levels of fat (20% to 30%) (Sheu and Chen, Reference SHEU and CHEN2002). However, skin is not commonly used in either human food or oleo-chemicals. The amount of poultry fat rendered per year in the USA is 1.01 million metric tons (Lin and Tan, Reference LIN and TAN2017). Poultry fat has a high energy content at 32.7 MJ/g.
Another use for poultry fat is as bio-diesel. It is estimated that the value for poultry in the USA due to the fat being used for biodiesel was US$51 million in 2013 (National Biodiesel Board, 2014). To produce biodiesel, fatty acids are esterified with short-chain alcohol (methanol or ethanol) in a ratio of 10:1; producing either fatty acid methyl esters or fatty acid ethyl esters. There are advantages in using poultry fats for biodiesel due to the lower proportion of saturated fatty acids and, hence, lower likelihood of solidification (Van Gerpen, Reference VAN GERPEN2014). Biodiesel produced from animal fat has high cetane numbers, but has disadvantages including the presence of phospholipids and sulphur (Van Gerpen, Reference VAN GERPEN2014).
Biodiesel production in 2016 was, in order of the top producing countries, USA 5.5 billion litres, Brazil 3.8 billion litres, Argentina 3.0 billion litres, Germany 3.0 billion litres, Indonesia 3.0 billion litres, France 1.5 billion litres, Thailand 1.4 billion litres and Spain 1.1 billion litres (Statistica, 2017; US Department of Energy, 2017). In the USA, only 1% of the source for biodiesel was animal fats in 2007, rising to 26% in 2010 but declining to 13% in 2014; with the reduction reflecting overall increase in production and changes in the price of soy oil (National Biodiesel Board, 2014).
Conclusions
With increasing production of poultry meat, there needs to be continued and, indeed, greater, attention on sustainability issues relating to processing. There is considerable scope to increase the efficiency of poultry processing globally by the use of larger birds together with employing improved genetics, nutrition and other aspects of husbandry. Moreover, there can be considerably greater use of the waste as a series of value-added co-products.
Acknowledgments
Financial support by Rasht Branch, Islamic Azad University, grant number 17.16.4.877430 is gratefully acknowledged.