Introduction
Disturbances of sleep (e.g. insomnia or hypersomnia) and circadian activity are prominent features of mood episodes in bipolar disorder (BP) (American Psychiatric Association, 2013). These disturbances do not only occur during mood episodes; manic and depressive episodes are often preceded by changes in sleep and activity levels (Jackson, Cavanagh, & Scott, Reference Jackson, Cavanagh and Scott2003), and some studies have observed these disturbances in euthymic BP patients as well (Cretu, Culver, Goffin, Shah, & Ketter, Reference Cretu, Culver, Goffin, Shah and Ketter2016; De Crescenzo, Economou, Sharpley, Gormez, & Quested, Reference De Crescenzo, Economou, Sharpley, Gormez and Quested2017; Pagani et al., Reference Pagani, Clair, Teshiba, Service, Fears, Araya and Freimer2016), suggesting that altered sleep and physical activity may represent a trait marker of the disorder. There is increasing evidence for the fundamental role of sleep in mood, brain structure, cognition and quality of life; in healthy individuals poorer self-reported quality of sleep has been related to smaller brain volumes (Sexton, Storsve, Walhovd, Johansen-Berg, & Fjell, Reference Sexton, Storsve, Walhovd, Johansen-Berg and Fjell2014; Stoffers et al., Reference Stoffers, Moens, Benjamins, van Tol, Penninx, Veltman and Van Someren2012), poorer cognitive function (Alhola & Polo-Kantola, Reference Alhola and Polo-Kantola2007; Durmer & Dinges, Reference Durmer, Dinges, Roos and Avidan2005) and temperament traits such as impulsivity (Anderson & Platten, Reference Anderson and Platten2011) and aggressive behavior (Kamphuis, Meerlo, Koolhaas, & Lancel, Reference Kamphuis, Meerlo, Koolhaas and Lancel2012). In addition, increased physical activity has been associated with fewer depressive symptoms in individuals with BP and schizophrenia (Aas et al., Reference Aas, Djurovic, Ueland, Mørch, Fjæra Laskemoen, Reponen and Andreassen2019; Merikangas et al., Reference Merikangas, Swendsen, Hickie, Cui, Shou, Merikangas and Zipunnikov2018) a lower risk of mood disorders in healthy individuals (He, Paksarian, & Merikangas, Reference He, Paksarian and Merikangas2018) and larger gray matter volume in older healthy adults (Bugg & Head, Reference Bugg and Head2011; Erickson, Leckie, & Weinstein, Reference Erickson, Leckie and Weinstein2014; Weinstein et al., Reference Weinstein, Voss, Prakash, Chaddock, Szabo, White and Erickson2012). Smaller cortical and subcortical volumes (Abramovic et al., Reference Abramovic, Boks, Vreeker, Bouter, Kruiper, Verkooijen and van Haren2016; Fears et al., Reference Fears, Service, Kremeyer, Araya, Araya, Bejarano and Bearden2014; Hibar et al., Reference Hibar, Westlye, van Erp, Rasmussen, Leonardo, Faskowitz and Agartz2016; Hibar et al., Reference Hibar, Westlye, Doan, Jahanshad, Cheung, Ching and Andreassen2018; Rimol et al., Reference Rimol, Hartberg, Nesvag, Fennema-Notestine, Hagler, Pung and Agartz2010), cognitive impairment (Bearden, Hoffman, & Cannon, Reference Bearden, Hoffman and Cannon2001; Fears et al., Reference Fears, Service, Kremeyer, Araya, Araya, Bejarano and Bearden2014; Vreeker et al., Reference Vreeker, Boks, Abramovic, Verkooijen, Van Bergen and Hillegers2016) and increased impulsivity (Najt et al., Reference Najt, Perez, Sanches, Peluso, Glahn and Soares2007) are also hallmark characteristics of BP, observed even in patients in a euthymic state. However, despite the well-known disturbances in sleep and circadian activity in BP patients, to date it is unknown to what extent these are related to brain structure, cognitive function and temperament traits in patients with BP and those with a familial vulnerability to BP.
Multiple methods, such as assessments of body temperature, nocturnal arousal, cortisol levels and self-report questionnaires (Milhiet, Etain, Boudebesse, & Bellivier, Reference Milhiet, Etain, Boudebesse and Bellivier2011), have been used to characterize circadian rhythm both in BP patients and healthy individuals. However, only a few studies to date in BP patients have focused on the association between sleep and cognitive function, and, to our knowledge, no studies have reported on relationships between sleep and brain structure and temperament traits. The few existing studies found that worse sleep (defined as greater variability in nightly sleep duration across the week, initial or middle insomnia, poor sleep quality and/or increased daytime sleepiness) was associated with poorer cognitive function (Kanady, Soehner, Klein, & Harvey, Reference Kanady, Soehner, Klein and Harvey2017; Russo et al., Reference Russo, Mahon, Shanahan, Ramjas, Solon, Purcell and Burdick2015; Volkert et al., Reference Volkert, Kopf, Kazmaier, Glaser, Zierhut, Schiele and Reif2015); in particular, deficits in working memory, visual learning, verbal learning performance and social cognition. Although these studies reveal important insights into the relationship of sleep to cognitive performance in BP, sample sizes have been relatively small (Kanady et al., Reference Kanady, Soehner, Klein and Harvey2017; Volkert et al., Reference Volkert, Kopf, Kazmaier, Glaser, Zierhut, Schiele and Reif2015), activity levels were not examined and sleep was assessed using questionnaires, which are subject to biases of retrospective self-report.
Actigraphy (activity measurement through wrist-worn accelerometers) is an accurate method to assess sleep and circadian activity that can be conducted over prolonged periods without interfering with the individual's usual activities (Acebo & LeBourgeois, Reference Acebo and LeBourgeois2006). Previously, we showed that bipolar disorder type I (BP-I) patients sleep longer, are less active (Pagani et al., Reference Pagani, Clair, Teshiba, Service, Fears, Araya and Freimer2016) and have smaller brain volumes and lower cognitive abilities (Fears et al., Reference Fears, Service, Kremeyer, Araya, Araya, Bejarano and Bearden2014, Reference Fears, Schür, Sjouwerman, Service, Araya, Araya and Bearden2015) as compared with their non-BP-I relatives. Specifically, we found significant associations between BP-I and 13 sleep and physical activity traits measured by a minimum of 10 days of actigraphy in 136 BP-I patients and 422 of their non-BP-I relatives from 26 extended families with heavy genetic loading for BP (Pagani et al., Reference Pagani, Clair, Teshiba, Service, Fears, Araya and Freimer2016). In addition, we identified 18 brain volume traits and 21 behavioral traits (cognitive function and temperament) to be related to BP-I (Fears et al., Reference Fears, Service, Kremeyer, Araya, Araya, Bejarano and Bearden2014). The families from this sample were ascertained from two closely related, genetically isolated populations in the Central Valley of Costa Rica (CVCR) and the Antioquia region of Colombia (CO) and have been the focus of ongoing genetic studies of BP for several decades (Carvajal-Carmona et al., Reference Carvajal-Carmona, Ophoff, Service, Hartiala, Molina, Leon and Ruiz-Linares2003; Freimer et al., Reference Freimer, Reus, Escamilla, Spesny, Smith, Service and Sandkuijl1996; Herzberg et al., Reference Herzberg, Jasinska, Garcia, Jawaheer, Service, Kremeyer and Ruiz-Linares2006; Hong et al., Reference Hong, McInnes, Service, Song, Lucas, Silva and Freimer2004; Service et al., Reference Service, DeYoung, Karayiorgou, Roos, Pretorious, Bedoya and Freimer2006). The current study leverages the unique opportunity to investigate the relationship between BP-I-related sleep and activity traits (actigraphy traits), structural neuroanatomy (brain traits) and cognitive function and temperament (behavioral traits) in both BP-I patients and their non-BP-I relatives. Due to the large number of traits investigated in our previous studies, we focus here on those traits that were significantly associated with BP-I (Fears et al., Reference Fears, Service, Kremeyer, Araya, Araya, Bejarano and Bearden2014, Reference Fears, Schür, Sjouwerman, Service, Araya, Araya and Bearden2015; Pagani et al., Reference Pagani, Clair, Teshiba, Service, Fears, Araya and Freimer2016). The aims of the current study are to: (1) identify associations between BP-I-related actigraphy traits and BP-I-related brain and behavioral traits, and (2) characterize the genetic architecture of actigraphy, brain and behavior associations identified in aim 1. In the first part of aim 2, genetic correlations are estimated for all pairs of traits that showed significant evidence of association to each other. The genetic correlations are then used to identify pairs of traits for subsequent bivariate linkage analysis to map loci that may be jointly influencing the actigraphy-brain or actigraphy-behavior associations. We hypothesize that reduced activity levels and/or inadequate sleep are associated with smaller brain volume, reduced cortical thickness, poorer cognitive function and a less stable temperament. In addition, we expect these associations to be stronger for BP-I patients than for non-BP-I relatives.
Method
Sample
Twenty-six pedigrees from CO and CVCR were included in the current study (Carvajal-Carmona et al., Reference Carvajal-Carmona, Ophoff, Service, Hartiala, Molina, Leon and Ruiz-Linares2003; Freimer et al., Reference Freimer, Reus, Escamilla, Spesny, Smith, Service and Sandkuijl1996; Herzberg et al., Reference Herzberg, Jasinska, Garcia, Jawaheer, Service, Kremeyer and Ruiz-Linares2006; Hong et al., Reference Hong, McInnes, Service, Song, Lucas, Silva and Freimer2004; Service et al., Reference Service, DeYoung, Karayiorgou, Roos, Pretorious, Bedoya and Freimer2006). Data on actigraphy traits were available for 558 individuals, including 136 individuals with BP-I and 422 of their non-BP-I relatives. None of the study participants were in a mood episode at time of assessment. See online Supplementary Information (SI) and Supplementary Tables S1 and S2 and our previous work (Fears et al., Reference Fears, Service, Kremeyer, Araya, Araya, Bejarano and Bearden2014, Reference Fears, Schür, Sjouwerman, Service, Araya, Araya and Bearden2015; Pagani et al., Reference Pagani, Clair, Teshiba, Service, Fears, Araya and Freimer2016) for a detailed description of the sample.
Patients were ascertained through hospitals and clinics in CO and CVCR, using genealogic information to extend each pedigree. We included nuclear families with at least one member with BP-I, based on the Diagnostic Interview for Genetic Studies (DIGS) (Nurnberger et al., Reference Nurnberger, Blehar, Kaufmann, York-Cooler, Simpson, Harkavy-Friedman and Reich1994; Palacio et al., Reference Palacio, Garcia, Arbelaez, Sanchez, Aguirre, Garces and Ospina2004) and/or extensive medical records, available parents and at least two siblings without BP-I.
Clinical assessment
A clinical diagnosis was based on a best-estimate procedure (Freimer et al., Reference Freimer, Reus, Escamilla, Spesny, Smith, Service and Sandkuijl1996) including Spanish versions of the Mini International Neuropsychiatric Interview (Sheehan et al., Reference Sheehan, Lecrubier, Sheehan, Amorim, Janavs, Weiller and Dunbar1998) and the DIGS. Individuals with a best-estimate diagnosis of BP-I, unipolar mania, or schizoaffective disorder, bipolar type, were considered as BP-I patients, as in previous studies (Fears et al., Reference Fears, Service, Kremeyer, Araya, Araya, Bejarano and Bearden2014; Freimer et al., Reference Freimer, Reus, Escamilla, Spesny, Smith, Service and Sandkuijl1996; Herzberg et al., Reference Herzberg, Jasinska, Garcia, Jawaheer, Service, Kremeyer and Ruiz-Linares2006; Hong et al., Reference Hong, McInnes, Service, Song, Lucas, Silva and Freimer2004). We used the Young Mania Rating Scale (Young, Biggs, Ziegler, & Meyer, Reference Young, Biggs, Ziegler and Meyer1978) and the 17-item Hamilton Depression Rating Scale (Hamilton, Reference Hamilton1960) to assess current mood state. Individuals with significant mood symptoms were excluded from analyses.
Actigraphy traits
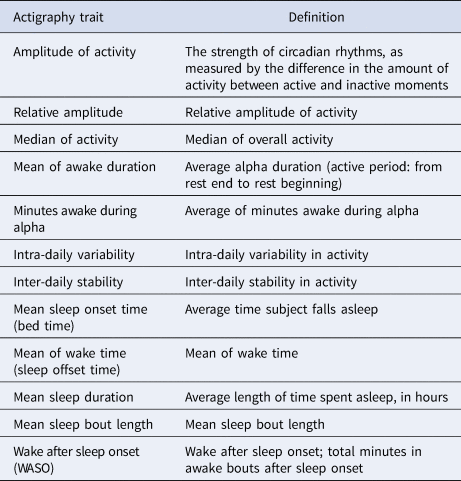
We recorded sleep and activity traits using actigraphy (activity measurement using wrist-worn accelerometers) for, on average, 14 consecutive days. See SI for a general description and (Pagani et al., Reference Pagani, Clair, Teshiba, Service, Fears, Araya and Freimer2016) for a detailed description of data collection and quality control (QC) procedures. We analyzed 12 actigraphy traits that we previously identified as associated with BP-I (Pagani et al., Reference Pagani, Clair, Teshiba, Service, Fears, Araya and Freimer2016). Table 1 shows an overview and description of these traits.
Description of actigraphy traits

Brain traits
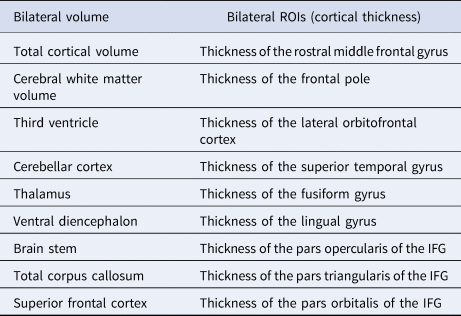
Of the individuals with actigraphy data, we also acquired T1-weighted structural neuroimages from 420 subjects (229 from CVCR and 191 from CO; see SI for details). For the current study, we examined nine magnetic resonance imaging bilateral volumetric traits and nine bilateral regions of interest related to BP-I in our sample (Fears et al., Reference Fears, Service, Kremeyer, Araya, Araya, Bejarano and Bearden2014, Reference Fears, Schür, Sjouwerman, Service, Araya, Araya and Bearden2015) (see Table 2).
Brain traits

ROI, region of interest; IFG, inferior frontal gyrus.
Behavioral traits
Data on cognitive and temperament traits were available for approximately 558 individuals with actigraphy data (289 from CVCR and 269 from CO). Individuals with missing data on one of the measures were pairwise excluded.
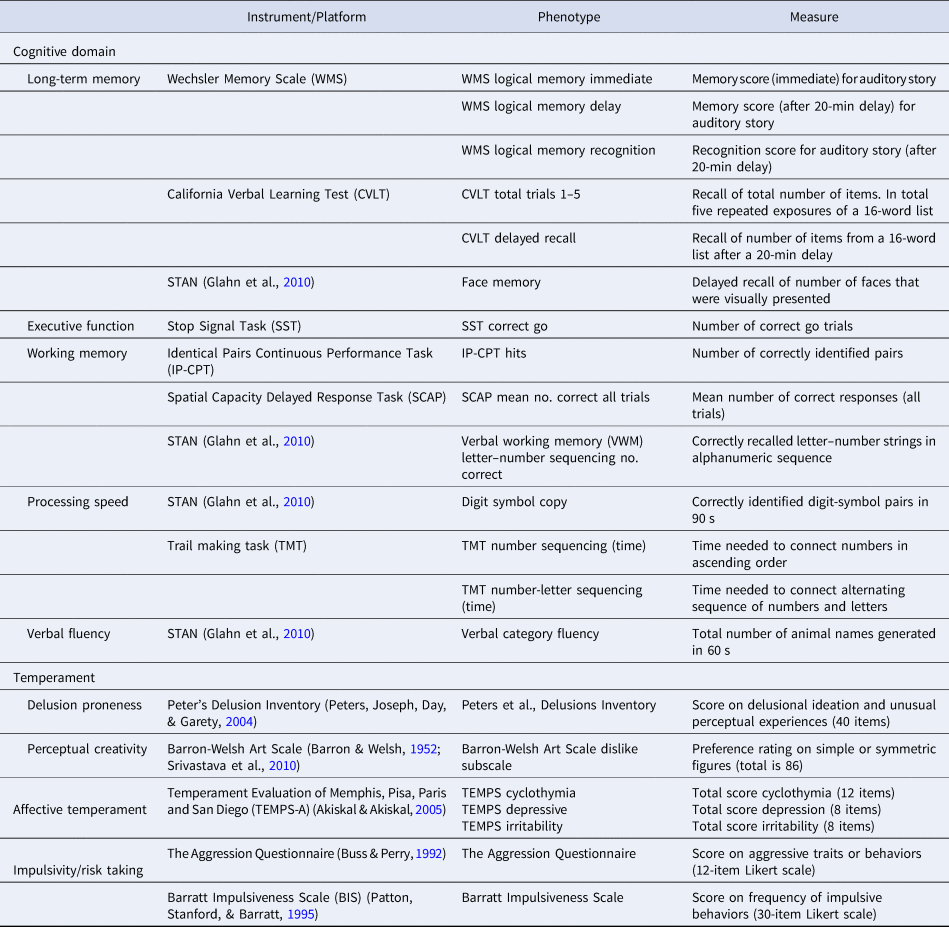
We included 21 behavioral measures that were associated with BP-I in our previous study (Fears et al., Reference Fears, Service, Kremeyer, Araya, Araya, Bejarano and Bearden2014, Reference Fears, Schür, Sjouwerman, Service, Araya, Araya and Bearden2015); 14 cognitive tests and seven measures of temperament (see Table 3).
Behavioral traits

Adapted from the table in Fears et al. (Reference Fears, Service, Kremeyer, Araya, Araya, Bejarano and Bearden2014).
Statistical analyses
First, we investigated the relationship between actigraphy-brain traits and actigraphy-behavior traits. To adjust for the effects of age, sex and site, we calculated standardized residuals of the brain, behavior and actigraphy traits and used these for further analyses (similar to Fears et al., Reference Fears, Service, Kremeyer, Araya, Araya, Bejarano and Bearden2014, Reference Fears, Schür, Sjouwerman, Service, Araya, Araya and Bearden2015; Pagani et al., Reference Pagani, Clair, Teshiba, Service, Fears, Araya and Freimer2016). In addition to age, sex and site, behavioral traits were also adjusted for education, brain traits were adjusted for body weight and brain volumes were additionally adjusted for total intracranial volume. Linear regressions were implemented in SOLAR (Almasy & Blangero, Reference Almasy and Blangero1998), using pedigree structures to adjust for non-independence of subjects. A rank-based procedure was used to inverse normal transform all phenotypes to mitigate errors induced by skewed distributions (Van der Waerden, Reference Van der Waerden1952).
We ran linear regression analyses using standardized residuals of brain or behavioral traits as outcomes and standardized residuals of actigraphy traits as predictors. We treated the actigraphy-brain and actigraphy-behavior associations as independent sets of tests and used separate Bonferroni correction to identify the strongest significant associations in each set. We considered p < 0.00023 for the actigraphy-brain associations (216 tests) and p < 0.00020 for the actigraphy-behavior associations (252 tests) as the significance threshold. In secondary analyses, we applied a less conservative threshold [false discovery rate (FDR; adjusted p < 0.05 (q < 0.05))] to identify broader patterns of association in the data.
In addition, we repeated all analyses of significant associations including a diagnosis × actigraphy trait interaction term, to investigate whether reported associations differed between BP-I patients and their non-BP-I relatives.
Genetic analysis
We first estimated genetic correlations (rhoG) for all pairs of traits that showed FDR-significant evidence of association. Genetic correlation represents the proportion of covariance between two traits due to common genetic influence (i.e. pleiotropy), and was estimated for selected pairs using SOLAR (Almasy & Blangero, Reference Almasy and Blangero1998). We then identified pairs of traits with the strongest rhoG estimates [>2 standard errors (SEs) away from zero] for subsequent bivariate linkage analysis.
Whole genome multipoint bivariate linkage analysis was implemented on pairs of traits showing strong evidence of genetic correlation, as described above. Linkage analysis used genotype data from 856 individuals, collected on the Illumina Omni 2.5 chip (for QC details see Pagani et al., Reference Pagani, Clair, Teshiba, Service, Fears, Araya and Freimer2016). The software package Loki (Heath, Reference Heath1997; Heath, Snow, Thompson, Tseng, & Wijsman, Reference Heath, Snow, Thompson, Tseng and Wijsman1997), which implements Markov Chain Monte Carlo, provided estimated multipoint identical by decent (MIBD) allele-sharing among family members from genotype data, using an LD-pruned subset of markers that passed QC procedures (Pagani et al., Reference Pagani, Clair, Teshiba, Service, Fears, Araya and Freimer2016). These MIBD were used in SOLAR to conduct the multipoint bivariate linkage analysis. SOLAR uses a variance component approach to partition the genetic covariance between relatives for each trait into locus-specific heritability (h2q) and residual genetic heritability (h2r).
A linkage region of interest (LROI) was determined by the extent of a 1.5 logarithm (base 10) of odds (LOD) unit support interval around peak bivariate LOD scores exceeding 3 where univariate linkage analysis showed suggestive evidence for linkage (LOD > 2) for both traits. All single-nucleotide polymorphisms (SNPs) within the LROI were analyzed for association to both phenotypes using multivariate linear mixed models, as implemented in GEMMA (Zhou & Stephens, Reference Zhou and Stephens2014). These regression models account for relatedness of individuals and are a powerful method to identify association of SNPs to correlated phenotypes. To account for multiple testing of SNPs in the LROI, we examined the linkage disequilibrium in founder subjects and identified haplotype blocks using Haploview (Barrett, Fry, Maller, & Daly, Reference Barrett, Fry, Maller and Daly2005). We considered all SNPs within a common haplotype block to represent one test. The total number of tests in the LROI was estimated as the number of identified haplotype blocks, plus the number of SNPs that were not in a haplotype block, and a Bonferroni threshold accounting for the total number of tests was used to declare significance.
Results
Actigraphy-brain analysis
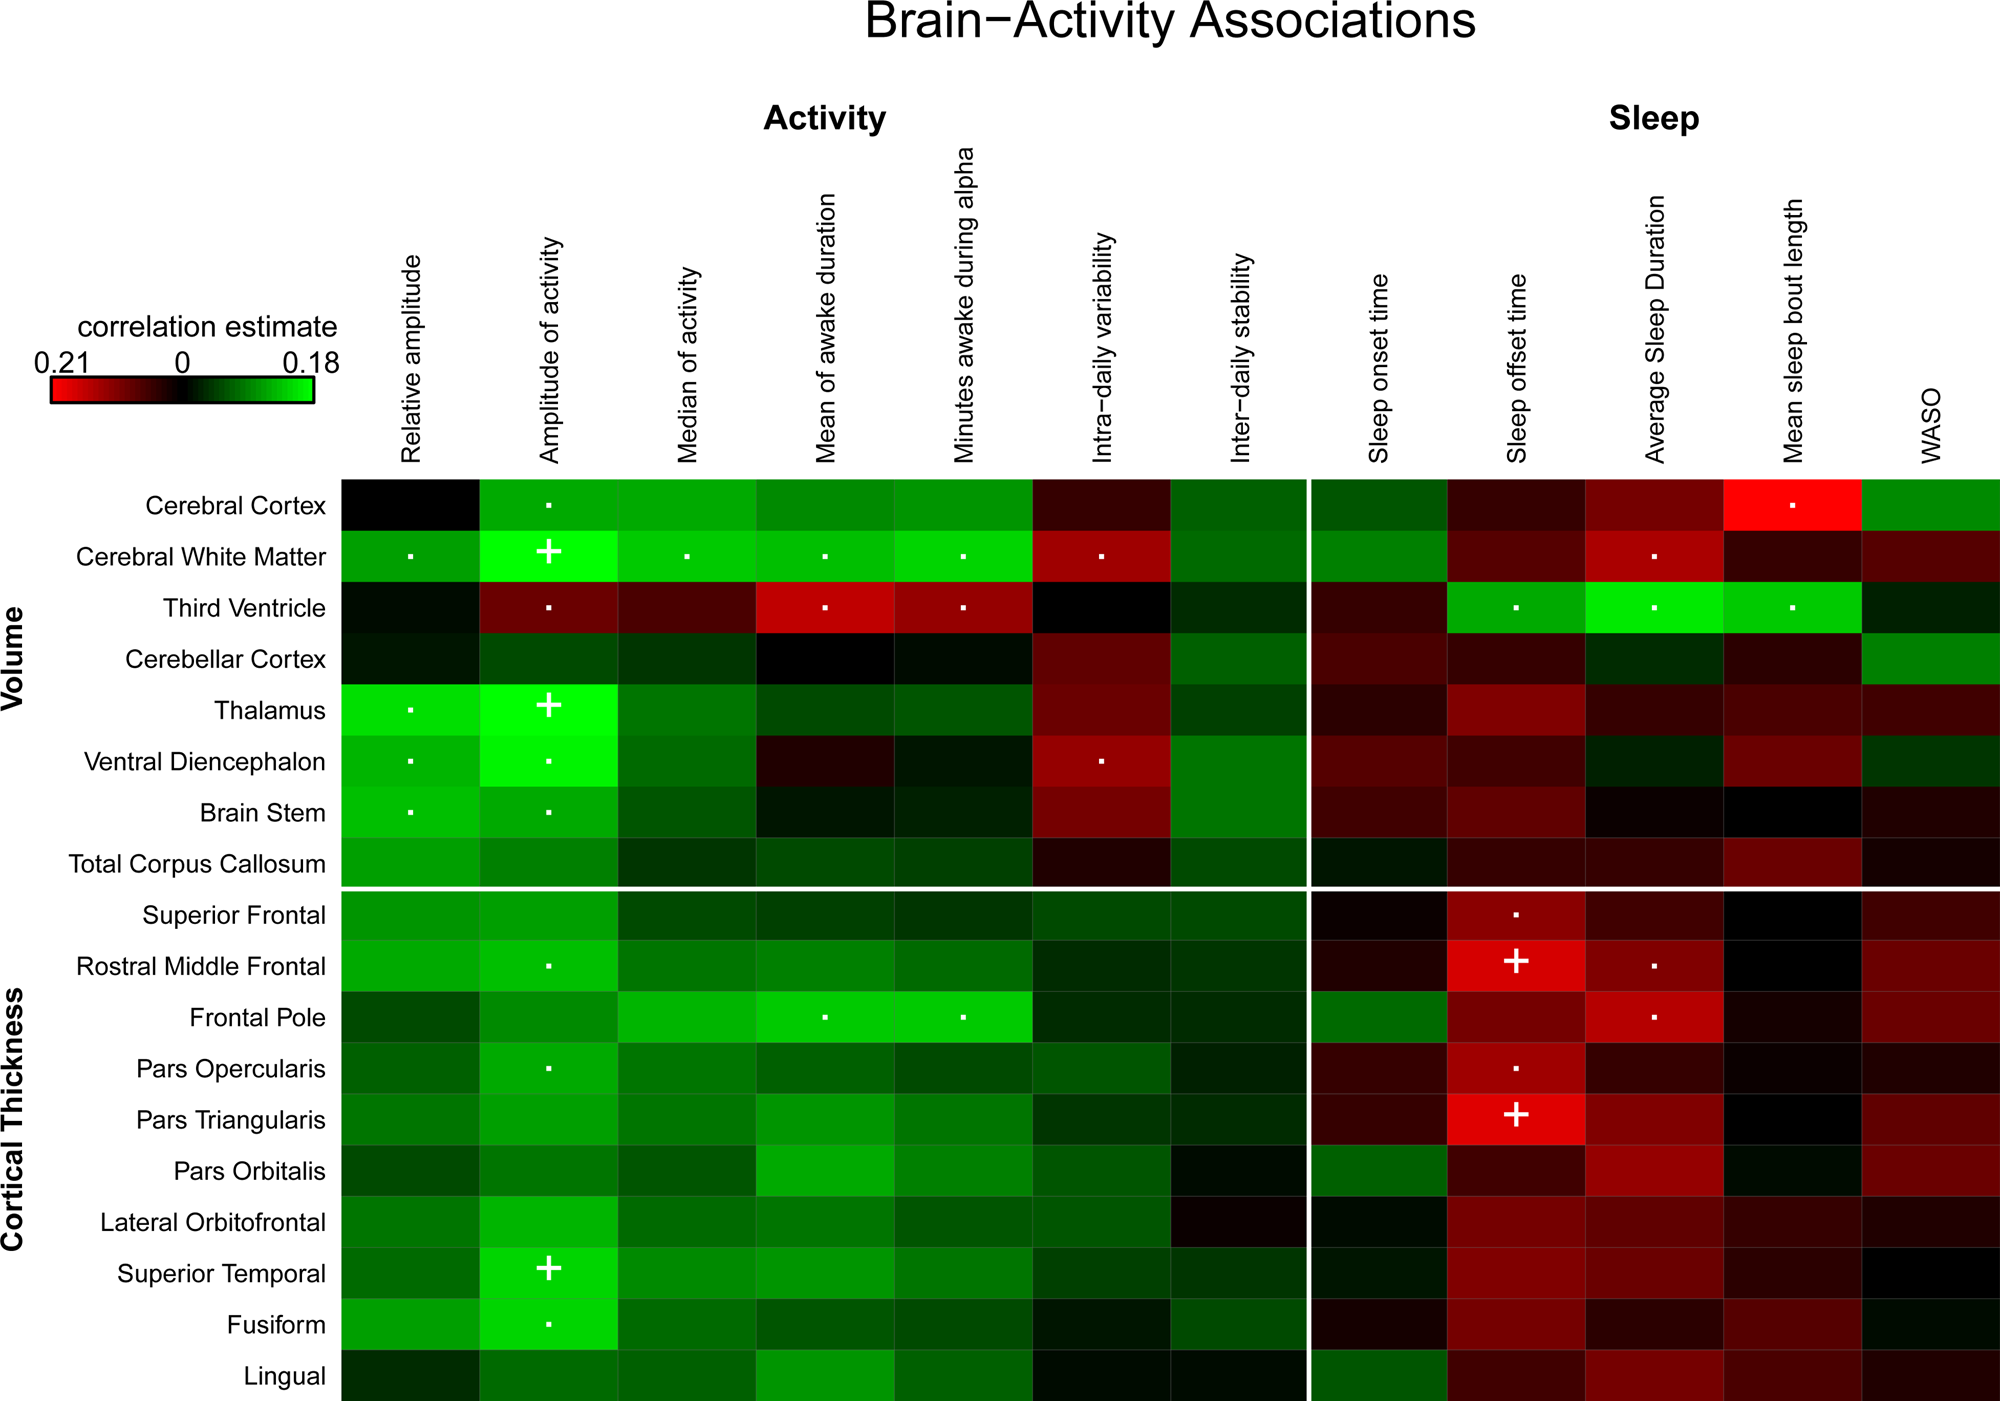
Five activity-brain pairs were Bonferroni-significant. Higher activity levels (amplitude of activity) were significantly associated with larger cerebral white matter volume, thalamic volume and thickness of the superior temporal gyrus. In addition, later awakening (mean of sleep offset time) was significantly associated with reduced thickness in frontal regions (pars triangularis of the inferior frontal gyrus and rostral middle frontal gyrus).
We found no significant diagnosis × actigraphy trait interaction for any of the brain traits, indicating that the actigraphy-brain associations did not differ between BP-I patients and their non-BP-I relatives (p > 0.00023). Online Supplementary Fig. S1 shows scatterplots of the activity-brain pairs showing significant associations.
Actigraphy-behavior analysis
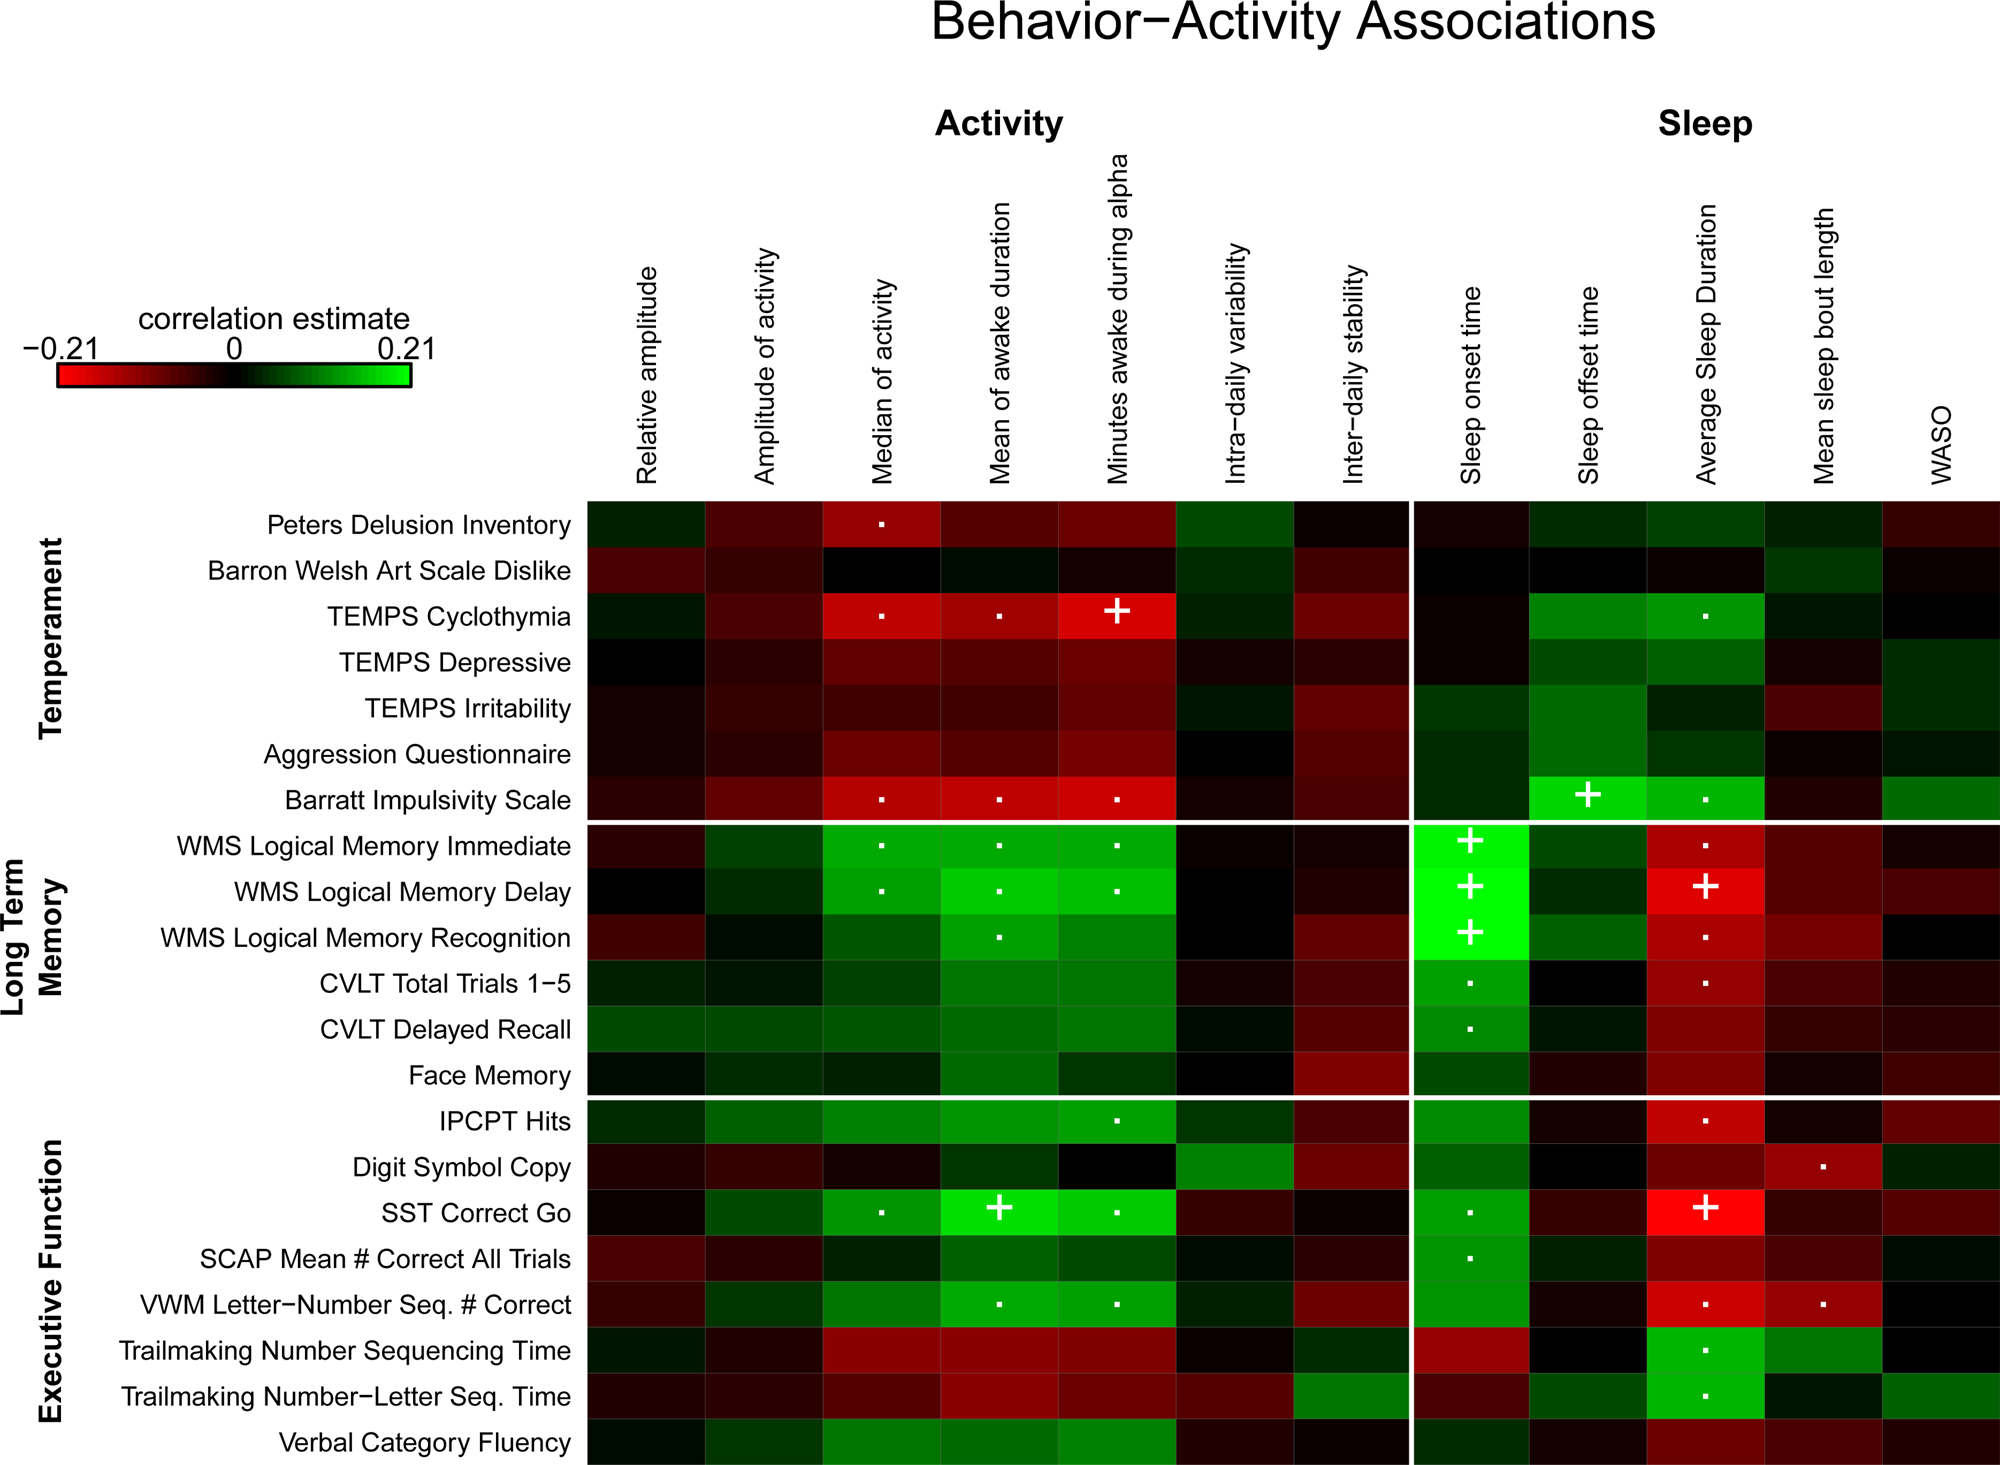
Eight actigraphy-behavior pairs were significant following Bonferroni correction. Later average bedtime was significantly associated with better long-term memory. Longer mean of awake duration was associated with better executive functioning. In addition, later awaking [phenotype mean of wake time (sleep offset time)] was related to higher impulsivity. We found negative associations for minutes awake during alpha (i.e. the active phase) with scores on the cyclothymic temperament factor (i.e. more minutes awake during alpha is related to a more stable mood) and average sleep duration with long-term memory and executive functioning (i.e. longer sleep duration was associated with worse memory and executive function).
We found no significant diagnosis × actigraphy trait interactions for any of the behavioral traits, suggesting that the actigraphy-behavior associations were similar between BP-I patients and their non-BP-I relatives (all p-values >0.00020). Online Supplementary Fig. S2 shows scatterplots of activity-behavior pairs involved in significant associations.
Secondary analysis of actigraphy-brain and actigraphy-behavior relationships
When we applied a more lenient threshold for multiple comparison correction (FDR-corrected p-value of q < 0.05), we found 34 significantly associated actigraphy-brain pairs, all of which showed a consistent linear pattern of direction: increased activity levels and more time spent awake were associated with larger brain volumes, increased cortical thickness, and smaller ventricular volume. Figure 1 and online Supplementary Table S3 show the Bonferroni and FDR-significant actigraphy-brain associations.
Significant actigraphy-brain associations. Bonferroni-significant associations are indicated with a ‘+’. FDR-corrected significant pairs are indicated with a ‘.’ Positive correlations are colored green and negative correlations are colored red. WASO = wake after sleep onset.

Applying a more liberal FDR threshold of q < 0.05 we found significant associations for 41 actigraphy-behavior pairs, all showing a consistent linear pattern of either increased activity or longer awake duration to be related to better long-term memory, working memory, executive function and processing speed, lower impulsivity, reduced delusion proneness and lower scores on the cyclothymic temperament factor, indicating a more stable mood. Figure 2 and online Supplementary Table S4 show all actigraphy-behavior associations.
Significant activity-behavior associations. Bonferroni-significant associations are indicated with a ‘+’. FDR-significant pairs are indicated with a ‘.’ Positive correlations are colored green and negative correlations are colored red. WASO = wake after sleep onset.

None of the diagnosis × actigraphy trait interactions survived this threshold either.
In addition, we repeated Bonferroni-significant analyses controlling for mood symptoms (see online Supplementary Table S5).
Genetic correlations
Of the 75 FDR-significant associations we selected nine pairs with the strongest genetic correlation estimates (>2 SEs from zero) for further study (see online Supplementary Table S6). Positive genetic correlations were found for average bedtime and long-term memory, measured by Wechsler Memory Scale (WMS) logical memory immediate, delay and recognition conditions. In addition, we found positive genetic correlations for mean of awake duration and long-term memory measured by WMS logical memory recognition and working memory, measured by verbal working memory (VWM) Letter–Number Sequencing, implying that common genetic factors influence the actigraphy and behavioral traits in a similar direction (i.e. genetic factors that are related to later bedtime are also associated with better long-term memory). Inverse genetic correlations were found for amplitude and superior temporal gyrus thickness and between mean of sleep bout length and cerebral cortical volume, indicating that common genetic factors influence these traits in the opposite direction. In addition, we found inverse genetic correlations between sleep duration and long-term memory and working memory, indicating that common genetic factors influence longer sleep and cognitive performance, but in opposite directions.
Bivariate linkage analysis
We implemented bivariate linkage analysis on the nine pairs showing strongest evidence of genetic correlation and identified a quantitative trait locus (QTL) with an LOD score of 3.35 for mean of awake duration and VWM on chromosome 7 at 6 MB. The bivariate linkage LOD score was greater than the univariate linkage score for the individual traits; univariate LOD score for mean of awake duration in the QTL was 2.0 and the univariate LOD score for VWM in the QTL was 2.18. We performed a follow-up bivariate genetic association analysis with individual SNP genotype data within the QTL. The minimum p-value identified in the association analysis was 3.9 × 10−04, which did not meet the significance threshold after Bonferroni correction for multiple testing (there were 3735 SNPs within the QTL; 2699 of these SNPs were in 522 haplotype blocks and 1036 SNPs were not in blocks. The total number of tests for our purpose was 1558, corresponding to a significance threshold of p = 3.2 × 10−05).
Discussion
In this large sample (n = 558) ascertained from 26 families with a high familial loading for BP, we identified a consistent pattern of more physical activity and longer awake duration to be associated with larger brain volumes, smaller ventricular volume, increased cortical thickness, lower impulsivity, a more stable mood and better cognitive function, in particular long-term memory and executive function. In addition, applying a less stringent correction (FDR) we also show associations of more physical activity and longer awake duration with (verbal) working memory, processing speed and reduced delusion proneness. In our previous analysis (Pagani et al., Reference Pagani, Clair, Teshiba, Service, Fears, Araya and Freimer2016) we showed that BP-I subjects awoke later and slept longer than non-BP-I subjects. However, here we did not find evidence that the actigraphy-brain and actigraphy-behavior associations differed between BP-I subjects and their non-BP-I relatives, suggesting that BP patients were not driving the observed associations. Additionally, we found positive genetic correlations between average bedtime and long-term memory, as well as mean of awake duration with long-term memory and working memory, implying that common genetic factors influence these traits in a similar direction (i.e. genetic factors associated with later mean bedtime are also associated with improved long-term memory). Inverse genetic correlations were found for amplitude of activity with superior temporal gyrus thickness, mean of sleep bout length with cerebral cortex volume and sleep duration with long-term memory and working memory, indicating that common genetic factors influence these traits in opposite directions (i.e. genetic factors associated with longer sleep duration are related to poorer memory). Finally, bivariate linkage analysis showed a suggestive QTL on chromosome 7 for mean of awake duration and VWM.
The positive influence of physical activity on brain plasticity and cognitive function has been described by multiple studies in children, healthy older adults and patients with mild cognitive impairment and Alzheimer's disease (Bherer, Erickson, & Liu-Ambrose, Reference Bherer, Erickson and Liu-Ambrose2013; Erickson, Hillman, & Kramer, Reference Erickson, Hillman and Kramer2015). Our findings that reduced activity and less adequate sleep are related to reduced brain volumes and cortical thickness and larger ventricular volume partly support findings in healthy unrelated individuals, indicating that reduced (quality of) sleep is related to smaller brain volumes (Sexton et al., Reference Sexton, Storsve, Walhovd, Johansen-Berg and Fjell2014; Spira et al., Reference Spira, Gonzalez, Venkatraman, Wu, Pacheco, Simonsick and Resnick2016). To our knowledge, the association of actigraphy traits with brain structure has not been previously studied in BP-I patients. However, one study found smaller thalamic volumes in youth at ultra-high risk for psychosis to be related to more disrupted sleep (Lunsford-Avery et al., Reference Lunsford-Avery, Orr, Gupta, Pelletier-Baldelli, Dean, Smith Watts and Mittal2013), which is partly in line with our results showing larger thalamic volumes to be related to higher activity levels. Interestingly, a recent diffusion tension imaging (DTI) study in BP-I patients and controls also showed positive associations between physical activity and brain measures. In that study, daytime and evening physical activity, measured by actigraphy, were related to increased integrity of white matter microstructure (Verkooijen et al., Reference Verkooijen, Stevelink, Abramovic, Vinkers, Ophoff, Kahn and van Haren2017).
Of the cognitive traits that we investigated, long-term memory, executive function, (verbal) working memory and processing speed were significantly associated with actigraphy traits. This is partly in line with findings from a recent study in BP and schizophrenia patients showing better executive functioning and working memory in patients with ⩾90 min of physical activity per week as compared to patients with fewer minutes of physical activity per week (Aas et al., Reference Aas, Djurovic, Ueland, Mørch, Fjæra Laskemoen, Reponen and Andreassen2019). In our study, long-term memory was most often related to actigraphy traits, showing that shorter awake duration and/or lower activity levels were related to worse long-term memory. The importance of sleep in the promotion of memory consolidation has been demonstrated by multiple studies (Diekelmann & Born, Reference Diekelmann and Born2010). Interestingly, several studies in healthy individuals suggest a U-shaped relationship between sleep duration and memory function, indicating that short (⩽6 h) or long (⩾9 h) sleep durations are related to worse memory function relative to a 7 or 8 h sleep duration (Kronholm et al., Reference Kronholm, Sallinen, Suutama, Sulkava, Era and Partonen2009; Xu et al., Reference Xu, Jiang, Lam, Liu, Jin, Zhu and Thomas2011). This U-shaped relationship has been found for other cognitive domains, such as executive function and verbal memory, as well (Kronholm et al., Reference Kronholm, Sallinen, Suutama, Sulkava, Era and Partonen2009; Kyle et al., Reference Kyle, Sexton, Feige, Luik, Lane, Saxena and Spiegelhalder2017). However, in our study, there was no suggestion of a U-shaped distribution between sleep and cognitive function.
Other behavioral traits that were significantly associated with actigraphy traits were cyclothymia, delusion proneness and impulsivity. These findings support observations in the general population as well as in individuals with depression and schizophrenia, suggesting that regular physical activity is related to improved mood (Paluska & Schwenk, Reference Paluska and Schwenk2000; Stephens, Reference Stephens1988) and reduced psychotic symptom severity (Beebe et al., Reference Beebe, Tian, Morris, Goodwin, Allen and Kuldau2005). Moreover, they are consistent with findings from the few studies on the relationship of physical activity and impulsivity; that physical activity appears to be associated with reduced symptoms of impulsivity in children and adults with attention deficit-hyperactivity disorder (Abramovitch, Goldzweig, & Schweiger, Reference Abramovitch, Goldzweig and Schweiger2013).
Our genetic analyses suggest that several activity-brain and activity-behavior trait pairs are influenced by common underlying genetic factors. To our knowledge, these genetic relationships have not been shown in humans before. However, findings from a genome-wide association study (GWAS) in 112 586 individuals from the general population indicate a significant negative genetic correlation between insomnia and years of education (Lane et al., Reference Lane, Liang, Vlasac, Anderson, Bechtold, Bowden and Saxena2017), suggesting a potential genetic relationship between sleep behavior and cognitive function. In addition, our findings add evidence to our previous studies suggesting an extensive network of genetically correlated traits spanning behavioral and brain structure domains (Fears et al., Reference Fears, Schür, Sjouwerman, Service, Araya, Araya and Bearden2015). Identifying causal structures underlying the connections of activity–brain–behavior networks and how they are related to BP will require the identification of the specific loci influencing the correlated phenotypes. Although we identified a suggestive QTL on chromosome 7 influencing awake duration and VWM, we were unable to identify SNPs significantly associated with the traits, likely because our sample is underpowered for these mapping studies. Current work in these pedigrees is using whole genome sequence to identify rare variants that may be influencing the actigraphy, brain and behavioral phenotypes.
The current study has certain limitations. First, we included close family relationships from isolated geographic regions, which make them more similar to each other compared with cases and independently ascertained controls. It is possible that the activity patterns of the non-BP-I relatives would also differ from unrelated controls, and that these brain–activity relationships would not be observed in healthy unrelated individuals. Additionally, we could not control for the potential effect of medication use, because medication use in our sample is confounded by diagnosis. Also, the cross-sectional design of the study does not allow us to draw conclusions regarding direction of effect. While it is possible that reduced physical activity results in smaller brain volumes and lower cognitive function, findings may be bi-directional or not causally related; the correlation between traits could be driven by a third variable. Finally, findings from this study should be replicated in an independent cohort. However, at present there are no other available datasets with sufficiently comparable measures of actigraphy and brain and behavioral traits in BP patients and healthy individuals.
Conclusion
In the first study on the relationship between actigraphy, brain and behavioral traits in BP-I patients and their non-BP-I relatives, we show that more physical activity and longer awake duration are associated with increased brain volumes and thickness, smaller third ventricle volume, better cognitive functioning and a more stable temperament. We show genetic pleiotropy for several actigraphy-behavior and actigraphy-brain phenotypes, suggesting a shared genetic basis for these traits.
Supplementary material
The supplementary material for this article can be found at https://doi.org/10.1017/S0033291719003416.
Acknowledgements
We thank the members of CR and CO families for participating in this study and John Blangero and Thomas Dyer (Texas Biomedical Research Institute and University of Texas Health Science Center) for calculating MIBDs. This research was supported by the National Institute of Health Grants R01MH075007, R01MH095454, U01MH105578 and P30NS062691 (to N.B.F.), K23MH074644-01(to C.E.B.), R03MH105808 (to S.C.F. and C.E.B.), R01HG006695 (to C.S.), K08MH086786 (to S.C.F.), the Colciencias and Codi-University of Antioquia (to C.L.-J.) and the Joanne and George Miller Family Endowed Term Chair (to C.E.B.). We thank the Stanley Center for Psychiatric Research for funding. J.S.T. is an Investigator in the Howard Hughes Medical Institute.
Conflict of interest
None.
Ethical standards
The authors assert that all procedures contributing to this work comply with the ethical standards of the relevant national and institutional committees on human experimentation and with the Helsinki Declaration of 1975, as revised in 2008.