Introduction
Long-term change in genetic population structure and size is rarely studied in any organisms (Rubidge et al., Reference Rubidge, Patton, Lim, Burton, Brashares and Moritz2012). To study cryptic population genetic heterogeneity and past population size changes, population genetics analyses have proven to be useful tools. In addition, pests may acquire resistance against chemicals or natural enemies by modification of genetic characteristics (e.g., Bemisia tabaci, Rauch & Nauen, Reference Rauch and Nauen2003; Horowitz et al., Reference Horowitz, Kontsedalov, Khasdan and Ishaaya2005). In mono- or oligo-phagous herbivores, association with host plants may contribute to the formation of genetically distinct host races and ultimately speciation (Ehrlich & Raven, Reference Ehrlich and Raven1964).
The alfalfa weevil, Hypera postica (Gyllenhal), is an oligophagous herbivore. Both larvae and adults infest legumes such as Medicago species and feed on alfalfa (Medicago sativa L.) especially in North America (Newton, Reference Newton1933). Hypera postica is native to western Eurasia and the Mediterranean regions and was accidentally introduced into the United States in 1904. In Japan, H. postica was first discovered in south-western parts of the country, Fukuoka (near Fukuoka airport, Kimura et al., Reference Kimura, Okumura and Yoshida1988) and Okinawa prefectures in 1982, and has spread into western and central Japan and then into Hokkaido (Kato, Reference Kato1989; Utsumi, Reference Utsumi1989; Hayashikawa, Reference Hayashikawa1999). Hypera postica was categorized as one of the 100 worst invasive alien species (K. Goka, http://www.nies.go.jp/biodiversity/invasive/index_en.html). In Japan, H. postica infests the leguminous weeds, such as toothed medic (Medicago polymorpha L.), black medic (Medicago lupulina L.) and narrow-leaved vetch (Vicia angustifolia) (=V. sativa L. subsp. nigra (L.)Ehrh.). In addition, H. postica damages Chinese milk vetch (Astragalus sinicus L.), an important honey resource and green manure crop, and Vicia villosa Roth, which is cultivated as a cover plant to control weeds and as green manure crop. Hypera postica is thus considered a serious pest in the apiculture industry in Japan (Okumura, Reference Okumura1991). Because of their harmful effect on A. sinicus and honeybees, insecticides are inappropriate for suppressing the weevil (Kuwata et al., Reference Kuwata, Tokuda, Yamaguchi and Yukawa2005). Alternatively, cultural control and classical biological control against H. postica are applied. Out of four species of parasitoid wasps that have been introduced to Fukuoka to control H. postica (Kimura & Kaku, Reference Kimura and Kaku1991; Radcliffe & Flanders, Reference Radcliffe and Flanders1998), only Bathyplectes anurus (Thomson) (Hymenoptera: Ichneumonidae) is established (since 1996) and is considered the most promising natural enemy (Okumura & Shiraishi, Reference Okumura and Shiraishi2002; Shoubu et al., Reference Shoubu, Okumura, Shiraishi, Kimura, Takagi and Ueno2005).
Three H. postica biotypes, Western, Egyptian and Eastern, have been identified in the United States (e.g., Hsiao, Reference Hsiao, Kim and McPheron1993). These strains are morphologically indistinguishable (Pienkowski et al., Reference Pienkowski, Hsieh and LeCato1969) but differ in various ecological traits and years/places of invasion into the USA (Wood et al., Reference Wood, Armbrust, Bartell and Irwin1978). None of the strains encapsulate eggs of B. anurus (Maund & Hsiao, Reference Maund and Hsiao1991). The Western weevil strain in the USA is infected with Wolbachia (Rickettsiales, Rickettsiaceae) (Hsiao & Hsiao, Reference Hsiao and Hsiao1985), causing partial cytoplasmic incompatibility between Western and Eastern/Egyptian strains (Blickenstaff, Reference Blickenstaff1965; White et al., Reference White, Armbrust and Ashley1972; Hsiao & Hsiao, Reference Hsiao and Hsiao1985). Wolbachia infection has been studied in H. postica populations only from Utah, USA and the Netherlands (Hsiao & Hsiao, Reference Hsiao and Hsiao1985). In Japan, H. postica was initially identified in the early 1990s as the Egyptian strain on the basis of its ecological form and morphological characteristics (Ohto, unpublished, 1991). In 2001, however, Kuwata et al. (Reference Kuwata, Tokuda, Yamaguchi and Yukawa2005) found Western strain as well as Egyptian strain based on mitochondrial DNA (mtDNA) sequence data collected from populations in central to south-western Japan. However, the population genetic characteristics have not been studied in H. postica in regard to different host plants.
Hypera postica has a univoltine life cycle. Larvae hatch from eggs embedded in stalks of host plants in March, feed on leaves in April and May, and pupate on host plants or in the soil in May and June. Emerged adults enter diapause during the summer (i.e., aestivation) in aggregation from June to November under bark, stones or in between building materials; they mate from November to February and female adults oviposit from December to May.
In Japan, A. sinicus is sown in paddy fields before tilled and irrigated for rice cultivation. The seeds of A. sinicus were formerly sown in late September, causing synchronization of A. sinicus growth with the H. postica adult oviposition period. For cultural control of H. postica, seed sowing in November has been recently recommended to decrease this synchronization (Takemoto & Nakamura, unpublished, 1994). Astragalus sinicus blooms in April and May and is buried for rice paddy cultivation in June. The leguminous weed V. angustifolia is abundant in disturbed areas such as fields, roadsides and banks; it germinates in November and dies in late May. In addition, seeds of V. villosa are sown on agricultural and fallow land. The sowing time and life history of V. villosa are almost the same as those of A. sinicus.
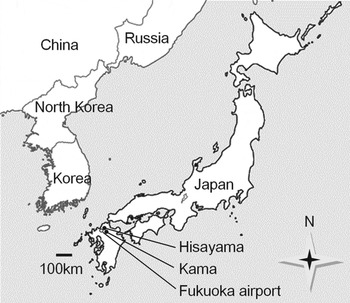
Since its initial introduction to Japan, H. postica has expanded its host range from M. polymorpha and V. angustifolia to include A. sinicus (Kimura et al., Reference Kimura, Okumura and Yoshida1988; Hayashikawa, Reference Hayashikawa1999). We suspect this host range expansion may have led to the formation of new host race(s). Past studies, however, have all focused on economically important host plants of H. postica and no attention has been paid to the effects of other potential hosts on H. postica population dynamics and genetics. To test possible effects of host plants and geographic population structure on genetic diversity and to assess evidence for past population-size increases, we analyzed mitochondrial and nuclear gene sequences of H. postica individuals collected from Fukuoka Prefecture, located in northern Kyushu, Japan (fig. 1). We compared our mtDNA sequences from H. postica collected in 2012 with sequence data obtained from individuals sampled in 2001 (Kuwata et al., Reference Kuwata, Tokuda, Yamaguchi and Yukawa2005). Also, we used a polymerase chain reaction (PCR)-based diagnostic approach to screen for Wolbachia infection (Hsiao, Reference Hsiao, Symondson and Liddell1996).
Collection sites of Hypera postica in 2011 and 2012 (●). Fukuoka airport, where H. postica was intercepted, is shown as (○).

Materials and methods
Field collection
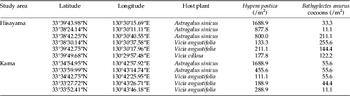
Hypera postica larvae were collected in Fukuoka Prefecture, Japan from A. sinicus, V. angustifolia, and V. villosa by mowing 30 cm×30 cm quadrats in six locations in Hisayama on May 2, 2012 and five locations in Kama on May 3, 2012 (table 1, fig. 1). Based on GIS data, the Euclidean distance between the central point of the Hisayama study area (33°38.50′38.823″N, 130°29.83′30.060″E) and that of the Kama study area (33°33.40′47.564″N, 130°42.60′34.300″E) was about 21.86 km. The six Hisayama study locations were distributed over a maximum of 2.6 km north–south directions, with an average distance between points of 1.62 km. Similarly, the five Kama study points were located over a maximum of 2.8 km northwest–southeast directions; the average distance between the five study points was 1.77 km. After counting H. postica larvae, pupae and adults and B. anurus cocoons (containing larvae/pupae/adult), we stored the collected plants and H. postica larvae in a freezer at −30 °C until use. To test the effect of host plant, location, and B. anurus density, the densities of H. postica were subjected to a generalized linear model with a log link and a Poisson distribution. To test the effect of host plant, location, and H. postica density, B. anurus density was also subjected to a generalized linear model with a log link and a Poisson distribution. Overdispersion of the data was tested and was corrected if it was significant. We conducted these analyses using JMP8.0 (SAS Institute Inc., Cary, NC, USA).
Geographic locations and host plants from which Hypera postica was collected.

DNA sequencing
Whole genomic DNA was extracted from a total of 60 H. postica, corresponding to five from each host patch for A. sinicus and V. angustifolia and 10 from a V. villosa patch, using a DNeasy Blood & Tissue kit (Qiagen, Tokyo, Japan). We amplified and sequenced one mitochondrial fragment, tRNALeu-COII, and one nuclear fragment, elongation factor-1α (EF-1α). The primers used for PCR amplification were TL2-J-3037 (5′-TAA TATG GCA GAT TAG TGC ATT GGA-3′) and TK-N-3785 (5′-GAG ACC ATT ACT TGC TTT CAG TCA TCT-3′) (Gomez-Zurita et al., Reference Gomez-Zurita, Juan and Petitpierre2000, modified from Simon et al., Reference Simon, Frati, Beckenbach, Crespi, Liu and Flook1994; see Tuda et al., Reference Tuda, Ronn, Buranapanichpan, Wasano and Arnqvist2006 for details) for tRNALeu-COII. Those for EF-1α were 5′-GGT ATC ACC ATT GAT ATT GCH TTD TGG AA-3′ and 5′-ACC AGC AAC ATA ACC ACG ACG-3′ (Mardulyn et al., Reference Mardulyn, Othmezouri, Mikhailov and Pasteels2011). PCRs were performed following Tuda et al. (Reference Tuda, Wasano, Kondo, Horng, Chou and Tateishi2004) in 12.5-μl total volumes. Cycling conditions for tRNALeu-COII consisted of initial preheating at 95 °C for 2 min, followed by 35 cycles of denaturation step at 94 °C for 30 s, annealing step at 51 °C for 40 s, and extension step at 60 °C for 1 min. Those for EF-1α consisted of preheating at 95 °C for 2 min, followed by 35 cycles of denaturation at 94 °C for 30 s, annealing at 51 °C for 40 s, and extension at 68 °C for 1 min 10 s. If the amplification was unsuccessful, we performed PCR at modified annealing temperatures (±3 °C) with increased number of cycles. After purification of PCR products, sequencing was performed at 96 °C for 1 min, followed by 30 cycles of 96 °C for 10 s, 50 °C for 5 s and 60 °C for 2 min 30 s, using BigDye Terminator v3.1 Cycle Sequencing kit (Life Technologies/Applied Biosystems) on a 3730 DNA Analyzer (Applied Biosystems).
Infection by Wolbachia
Because infection by and/or vertical transmission of the intracellular symbiont, Wolbachia may select for mitochondrial haplotypes in infected female adults through cytoplasmic incompatibility (Turelli & Hoffmann, Reference Turelli and Hoffmann1991), we performed PCRs to diagnose possible Wolbachia infection using primers fts-Z-f and fts-Z-r designed to amplified the ftsZ gene coding fragment (Holden et al., Reference Holden, Brookfield and Jones1993). Callosobruchus chinensis (L.) naturally infected with Wolbachia was used as a positive control (Kondo et al., Reference Kondo, Tuda, Toquenaga, Lan, Buranapanichpan, Horng, Shimada and Fukatsu2011).
Statistical parsimony network construction
Statistical parsimony networks (Templeton et al., Reference Templeton, Crandall and Sing1992) were estimated for both mitochondrial tRNALeu-COII and nuclear EF-1α fragments. Networks were constructed using TCS 1.21 (Clement et al., Reference Clement, Posada and Crandall2000) with a connection limit of 25 steps (80% confidence limit). There were gaps and heterozygous sites. Gaps were treated as the 5th character state. Heterozygous sites were treated as missing data using IUPAC ambiguity code. Loops were broken based on coalescent theory (Pfenninger & Posada, Reference Pfenninger and Posada2002; Kauwe et al., Reference Kauwe, Shiozawa and Evans2004).
Assessment of population genetic structure
To test any population genetic differences between the two geographic regions (Hisayama and Kama) and among the three host plants (A. sinicus, V. angustifolia, and V. villosa), we conducted analyses of molecular variance (AMOVAs) on the nucleotide sequences of the mitochondrial DNA and nuclear DNA genes using Arlequin 3.5.1.3 (Excoffier & Lischer, Reference Excoffier and Lischer2010) with 2000 permutations. The sample sizes for mitochondrial DNA were 35 from 6 local populations in Hisayama and 25 from 5 local populations in Kama. The sample sizes for nuclear DNA were 29 from the 6 Hisayama populations and 23 from the 5 Kama populations. Gamma correction values were set at 80 for tRNALeu-COII and at 0.1 for EF-1α, which were estimated empirically using MrBayes3.2 (Ronquist & Huelsenbeck, Reference Ronquist and Huelsenbeck2003). Genetic diversity (π, mean pairwise difference per fragment) and nucleotide diversity (mean Tamura-Nei distance (Tamura & Nei, Reference Tamura and Nei1993) and mean pairwise difference per site (Tajima, Reference Tajima1983)) were calculated using Arlequin. We chose Tamura-Nei distance for the following reason. Base frequency was biased (AT rich) for both tRNALeu-COII and EF-1α and different substitution rates between transitions and transversions were suggested for the former as follows. HKY+G model (Hasegawa, Kishino and Yano model [Hasegawa et al., Reference Hasegawa, Kishino and Yano1985], with a gamma distribution of rates across sites) for tRNALeu-COII and F81 (Felsenstein, Reference Felsenstein1981)+G model for EF-1α were the best fits based on AICc, using MrAIC.pl 1.3.1 (Nylander, Reference Nylander2004). Both HKY and F81 suggest biased base frequencies and the HKY model applies different substitution rates for transitions and transversions. Tamura-Nei distance allows different substitution rates for transitions and transversions and biased base frequency. We also calculated simple pairwise difference as a reference.
Demographic growth
Populations in different locations and on different hosts were tested for recent past sudden demographic growth by calculating raggedness (r; Harpending, Reference Harpending1994), F S (Fu, Reference Fu1997) and R 2 (Ramos-Onsins & Rozas, Reference Ramos-Onsins and Rozas2002) in DnaSP 5.10.0.1 (Librado & Rozas, Reference Librado and Rozas2009). Nonsignificant r, significantly negative F S , and significantly small R 2 values indicate recent sudden population growth. Since F S and R 2 are statistically more powerful than r, we relied more on F S and R 2. To test statistical significance of these indices, 2000 coalescent simulations were performed using DnaSP. Mutational time since demographic growth (τ) and the mutation parameter before demographic growth (θ initial) were also estimated under the assumption of an infinitely large θ final (Rogers & Harpending, Reference Rogers and Harpending1992; Rogers, Reference Rogers1995).
Extended Bayesian skyline plot
We estimated past population size changes based on coalescent theory with the extended Bayesian skyline plot (Heled & Drummond, Reference Heled and Drummond2008) using BEAST v1.8.0 (Drummond & Rambaut, Reference Drummond and Rambaut2007). The substitution rate for mtDNA was set at 0.0177 per million years, in reference to the divergence rate 3.54% estimated from tenebrionid beetles (Papadopoulou et al., Reference Papadopoulou, Anastasiou and Vogler2010). The substitution rate for nDNA was estimated empirically. Markov chain Monte Carlo (MCMC) simulations were performed for 30 million runs for pooled population, each 10 million runs for Hisayama or Kama population and for populations using either A. sinicus or V. angustifolia, and the first 25% runs were discarded as burn-in.
Results
Collection and sequencing of H. postica
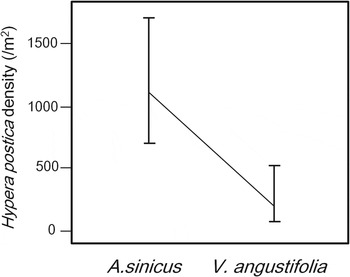
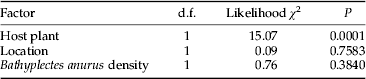
We obtained 60 mtDNA tRNALeu-COII (711 bp) sequences and 52 nuclear EF-1α (626 bp) sequences (sequences of 8 samples were unreadable). Density of H. postica was higher on A. sinicus than on V. angustifolia (overdispersion, P<0.0001, tables 1 and 2, fig. 2). The density of B. anurus was different between the two locations but not between A. sinicus and V. angustifolia and not correlated with H. postica density (overdispersion, P<0.0001, table 1, location, d.f.=1, likelihood χ 2=5.21, P=0.0225; host plant, d.f.=1, likelihood χ 2=0.091, P=0.763; host plant, d.f.=1, likelihood χ 2=1.11, P=0.293).
Effect of host plants on H. postica density tested with a generalized linear model with host plants, location and B. anurus density as independent variables. Error bars indicate 95% confidence intervals.

Generalized linear model analysis of H. postica density.

Infection by Wolbachia
Wolbachia was not detected in any H. postica individuals tested by PCR while we confirmed a PCR product for the positive control, C. chinensis (L.).
Statistical parsimony networks
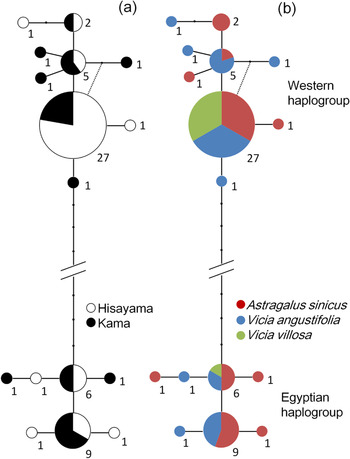
The parsimony network constructed from the 60 tRNALeu-COII sequences revealed the presence of two major groups (fig. 3), a larger group comprising Western haplotypes and a smaller group consisted of Egyptian ones. Among the haplotypes in the Western group were those matching a Western haplotype (New Mexico haplotype; Böttger et al., Reference Böttger, Bundy, Oesterle and Hanson2013) detected in 2001 in Japan (Kuwata et al., Reference Kuwata, Tokuda, Yamaguchi and Yukawa2005), a sequence from H. postica collected in Orléans, France by net-sweeping around Medicago (GenBank accession number JN163953.1, Haran et al., Reference Haran, Timmermans and Vogler2013) and a sequence from H. postica collected in southern Poland (DQ009617.1) (results not shown). Both haplotype groups were found, irrespective to the locations and host plants, with proportionally more Western haplotype groups (fig. 3a, b).
Statistical parsimony network based on mitochondrial DNA sequences, with (a) geographic areas and (b) host plants indicated. Dots are hypothetical haplotypes. Minimum distance between different haplotypes is 1 bp. Equally likely connections were indicated by dotted lines. The minimum genetic distance between Western haplotypes and Egyptian haplotypes was 40 bp. The size of the pie charts indicates the number of individuals (the exact number shown near the pie chart) possessing a particular haplotype.

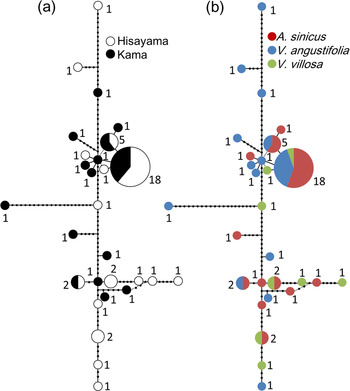
The EF-1α parsimony network included several rare types derived from the central major variants (fig. 4a, b). Haplotypes of individuals using V. angustifolia as a host plant were located both at the center and at branch terminals of the network. In contrast, haplotypes of individuals favoring A. sinicus were located mainly at the network center (fig. 4b).
Statistical parsimony network based on nuclear DNA sequences, with (a) geographic areas and (b) host plants indicated. See the legend of fig. 3 for the definition of dots and numbers.

Population genetic structure and diversity
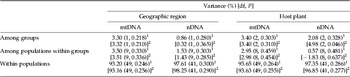
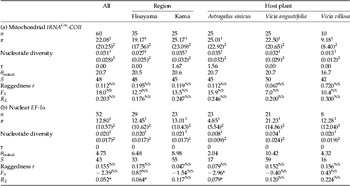
Nucleotide sequences of the mitochondrial and nuclear genes were different neither between the two geographic populations nor among the populations using three different host plants (table 3). We detected 20 tRNALeu-COII and 30 EF-1α haplotypes. Genetic diversity (π) based on tRNALeu-COII sequence data was higher than that for EF-1α (table 4a, b). Nucleotide diversity was 0.031±0.015 (0.028±0.014) (mean±SE) and 0.020±0.010 (0.017±0.009) for tRNALeu-COII and EF-1α, respectively, using Tamura and Nei's distance (and pairwise difference), indicating a higher diversity per site as well for the mitochondrial gene than the nuclear gene (table 4a, b). The high genetic and nucleotide diversity observed for tRNALeu-COII was due to the coexistence of two distant haplotype groups (table 4a). Genetic and nucleotide diversity of tRNALeu-COII was slightly higher for Kama than Hisayama population, while they were not different between populations using A. sinicus and V. angustifolia (table 4a). Genetic and nucleotide diversity of EF-1α was identical between populations from the two geographic areas; with respect to host plants, it was the highest for the populations feeding on V. angustifolia and the lowest for the populations feeding on A. sinicus (table 4b).
Genetic population structure according to geographic region and host plant based on AMOVA.

1 Tamura and Nei's distance.
2 Pairwise difference.
Assessment of sudden demographic growth in the recent past.

P, *<0.05, **<0.01, ***<0.001.
NS, not significant.
τ, the index of mutational time (τ=2ut, where t is the time in generations, and u is the mutation rate per site and per generation; Rogers and Harpending, Reference Rogers and Harpending1992).
1 Tamura and Nei's distance.
2 Pairwise difference.
Demographic growth
None of the demographic indices (F S and R 2) based on mtDNA significantly deviated from the hypothesis of no growth, thus revealing no strong evidence of sudden demographic growth for all populations (table 4a). In contrast, the F S and R 2 based on nuclear DNA suggested sudden population growth in the recent past for the populations using A. sinicus (table 4b). F S exhibits high statistical power for large sample sizes, while R 2 is more powerful for small sample sizes (Ramos-Onsins & Rozas, Reference Ramos-Onsins and Rozas2002). Since our sample sizes were relatively large, F S is more suitable for this study. Estimated time since population expansion, τ, was either 0 or very small, indicative of quite recent population growth (table 4).
Extended Bayesian skyline plot
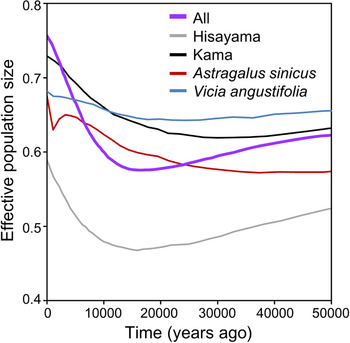
The effective population sizes gradually decreased, and then turned to increase about 16,700 years ago (fig. 5). The effective population size in Kama was larger compared with that in Hisayama (fig. 5). The effective size of populations using V. angustifolia stayed constant. In contrast, that of populations using A. sinicus rapidly increased after a temporal decrease about <1000 years ago (fig. 5).
Extended Bayesian skyline plots estimated based on mitochondrial and nuclear DNA nucleotide sequences, showing the historical changes of effective population size (median) of H. postica.

Discussion
No population genetic structure was found between geographic regions and among populations using different host plants (table 3). Hypera postica populations feeding on A. sinicus exhibited the lowest genetic diversity, whereas populations using V. angustifolia possessed the highest. This difference is possibly because of the fact that H. postica adopted A. sinicus in 1987, whereas V. angustifolia and Medicago species have been used as hosts since the first invasion in 1982 (Morimoto, Reference Morimoto1987). Differences in host patch dynamics are an other likely cause of this difference in genetic diversity; V. angustifolia and Medicago species are available early in the season and for longer periods, while late-sown A. sinicus is available in spring and deliberately limited in June for rice cultivation. A distinct host race was not formed, however, indicating some gene flow among populations using different host plants. This gene flow is probably due to annual colonization by H. postica adults from leguminous weeds such as V. angustifolia that are used for food for egg maturation and for flight muscle development (e.g., Sakurai et al., Reference Sakurai, Yamada, Iwatsuki and Inoue1997) after aestivation. Although not analyzed in our molecular study, weedy Medicago species possibly also serve as adult food. The higher density of H. postica in A. sinicus patch than in V. angustifolia patch may be ascribed by the larger cultivation area of A. sinicus, which likely attracts or becomes conspicuous for H. postica adults, or preference for A. sinicus (tables 1 and 2, fig. 2). Since genetic diversity of H. postica larvae was lower on A. sinicus, we suggest that fewer adults visit and oviposit on A. sinicus and that abundant A. sinicus allow higher survival of H. postica offspring.
Populations using A. sinicus were estimated to have increased after a sharp decrease within recent 1000 years (fig. 5). This may correspond to the bottleneck events such as the invasion of new lands (e.g., the United States and Japan) and the shift to new host plants (e.g., A. sinicus).
The estimated historical population changes showed that H. postica gradually decreased until 16,700 years ago followed by an increase (fig. 5). The decreasing phase corresponds to late last glacial period, indicating native H. postica population decreased as the glacier expanded and then increased as the glacier retreated because of warming. The lower effective population size and fewer nuclear polymorphic sites in Hisayama than that in Kama may indicate fewer H. postica founders invaded Hisayama (fig. 5, table 4b).
The lack of distinct geographic structure may not be explained in terms of natural flight between areas as the maximum of three-flight distance of H. postica is about 1.0–1.4 km for both female and male adults in March (Sakurai et al., Reference Sakurai, Yamada, Iwatsuki and Inoue1997) and our study areas were separated by about 20 km. Furthermore, otherwise continuous patches of host plants over these two areas are separated by the Sangun Mountains (60–500 m altitude, extending over 11 km) that may act as a dispersal barrier to H. postica. Therefore, the absence of spatial genetic population structure is not due to sole natural flight. The rate of spread for Western strain was about 16 km per year and may partly due to anthropogenic factors (Manglitz et al., Reference Manglitz, Klostermeyer and Keith1981). Materials that serve as aestivation sites (e.g., barks and corrugated cardboards, Yamaguchi et al., Reference Yamaguchi, Kamitani, Tadauchi and Yukawa2006) may have accidentally transported H. postica by vehicles. Astragalus sinicus is grown in rice fields before being ploughed under for rice cultivation. These fields are usually surrounded by various weeds such as V. angustifolia and Medicago species that prefer disturbed and open land. Vicia villosa fields are also surrounded by weeds including these legumes. These leguminous plant patches are consequently moderately connected to each other, which may enhance the annual colonization of temporally abundant hosts such as A. sinicus by H. postica.
Although Western strains of H. postica are well known to be infected with Wolbachia (Hsiao & Hsiao, Reference Hsiao and Hsiao1985), none of the individuals possessing Western haplotypes in our study were infected with this intracellular bacterium. This absence of infection in Japanese H. postica indicates either original invasion by uninfected individuals or loss of infection following invasion possibly because of high temperature (Clancy & Hoffmann, Reference Clancy and Hoffmann1998) or inter-strain crosses (Hsiao & Hsiao, Reference Hsiao and Hsiao1985). Our current knowledge is insufficient to determine which explanation is correct. Nevertheless, we suggest that the absence of Wolbachia has led to increased survival of inter-haplotypic crosses, compared with the infested Western strain populations in the United States and Western Europe (Iwase et al., unpublished).
To summarize, this study represents the first population genetic analysis of H. postica, taking into account its host plants. Populations using A. sinicus exhibited low genetic variance and recent sudden population growth compared with those using V. angustifolia. This difference probably reflects the fact that A. sinicus has had a shorter history as a host plant. The absence of Wolbachia even in Western-strain individuals may have enhanced reproductive compatibility of inter-strain crosses.
Acknowledgements
This study was done in part as a PhD study of SI and was supported by a Grant-in-Aid from JSPS (22570215, 23405008 and 25430194) and by Kyushu University Interdisciplinary Programs in Education and Projects in Research Development (25412) to MT.