

1. Introduction
The Bretton Woods agreement in July 1944 established an international monetary framework that would overcome the perceived problems of the interwar period, especially the perceptions that floating exchange rates and capital flows (hot money movements) were a key source of the instability of the 1930s and that international cooperation had failed. The implicit goals of the system were exchange rate stability and trade liberalisation. The former was to be achieved by countries operating a pegged but adjustable exchange rate and the latter through the acceptance of current account convertibility. Once the European members declared current account convertibility in December 1958, however, the system quickly evolved into a gold dollar standard with many of the flaws of the interwar gold exchange standard combined with some new ones: the inability of the adjustable peg to adjust because of fear of the speculative attack that would ensue if even the hint of devaluation were made; and the inability to seal off capital flows (Bordo Reference Bordo, Bordo and Eichengreen1993). These flaws opened up the prospects of currency crises in the face of inconsistency between domestic financial policies and/or changing competitiveness and the declared peg.
One of the currencies most vulnerable to speculative attacks was sterling and one of the key dramas of the demise of Bretton Woods was the series of sterling crises between 1964 and 1967. The 1964–67 period has long fascinated academics and with the release of new papers from the archives, important new questions can be raised about the management of sterling in this period.Footnote 1 This article focuses on the speculative attacks of the 1964 to 1967 period and the behaviour of reserves. Sterling acted as the second reserve currency of the international monetary system after the dollar and, because of this, was defended against speculative attacks by exchange market intervention,Footnote 2 especially forward market operations by the Bank of England (henceforth ‘the Bank’) and by the protection of the UK's foreign exchange reserves. Reserves were the key measure of the status of the defence of sterling, and understanding the management of the crises between 1964 and 1967 hinges on an analysis of reserves.
There are two analytical approaches to explaining the behaviour of international reserve intertemporally. The first, which we may label the theory of international reserves, is essentially partial equilibrium in nature and posits that observed reserves respond to discrepancies between desired and actual reserves held by a country, and in this literature much of the focus is on the adequacy of international reserves on a global basis (Clark Reference Clark1970; Grubel Reference Grubel1971). The second approach takes a macroeconomic perspective and draws on the classic monetary approach to the balance of payments (MABP), which in turn is largely a variant of the Humean price-specie-flow mechanism (Frenkel and Johnson Reference Frenkel and Johnson1974). In summary, in this view excessive movements in the supply of money relative to the demand for money will produce equal and offsetting reserve movements for a small open economy with a fixed exchange rate and facing perfect capital mobility. In the MABP therefore reserve changes are essentially a residual term and this would seem to contradict the theory of international reserves. However, the two approaches can be reconciled once it is recognised that if there is a stable demand for international reserves, domestic credit cannot be exogenous (Edwards Reference Edwards1984).
On the face of it a strict application of the MABP to the UK position in the 1960s would seem to imply that the large reserve losses sustained in the 1960s, due to the large balance of payments deficit, should have led to a currency devaluation much sooner than the actuality. However, for a country which is not small, which faces less than perfect capital mobility, and whose currency was regarded as a reserve currency (i.e. was held for reasons other than the settlement of transactions) – which seems to be a better description of the position of the UK in the 1960s than the baseline MABP model – the link between changes in the money supply and reserves would not necessarily be equal and opposite, thereby postponing the inevitable day of reckoning. Nonetheless, of course, the underlying MABP relationship still existed for the UK in the 1960s, as the very large UK balance of payments deficit in the period demonstrates, and so understanding why the inevitable devaluation of sterling did not occur until the late 1960s indicates that the institutional structure within which the monetary–reserve relationship is embedded is important in understanding the sterling crisis in the 1960s, and that is the key focus of this article.
This article is divided into five sections. Section 2 provides a chronology of the sterling crises from 1964 to 1967. Section 3 examines evidence from credibility tests to show that the sterling peg was often not credible and that the speculative attacks were justified. Section 4 presents new daily data on sterling reserves from the archives of the Bank which show that UK reserves were lower than official estimates at the time and in worse shape than policymakers admitted to the general public and their own creditors. Section 5 examines the relationship between reserves and the exchange rate (the expected rate of realignment) as well as the Bank's reaction function for reserves. Consistent with first-generation speculative attack models (adjusted for the presence of partial capital controls), we find that reserve movements driven by monetary and fiscal indiscipline are a key driver of the expected rate of realignment. We also show that the Bank was responsive to lagged exchange rate changes – a leaning-against-the-wind effect – and was also sensitive to movements of the exchange rate with respect to the exchange rate band. Finally, we offer some conclusions.
2. Chronology of sterling crises
At the outset of this article we need to be clear about what constitutes a currency crisis. According to Bordo and Schwartz (Reference Bordo and Schwartz1996, p. 438), a currency crisis is a ‘market-based attack on the exchange value of a currency. It involves a break with earlier market judgment about the exchange value of a currency. If a devaluation, which also involves a change in the peg, does not occur because of market pressure, it does not qualify as a currency crisis.’ A similar definition has been employed in the study by Bordo et al. (Reference Bordo, Eichengreen, Klingebiel and Martinez-Peri2001, p. 55), but they also add an international bailout to the list of qualifying criteria.
Based on these criteria, there were several sterling crises after 1945. Two of the most damaging to sterling's status as a reserve currency had been the ill-fated attempt at convertibility in July 1947 and the devaluation of September 1949, when the pound was devalued from $4.03 to $2.80 (Cairncross Reference Cairncross1985, pp. 121–64; Cairncross and Eichengreen Reference Cairncross and Eichengreen2003, pp. 111–55).Footnote 3 Although the proximate cause of these and subsequent crises was due to a combination of substantial deficits in the government's international transactions (which were responsible for the weakness in the current account balance) and the scale of overseas direct and portfolio investment (which put the overall balance of payments into deficit), they also reflected some fundamental weaknesses with the British economy, such as the lack of competitiveness (Hirsch Reference Hirsch1965; Middleton Reference Middleton, Arnon and Young2002).
Contemporaries pointed out that one of the impediments to faster growth in the 1950s was the attempt by the Conservative government to fine-tune the economy (referred to as ‘stop–go’) which ‘caused (or failed to restrain) faster growth than could be sustained, which then had later to be restrained’ (Dow Reference Dow1998, p. 263; Reference Dow1964). The pursuit of higher growth was undertaken with the sole objective of keeping unemployment (artificially) low using very crude macroeconomic tools. This created cyclical instability, which generated additional costs and uncertainty for businesses, adversely impacting upon the marginal efficiency of capital and the inducement to invest. These ‘stop–go’ economic policies were also inextricably linked to the deep-seated balance of payments problems of the British economy, namely that weak export growth could not support the full employment level of imports (Middleton Reference Middleton1996, pp. 42–3).
Although the UK held official reserves to counter a ‘run’ on the pound, these were inadequate by themselves to offset a major attack on sterling and on occasions (e.g. 1956 and 1961) it was necessary to seek short-term central bank assistance through the Bank for International Settlements (BIS) or the International Monetary Fund (IMF). The low level of reserves became a further concern for policymakers for two reasons. First, sterling was a reserve currency, and if it was forced off its parity then the US dollar would likely become more vulnerable to speculative attack. Secondly, foreign banks and monetary authorities overseas held sterling-denominated reserves, known as the ‘sterling balances’. At the end of 1945, the UK's gross sterling liabilities stood at £3,602 million and by the end of 1963 these had risen to £4,232 million. The worry for the Bank was that the value of the sterling balances exceeded its foreign exchange reserves and could have grave repercussions if these funds were repatriated to London and presented for exchange for US dollars or other convertible currencies (Schenk Reference Schenk1994).Footnote 4 This might not have been a cause for concern if the balance of payments deficits had not led to a persistent fear that the pound might be devalued. A devalued pound would mean that the Bank would be faced with demands for compensation for overseas sterling holders and it would most likely be co-opted to offering costly guarantees against future exchange risks.
By early 1964, the generally accepted view had been that the deficit on current account would continue to grow, the out-flow of long-term capital would be above the 1963 figure and the overall balance of payments would continue to deteriorate (Blackaby Reference Blackaby and Blackaby1978, pp. 24–5; NEDC 1964; National Institute Economic Review 1964, p. 9). Despite this, there was no widespread call for devaluation by economists and the Treasury and Bank were also opposed to a change in parity. They argued that devaluation would severely strain Britain's relations with other countries, particularly the Sterling Area, where the main holders of sterling would begin to withdraw their balances from London; threaten the stability of the international monetary system by throwing into question the practice of reserve currencies; and, finally, provoke retaliatory measures in Western Europe and a ‘scramble for gold’ as the future of the dollar would be put into question.Footnote 5
Upon taking office in October 1964, the Labour government announced its intention to end ‘stop–go’ economic management and shifted its strategy towards an emphasis on incomes policy and selective intervention to improve the industrial structure of the economy (Tomlinson Reference Tomlinson2004). The triumvirate of the prime minister, Chancellor of the Exchequer and the First Secretary of State quickly denounced devaluation as a solution to Britain's economic difficulties. However, this economic strategy – famously described by the prime minister's economic adviser, Thomas Balogh, as ‘the third way’ – was ill equipped to address the frequent short-term crises of confidence which gripped sterling in the foreign exchange markets.
The short-run prospects for the balance of payments were grim. Ten days after taking office, the government publicised that the balance of payments deficit for 1964 was going to be £800 million. This announcement was accompanied by some details about the government's long-term strategy for dealing with the balance of payments, but this did not go far enough to placate deteriorating market sentiment about sterling. Following a neutral budget in November, the foreign exchange markets began to lose confidence in the ability of the government to keep the parity at $2.80 and sterling came under heavy pressure from 11 November. There was an inordinate delay in raising Bank Rate and by the time it was increased from 5 per cent to 7 per cent on 23 November, it did not stem further heavy reserve losses over the following two days. If the governor of the Bank, Rowley Cromer, had not managed to secure $3 billion of credits from other central banks on 25 November, the Labour government would have been forced to devalue or float the pound (Cairncross Reference Cairncross1996, p. 105).
Following this first sterling crisis, the pound remained weak throughout December 1964 and into the first few months of 1965 as doubts persisted about whether $2.80 could be defended unless further deflation was forthcoming. Sterling was undersold heavily during March 1965 although the Budget on 6 April and some tough talking by the prime minister in New York a week later did modify some of the pressure for the rest of the month into May. In June, however, trade figures were released for May and showed a heavy deficit. This revived doubts about whether the UK had really addressed its basic economic problems.
A second sterling crisis began in July 1965, prompted by a remark from the chancellor on 15 July that no new measures were needed to strengthen the British economy, despite published reserves and trade figures which failed to show any real recovery (Cairncross and Eichengreen Reference Cairncross and Eichengreen2003, pp. 177–8). Sterling was sold heavily on the exchanges in the week ending 24 July and further measures were announced on 27 July to reduce public expenditure, tighten credit and to make exchange control more effective. The markets were not convinced that the crisis was under control, however, and two news items provoked heavy and widespread selling, renewing rumours about a possible devaluation. First, the reserve statement for the end of July was published on 3 August and although it was reported that £50 million had been lost, it was known that the UK had received a special receipt of £41 million from Germany, prompting suggestions that the true loss was over £100 million. Secondly, it was announced that President Johnson had met with the chairman of the Federal Reserve and had drawn pessimistic conclusions about sterling. This prompted a further run on the pound between the 3 and 6 August. Following the publication of July trade figures on 10 August – which showed record exports and a deficit of only £5 million – the market began to stabilise and sentiment began to improve. New international support for sterling totalling $925 million was arranged by several European countries, the US and Canada on 10 September 1965. Between September 1965 and March 1966, confidence returned and the spot rate strengthened.
Between March and May 1966, however, signs of weakness began to appear. First, there was some nervousness about the outcome of the General Election campaign, but this disappeared with the re-election of the Labour government. Secondly, the Budget at the beginning of May had introduced some new taxes but it failed to give sterling a significant boost and following indifferent trade figures and the outbreak of the seamen's strike, sterling was sold and confidence took a dip. The third sterling crisis occurred between June and August 1966, and it reached its peak in July when confidence in sterling collapsed and the government was forced to announce a wide-ranging package of measures. These included an increase in Bank Rate from 6 per cent to 7 per cent; tightening of hire purchase; travel restrictions; a six-month standstill of wages and prices; and cuts in public expenditure (Cairncross and Eichengreen Reference Cairncross and Eichengreen2003, p. 180). In September 1966 another package of aid for sterling was assembled totalling $400 million; the Federal Reserve Bank of New York increased its swap facility to $1.3 billion from $750 million, which had been granted at the time of the first sterling crises in November 1964.
From September 1966 to April 1967 there was again a period of recovery in sterling. Bank Rate was gradually reduced to 5½ per cent in early May and policymakers began to express hopes that the balance of payments would be in surplus by the end of 1967. It was not long before this second ‘false dawn’ came to an end. In May and June 1967 there was a sharp break in confidence as bad trade figures were published and tensions rose in the Middle East. Both events pushed the spot rate down and unease continued into July and August with the closure of the Suez Canal, rumours of Arab sales of sterling, the publication of further bad trade figures and rising unemployment. As sterling came under pressure, the press began to discuss the likelihood of devaluation, which was also stimulated because the government had made a formal application to enter the European Economic Community. Hire purchase restrictions were relaxed in August and social security payments increased in September, both of which were seen by the markets as a sign that the defence of sterling was not the government's chief priority and instead prompted more selling of sterling. A dock strike and further bad trade figures kept sentiment adverse, and the raising of Bank Rate in October did little to restore confidence.
In early November, rumours continued to circulate that the pound would be devalued and sterling came under heavy pressure. Despite a further raise in Bank Rate on 9 November, sentiment for sterling continued to ebb. Rumours that a potentially new massive support package for sterling was being assembled began to circulate during the week commencing 13 November, and as the authorities neither confirmed or denied this, the foreign exchange market was further destabilised. Although the chancellor still hoped that a bailout from the IMF and the US Treasury could be raised, the government agreed to devalue the pound on Thursday 16 November. No loan was forthcoming and following unprecedented sales of sterling on Friday 17 November, the prime minister announced that the pound would be devalued from $2.80 to $2.40 on Saturday 18 November 1967 (Cairncross and Eichengreen Reference Cairncross and Eichengreen2003, pp. 186–91).
Aside from September 1965 to May 1966 and September 1966 to May 1967, the weakness of sterling between 1964 and 1967 suggests sterling was suffering from a fundamental disequilibrium. However, this was not how contemporaries saw it. As Hutchison has argued, a myth grew up after devaluation that the majority of the economics profession was in favour of devaluation between 1964 and 1967, when there is no evidence to show that this was indeed the case (Hutchison Reference Hutchinson1977, pp. 131–6). To be sure, there were some who did argue that the pound should be devalued (particularly after the July 1966 crisis), but many ‘hesitated to state publicly the case for devaluation, recognizing that, the more convincingly the case for devaluation was stated, the more difficult it would be for the government to bring it about smoothly and without speculative urges’ (Cairncross and Eichengreen Reference Cairncross and Eichengreen2003, pp. 159–60).
With the number of speculative attacks and reserve losses over the period, how did the UK manage to hold sterling at $2.80? Quite simply, between 1964 and 1967 the UK received lines of credit from central banks and the IMF and enjoyed the use of a swap network with the Federal Reserve Bank of New York. What is often not appreciated, however, is the scale of the assistance given to sterling throughout the period. Much of this assistance, such as the overnight swap with the US and the Bank for International Settlements’ gold swap, was secret, so that the scale of the figures involved would not become public knowledge and undermine confidence in sterling. The UK was also provided with short-term central bank assistance and had medium-term facilities available under IMF drawing rights. To give some idea of the figures involved, it should be noted that in September 1964 the UK authorities had at their disposal $2,000 million. At the end of September 1965, this figure had risen to $3,310 million, rising to $4,370 million by September 1966 and falling slightly to $4,323 million in the weeks preceding devaluation.
3. Tests of sterling's credibility
The exchange rate arrangements for sterling in the 1960s – with its central parity and margins for flexibility above and below that parity, defined by the exchange rate bands – are described as a target zone in the international finance literature (MacDonald Reference Macdonald2007).Footnote 6 If a target zone is credible, in the sense that market operators believe that the central bank's commitment to defending the parity is credible, because the underlying macroeconomic policies are consistent with the peg, then this should show up in a number of simple tests. Perhaps the simplest test of credibility involves plotting the forward exchange rate against the upper and lower bands of the target zone (Svensson Reference Svensson1993). The idea here is that in a credible target zone the forward exchange rate will be the market's expected exchange rate and should be bounded by the upper and lower bands of the target zone:

where sl is the lower band of the target zone and su is the upper band. If the forward rate were to lie outside the band this would be prima facie evidence that the target zone was non-credible. We now consider the behaviour of the spot and forward rates for our data sample.
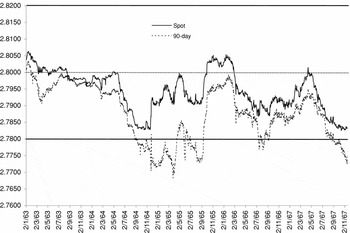
Figure 1 shows the spot and three-month forward rate from the 2 January 1963 to 17 November 1967. Data are daily exchange rates in London, collected from The Times. The horizontal, dashed line shows the central parity, while the upper and lower edges of the figure coincide with the Bretton Woods band. The spot rate weakened during the third week of August 1963, but had recovered by March 1964. Thereafter, it fell below its $2.80 parity, and came close to $2.78, the level below which, under the IMF rules, the Bank could not permit it to fall. The spot rate was then particularly weak for two periods: the first ten days after the Labour victory of 16 October 1964 and between the time of the budget and until the interest rate rise on 23 November 1964. However, aside from the first ‘false-dawn’ (November 1965 to March 1966) and the second ‘false-dawn’ (September 1966 to July 1967), sterling remained close to the bottom of the band.
Spot and 90-day exchange rate, 1963–17 November 1967

The three-month forward rate peaked on 28 October 1964 and then fell until the crisis of 25 November 1964, where it spiked above $2.78 briefly as details of the $3 billion loan were announced. However, credibility at this maturity was very short lived and did not return until just before the 1965 crisis. There had been a very significant change made to forward market policy at the time of the first sterling crisis in 1964. Prior to 24 November 1964, it had been common ground for the Treasury and the Bank to avoid continuous intervention in the forward market at a relatively narrow margin, largely because it reduced the insurance premium which had to be paid by those who sought to cover themselves (in other words, it made the cost of speculation cheap) (Oppenheimer Reference Oppenheimer1966). From this point, operations in the forward market had the objectives of protecting the spot reserves by making forward cover cheaply available and to retain in London the large amount of arbitrage funds which had built up to the end of 1964. The intervention, which began modestly at first, strengthened; between November 1964 and November 1967, there were only two periods when forward cover was reduced by the Bank: from September 1965 to February 1966 and October 1966 to April 1967. Aside from these two periods, the forward rate was under pressure, particularly so during the choppy waters of July and August 1966 and in November 1967. The Treasury, who were not privy to the exact magnitude of the large forward positions built up by the Bank, estimated that the average size of the Exchange Equalisation Account's oversold position was between $1.8 billion and $2 billion from November 1964 until August 1966; in fact the true position by this later date was $3 billion and by the time of the devaluation it stood at $4.6 billion.Footnote 7
Overall, then, the behaviour of the 90-day forward rate suggests that for much of the period sterling was credible, although there are important exceptions such as the period September 1964 to the end of 1965, the summer of 1966 and the immediate run up to the 1967 devaluation. Plotting the forward rate against the exchange rate bands, as we have considered in the above, is informative but it does not give an indication of the significance of the violations of credibility. To address this we construct the so-called 95 per cent credibility confidence intervals, which focus on whether the expected rate of realignment is significantly different from zero (which contrasts with the simplest test which focuses on the total expected exchange rate and are not tests of the significance of non-zero values of the expected rate of realignment). Svensson (Reference Svensson1993) has argued that the 95 per cent confidence interval test is a much tighter test of credibility than simply plotting the forward exchange rate against the target zone bands, and their derivation may be explained in the following way.Footnote 8 By decomposing the actual spot rate into the central parity (ct) and the deviation of the exchange rate from the central parity (xt), the so called 95 per cent confidence interval can be expressed asFootnote 9:

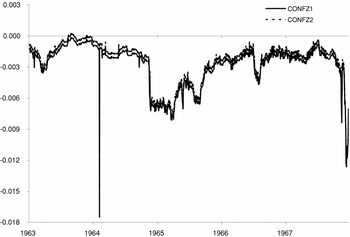
where the +5 and −5 superscripts on the x term represent the +/− 5 per cent values around the fitted value of x. The 95 per cent confidence intervals are constructed on the basis that xt is the single determinant of the expected change in the current deviation of exchange rates from the centre and this is consistent with the majority of studies which estimate (5) (Rose and Svensson Reference Rose and Svensson1995; Caramazza Reference Caramazza1993; Hallwood, MacDonald and Marsh Reference Hallwood, Macdonald and Marsh2000). The estimated 95 per cent confidence interval is presented in Figure 2 and the message from this figure is stark: absent a few observations in 1963, after 1964 sterling was essentially a non-credible currency.
95% confidence interval, 1963–7

The figure predicts well the November 1964 crisis, with the expected rate of realignment dropping sharply mid 1964 and credibility recovering soon after the crises, although it dipped again in early 1965. The stabilising effect of short-term central bank assistance in September 1965 seems to be clear in Figure 2, with the expected rate of realignment rising to a value which was almost insignificantly different from zero toward the end of 1965. However, early in 1966 credibility took a further dip, which would seem to be an anticipation of the pressure sterling was under in the summer of 1966. The recovery of sterling in the winter of 1966 and the early spring of 1967 is confirmed in these figures by the rise in the expected rate of realignment towards zero. However, this was short lived with credibility starting to take a hit as early as late August 1967 and then recovering somewhat in late September, but then from late October credibility fell sharply.
4. Reserves
It was recognised in the mid 1960s that Britain had the lowest level of reserves of all the Western European countries, which was made worse because it required a considerable margin for key currency status and to provide for the outstanding liabilities of the Sterling Area (Heller Reference Heller1966, pp. 305–7). As Harold James (Reference James1996, p. 186) has noted, ‘the instability caused by the sterling balance overhang and the danger of liquidation . . . lay behind each of the major British crises of the second half of the 1960s’.
From our earlier discussion it was suggested that the underlying story in this period is one of macroeconomic weakness of the UK economy coupled with an unwillingness to adjust the exchange rate, which led to a growing inconsistency between the peg and the economic fundamentals. If this is the case, it might make an analysis of foreign exchange intervention of limited interest other than as a measure for the pressure on the exchange rate. However, the prevailing view of the authorities at the time was that they could finance the external deficit in the short run by use of the reserves and bolster the reserves where necessary with international rescues. An analysis of the extent of changes in the reserve position is thus highly relevant to understand how the government managed to avoid devaluation.
The extent of reserve losses over this period has never before been revealed as the figures published by the Bank were subjected to extensive ‘window dressing’, with swaps and Treasury bonds sales typically not reported or seen as part of the reserves. This allowed a false picture of the reserves to be presented and allowed the asset side of the reserve position to be presented and any sterling liability to be hidden. Regarded as a standby which could be activated on demand, the transaction would not affect the exchange rate directly, at least not until one or other central bank sold its holdings of the other central bank's money.
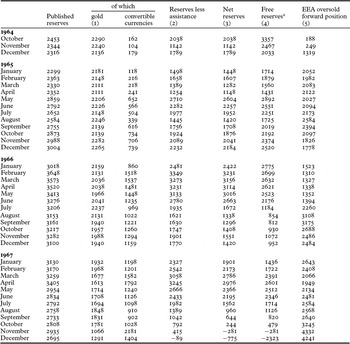
Table 1 shows an exact tabulation of gold and convertible currency reserves, levels at end-months, between June 1964 and December 1967.
UK currency reserves, October 1964 – December 1967 ($ millions, current prices)

Notes: Col. 1 official reserves (gold and convertible currencies plus special drawing rights); col. 2 less short-term central bank assistance and comprises all operations (including repayments) with overseas central banks and the BIS (excluding BIS currency deposits), initiated by the UK for the purpose of increasing the UK's reserves of gold and foreign currencies; col. 3 excluding guaranteed sterling, special BIS and market swaps and deposits and Israeli deposits and Swiss loan; col. 4 excludes IMF drawing but includes the dollar portfolio; col. 5 excludes the forward aspect of assistance operations, since these liabilities are shown as deductions from the spot reserve.
Sources: Col. 1, statistical annex to Bank of England Quarterly Bulletin, various years; cols. 2–5, ‘Gold and convertible currency reserves’, BE 4A98/1.
The true position of the reserves can be seen in column 4 (the extent of the Bank's ‘window dressing’ can be seen in column 3), which highlights the scale of the assistance given to sterling over the period. Although the figure for net reserves at the end of March 1966 was over one billion pounds, this was due to a liquefied portion of the dollar portfolio being brought into the reserves at the beginning of February. Column 5 illustrates the enormous scale of forward sales over the period. The magnitudes of these net forward sales of sterling have been hinted at by Cairncross and Eichengreen (Reference Cairncross and Eichengreen2003, pp. 185–6), but the exact figures were a closely guarded secret by the Bank and are revealed here for the first time.
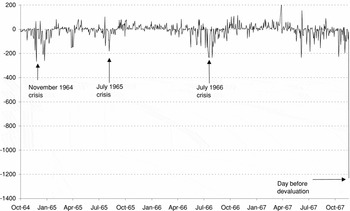
We have used the dealers’ reports from the Bank to reconstruct changes in the reserves on a daily basis between 1964 and 1967 (Figure 3).Footnote 10 Positive entries represent increases in reserves, while negative entries represent losses of reserves. Each of the currency crises discussed in Section 1 is marked on the figure.
Daily changes in total reserves, 1 October 1964 – 17 November 1967

Hamilton (Reference Hamilton2008, p. 79) has suggested that the strength of the reserves on the eve of the 1967 devaluation meant that sterling ‘could have weathered the storm’ and that the day before devaluation ‘the till was still far from empty’. Although this is an intriguing suggestion, the evidence does not support it. Hamilton quotes from a Treasury document which estimates that the published figure for the reserves at the end of October would be $2,780 million. The addition of the dollar portfolio, central bank facilities and the IMF drawing rights brings the amount of assets available to $5.1 billion. However, when Britain's short and medium-term liabilities are factored in, this figure falls to $2.5 billion. On 16 November 1967, the Treasury assumed that a little over $1 billion of resources would still be available at the end of November, and coupled to the IMF drawing rights, the UK had at its disposal a total of $2.2 billion with which to defend sterling.Footnote 11 Due to window dressing, published reserve figures are misleading, however, and column 3 of Table 1 shows that at the end of October net reserves stood at $244 million, which, at that point, was probably the lowest end-of-month figure ever. The dealers’ report shows that by 16 November, a further $728 million had been spent trying to defend the parity, so in reality the situation was much worse. Without a further massive rescue (which had been ruled out by the IMF and US officials over the weekend of 10/11 November 1967), the $2.80 parity was simply untenable.
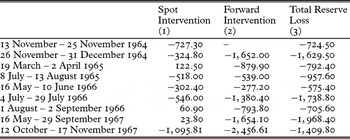
The scale of the total reserve losses during the crises between 1964 and 1967 can be compared to earlier postwar crises. Between 1 April 1949 and the devaluation of 18 September 1949, the reserves fell by $564 million (Cairncross and Eichengreen Reference Cairncross and Eichengreen2003, p. 147). During the sterling crises of September 1951 to January 1952, the reserves fell by almost $900 million (Dow Reference Dow1964, p. 73). Klug and Smith (Reference Klug and Smith1999, p. 193) report that in the 1955 crisis (July to December), $248 million was lost, and in the Suez Crisis (July 26 to 7 December 1956), $655 million was lost. During the Suez Crisis, $400 million was lost in one month alone (November 1956), which was the highest single monthly figure postwar, since a loss of $256 million in October 1951 (Boughton Reference Boughton2001, pp. 434–5). The losses during the period between 1964 and 1967 were on a scale far larger than anything prior to this date, as can been seen from Table 2.
Market intervention to support sterling, various dates, 1964–7 ($ millions)

Notes: Col. 3 is not the total of cols. 1 and 2 because gold operations, short-term assistance, repayments and claims are not shown in the table.
Source: Dealers’ reports on the foreign exchange and gold market, BE C8.
Table 2 shows how market intervention was the overwhelming cause of the reserve loss, particularly in the form of support to forward sterling. As discussed earlier, this policy was unprecedented. In November 1956, only $13 million were spent on supporting forward sterling and only $30 million were spent in the year as a whole; the totals for 1964, 1965, 1966 and 1967 were $1.6 billion, $1.7 billion, $3.7 billion and $4.8 billion, respectively. The steady loss of reserves illustrated in Table 2 and Figure 3 at the time of each currency crisis, followed by acceleration in reserve losses and intervention, is typical of the other currency crises described by economists and economic historians (Bordo and Schwartz Reference Bordo and Schwartz1996; Eichengreen, Rose and Wyplosz Reference Eichengreen, Rose, Wyplosz, Canzoneri, Ethier and Grilli1996; Bordo et al. Reference Bordo, Eichengreen, Klingebiel and Martinez-Peri2001).
5. Expected rate of realignment, reserve changes and reaction functions
In this section we examine the interactions between reserve changes and two measures of exchange rates – the change in the spot rate, in terms of a standard reaction function, and the relationship between the expected rate of realignment and the change in reserves. The former relationship gives an indication of the interaction between two measures of financial crisis and, specifically, quantifies how reserves react to exchange rate changes. The latter relationship should shed light on how important reserve changes were during the period in driving the lack of credibility which, as we demonstrated in Section 3, was the norm in the 1960s.
5.1. Reserve changes and the expected rate of realignment
In this section we examine the extent to which the evident non-zero expected rate of realignment was related to reserve changes over the period. First-generation speculative attack models emphasise the importance of poorly managed monetary and fiscal policy for the evolution of a currency crisis and the ultimate attack on a currency (Krugman Reference Krugman1979; Obstfeld Reference Obstfeld1984). Monetary/fiscal indiscipline should show up in reserves and they should be a key driver of the expected rate of realignment. Of course, there may be an important degree of endogeneity in such a relationship in the sense that if interventions are successful in transitorily raising credibility there will be fewer reserve losses, thereby resulting in an inconsistent coefficient estimate on the measure of reserves.Footnote 12 In our econometric estimates we account for such potential endogeneity using an instrumental variables estimator in which the instruments are a constant, and two lagged values of both the dependent and independent variables. Additionally, since the model of Krugman is one in which capital controls are absent, we do not expect the reserves/credibility relationship to conform exactly to that predicted in the standard first-generation speculative attack model. For example, it is well known that the UK in the 1960s had partial capital controls in place and the existence of such controls allowed the UK authorities to borrow to prolong the period before sterling had to be devalued. In the base-line speculative attack model, with no capital controls, the loss of reserves is a characteristic of an attack and when this occurs borrowing new reserves cannot prolong the life of the peg.Footnote 13 Nonetheless, and as Wyplosz (Reference Wyplosz1986) demonstrates in a variant of the first-generation model with capital controls, the relationship between reserves and credibility should still exist in a modified form for our period.
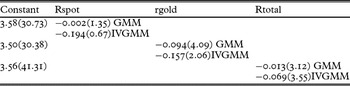
We use three measures of reserve changes – for spot (rspot), gold (rgold) and total reserve changes (rtotal) and provide two sets of coefficient estimates – GMM is an OLS estimate in which the standard error has been corrected for heteroskedasticity and serial correlation using a standard Newey-West damp factor, and GMMIV is an Instrumental variables estimate in which the standard error has also been corrected for heteroskedasticity and serial correlation using a standard Newey-West damp factor. The results are reported in Table 3 and with the GMM results we see that for all three measures of reserves that there is a negative relationship (note that to make the interpretation clear we are using the sterling–dollar rate) between the expected rate of realignment and reserves, although this is statistically significant only in the cases of gold and total reserves: in terms of gold reserves, a 1 per cent worsening of UK reserves produces a 0.1 per cent increase in the expected rate of realignment of sterling (sterling–dollar). Using the IVGMM estimator we note a much stronger relationship between the reserve measures and credibility, although again the coefficient on spot reserves is insignificant. The correction for endogeneity, therefore, produces a much sharper relationship between reserves and credibility, with the coefficient rising by a factor of 10 in absolute terms. These results seem intuitive enough and provide confirmation of the main message of first-generation speculative attack models: namely, that poorly disciplined macroeconomic policy, particularly monetary policy, will have serious implications for reserves and the credibility of the peg (note that since the UK had capital controls in the 1960s our results cannot be seen as confirmation of a specific first-generation speculative attack model, such as Krugman). Further light may be shed on this by looking at the evolution of the coefficient on reserves over time – is it relatively constant or does it change as a crisis approaches?
Regressions of the expected rate of realignment on the change in reserves

Notes: T-ratios reported in parenthesis (the underlying standard errors are robust to heteroscedasticity and autocorrelation and a Newey–West damp factor has been used).
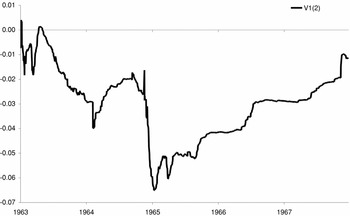
In Figure 4 we report recursive estimates of the coefficient generated from the regression of the expected rate of realignment on total reserves. The picture indicates that the weight placed on reserves declines from the early 1960s down to mid 1964 and then rises steadily until it peaks at the time of the devaluation in 1967. It would seem that the importance of reserves loomed larger and larger as devaluation approached.
Recursive estimates of the coefficient on total reserves

5.2. Reaction functions
Reserve and exchange rate movements (both spot and forward rates) are often taken as measures of financial crises and in this sub-section we attempt to link these two measures by estimating reaction functions for sterling. A standard reaction function linking reserve changes to the exchange rate is given as:

where the lagged reserve term is included to allow for serial correlation in the change in reserve process, the second term on the right-hand side captures the deviation of the actual exchange rate from some target or equilibrium level (as captured by s overbar) and the last term is a standard leaning against the wind term. To be consistent with the extant reaction function literature, we define the exchange rate as the home currency price of a unit of foreign currency (sterling–dollar) and take as the target exchange rate the reciprocal of the dollar sterling lower point (2.77), which is 0.360: a depreciation of the exchange rate above this point should trigger a reserve change to defend the currency.
The results from estimating variants of this reaction function are reported in Table 4. In the first regression we exclude the ‘leaning-against-the-wind’ term and find a significantly negative coefficient on the deviation of the exchange rate from the edge of the band: a 1 per cent depreciation of the rate above the band produces a 21 per cent change in reserves. In the second specification we drop the deviation term and include the ‘leaning-against-the-wind’ term. This also produces a significantly negative coefficient, although the magnitude is not as large as for the deviation term. Finally, the last equation includes both exchange rate effects and both appear statistically significant: the coefficient on the deviation term is similar to the first regression, whilst the coefficient on the leaning-against-the-wind term is about double that on the same term in equation 2.
Total reserve reaction functions

Notes: T-ratios reported in parenthesis (the underlying standard errors are robust to heteroscedastcity and autocorrelation and a Newey-West damp factor has been used).
Clearly, then, it would appear that the Bank during the 1960s was reacting to both exchange rate pressure within the target zone bands – intra-marginal intervention – and also intervening at the lower band itself (marginal intervention), and that this intervention had a relatively large effect on the reserve position.
6. Conclusion
This article has contributed to the literature on sterling by drawing on new archival sources of information and fresh data on reserves and exchange market intervention. Our research shows that the sterling peg became increasingly incredible in the 1964 to 1967 period as it flirted with, and fell below, the lower credibility bands we estimated. Moreover, we show that the pound was propped up by international rescue loans from the G11 and the IMF. The peg collapsed when the rescues ceased. Thus the new reserves data reveal that the UK's international reserves were inadequate at the same time as the credibility of the peg was low. Indeed, without the international rescues, sterling would have been forced to devalue earlier. The addition to its reserves gave the British authorities the breathing room to manage the inevitable exit from the sterling peg of $2.80. At the time, the monetary authorities found it hard to admit to themselves that sterling was doomed.
The sterling crises represented key examples of a flaw of the Bretton Woods adjustment mechanism under which overvalued countries reluctant to deflate were forced to adjust by devaluation. The crises were good examples of first-generation speculative attack models driven by a growing inconsistency between the peg and the domestic fundamentals. The crises also showed the operation of the famous trilemma, which posits that pegged rates, open-capital accounts and independent financial policies cannot coexist. Under Bretton Woods rules the trilemma was supposed to work because of capital controls. Like the crisis of the 1940s and 1950s, the crises of the 1960s showed that capital controls were porous.
Finally, although the crises of 1964 to 1967 were some of the most important milestones in the saga of the rise and fall of the Bretton Woods system, devaluation also represented a climacteric for sterling. The change in parity signalled the end of sterling as a major reserve currency, bringing to a close a story going back to the mid nineteenth century. The devaluation also represented a breach of the first line of defence of the dollar as the linchpin of the gold dollar standard that Bretton Woods had evolved into by the end of the 1960s. Moreover, worse was to follow after the 1967 devaluation as the gold crisis in March 1968, the rumours about an expected devaluation of the franc and possible revaluation of the Deutschmark in the autumn of 1968 all impacted on sterling, with the result that there were further substantial reserve losses.
Acknowledgments
The authors would like to acknowledge the excellent research assistance of Melanie Rohat-Meheust and Claire Grimes. We wish to thank Charles Goodhart, John Hills and Bill Allen (all ex-Bank of England) for sharing their expertise on the operation of the foreign exchange market in the 1960s. We are also grateful for the comments and of participants and referees at the third Past, Present and Policy conference, held at Genoa in March 2008. Finally, the authors are indebted to the late Adam Klug for his contribution to this article, and would like to dedicate the article to his memory.