INTRODUCTION
Static passive acoustic monitoring has become increasingly useful in studies of odontocete habitat use and behaviour, in particular when conditions are unsuitable for land-based observations or boat-based research (e.g. Philpott et al., Reference Philpott, Englund, Ingram and Rogan2007; Rayment et al., Reference Rayment, Dawson and Slooten2009a; Simon et al., Reference Simon, Nuuttila, Reyes-Zamudio, Ugarte, Verfub and Evans2010). Passive acoustic monitoring, in general, offers several advantages over visual surveys, including detection of submerged animals, 24 hour monitoring, lower expense and reduced dependence on calm weather (Leaper et al., Reference Leaper, Chappell and Gordon1992; McDonald & Fox, Reference McDonald and Fox1999; Carstensen et al., Reference Carstensen, Henriksen and Teilman2006). Because the method is passive (i.e. no sound is produced), it minimizes disturbance to the subject animals, and because standardized equipment is used, observer bias is reduced (McDonald & Fox, Reference McDonald and Fox1999; Wang et al., Reference Wang, Wang, Akamatsu, Li and Xiao2005; Rayment et al., Reference Rayment, Dawson and Slooten2009b). The T-POD (www.chelonia.co.uk) is one acoustic monitoring device designed to detect and log echolocation activity of small cetaceans.
The T-POD has been succeeded by the C-POD, which offers a number of important improvements (www.chelonia.com). Nevertheless, over 800 T-PODs were made (Tregenza, personal communication). Many remain in use and they continue to be highly effective for investigating cetacean habitat use, distribution and behaviour (e.g. Cox et al., Reference Cox, Read, Solow and Tregenza2001; Jefferson et al., Reference Jefferson, Hung, Law, Torey and Tregenza2002; Koschinski et al., Reference Koschinski, Culik, Trippel and Ginzkey2006; Leeney et al., Reference Leeney, Berrow, McGrath, O'Brien, Cosgrove and Godley2007; Philpott et al., Reference Philpott, Englund, Ingram and Rogan2007; Rayment et al., Reference Rayment, Dawson and Slooten2009a; Bailey et al., Reference Bailey, Clay, Coates, Lusseau, Senior and Thompson2010; Simon et al., Reference Simon, Nuuttila, Reyes-Zamudio, Ugarte, Verfub and Evans2010). The issues that we address here; the dangers of working with inadequate descriptions of the target animal's vocalizations, and of quantifying the detection range, are not specific to T-PODs—they apply generally to acoustic detection systems, and are important to optimize the quality and usefulness of the data collected.
To maximize the utility of T-PODs it is necessary to match the filter settings to the click characteristics of the target species. T-PODs use two filters to focus on a particular point within the frequency range of the target species (Philpott et al., Reference Philpott, Englund, Ingram and Rogan2007). Essentially, the ‘A’ filter should be set at the peak of the click spectrum, while the ‘B’ frequency should be set at a point where spectral energy is low. Because detection rates are dependent, in part, on the filter settings, it is important to match settings to the population under study. Despite T-PODs being used in several studies of bottlenose dolphins, surprisingly little research has focused on finding the optimal filter settings. Previous studies have used 50/90 kHz or 50/70 kHz A/B filter settings (Philpott et al., Reference Philpott, Englund, Ingram and Rogan2007; Bailey et al., Reference Bailey, Clay, Coates, Lusseau, Senior and Thompson2010; Simon et al., Reference Simon, Nuuttila, Reyes-Zamudio, Ugarte, Verfub and Evans2010, respectively). However, bottlenose dolphins (and beluga; Au et al., Reference Au, Carder, Penner and Scronce1985) can modify their broadband sonar signals according to the noise environment of different habitats (Au et al., Reference Au, Floyd, Penner and Murchison1974), suggesting that the optimal T-POD settings might vary among populations. In turn this suggests that in situ wideband recording of the echolocation signals used by the target population would be helpful in choosing appropriate T-POD settings.
If any acoustic detector or recorder is to be used as a means of monitoring habitat utilization, it is important to estimate the range over which the target species is reliably detected. For T-PODs, detection range has mainly been assessed for the harbour porpoise (Phocoena phocoena Linneaus), with studies covering a range of habitats (Cox et al., Reference Cox, Read, Solow and Tregenza2001; Culik et al., Reference Culik, Koschinski, Tregenza and Ellis2001; Teilmann et al., Reference Teilmann, Henriksen, Carstensen and Skoy2002; Koschinski et al., Reference Koschinski, Culik, Damsgaard Henriksen, Tregenza, Ellis, Jansen and Kathe2003, Reference Koschinski, Culik, Trippel and Ginzkey2006; Carlström, Reference Carlström2005; Carstensen et al., Reference Carstensen, Henriksen and Teilman2006; Philpott et al., Reference Philpott, Englund, Ingram and Rogan2007). Finless porpoise (Neophocaena phocaenoides Cuvier), bottlenose dolphin and Hector's dolphin (Cephalorhynchus hectori Van Beneden) have been investigated to a lesser extent (Jefferson et al., Reference Jefferson, Hung, Law, Torey and Tregenza2002; Philpott et al., Reference Philpott, Englund, Ingram and Rogan2007; Rayment et al., Reference Rayment, Dawson and Slooten2009b; Bailey et al., Reference Bailey, Clay, Coates, Lusseau, Senior and Thompson2010). Range of detection is usually assessed via theodolite observations of the target species in the vicinity of one or more moored detectors or recorders, and modelled as a ‘detection function’ which expresses likelihood of detection versus distance (Tougaard et al., Reference Tougaard, Rosager Poulsen, Amundin, Larsen, Rye, Teilmann, Leeney and Tregenza2006; Rayment et al., Reference Rayment, Dawson and Slooten2009b). The variability in range of detection over different habitats, for different populations, offers insight into the robustness of static acoustic monitoring. To our knowledge Bailey et al. (Reference Bailey, Clay, Coates, Lusseau, Senior and Thompson2010) provide the only published acoustic detection function for bottlenose dolphins and T-PODs (or C-PODs).
Since bottlenose dolphins occupy a wider range of habitats than any other odontocete (Leatherwood & Reeves, Reference Leatherwood and Reeves1983), it is reasonable to expect that detection range will also vary across habitats due to their differing acoustic characteristics. For this reason, estimates from shallow bays (<50 m deep) in Ireland and Scotland (Philpott et al., Reference Philpott, Englund, Ingram and Rogan2007; Bailey et al., Reference Bailey, Clay, Coates, Lusseau, Senior and Thompson2010), may not be applicable to bottlenose dolphins in the much deeper waters of Doubtful Sound, Fiordland, New Zealand (average depth ~200 m).
MATERIALS AND METHODS
Two separate sets of experiments were conducted, the first to determine the optimum settings for T-POD studies of the bottlenose dolphins in Doubtful Sound, the second to estimate the range and probability of detection at those settings.
Optimizing T-POD frequency settings
A wide-band recording system capable of recording frequencies up to 176 kHz was used to measure the spectral characteristics of echolocation signals used by Doubtful Sound bottlenose dolphins, in order to decide on suitable T-POD settings (referred to as ‘in situ settings’ from here on). Sounds were received by a Sonatech 8178 hydrophone, amplified, and digitized (fs = 352 kHz, 12 bit) using a laptop PC equipped with a National Instruments 6062E A/D card. Because we intended to quantify the average frequency content of bottlenose dolphin clicks that would be received by the T-PODs, rather than describe the fine details or source levels of the clicks themselves (e.g. Villadsgaard et al., Reference Villadsgaard, Wahlberg and Tougaard2006), a single hydrophone, rather than an array, was adequate. Recordings were made over four days in June 2008.
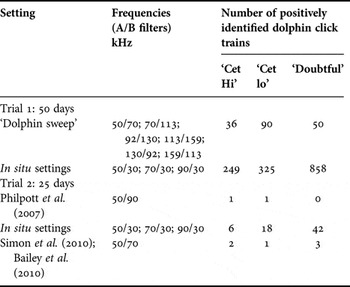
The effectiveness of A/B filter settings based on in situ recordings (see Table 1), and those used in the literature in studies of bottlenose dolphins, were compared via two field trials in Doubtful Sound. Trial one (1 April 2009–20 May 2009; 50 days) compared in situ settings against ‘dolphin sweep’ settings from the T-POD programme (TPOD.exe, available from www.chelonia.co.uk); trial two (20 May 2009–13 June 2009; 25 days) compared in situ settings against settings used by Philpott et al. (Reference Philpott, Englund, Ingram and Rogan2007), Bailey et al. (Reference Bailey, Clay, Coates, Lusseau, Senior and Thompson2010) and Simon et al. (Reference Simon, Nuuttila, Reyes-Zamudio, Ugarte, Verfub and Evans2010).
Comparisons of the number of positively identified bottlenose dolphin trains collected from multiple T-PODs moored together at Pack Point, Doubtful Sound, over two separate trial periods using different filter settings.

In each trial, multiple, factory calibrated, version 5 T-PODs were moored together at 5 m depth at Pack Point, Doubtful Sound (45°23′442″S 167°06′047″E); a known area of high dolphin activity. In each case, individual T-PODs had all six scans set to one of the A/B settings being tested (Table 1). Only the A/B filter settings varied among T-PODs; all other settings were identical for each trial (click bandwidth = 5, noise adaptation = ++ , sensitivity = 12 and click limit = 240).
Upon retrieval, T-PODs were downloaded and click trains identified using T-POD software (v. 8.19). T-POD software classifies click trains according to likelihood of being of cetacean origin. The categories are ‘Cet Hi’ (i.e. high probability), ‘Cet Lo’ (i.e. lower probability), ‘?’ (i.e. doubtful), ‘??’ (i.e. very doubtful) and ‘fixed’ (i.e. fixed rate; usually a boat's echosounder). Trains classed into ‘Cet Hi’, ‘Cet Lo’ and ‘doubtful’ categories were retained, and subjected to a further set of detection criteria because T-POD software occasionally logs false positives in all categories. These criteria were:
(1) at least 10 clicks in a train;
(2) click duration between 20 and 500 microseconds. Most clicks from bottlenose dolphins are 50–150 microseconds long (Au, Reference Au1993). Durations longer than a few tens of ms appear to arise via multipath;
(3) pulse repetition frequency between 10 and 500 clicks/second, with a smooth trend in click rate;
(4) no accompanying noise when PRF (pulse repetition frequency) and ‘all + sync’ is selected in T-POD software. ‘All +sync’ displays the clicks that have been classified as a train, and any other co-occurring clicks that were not categorized in that train. This rule is required because the T-POD software will sometimes ‘find’ a train of clicks within random noise. If PRF and ‘all + sync’ are selected, noise will appear as dots scattered on the screen. If it is a reliable detection, the contour of the PRF will vary smoothly.
Since T-PODs were moored together on the same mooring, we assumed that a larger number of positively identified click trains reflected a more effective setting (dos Santos & Almada, Reference dos Santos, Almada and Thomas2004). Acoustic detections of species other than bottlenose dolphin are unlikely in Doubtful Sound, as no other cetaceans are resident in the area and sightings of others are very rare (Lusseau & Slooten, Reference Lusseau and Slooten2002; personal observation).
Detection range
The steep walls of the fiord made a land-based theodolite methodology (e.g. Rayment et al., Reference Rayment, Dawson and Slooten2009b) impossible in Doubtful Sound. Instead, T-PODs were deployed beneath a floating buoy placed in the expected path of a group of dolphins. This is practical in Doubtful Sound because the dolphins often travel in tight groups, moving through the fiord on predictable, direct routes.
Dolphins were located via systematic searching of the fiord, and approached to determine direction of movement and group size. Only tight groups, in which all dolphins were within 50 m of each other, were used. The boat was moved 1.5 nautical miles (2.8 km) ahead of the group, in the dolphins' expected path. A large floating buoy with two version 5 T-PODs suspended at 5 m beneath it, was set adrift. Two T-PODs were used to avoid loss of data in case of malfunction. A portable GPS taped to the buoy's upper surface logged its position, and hence the position of the T-PODs, every ten seconds. T-PODs were deployed with the settings found to be most effective in settings experiment above (Table 1).
The boat then returned to the dolphin group and maintained a position abreast of the leading dolphin(s) 100 m off to the side. Distance and bearing to the leading dolphins were measured every 30 seconds using a laser-rangefinder and hand-bearing compass. The position of the leading dolphins was calculated via trigonometry using the position of the boat (measured via on-board GPS) and the measured ranges and bearings. Comparison with the buoy's GPS track enabled calculation of the distance between the leading dolphins and the T-PODs. Any influence of the directionality of the dolphins' sonar (see Au, Reference Au1993) was reduced by using only those dolphin tracks which remained within a 400 m strip centred either side of the T-POD they were approaching. In some range trials, distances did not always reach zero, for example when the dolphin group veered away from the drifting buoy.
To investigate the effect of distance to the T-POD, we calculated the probability of detecting a dolphin group and click train detection rate in 100 m distance bins. Detection probability is a measure of how likely the T-POD is to detect a dolphin group given that it approaches to within a certain distance, and therefore quantifies the range over which T-PODs are effective. However, this probability can vary depending on time spent within each range. To account for the effect of time on detections, click train detection rate was also calculated for each distance bin.
Following Rayment et al. (Reference Rayment, Dawson and Slooten2009b), distances were first assigned to one of 18 bins (i) according to distance of the leading dolphin(s) from the T-POD (i = 0–99 m, 100–199 m, … , 1700–1799 m). When subsequent fixes of the same dolphin group were in the same distance bin, the time that the group spent in that bin was calculated and referred to hereafter as a ‘period’. To provide a realistic time frame for detections, only periods longer than 30 seconds were included in the analyses.
The click train detection rate, R j, for each period was calculated as:
 $$R_j=C_j / T_j$$
where: C j is the number of click trains detected in period j, T j is the duration of period j in minutes. The values of R j were then averaged for each distance bin. Zero values, occurring when no detections were made in a bin, were included in samples.
The detection probability for each distance bin, P i, was calculated as:
 $$P_i=D_i / N_i$$
where: D i is the number of periods in distance bin i with acoustic detections of dolphins, N i is the total number of periods in distance bin i.
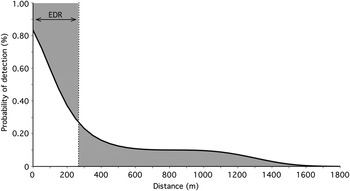
A cubic logistic equation was fitted to the binned detection data in order to estimate an effective detection radius (EDR), analogous to effective strip width in line transect surveys (Buckland et al., Reference Buckland, Anderson, Burnham, Laake, Borchers and Thomas2001; Rayment et al., Reference Rayment, Dawson and Slooten2009b). EDR is a measure of the range over which the T-POD effectively detects all dolphin groups, and was calculated as the area under the fitted curve. A parametric bootstrapping procedure was used to obtain a 95% confidence interval (CI) for the EDR.
RESULTS
Optimizing T-POD frequency settings
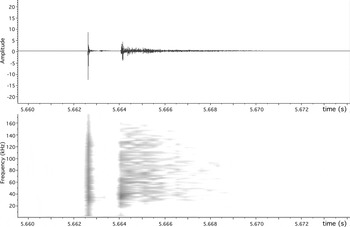
In situ recordings revealed that bottlenose dolphins in Doubtful Sound produced broadband sonar clicks with maximum energy from 40–120 kHz (Figure 1). A/B filter settings of 50/30, 70/30 and 90/30 kHz were established based on these recordings (referred to as in situ settings). In each mooring period a version 5 T-POD was set to cycle through this three setting combination, resulting in two 9.3 second scans at each of these settings, per minute. The three setting combination was used in recognition of the broadband nature of the signals, in an attempt to maximize detections.
Waveform (top) and spectrogram (bottom) of one example click from in situ recordings. The second pulse is most likely to be a reflection from the water surface. The initial click is very short (~50 µs long), only 2–3 cycles. Whilst clicks are broadband, most energy in the click is above 30 kHz, between 40 and 120 kHz.

Significantly more detections, (satisfying our decision rules), were made using the in situ settings than the ‘dolphin sweep’ settings (two-sample t-test, P < 0.001), or the settings used in previous studies (Kruskal–Wallis, P < 0.001; Nemenyi post hoc, P <0.001). In both field trials, in situ settings recorded by far the highest number of detections in ‘Cet hi’, ‘Cet lo’ and ‘Cet doubtful’ train categories. The standard ‘dolphin sweep’ setting appeared to be more effective than the settings used by Philpott et al. (Reference Philpott, Englund, Ingram and Rogan2007) or Bailey et al. (Reference Bailey, Clay, Coates, Lusseau, Senior and Thompson2010) and Simon et al. (Reference Simon, Nuuttila, Reyes-Zamudio, Ugarte, Verfub and Evans2010) (Table 1).
Detection range
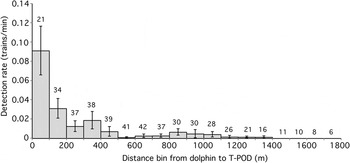
The detection range experiments used the in situ filter settings, i.e. two scans each at 50/30, 70/30 and 90/30 kHz. A total of 52 range trials were conducted of which 23 had detections on the T-PODs. Acoustic detection rates decreased with increasing distance from the T-POD to the dolphin group (Figure 2). The maximum detection range was 1313 m. Mean range of first detection was 593 m (SE = 82 m). Variation in detection rate was highest at closer ranges. The mean speed of the dolphin groups during the range trials was 1.32 ms− (SE = 0.14).
Detection rates plotted against distance from dolphin group to T-POD. Numbers above columns indicate sample size (i.e. number of periods per distance bin). Error bars are +/− one standard error.

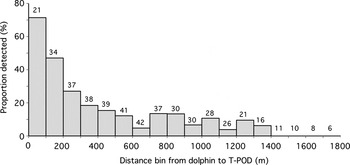
Detection probability decreased with increasing distance from the T-POD to the dolphin group (Figure 3). Of the 45 groups observed within 500 m, 47% were acoustically detected. Of 52 groups observed within the 1300 m maximum detection range of the T-POD, 44% were detected acoustically. Using overall time in minutes spent within 500 m of the T-POD, 10% of minutes had positive detections. Of overall minutes spent within the 1300 m range, 6% of minutes had positive detections.
Histogram showing proportion of dolphin groups detected against distance to the T-POD. Numbers above each column indicate sample size (i.e. number of periods per distance bin).

A cubic logistic regression was fitted to the probability of detection data (Figure 4). The regression equation was:
 $$\eqalign {&\log \lpar {\rm p}/\lpar 1-{\rm p}\rpar \rpar = {\rm a} + {\rm bx} + {\rm cx}^2 +{\rm dx}^3\comma \; \cr & \quad {\rm where\ a} = 1.609\comma \; {\rm b} = -13.71\comma \; {\rm c} = 16.53\comma \; {\rm d} =-6.661}$$
Thus:
 $${\rm p} = 1/\lpar 1 + {\rm exp}\lpar -{\rm u}\rpar \rpar \comma \; {\rm where u} = {\rm a} + {\rm bx} + {\rm cx}^2 + {\rm dx}^3$$
By integration, EDR was estimated to be 266 m (95% CI; 222–317 m).
Cubic logistic regression fitted to the detection probability data. EDR (the point at which the shaded area under the curve equals the shaded area above the curve) is 266 m.

DISCUSSION
The major point of interest gained from comparing different filter settings in field trials of T-PODs in Doubtful Sound, was the significant difference in number of dolphin trains detected. In situ settings, derived from wideband recordings at the study location, obtained much higher numbers of trains than default settings or settings used in previous studies elsewhere. Combining ‘Cet Hi’, ‘Cet Lo’ and ‘doubtful’ categories, in situ settings made between 8.1 and 33 times as many detections as others trialled. Optimizing detection rate is extremely important in habitat monitoring as the T-POD is inherently conservative due to directionality of sonar clicks, limited range of detection and requirement of active echolocation.
Our results confirm the value of trialling different settings, and if possible, making wideband recordings of the population under study before choosing A/B filter settings. Because bottlenose dolphins can modify the frequency content of their sonar signals (Au et al., Reference Au, Floyd, Penner and Murchison1974), it should not be assumed that characteristics recorded from a particular population will necessarily apply to other populations.
As expected, detection rate and probability decreased with increasing distance between the T-POD and dolphin group. These patterns can be attributed to directionality and loss of click energy over distance (Au, Reference Au1993; Philpott et al., Reference Philpott, Englund, Ingram and Rogan2007). Echolocation clicks are focused by the melon, producing a highly directional transmission beam from the dolphin's head (Au, Reference Au1993). Within this echolocation beam, intensity decreases at increasing angles from the source and the spectral content of clicks changes. In the bottlenose dolphin, the 3-dB beamwidth is 10–11.7°, with an upward angle of approximately 5° (Au et al., Reference Au, Moore and Pawloski1986). As a result of this directionality, echolocation clicks become more distorted at increasing distances from the centre of beam (Au, Reference Au, Perrin, Thewissen and Würsig2002). Therefore at larger ranges, a smaller proportion of clicks will be on-axis, reducing click energy available to induce T-POD detections. Click energy is also lost over distance via spreading losses and absorption, the latter being dramatically frequency-dependent in seawater. For example, absorption loss at 10 kHz is ~1 dB/km, while at 100 kHz loss is ~38 dB/km (Ainslie & McColm, Reference Ainslie and McColm1998). Acoustic detectors record clicks with energy over a certain threshold. Both of these factors reduce detection ability of any acoustic detector over distance.
Of 52 trials, 29 resulted in no acoustic detections. Of these 29, 14 came within 200 m and five within 100 m or less of the T-POD. Of dolphin groups that came within 500 m of the T-POD, only 47% were detected. This result is similar to the 45–55% range from Bailey et al. (Reference Bailey, Clay, Coates, Lusseau, Senior and Thompson2010), but is much lower than the 82% reported by Philpott et al. (Reference Philpott, Englund, Ingram and Rogan2007). In addition to directionality and click energy factors discussed above, these results suggest that the dolphins in Doubtful Sound (and possibly the Moray Firth, Scotland; Bailey et al., Reference Bailey, Clay, Coates, Lusseau, Senior and Thompson2010) may also be echolocating less than those investigated by Philpott et al. (Reference Philpott, Englund, Ingram and Rogan2007) in the Shannon Estuary, Ireland.
Several authors have noted that wild bottlenose dolphins are often silent (i.e. not echolocating; e.g. Nowacek Reference Nowacek2005, Gannon et al., Reference Gannon, Barros, Nowacek, Read, Waples and Wells2005). Dos Santos & Almada (Reference dos Santos, Almada and Thomas2004) suggested that bottlenose dolphins use passive listening extensively while searching for certain food types because echolocation clicks can alert prey species to their presence, thus hindering foraging success (see also Gannon et al., Reference Gannon, Barros, Nowacek, Read, Waples and Wells2005). Additionally, dolphins may not require echolocation for navigation during the day due to visual familiarity with their environment (Nowacek, Reference Nowacek2005). For example, bathymetric features such as channel confluences or subsurface rises may provide navigational aids. Bats do not need to echolocate constantly after becoming familiar with an area and will avoid objects that have been removed or collide with newly introduced obstacles (Holler, Reference Holler1995). Reduced echolocation for navigation would not be surprising in Doubtful Sound as the population is resident and uses common routes every day.
Studies have also shown that echolocation occurs significantly less frequently when bottlenose dolphins are travelling compared to other activities (Jones & Sayigh, Reference Jones and Sayigh2002; dos Santos & Almada, Reference dos Santos, Almada and Thomas2004). Therefore another explanation for lower detection rates in this study compared to Philpott et al. (Reference Philpott, Englund, Ingram and Rogan2007) is that the proportion of time spent travelling in this study was higher. This is probable as our methodology depended on placing T-PODs in the path of travelling groups of dolphins.
The maximum range of detection was 1313 m, very close to the 1246 m measured by Philpott et al. (Reference Philpott, Englund, Ingram and Rogan2007). This is of interest as the two study sites are extremely different. The slightly greater distance recorded in Doubtful Sound could be related to increased reflection due to the near-vertical rock walls and the long, narrow, form of the fiord and/or to the low salinity layer, within which high-frequency sound suffers less absorption (Ainslie & McColm, Reference Ainslie and McColm1998), allowing signals to propagate further. Our data, combined with Philpott et al.'s suggestion that the maximum detection range of bottlenose dolphins with a T-POD is around 1300 m.
Tougaard et al. (Reference Tougaard, Rosager Poulsen, Amundin, Larsen, Rye, Teilmann, Leeney and Tregenza2006) calculated a maximum detection distance of 400 m for harbour porpoise; Rayment et al. (Reference Rayment, Dawson and Slooten2009b) 431 m for Hector's dolphin and Jefferson et al. (Reference Jefferson, Hung, Law, Torey and Tregenza2002) 250–350 m for finless porpoises. That these distances are much smaller than for bottlenose dolphins is partly explained by the much lower source levels of the other species (191 dB for harbour porpoise, Villadsgaard et al., Reference Villadsgaard, Wahlberg and Tougaard2006; 177 dB for Hector's dolphin, Kyhn et al., Reference Kyhn, Tougaard, Jensen, Wahlberg, Stone, Yoshinaga, Beedholm and Madsen2009; 167 dB for finless porpoise, Akamatsu et al., Reference Akamatsu, Wang, Wang and Wei2001; all levels re 1 µPa @ 1m). Source levels from bottlenose dolphins can be much greater (220 dB for a dolphin echolocating on a distant target; Au et al., Reference Au, Floyd, Penner and Murchison1974). Additionally, the broadband clicks of bottlenose dolphins have much more energy at low frequencies, which suffer much less absorption and therefore propagate further than the narrow-band high-frequency clicks that are characteristic of the other three species (Dawson & Thorpe, Reference Dawson and Thorpe1990; Villadsgaard et al., Reference Villadsgaard, Wahlberg and Tougaard2006). This enables clicks to maintain energy over longer distances, enabling T-POD detection thresholds to be met at greater ranges.
Estimates of EDR are crucial for determining the range at which any acoustic detector or recorder effectively detects all groups of the target species. While Bailey et al. (Reference Bailey, Clay, Coates, Lusseau, Senior and Thompson2010) have fitted a detection function to their T-POD detections of bottlenose dolphins in Cromarty Firth, they did not explicitly calculate EDR. Visual inspection of their data suggests an EDR of about 500 m (figure 3b in Bailey et al., Reference Bailey, Clay, Coates, Lusseau, Senior and Thompson2010). The estimate in the present study, 266 m, is considerably smaller. It is larger than the estimate for Hector's dolphin (198 m; Rayment et al., Reference Rayment, Dawson and Slooten2009b) presumably due to the differences in source levels discussed above. Nonetheless, it still equates to a relatively small monitored area of only 0.22 km2 per T-POD. This has advantages and disadvantages; acoustic detections can be attributed to relatively precise locations but several T-PODs would be required to monitor large areas of habitat.
Non-detection of target animals due to lack of sound production or sonar directionality is an unavoidable limitation of passive acoustic monitoring. The issue is exacerbated if the user makes inappropriate choices when setting commercially available devices such as the T-POD. We have demonstrated the importance of optimizing these settings in order to maximize the detection rate of bottlenose dolphins, while reinforcing what is known about the utility of T-PODs in acoustic studies of habitat use.
ACKNOWLEDGEMENTS
Equipment and funding for field research was provided by the New Zealand Whale and Dolphin Trust. Installation of temporary T-POD moorings was carried out under resource consent D202-001 from Environment Southland. Riley Elliott was supported by an Otago University Postgraduate Scholarship, and a Postgraduate Publishing Bursary. For help in the field, we are very grateful to Paul Meredith, Shaun Henderson and Abe Growcott. For help with data analysis, we thank David Fletcher and Daryl Coup.