

Workers are finishing the white marble facade of the three-story official residence of President Mobutu Sese Seko, which overlooks a city of 35,000 people that has sprung up in the 24 years since he seized power… Soon a huge dam will provide electricity to the whole complex. It was built over objections by the World Bank that it threatens river navigation vital for the neighboring Central African Republic.
—Chicago Tribune Correspondent Tom Masland, July 6, 1989
Introduction
Every year, billions of dollars’ worth of international development assistance flow into Africa, with little resulting progress in alleviating poverty. Existing studies are indeed far from conclusive regarding whether foreign aid has helped or hindered growth on the African continent.Footnote 1 If anything, there is some evidence that foreign aid compromises bureaucratic quality, the rule of law, and state institutions (Knack Reference Knack2001; Brautigam & Knack 2004; Heller Reference Heller1975; Cashel-Cardo & Craig Reference Cashel-Cardo and Craig1990; Khan & Hoshino Reference Khan and Hoshino1992; Svensson Reference Svensson2000; Moyo Reference Moyo2009). Other evidence further suggests that international aid assistance can prop up leaders, providing them with additional sources of finance to distribute patronage and reward political support, thereby consolidating their power (Briggs Reference Briggs2012; Tripp Reference Tripp, Resnick and de Walle2013; Morrison Reference Morrison2009; Jablonski Reference Jablonski2014).
Although much ink has already been spilled discussing the negative political implications of foreign aid, very little is still known about how that aid is actually allocated once it is in the hands of African leaders. How do these leaders utilize foreign aid to stay in power? What factors affect this aid allocation process at the sub-national level? Do electoral incentives influence the distribution of aid? There are only few scholarly efforts at analyzing the allocation of aid at the subnational level, due to lingering data limitations to the subnational geospatial data of aid allocation. This article attempts to fill this gap in the literature by analyzing a novel dataset on the geographical locations of development projects in Zambia for the period of 1996–2010.
This analysis argues that donor-funded projects are public goods that political leaders can allocate to their constituencies in order to garner electoral support. A widespread belief about African politics is that the government disperses state resources to reward its core supporters through existing clientelistic or ethnic networks (Kasara Reference Kasara2007; Weghorst & Lindberg Reference Weghorst and Lindberg2013). Conversely, there is evidence that the logic of public goods allocation defies this pattern when elections are competitive, and when leaders lack the necessary information to specifically target distributive goods to swing voters. Under these conditions, instead of materially rewarding their own core constituency, it appears that incumbents instead seek to focus their development investments on those districts where electoral returns to development efforts are expected to be high—that is, districts with many “weak opposers” or swing voters whose political support for opposition parties can be swayed based on development rewards.
Along the same lines, it also appears that autocrats have less incentive to give public goods (or donor projects) to districts with a high concentration of government loyalists, or to areas where a majority of voters share the ethnicity of the incumbent president. In an effort to avoid wasting their resources in districts where they already enjoy strong electoral support, political elites instead focus development efforts on districts where opposition to the ruling party is stronger.
To test these arguments and hypotheses, this study has collected and analyzed a newly available dataset on the locations of donor projects financed by the World Bank, African Development Bank (AfDB), and Japan International Cooperation Agency (JICA) in Zambia for the period between 1991–2010.Footnote 2 There are several reasons why Zambia was selected for this study. First, the political landscape of Zambia has changed drastically over the past two decades. Although the Movement for Multiparty Democracy (MMD) dominated the first two elections, its grip on power has slipped since the 2001 election, in which the MMD lost a majority in parliament, and its presidential candidates have continued to face formidable opposition thereafter. These political dynamics make Zambia an ideal case for exploring how elections under autocracy have influenced the way the government allocates donor projects. Second, Zambia is highly dependent on foreign aid. Indeed, “during 2000–05, aid accounted for an average 43 per cent of the total state budget, having peaked at 53 per cent in 2001” (Wohgemuth & Saasa Reference Wohgemuth and Saasa2008:3). Due to their limited capacity to address citizens’ needs, political leaders see development assistance as an alternative source of finance to improve their chance of winning elections (Fraser Reference Fraser and Whitfield2009).
By studying the pattern of aid allocation within Zambia, not only does this article provide insight into the political economy of foreign aid at the sub-national level, but it also contributes to a broader literature on distributive politics in sub-Saharan Africa. As Weghorst and Lindberg (2013:717) highlight, there is a “near consensus in African politics on clientelism as the only electoral strategy” based on the untenable assumption that African voters are largely not persuadable (as their voting choice is predetermined by “ethnic cleavages” or “entrenched clientelistic ties”). As Africa’s multiparty elections have become increasingly competitive (Rakner & van de Walle 2009), this prevailing view fails to capture the sophistication of voters and an important role that opposition parties (or opposition candidates) play in shaping the government’s distributive policy. Indeed, a number of empirical studies demonstrate that African leaders sometimes choose not to reward their own core supporters or voters from their own ethnic group (i.e., Kasara Reference Kasara2007; Green Reference Green2010; Banful Reference Banful2011; Kramon & Posner Reference Kramon and Posner2013). Building on these recent studies on distributive politics in Africa, this article explicates the manner in which electoral incentives shape the distributive logic of aid allocation.
The following section provides a theoretical overview of the intersection between politics and foreign aid and explains the logic of aid allocation. This is followed by a description of the data and econometric models used to evaluate the impact of electoral competition on the allocation of aid in Zambia, along with the empirical results of the statistical analysis. The article concludes with some key policy implications for the core findings from this analysis.
Theoretical Background
The Political Economy of Foreign Aid
For the past five decades, sub-Saharan Africa alone has received more than 1 trillion dollars’ worth of foreign aid from wealthy countries and international financial institutions such as the World Bank and African Development Bank.Footnote 3 The amount of development finance flowing into the African continent has steadily increased every year. At the same time, there is a growing skepticism among scholars and practitioners regarding the effectiveness of aid in facilitating economic development in Africa (Knack Reference Knack2001; Brautigam & Knack 2004; Heller Reference Heller1975; Cashel-Cardo & Craig Reference Cashel-Cardo and Craig1990; Khan & Hoshino Reference Khan and Hoshino1992; Moyo Reference Moyo2009; Booth Reference Booth2012).
One of the commonly cited reasons for aid ineffectiveness has to do with the issues of aid fungibility. At times, foreign aid is used to serve purposes that donors do not necessarily intend to support (Feyzioglu et al. Reference Feyzioglu, Swaroop and Zhu1998; Morrison Reference Morrison2007; McGillivray & Morrissey Reference McGillivray and Morrissey2000). On this theme, McGillivray and Morrissey (2000:423) contend that “[aid] recipients tend to treat aid as general budgetary support, irrespective of whether the donors try to allocate the aid for specific uses.” The existing literature suggests that aid fungibility has negative economic implications, as aid inflows can allow the recipient government to consume more without raising taxes, thereby undermining fiscal discipline and inflating government consumption without inducing greater investment (Boone Reference Boone1996; McGillivray & Ouattara Reference McGillivray and Ouattara2005).
It is important to note, however, that aid fungibility itself does not necessarily imply corruption or patronage, because the extra sources of finance made available with external development assistance can be invested in productive sectors which can benefit wide segments of the population (McGillivray & Morrissey 2000). Perhaps of greater concern is anecdotal evidence suggesting that the distribution of donor finance is subject to political manipulation and therefore biased. For instance, one report suggests that the Ethiopian government blocked some villages from access to “basic food, seed and fertilizer [financed by international donors] for failing to support Prime Minister Meles Zenawi” (BBC 2011). Similarly, another report reveals that President Mugabe and his party (ZANU-PF) in Zimbabwe strategically favored their own supporters with food aid and fertilizers (Human Rights Watch 2003). In Kenya, the Kikuyu under Daniel arap Moi (1978–2002) and the Kalenjin under Mwai Kibaki (2002–2013) are said to have received a disproportionate share of public funds, including development assistance from foreign donors (Jablonski Reference Jablonski2014; Wrong Reference Wrong2009).
Morrison (Reference Morrison2007; Reference Morrison2009) and Kono and Montinola (Reference Kono and Montinola2009) claim that foreign aid helps incumbent political elites by providing them with additional sources of finance to reward political allies and tighten their grip on power. To reduce the risk of corruption and political (or ethnic) patronage fueled by aid, international donors sometimes bypass the financial management system of a given aid-recipient country and decide to channel their aid through their own aid management system (Knack Reference Knack2013; Dietrich Reference Dietrich2013). All these reports and studies attest to the possibility that political and ethnic dynamics feed into the calculus of aid-recipient governments’ decisions regarding the allocation of development projects.
Despite this anecdotal evidence that the pattern of aid allocation is on occasion politically manipulated, there are surprisingly few scholarly efforts to analyze how foreign aid is allocated at the sub-national level. Most of the existing studies on aid allocation are cross-national in nature and provide little insight into the question of what factors (be they political, economic, or otherwise) explain sub-national variations in the distribution of donor finance. Furthermore, a small, albeit rapidly growing, body of literature on this theme mostly applies the existing theories of ethnic-based distributive politics to explain the pattern of allocation of aid finance within African countries (Jablonski Reference Jablonski2014; Moser Reference Moser2008).
Although these studies provide useful insight into the mechanism through which political elites use development finance as a source of patronage and to garner support, this analysis argues that ethnic politics play only a partial role in shaping the allocation of donor projects. In recent years, instead of simply playing ethnic cards or relying on clientelistic networks, some opposition parties have successfully adopted populist rhetoric to appeal to urban voters, thereby mobilizing support for challenging the ruling party, as seen in the cases of Zambia, Botswana, Kenya, and South Africa, just to name a few (Resnick Reference Resnick2012).
The evidence presented here suggests that instead of rewarding their own supporters or co-ethnic voters, the ruling incumbents tend to allocate donor projects to buy the support of swing voters. Somewhat surprisingly, the existing literature has little to say about the role of African swing voters in shaping the governments’ decisions regarding resource allocation. Indeed, swing voting is “an empirical anomaly” in African politics, largely due to the prevailing assumption that “voters are rarely considered persuadable” (Weghorst & Lindberg Reference Weghorst and Lindberg2013:717). In Western liberal democracies where elections are assumed to be free and fair and, more crucially, competitive, targeting state resources, such as infrastructure projects, grants, or other types of income transfers, to influence swing voters is considered a common electoral strategy (i.e., Bickers & Stein Reference Bickers and Stein1996; Denemark Reference Denemark2000). Today, sub-Saharan Africa is no different. In particular, the political model of aid allocation presented here argues that when there is real electoral competition and political leaders cannot specifically target their resources to cajole swing voters, they instead focus their development efforts in districts where there is stronger opposition support. In this manner, they seek to buy votes from weak opposers who lean towards opposition parties but may be persuaded to support the incumbents in exchange for development rewards.
The Logic of Aid Allocation
This theory of aid allocation starts with the assumption that the aid-recipient government has significant discretionary power to select the beneficiaries (or targeted populations) of donor projects. As Jablonski (Reference Jablonski2014) demonstrates, this assumption holds true in most cases. The World Bank, for instance, grants the line ministries of an aid-recipient government broad discretionary power to determine the specific details of projects, including project sites and how much aid should be spent in each location.Footnote 4 Furthermore, bureaucratic governmental systems in Africa, due to the overall lack of resources to plan and implement development projects, are often under the strict control of the executive body and, particularly, of the president (Saasa Reference Saasa2010). This same pattern holds true for bilateral donors. For example, JICA—a development agency of the Japanese government—initiates its development projects based on “requests for aid that are submitted by the government of the recipient country through diplomatic channels” (Japan International Cooperation Agency 2001:114). These requests usually specify target locations for the projects under consideration. JICA then conducts a basic study to finalize project sites from the list of candidate localities suggested by the aid-recipient government.Footnote 5 This decision-making structure leaves ample room for potential manipulation by the aid-recipient government to effect the distribution of aid in its own favor.
Given that the aid-recipient government has predominant authority over the distribution of aid, what then dictates its logic of aid allocation? Donor projects are public goods that political elites can potentially use as leverage to influence the voting decisions of the electorate. Under the assumption that these political leaders are desirous of vote-maximizing, it is in their strategic interest to allocate donor projects in ways that maximize electoral returns to their development investments. The existing literature on distributive politics offers two strands of competing arguments concerning the manner in which political actors allocate state resources for electoral purposes: the core voter model and the swing voter model. The core voter model posits that the government targets distributive goods to the incumbents’ strongholds, reflecting the idea of patron-and-client relationships in which patrons (or incumbent politicians in this context) seek to provide various types of material rewards to their clients (or their constituencies) in exchange for the latter’s loyalty (Cox & McCubbins Reference Cox and McCubbins1986; Weinstein Reference Weinstein2011; Jablonski Reference Jablonski2014; Briggs Reference Briggs2012).
In contrast, the swing voter model posits that the government targets its distributive goods to swing voters “who [are] not so solidly committed to one candidate or the other as to make all efforts at persuasion futile” (Mayer Reference Mayer2008:359; Lindbeck & Weibull Reference Lindbeck and Weibull1987; Magaloni Reference Magaloni2006; Moser Reference Moser2008; Albertus Reference Albertus2012).While each model has its merits and limitations, analysis of clientelism and ethnicity dominates much of the academic discourse surrounding African distributive politics (Posner Reference Posner2005; Kasara Reference Kasara2007; Weghorst & Lindberg Reference Weghorst and Lindberg2013). There are, in fact, a number of studies on this theme that explicitly test the linkage between ethnicity and the allocation of distributive goods in the African context (i.e., Posner & Simon Reference Posner and Simon2002; Kasara Reference Kasara2007; Franck & Rainer Reference Franck and Rainer2012; Kramon & Posner Reference Kramon and Posner2013; Jablonski Reference Jablonski2014). However, as elections in sub-Saharan Africa have become increasingly competitive over time (Rakner & van de Walle 2009), the political landscape in the region today is much more fluid than decades ago, when one party dominated and no viable opposition parties were tolerated. For instance, in roughly one third of sub-Saharan African countries, no single party held a majority of seats in parliament in 2012, attesting to an increasingly contested and fragmented nature of African politics.
In contrast to the static view of African politics in which voters are assumed to be non-persuadable, it is likely that swing voting now plays an increasingly important role in shifting the nature of distributive policy in the Africa context. Unlike the strategy of clientelism—which depends on personalized networks of interdependence, where patrons give private goods, such as cash, fertilizers, or food, to their constituents in exchange for the latter’s political loyalty—development projects financed by donors are in most cases not private goods that go directly into voters’ pockets. Instead, they represent collective/public goods that affect the welfare of a certain community, district, or region, through better access to water, electricity, roads, railroads, ports, the Internet, and so forth. Recent studies have revealed that African swing voters place more value on collective goods than private rewards as key determinants of their political support. Young (Reference Young2009), for instance, shows that Zambian voters tend to see the delivery of local public goods, not personal gifts, as one of the core responsibilities of members of parliaments. Sharing this view, Weghorst and Lindberg (2013: 730–731) argue that “even in highly clientelistic environments, incumbents who wish to get reelected should seek to meet voter demands, including delivering collective goods.”
From the rationalist perspective of distributive politics, there is little theoretical grounding for assuming that leaders are motivated to provide public/collective goods to their core supporters. First of all, as mentioned above, collective goods, such as those provided by donor projects, cannot be used as patronage rewarded to politically connected individuals. Furthermore, given that state resources are limited, it is not clear why the aid-recipient government might choose to waste its resources on core supporters who are likely to vote for their own party regardless of any material or development rewards (Stokes Reference Stokes2005; Casas Reference Casas2012). In the case of competitive elections, if the incumbents seek to expand their political clout, it is more likely that they would distribute their resources in a way that further consolidates their power (instead of maintaining the status quo). In this context, one way to do exactly that is to channel donor-funded development projects to districts with many “weakly opposed” voters who may switch their allegiance from the main opposition party (or parties) to the incumbents, conditional on greater development investments in their communities.Footnote 6 As defined by Stokes (2005:320), weak opposers are swing voters who “prefer to vote against [the ruling incumbent] in the absence of a reward, but prefer to vote for [the ruling incumbent] if doing so brings them a reward.”
One of the key issues that autocratic leaders face in targeting resources to such weakly opposed voters is that they do not know with certainty where those potential swing voters are located (Albertus Reference Albertus2012). This is particularly true in Africa, where most political parties are still young, and “[political elites] are poorly informed about their potential electoral constituencies” (Bleck & van de Walle 2013:1396). According to Casas (2012:12), when politicians lack information about the voting preferences of their citizens, as in many African countries where democratic systems are still weak and party affiliations are highly fluid, the optimal strategy for the incumbents is to target distributive goods to “districts with fewer loyalists (i.e., opposition strongholds).”
If it is true that incumbents seek to reward as many weak opposers as possible in the absence of concrete knowledge about where those swing voters are actually located, then logically they would allocate more development projects to districts with greater electoral support for the leading opposition party. In this manner, the incumbents attempt to minimize the risk of losing elections by curtailing the political influence of the main opposition group which poses the most immediate threat to the ruling party’s grip on power, and also by expanding their own support base.
It is important to note that this line of logic differs somewhat from a typical application of the swing voter model in the electoral strategy of distributing targetable goods to swing districts, as seen in the context of parliamentary elections or U.S. presidential elections. Providing goods to swing districts where the ruling party has marginally secured seats is an attractive strategy for the incumbents who seek to maximize their number of seats in parliament. Such a strategy, however, is less relevant in the context of Africa, where parliamentary power is still weak, and an excessive amount of political power is vested in the presidency. What is at stake in African elections is almost always the total number of popular votes in presidential elections.
There are a number of empirical studies supporting the argument that African leaders allocate more goods to districts where opposition parties enjoy greater popularity (i.e., Fjeldstad et al. 2010; Banful Reference Banful2011; Green Reference Green2010). Banful (2011:1175), for instance, finds that in Ghana, “higher numbers of vouchers were targeted to districts that the ruling party had lost in the previous presidential elections, and more so in the districts that had been lost by a higher margin.” Thus, a case can be made for the following hypothesis:
Hypothesis 1: Incumbents allocate more donor-funded development projects to districts where the leading opposition party enjoys greater popularity.
Along these same lines, if the incumbents seek to avoid investing their resources in their own strongholds (because core voters are likely to vote for the ruling party regardless of the incumbents’ performance), districts where the ruling incumbents enjoy greater popularity would be expected to receive less donor financial investment than districts where opposition parties hold sway. This argument can also be extended to the logic of coethnic voting. As Conroy-Krutz (Reference Conroy-Krutz2013) claims, since rural voters often have limited information about the candidates or political parties in terms of their policy positions and qualifications, they often use ethnicity as “informational shortcuts” to assess the credibility of political contestants. In turn, since African leaders can usually rely on support from coethnic voters regardless of their ability to provide development investment, these candidates have little incentive to materially reward their coethnic constituency (Kasara Reference Kasara2007). These arguments yield the following predictions:
Hypothesis 2: Incumbents allocate fewer donor-funded development projects to districts where they enjoy greater political support.
Hypothesis 3: Incumbents allocate fewer donor-funded development projects to districts containing more coethnic voters.
The Politics of Aid in Zambia
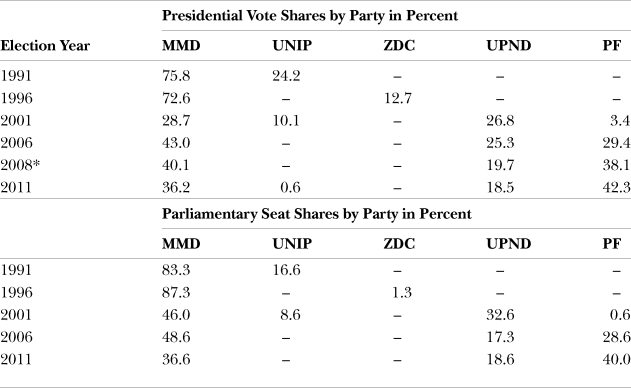
Zambia provides an ideal example for exploring the political determinants of aid allocation for several reasons. As mentioned earlier, Zambia’s democratic transition started in the early 1990s, and yet the country still vacillates between electoral democracy and autocracy, which is reflected in the fact that the Freedom House still rates Zambia as “Partly Free” two decades after its transition. After a peaceful electoral turnover in the 1991 election—which put an end to the one-party rule of the United National Independence Party (UNIP), Zambia has held four parliamentary elections (in 1996, 2001, 2006, and 2011) and five presidential elections (in 1996, 2001, 2006, 2008, and 2011). These elections have become increasingly competitive over time, as shown in Table 1. While the Movement for Multiparty Democracy (MMD) won well over two-thirds of the votes in the first two elections held in 1991 and 1996, the party gained less than 30 percent of the popular votes in the 2001 general elections and has failed to secure a majority of seats since then.
Vote/Seat Shares by Party for Zambian Elections, 1991–2011

*This presidential election was called following the death of President Levy Mwanawasa.
Sources: The Electoral Commission of Zambia, Table 2 in Rakner (2012:12).
Zambia’s political landscape has shifted away from a one-party dominant system to a more competitive electoral system over time. As Burnell (2002:1106) claims, Zambia under the Chiluba regime (1991–2001) was “almost a de facto one-party state” where too much power was concentrated in the MMD, and in the president in particular. Zambian politics took a drastic turn when President Chiluba pursued an unconstitutional third term in office leading up to the 2001 general elections. This political move spurred broad-based mass protests and plunged Chiluba’s popularity into an abyss. As a result, even the MMD parliamentarians distanced themselves from Chiluba by squelching his pursuit of a third term. Chiluba eventually handpicked Levy Mwanawasa as his successor; however, Mwanawasa captured only “19.45% of the registered electorate” (or roughly 30 percent of the votes cast) in the 2001 presidential election (ibid.:1107). Meanwhile, the MMD’s main opposition, the United Party for National Development (UPND), and its presidential candidate, Anderson Mazoka, seized a little less than 30 percent of the total votes, making the 2001 elections a very close match.
From the 2006 general elections onward, the Patriotic Front (PF), under the leadership of Michael Sata, has become the main competitor to the MMD. Sata and his party successfully adopted a populist strategy for appealing to low-income constituencies in urban areas which were disgruntled with a number of anti-urban measures and neoliberal economic reforms adopted by the MMD and Mwanawasa (Resnick Reference Resnick2012). Sata’s popularity expanded rapidly in the Copperbelt and Lusaka provinces, where major cities were concentrated, while also garnering extensive support from “predominantly Bemba-speaking rural regions, including Luapula and Northern Provinces” (ibid.:1363). Indeed, as shown in Table 1, Sata obtained a larger share of popular votes in each round of elections, capturing 29.4 percent in 2006, 38.1 percent in 2008, and 42.3 percent in 2011, while the PF also drastically increased its parliamentary seats, further eroding MMD control.
In the course of these dynamic political changes, international donors have maintained a strong presence in Zambia. Although the country’s reliance on external financial support has diminished in recent years, foreign aid continues to account for a significant proportion of the national budget (Wohgemuth & Saasa Reference Wohgemuth and Saasa2008). It is also well documented that the decision-making process surrounding the allocation of aid in Zambia is highly centralized and politicized. Line ministries plan and determine the specific details of development projects, which are later examined, approved, and financed by the donors (United Nations 2002). In most cases, however, “Zambian ministries lack the financial and human resources to adequately research, analyse, plan and implement policies,” and they are ultimately subject to policy decisions made by the executive body (Saasa Reference Saasa2010:9). This informal, neopatrimonial system of the Zambian bureaucracy blurs the distinction between public and private interests and allows domestic politics to feed into the calculus of aid allocation.
There is indeed some anecdotal evidence that politics have shaped the way state resources, including but not limited to donor finance, have been distributed in Zambia. For instance, during his one-party rule, Kenneth Kaunda strategically allocated development projects to areas where the ruling party was unpopular (Bates Reference Bates1976:245). Furthermore, Whitfield (2009:355) notes that the MMD used “famine relief programmes” and “rural development programs, both heavily dependent on donor support,” as political instruments to counter populist opposition forces. What is not clear in these anecdotal stories is the extent to which political incentives skewed the distribution of aid. In the following analysis, the manner in which electoral politics has influenced the government’s strategy of aid allocation is closely examined.
Data and Methods
District-level data on development projects and electoral outcomes in Zambia for the 15-year period of 1996–2010 is analyzed in order to examine the impact of electoral competition on aid allocation. Strandow et al. (2011) have recently compiled a data set on the geographical locations of World Bank projects approved between 2000 and 2010. Following their coding scheme, this newly available dataset has been expanded by geocoding donor projects financed by the World Bank, AfDB, and JICA in Zambia for the period of 1991–2010. These donors are selected based on data availability, which makes it possible to code the locations of their projects. Each of these three donors has been one of the largest aid contributors in Zambia, altogether accounting for 24 percent of the total aid budget committed to the country for the period between 1996 and 2010.Footnote 7
Based on project appraisal documents, completion reports, or other types of project documents, which are all available online, geographical coordinates of each project have been identified.Footnote 8 These geographical locations correspond to areas to which projects are targeted, meaning that project documents identify them as potential beneficiaries of the projects.Footnote 9 Only those projects whose targeted locations can be identifiable at the district level are included in this sample.Footnote 10 The date of project approvals is used as a point of reference to code when donor projects are targeted to certain areas. Following Öhler and Nunnenkamp (Reference Öhler and Nunnenkamp2014) and Moser (Reference Moser2008), Poisson regression models are estimated, where the dependent variable of interest is the total number of donor-funded projects that a given district receives in each five-year electoral cycle (1996–2000, 2001–2005, and 2006–2010).Footnote 11 Poisson regressions are commonly used to analyze count data in which the dependent variable takes only the values of positive integers.Footnote 12 Since preparations for donor projects usually require a few years before the projects become approved, a 5-year average panel data is used to allow for electoral outcomes to have impact, if any, on the allocation of development finance. Given that there were 72 districts in Zambia during the time period under study,Footnote 13 the panel data include 216 observations (3 × 72 = 216).Footnote 14
To test Hypothesis 1, the district-level share of votes for the leading opposition presidential candidate in the last election is used as a measure of opposition support (which is labeled as OPPOSITION SUPPORT).Footnote 15 The focus is on presidential electoral outcomes instead of parliamentary results because, as mentioned earlier, the former tend to carry much heavier weight than the latter in the African context (Weinstein Reference Weinstein2011; Rakner & van de Walle 2009). This is based on the fact that the presidency holds a disproportionate amount of political power, especially in Zambia (Saasa Reference Saasa2010).Footnote 16 The focus is additionally on the vote shares of the leading opposition candidates, because these candidates represent the most immediate threats to the incumbents. This theory predicts that given limited donor finance, MMD leaders used information from the last election to target their development efforts in areas that might be expected to buy votes away from the main opposition candidates. More specifically, the hypothesis predicts the effect of OPPOSITION SUPPORT on the number of projects to be positive, indicating that districts with a greater share of votes for the leading opposition candidate should be expected to receive more donor projects.Footnote 17
Turning to Hypothesis 2, the share of votes for the MMD presidential candidates in the past election is used to measure the level of support for the incumbents (MMD SUPPORT). The effect of MMD SUPPORT is expected to be negative, as the hypothesis predicts that MMD leaders avoided investing donor resources in districts where they already enjoyed significant support. OPPOSITION SUPPORT and MMD SUPPORT are highly correlated but not perfectly collinear, because there have always been more than two presidential candidates contesting popular votes. Finally, to test Hypothesis 3, Jablonski’s (2014) approach is used in generating a binary variable (COETHNIC) that is coded 1 if the estimated proportion of coethnic voters in a given district exceeds 50 percent, and zero otherwise.Footnote 18 The effect of COETHNIC is expected to be negative, because the incumbents have little incentive to distribute development resources to those districts where a majority of voters are part of their same ethnic group and thus are likely to be non-persuadable (meaning that they would vote for candidates from their own ethnic group regardless of any development rewards brought by the government).
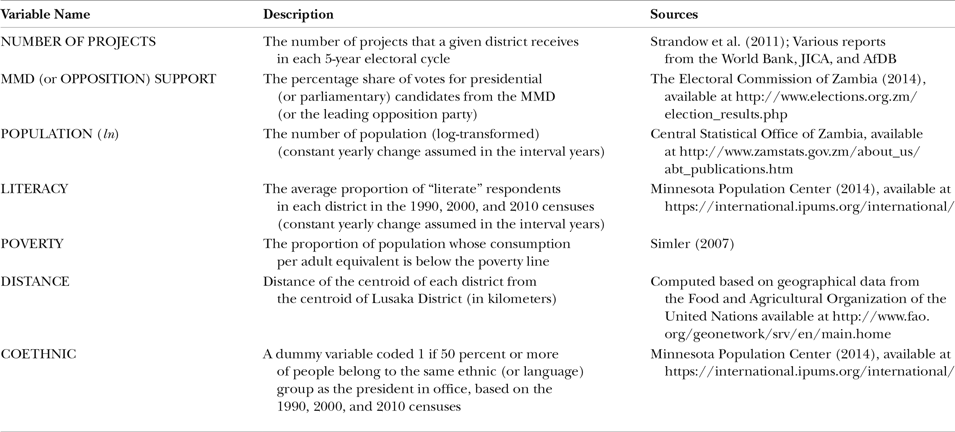
A battery of control variables is included in these models. First, various demographic and economic factors may influence the destinations of donor projects. To account for this possibility, there are controls for population size (log-transformed) (POPULATION (ln)), literacy rate (LITERACY), and poverty rate (POVERTY).Footnote 19 These variables are included to capture the impact of needs-based factors on the pattern of aid allocation. If donor projects are intended to respond to the development needs of districts, more impoverished districts—characterized by a higher rate of poverty and a lower rate of literacy—should receive more aid.
Since geographical accessibility may strongly influence the capability of the government (and international donors) to deliver projects, distance from the country’s capital (Lusaka) is included as an additional control (DISTANCE). The effect of DISTANCE is expected to be negative, given that it is usually more costly to deliver projects in peripheries. Additionally, past experience of receiving aid is also likely to affect the number of future projects committed to a given district. Thus, there is a control for the sum of the number of all past projects (lagged one period) allocated to each district.Footnote 20 Also included are province and electoral cycle dummies as controls for province-specific and temporal effects. Details on the specification of each variable along with descriptive statistics are available in Tables A-1 and A-2 in the Appendix.
Results
Determinants of Aid Allocation
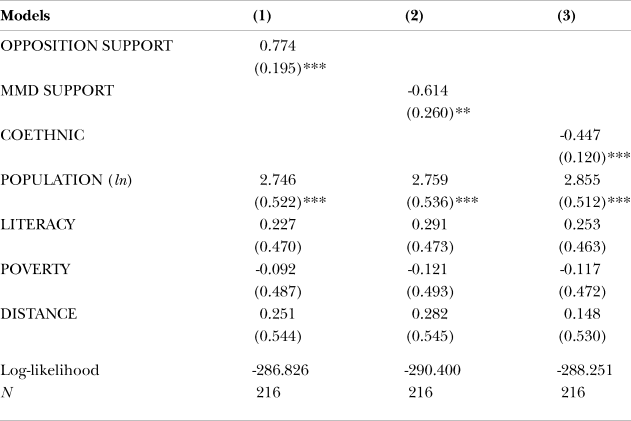
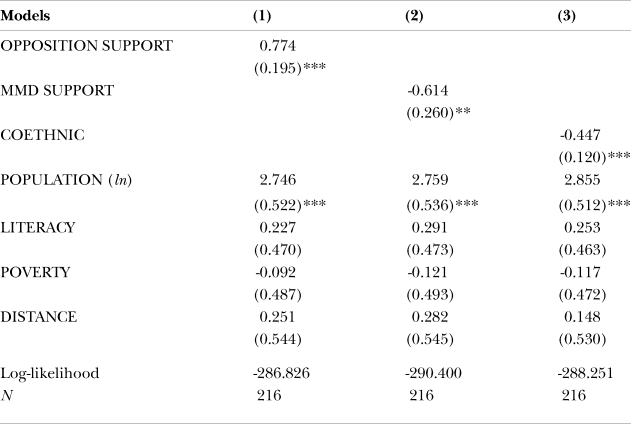
Table 2 summarizes the main results. Strong evidence is found for the three hypotheses as presented above. Model 1 tests the validity of Hypothesis 1 by evaluating whether OPPOSITION SUPPORT is positively correlated with the number of projects allocated to each district in every electoral cycle. As Hypothesis 1 predicts, the estimated effect of OPPOSITION SUPPORT on the number of donor-funded projects is positive and statistically significant, showing that support for the main opposition candidates increases the expected number of projects that a given district receives.
Poisson Regression Estimates: Determinants of the Number of Donor Projects

Notes: Standard errors reported in parentheses are all clustered by district. All these models include the number of past projects, province dummies, as well as electoral cycle dummies, although the coefficients for these variables are not reported to save space. ***p < 0.01, **p < 0.05, *p < 0.1.
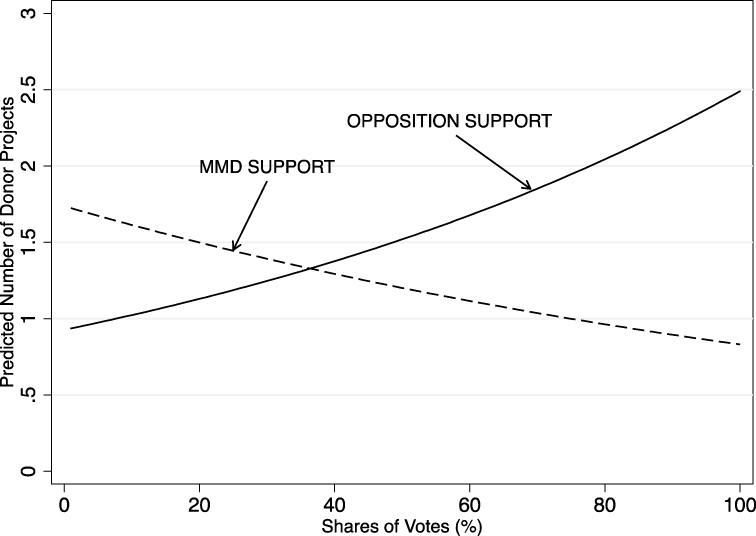
Figure 1 shows the substantive effect of OPPOSITION SUPPORT on the number of donor projects. The upward slope indicates that the predicted number of donor projects increases as support for the leading opposition candidates rises. More specifically, the expected number of projects in a given district (in each five-year electoral cycle) increases by 60 percent (from 0.9 to 1.5) when the share of votes for the leading opposition party increases from 0 percent to 50 percent. While trivial at first sight, this magnitude of effect is not negligible, given that the average number of projects allocated to each district in every electoral cycle is few (approximately 1.5 projects). These results support the hypothesis that incumbents allocate more donor projects to districts with a greater share of opposition votes.
Estimated Number of Donor Projects
Notes: This figure is generated based on Models 1 and 2 in Table 2. The black solid (or dashed) line represents the predicted number of projects at different values of OPPOSITION SUPPORT (or MMD SUPPORT). All other variables are set at means.

Turning to the effect of MMD SUPPORT on aid allocation, districts with a greater share of MMD support are expected to receive fewer projects. As shown in Model 2 in Table 2, MMD SUPPORT has a statistically significant negative effect on the number of allocated projects. The dashed black line in Figure 1 shows the predicted number of donor projects at different values of MMD SUPPORT. It demonstrates that as the share of votes for MMD presidential candidates increases from 0 percent to 50 percent, the expected number of donor projects decreases from 1.7 to 1.2. These results run directly counter to the key prediction of the core voter model, that the incumbents provide more distributive goods—in this context, donor projects—to their own strongholds, or to districts with a greater concentration of core supporters.
Finally, to test the relationship between ethnicity and aid allocation, the effect of COETHNIC on the number of donor projects is estimated in Model 3. As predicted by Hypothesis 3, the effects of COETHNIC are negative and significant. More substantively, a shift from 0 to 1 in COETHNIC is expected to induce a 0.5 decrease in the expected number of donor projects allocated to a given district (with everything else held at means). Overall, the empirical analysis shows strong evidence that districts where a greater proportion of voters share the ethnicity of the incumbent president receive fewer projects.
A few other important findings are in order. POPULATION (ln) is the only demographic factor that positively impacts the number of projects. There is a clear indication that donor projects are concentrated in districts with a higher population size. In contrast, the effects of LITERACY and POVERTY are not significant across all the model specifications tested in Table 2.Footnote 21 These results cause concern because they show little to no evidence that aid is targeted to poverty-stricken districts. One explanation for these results is that development efforts are focused on urban areas where literacy tends to be higher (and poverty lower) than rural areas (Le & Winters Reference Le and Winters2001). The urban bias of resource allocation is well documented in the literature on African politics (i.e., Bates Reference Bates1981; Majumdar, Mani, & Mukand Reference Majumdar, Mani and Mukand2004). The distribution of aid seems to follow the same pattern.
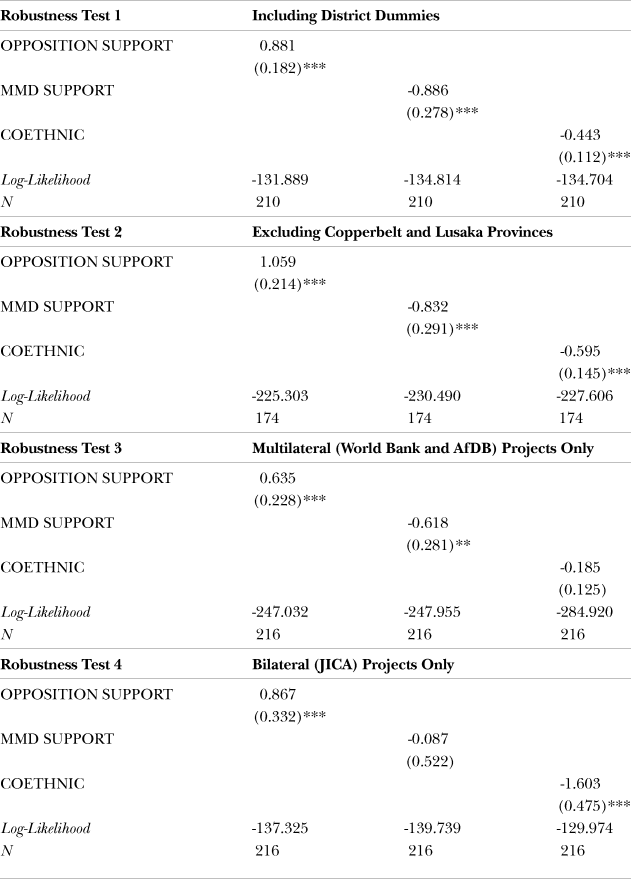
The main findings are subjected to a number of different robustness tests.Footnote 22 First, Models 1-3 reported in Table 2 are re-estimated by including district-fixed dummies to account for the possibility that the time-invariant characteristics of districts confounds the relationships between the vote variables and ethnicity, on the one hand, and the pattern of allocation of donor projects, on the other. The main findings remain unchanged with the inclusion of district dummies. Second, Copperbelt and Lusaka provinces are excluded to check if the results hold in that subset of data. In Zambia, just as elsewhere in sub-Saharan Africa, opposition strongholds tend to be concentrated in urban areas. Indeed, the electoral success of Sata and his party in the 2006 and 2011 general elections was very much a result of their populist strategy that resonated with “the growing frustrations of the urban poor,” particularly in the Copperbelt and Lusaka provinces (Resnick Reference Resnick2010:9). At the same time, these two provinces justifiably have a higher concentration of aid from the government as well as from donors, most likely due to their larger population sizes and the presence of key mining sites in Copperbelt province. For these reasons, it is worth checking whether the empirical findings are an artifact of political dynamics specific to these two provinces. The exclusion of these two provinces does not change the main results.Footnote 23
Lastly, the robustness of the results is tested by disaggregating donor projects by donor type. It is plausible that multilateral and bilateral donors may differ in the way they allocate their donor projects. Multilateral donors are able to finance development projects free from domestic pressures or geopolitical concerns, unlike bilateral donors, whose policy decisions are subject to congressional or parliamentary scrutiny (Dollar & Levin Reference Dollar and Levin2006; Weaver Reference Weaver2007; Bueno de Mesquita & Smith 2009; Youngs Reference Youngs2010). Thus, one should not assume that these two different types of donors allocate their development finances in the same way. With these considerations in mind, separate models are run for the World Bank and AfDB (multilateral donors), on the one hand, and JICA (bilateral donor), on the other. Disaggregating the dependent variable by donor type, however, does not significantly change any of the main findings. All the key variables of interest keep their expected signs although the effects of COETHNIC are no longer significant at the conventional level for the multilateral donors, and the effects of MMD SUPPORT are not significant for the bilateral donor. The effects of OPPOSITION SUPPORT are statistically significant for both the multilateral and bilateral donors when analyzed separately. Overall, there is not any systematic difference between multilateral and bilateral donors in terms of the way their projects are allocated.
The empirical data used for this analysis exclude projects financed by some of the major donors to Zambia, such as Germany, the E.U., and the United Kingdom. The exclusion of these donors is solely due to data limitations. Many donor agencies do not make their project documents or reports publicly available, which makes it difficult for researchers to identify the locations of their projects.Footnote 24 While data limitation certainly is a concern, I am skeptical that it introduces any systematic bias in the results. The decision-making process surrounding aid allocation is similar across multilateral and bilateral donors, whereby the recipient government ultimately takes the lead in deciding the details of donor-financed development projects. The robustness tests partially support this claim, demonstrating that the main findings are largely not sensitive to the disaggregation of donor projects by donor type. Unless there are strong theoretical reasons to believe that different political incentives are at work for different donors, selection bias is unlikely to pose a significant inferential problem.
Conclusion
This article analyzes a hitherto understudied aspect of foreign aid—the determinants of aid allocation within aid-recipient countries. The existing literature suggests that aid-recipient governments use foreign aid as a source of patronage to reward political support and to tighten their grip on power. The issue of politically motivated allocation of aid is perhaps more pronounced in Africa, where a majority of countries still rely on significant external financial assistance to keep themselves afloat. Despite the fact that the different political implications of foreign aid are well documented in the literature, only a few scholarly efforts have been made to actually investigate how aid is dispersed within an aid-recipient country.
To examine the pattern of aid allocation at the sub-national level, a novel data set on the geographical allocation of donor projects within Zambia during the period between 1996 and 2010 was used, which quantitatively tests the determinants of allocation of donor-funded projects. Challenging the prevailing view in African politics that African leaders simply reward their own core supporters with more resources, this analysis shows that in the context where elections are genuinely competitive and leaders are unable to target their resources specifically to swing voters (due to a lack of specific information), districts where opposition parties enjoy greater popularity receive more donor projects. In contrast, districts with a higher concentration of incumbent supporters or districts where coethnic voters are dominant receive fewer projects. These results are consistent with several other studies (Banful Reference Banful2011; Green Reference Green2010; Kasara Reference Kasara2007), which all cast doubt on the validity of the core voter model in the African context.
When limited information is available about the voting preferences of its own citizens, thus impeding the ability to target aid specifically to potential swing voters, the government seeks to put more development efforts into districts where there are more opposition supporters. In so doing, political elites attempt to sway as many weak opposers as possible, thereby further consolidating their power. While this study focuses exclusively on the distribution of donor-funded projects, it is possible to extend the core arguments of this article to other types of public/collective goods that the government may distribute as an instrument of vote-buying. This article thus calls for a more nuanced analysis of distributive politics in sub-Saharan Africa by focusing on the role of swing voters in shaping the way domestic resources are allocated at the sub-national level.
There are several policy implications that can be gleaned from this study. First, this article reveals that political incentives play an important role in shaping the allocation of aid. These findings shed a new light on what Resnick and van de Walle (2013:42) refer to an “incumbency effect” of aid. Since the incumbents have discretionary power over the allocation of aid, they may use aid as a political instrument to consolidate their power. International donors have increasingly embraced the idea of “country ownership,” which has granted the recipient government ever more control over the management and use of donor finance (ibid.). While country ownership is expected to enhance aid effectiveness by promoting greater policy alignment between donors and aid-recipients (Booth Reference Booth2012), it also increases the potential risk of that aid’s being used to serve unintended purposes (e.g., political patronage, corruption).
Another key policy implication, which is related to the first point, is that the pattern of subnational aid allocation seems to be insensitive to needs-based factors (e.g., poverty, literacy rate), as far as the empirical results are concerned. In fact, political incentives appear to have more influence on aid allocation than demographic or economic factors such as poverty or literacy. These findings agree with earlier studies (Briggs Reference Briggs2017; Öhler & Nunnenkamp Reference Öhler and Nunnenkamp2014), which also find no clear impact of poverty, maternal health, or malnutrition on the allocation of donor projects. These results thus call into question the effectiveness of aid in reaching those who are most in need and in addressing the developmental concerns and demands of impoverished areas.
One aspect of this research that begs future investigation is the need to explore the generalizability of these findings. In Zambia, elections have become increasingly competitive, and voters’ political preferences have become highly volatile in recent years (particularly in urban areas), which has injected a high degree of uncertainty into the political sphere (Resnick Reference Resnick2012; Resnick & van de Walle 2013). This theory is particularly pertinent to this kind of political setting where elections are competitive and the incumbents find it in their strategic interest to persuade potential swing voters by materially rewarding them. This strategy may not be applicable when ethnicity carries predominant weight in determining voting decisions (e.g., Kenya) or in cases where there is one dominant party, which can secure electoral victory by simply catering to the needs of core supporters (e.g., Tanzania). Future research is needed to further extend our understandings about how the nature of distributive politics varies across different political settings, and how it affects the pattern of aid allocation at the sub-national level.
Acknowledgments
I am grateful for guidance and encouragement from Nicolas van de Walle, Thomas Pepinsky, Peter Enns, and Christopher Way; and for useful comments from Gustavo Flores-Macías and Erin Hern. I thank AidData and its Director Brad Parks for providing me with office space and GIS technical assistance. All errors are my own.
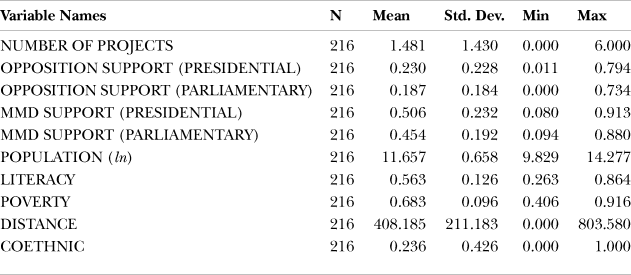
Appendix 1: Descriptive Statistics
Descriptive Statistics

Descriptions of the Variables

Appendix 2: Replicating Table 2 Based on Parliamentary Data
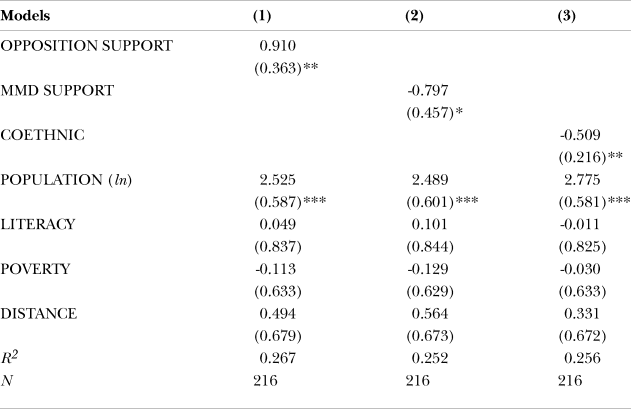
Table A-3 replicates the same models estimated in Table 2 using the parliamentary electoral outcomes. The main findings do not change significantly regardless of whether presidential or parliamentary data are used. The effects of the key variables under examination remain constant across all models reported in the tables.
Poisson Regression Estimates: Determinants of the Number of Donor Projects based on Parliamentary Data

Appendix 3: Using Jablonski’s Specification of Aid Distribution by Amounts
In the text, the key dependent variable of interest is the number of donor projects that each district receives. In this section, these models are replicated using the volume of aid, instead of the number of donor projects, as the dependent variable. To compute how much aid goes to each district, some assumptions have been made regarding the manner in which the amount of aid committed to a donor project that covers more than two districts is distributed across those districts. Following Jablonski (2014:307), it is assumed that when a project spans across two or more districts, “aid is distributed to each [district] by that [district]’s share of the population.” Using the log of aid per capita that each district receives as the dependent variable the baseline models presented in Table 2 in the main text have been replicated. The results are presented in Table A-4 the findings of which remain largely consistent with the stated hypotheses.
The Effect of Votes on Aid Per Capita

Appendix 4: Robustness Checks
Table A-5 shows the main results from the robustness tests as mentioned in the text. Models 1-3 as reported in Table 2 have been replicated by including additional controls or by limiting the analysis to a subset of the whole sample.
Robustness Checks