Implications
Studies were conducted on grazing-based dairy farms in southeastern Australia to determine and evaluate the accuracy of relationships between feed nutrient intake and milk and manure production and chemistry. Correspondence between feed–manure relationships to those measured on confinement dairy farms in various geographic locations indicated that the study's indirect measurements and calculations provided accurate estimates of feed nutrient intake. A greater control of supplemental feed in these grazing-based dairy systems would be needed if milk urea nitrogen is to be used to monitor dietary crude protein and if dung phosphorus is to be used to determine dietary phosphorus levels.
Introduction
The recent trends of high feed and fertilizer costs, great fluctuations in milk prices and increasing public demands for sustainable food production have motivated many dairy producers to seek new ways to maximize feed conversion into milk and enhance the recycling of manure nutrients back through croplands and pastures. Operators of confinement-based dairy farms use stored feed, which are often tested for quality, and this information can be used to balance the crude protein (CP) and energy in the diets fed to lactating cows. A principal challenge for operators of grazing-based dairy farms is that they must rely on indirect estimates of forage dry matter intake (DMI) during grazing. Estimates of DMI during grazing are used to determine how much dietary supplementation may be required to sustain target levels of milk production, keeping in mind the possible substitution of pasture DMI when supplements are fed (Grainger and Mathews, Reference Grainger and Mathews1989; Heard et al., Reference Heard, Cohen, Doyle, Wales and Stockdale2004; Beever and Doyle, Reference Beever and Doyle2007).
Over the past 20 years or so, discoveries have been made about interrelationships between nutrient concentrations in cow diets, milk production and chemistry, manure nutrient excretions and the transformation of manure nutrients in soil, water and air. For example, the difference between feed nutrient intake and milk nutrient secretion has been used to calculate manure nutrient excretion (c.f., Bulley and Holbek, Reference Bulley and Holbek1982; Wilkerson et al., Reference Wilkerson, Mertens and Casper1997; Yan et al., Reference Yan, Frost, Agnew, Binnie and Mayne2006; Kebreab et al., Reference Kebreab, Strathe, Dijkstra, Mills, Reynolds, Crompton, Yan and France2010), and when this information is combined with herd management practices determinations can be made of manure nutrient collection and distribution on commercial dairy farms (Powell et al., Reference Powell, McCrory, Jackson-Smith and Saam2005; Gourley et al., Reference Gourley, Powell, Dougherty and Weaver2007 and Reference Gourley, Aarons and Powell2012). On confinement dairy farms, the relationships between concentrations of CP in the diet and milk urea N (MUN) have been well described in the literature, and MUN has been used to balance the CP and energy in lactating cow diets and to predict total excretion of N in manure, including urea N excretion in urine (Jonker et al., Reference Jonker, Kohn and Erdman1998; Kauffmann and St-Pierre, Reference Kauffmann and St-Pierre2001; Johnson and Young, Reference Johnson and Young2003; Nousiainen et al., Reference Nousiainen, Shingfield and Huhtanen2004; Kohn, Reference Kohn2007; Wattiaux et al., Reference Wattiaux, Aguerre and Powell2011). A more broad-based use of MUN could have multiple positive impacts, including enhancements in feed N use efficiency (FNUE; Kohn, Reference Kohn2007) and reductions in ammonia emissions from dairy farms (Powell et al., Reference Powell, Wattiaux and Broderick2011). In addition, on confinement dairy farms, the concentration of total P and HCl-extractable P in dung can be used to predict concentrations of P in lactating cow diets (Powell et al., Reference Powell, Wu and Satter2001; Dou et al., Reference Dou, Ramberg, Chapuis-Lardy, Toth, Wang, Munson, Wu, Chase, Kohn, Knowlton and Ferguson2007) and P excretions in manure, which increases soil test P levels after manure application, the land requirement for effective manure P recycling (Powell et al., Reference Powell, Wu and Satter2001 and Reference Powell, Jackson-Smith and Satter2002) and runoff of soluble P from cropland after manure application (Ebeling et al., Reference Ebeling, Bundy, Powell and Andraski2002).
Although much is known about relationships between cow diets, milk production and chemistry, manure nutrient excretion, collection and distribution and the environmental outcomes of confinement dairy production, much less is known about these relationships on grazing-based dairy farms. The objectives of this study were to determine relationships between (1) feed N intake (NI), milk production, MUN, FNUE and excreted manure N (ExN) and (2) between feed P intake (PI), dung P and excreted manure P (ExP) for lactating cows grazing pasture and fed a wide range of diet supplements. To evaluate the accuracy of estimated DMI, NI and PI, an additional objective was to evaluate how well relationships on the studied grazing-based dairy farms compared with similar relationships on confinement dairy farms where feed intake and manure excretions have been actually measured.
Material and methods
Farm details
Four farms that raise Holstein dairy cows were selected from a total of 44 farms participating in the national ‘Accounting for Nutrients on Australian Dairy Farms’ project (Gourley et al., Reference Gourley, Dougherty, Weaver, Aarons, Awty, Gibson, Hannah, Smith and Peverill2012). The selection of the study farms was on the basis of the farmers’ ability to provide individual milk production and supplemental feed intake information for the lactating cows, and their willingness to allow rectum sampling of feces (dung) from each cow. The farms are located in Gippsland (Farms 1 and 4) and southwest Victoria (Farms 2 and 3) in southeastern Australia. This region experiences a temperate climate with hot dry summers (December to February) and maximum rainfall occurs between June and August. Cows rotationally graze pastures consisting predominantly of ryegrass (Lolium perenne) and white clover (Trifolium repens) year round. The cows return to the dairy shed (milk parlor) where they are milked twice (Farms 1, 2 and 4 in the morning and evening) or three times (Farm 3, in the morning, at noon and at night).
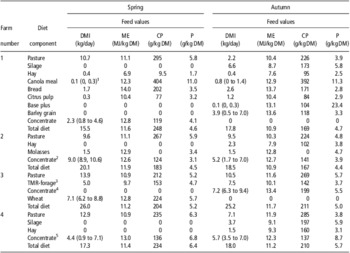
Data were collected during visits to each farm in autumn (May to June 2008) and spring (September to October 2008). A structured questionnaire (Accounting for Nutrients, 2010) was used during each visit to gather information on the stage of lactation (days in milk; DIM) and pregnancy of the lactating cows, their age and weight and the diets that were being fed on the day of the visit. Producers were asked to randomly select six cows from each of the groups of high, medium and low milk producing cows in their herd. A very diverse set of cows (Table 1) was selected to investigate the full range of milk production and associated feeding practices (Table 2).
Mean and range (minimum to maximum) of dairy cow characteristics (DIM) and milk production parameters (CP and MUN) during spring and autumn on the four grazing-based dairy farms in southeastern Australia

DIM = days in milk; CP = crude protein; MUN = milk urea nitrogen.
1Cow characteristics obtained from farmers’ records.
2Milk production obtained from farmers’ records, milk CP and MUN determined on samples taken from cows the days of the farm visits.
3Mean, followed by minimum–maximum values in parentheses for the 18 cows per farm.
4Individual cow milk data not available, these values refer to bulk tank ÷ number of lactating cows.
Estimated DMI, and measured ME, CP and P concentrations of diet components and total diets during spring and autumn on the four study dairy farms

DMI = dry matter intake; ME = metabolizable energy; CP = crude protein; P = phosphorus; TMR = total mixed ration.
1Mean, followed by minimum–-maximum values in parentheses for the 18 cows per farm.
2Concentrate contained wheat/barley mix and minerals
3The TMR-forage consisted of maize silage, pasture silage and hay in autumn and maize silage, pasture silage, hay and brewer's grain in spring.
4Concentrate contained wheat, canola meal and lupins.
5Concentrate contained wheat/barley mix, lupins, mill mix, lime salt and minerals.
Feed, milk and dung sample collection
Representative samples of each diet component and samples of milk and dung from each cow were taken. Diet components were sampled according to protocols established for the larger, national study (Accounting for Nutrients, 2010). On Farms 1, 2 and 3, milk volumes produced by each cow at each milking period were recorded to give total milk production for the day of the farm visit. Farm 4 eventually was unable to provide individual cow milk yields, but it was decided to collect all other survey information on diets and to take individual milk and dung samples from their 18 cows during both visits. Milk samples were kept on ice during transport to the laboratory. A single, daily composite milk sample per cow was made by combining morning and evening (Farms 1 and 2) or morning, noon and evening (Farm 3) subsamples in the mass ratio they were secreted (Wattiaux, Reference Wattiaux2005). Dung samples were taken directly from the rectum of each cow during each farm visit. Dung sampling occurred after the morning milking (Farms 1, 2 and 4) or noon (Farm 3), just before the herds returned to the paddock.
DMI
Total diet DMI (kg/day per cow) was calculated as the sum of non-pasture diet supplements (e.g. silage, hay, by-products, grain, concentrates; Table 2) offered manually (minus a proportion of the offer that producers estimated was not consumed) plus the amount of pasture DMI. Pasture DMI by each cow was estimated indirectly by calculating the probable metabolizable energy (ME) derived from pasture (Commonwealth Scientific and Industrial Research Organization (CSIRO), 2007). ME (MJ/day) derived from pasture was calculated as the difference between each cow's total ME requirement (MEcow) and the sum of ME consumed in non-pasture diet supplements. In this calculation, MEcow is the sum of ME required for milk production, walking to and from paddocks and the dairy shed, maintenance and grazing (CSIRO, 2007). The ME contained in milk was derived from each cow's milk production (l/cow) on the day of the farm visit, and the concentrations of protein, fat and lactose in the milk. Milk protein was determined analytically on composite milk samples as described below. Milk fat was obtained from analytical results provided by each farm's milk collector, and an average lactose concentration of 4.9% was used. The ME required for walking and maintenance depends on the age and weight of the cows, the average distance cows walked to and from the dairy shed and the number of milking times. All farmers provided the ages of their cows, two farmers were able to provide the weights of each cow and the other two provided a single average cow weight (650 kg), which was applied to all cows on those farms. The distances cows walked to and from the dairy shed were calculated from farm maps. Pasture DMI (kg/day per cow) was calculated by dividing calculated ME derived from pasture by the concentration (g/kg) of ME in pasture. Concentrations of ME and CP in pasture were analyzed from 15 random grab samples (hand-ripped from the standing forage to mimic cow bites) taken from the paddock(s) destined for offer to cows the evening following our morning farm visit.
Chemical analyses of feed, milk and dung
Samples of each diet component and dung were oven-dried (60°C, 72 h) then ground to pass a 2-mm screen. Ground feed and dung subsamples were oven-dried (100°C, 24 h) for calculating dry matter (DM). Samples of feed, milk and dung were analyzed by Weston Technologies, Sydney as follows: ME in feed was calculated on the basis of the concentrations of CP and acid detergent fiber in feed (Australian Fodder Industry Association, 2011); CP in feed and dung was measured according to AOAC methods (Association of Official Analytical Chemists, 2000; CP ÷ 6.25 was used to calculate total N concentrations); concentration of N and MUN were analyzed according to Kerscher and Ziegenhorn (Reference Kerscher and Ziegenhorn1990); and total P in feed and dung was measured by inductively coupled plasma optical emission spectrometry after digestion in hydrochloric and nitric acid (Dahlquist and Knoll, Reference Dahlquist and Knoll1978). Dung subsamples were also analyzed for HCl-soluble P according to procedures outlined by Dou et al. (Reference Dou, Ramberg, Chapuis-Lardy, Toth, Wang, Munson, Wu, Chase, Kohn, Knowlton and Ferguson2007).
Concentrations of ME, CP and P in the total diets (Table 2) were calculated as the proportional combination of each diet component DMI and their associated ME, CP and P concentrations. Milk N (MN) and milk P (MP) secretions (g/day per cow) were calculated by multiplying daily milk production (sum of all milking periods, l/cow) by the concentrations (g/l) of N and P in the composite milk samples. Energy-corrected milk (ECM) was calculated as follows: ECM = (kg milk × (376 × fat % + 209 × protein % + 948)) ÷ 3138 (Tyrrell and Reid, Reference Tyrrell and Reid1965).
Manure N excretions (g/day per cow) were calculated as the difference between NI and MN and manure P excretions (g/day per cow) were calculated similarly as the difference between PI and MP. Feed N use efficiencies were calculated as percentages (%) of NI secreted as MN (i.e. 100 × (MN ÷ NI)).
Statistical analysis
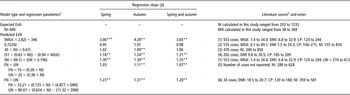
Relationships between DMI, NI, PI and milk production were analyzed by regression analyses using SAS 9.2 software (SAS Institute, 2007). Study estimates of ExN (g/day per cow) were compared with confinement dairy cow model estimates of ExN based on DMI, NI, milk production and live mass for lactating Holstein dairy cattle fed a wide range of diets in various geographic locations (Table 3). Correspondence between this study's grazing-based estimates of ExN and confinement-based model estimates of ExN were evaluated by regression analyses. A t-test was used to test the null hypothesis that the slope of the linear regression generated by study ExN (x) and predicted ExN (y) was not equal to 1.
Comparison of ExN calculated in this study with predicted ExN using DMI, diet CP, NI, cow LW, MILK, MN and the sum of FN (g/day) and UN (g/day) of lactating Holstein dairy cows

ExN = manure N excretion; DMI = dry matter intake; CP = crude protein; NI = feed N intake; LW = live weight; MILK = milk production; MN = milk N; FN = fecal N; UN = urinary N.
1DMI = kg/day per cow; diet CP = g/kg; NI = g/day per cow; LW = kg/cow; MILK = l/day per cow; MN = g/day per cow; ExN, FN and UN = g/day per cow.
2Sources provided in parentheses are as follows: (1) Nennich et al. (Reference Nennich, Harrison, VanWieringen, Meyer, Heinrichs, Weiss, St-Pierre, Kincaid, Davidson and Block2005), (2) Yan et al. (Reference Yan, Frost, Agnew, Binnie and Mayne2006), (3) Kebreab et al. (Reference Kebreab, Strathe, Dijkstra, Mills, Reynolds, Crompton, Yan and France2010), (4) Weiss et al. (Reference Weiss, Willet, St-Pierre, Borger, Mckelvey and Wyatt2009), (5) Kebreab et al. (Reference Kebreab, France, Beever and Castillo2001) and (6) Tomlinson et al. (Reference Tomlinson, Powers, Van Horn, Nordstedt and Wilcox1996).
3Probability þ≠1: **P < 0.01.
Results and discussion
The 18 cows on each farm varied greatly in lactation number, DIM and milk production (Table 1), with a few general trends distinguishable. Farm 3 milked three times daily and their herd produced on average 30% to 50% more milk than herds on the other three farms, which milked twice daily. Average DMI (25.6 kg/day per cow) of cows on Farm 3 was 43% greater than the average DMI (17.9 kg/day per cow) on the other study farms (Table 2). The greater DMI on Farm 3 than on the other study farms can be attributed to the feeding of a total mixed ration (TMR), which comprised 19% and 42% of the total DMI during spring and autumn, respectively.
Seasonal differences in cow diets
There were seasonal differences in the cow diets (Table 2), although these differences varied by farm. DMI (kg/day per cow) from pasture was greater during spring than during autumn for three of the four farms. Fresh pasture constituted a greater percentage of DMI in spring (on average 70%, 53% and 75% for Farms 1, 3 and 4 compared with 12%, 42% and 39% in autumn), indicative of the importance of pasture, particularly during the active spring growing season in these dairy production systems (Thorrold and Doyle, Reference Thorrold and Doyle2007). Concentrations of ME (MJ/kg) and CP (g/kg) in pasture appeared to be higher during spring than during autumn for Farms 1 and 2, but the opposite seemed to be true for Farm 3. Concentrations of ME and CP in the total diet were higher during spring than during autumn on Farms 1 and 2. Cows on Farm 3 and 4 had somewhat similar total diet DMI and similar concentrations of ME and CP in total diet during both spring and autumn.
Supplemental feed (i.e. feeds other than fresh pasture) provided on each farm consisted of by-products, concentrates or grain offered in the dairy shed; silage and hay fed in paddocks; and forage TMR provided on a cement feedpad near the dairy shed. During both spring and autumn, lactating cows on Farms 1 and 3 were fed a wide range of grain (0.5 to 8.8 kg/day per cow) or concentrate (0.8 to 9.4 kg/day per cow, Table 2). Lactating cows on Farm 2 were fed only two levels of concentrate in spring and a wide range of concentrate (1.7 to 7.0 kg/day per cow) in autumn. Cows on Farm 4 were fed a somewhat similar range of concentrate during both spring (0.9 to 7.1 kg/day per cow) and autumn (3.5 to 7.0 kg/day per cow).
Seasonal differences in milk production
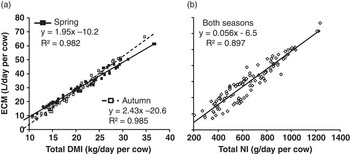
Average milk production was greater during spring than during autumn for Farms 2 and 3, but was similar during both seasons for the other two farms (Table 1). ECM response (Figure 1a) during spring was 1.95 l/kg total DMI (DM contained 11.5 ME/kg; Table 2) and during autumn it was 2.43 l/kg total DMI (DM contained 11.2 ME/kg; Table 2). These responses correspond to theoretical ECM response of 2.40 l/kg total DMI when the DM contains 12.0 MJ of ME/kg of DM (Beever and Doyle, Reference Beever and Doyle2007). ECM response to NI (Figure 1b) was similar (56 ml of milk per g of NI) during both spring and autumn.
Milk production response to (a) total dry matter intake (DMI) and (b) total nitrogen intake (NI) in spring and autumn (Farms 1, 2 and 3). ECM = energy-corrected milk.

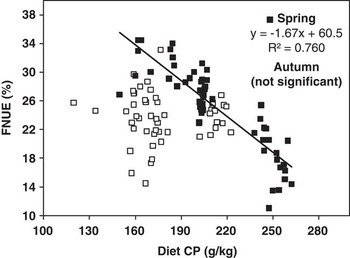
On Farms 1, 2 and 3, during spring, as total diet CP content increased FNUE declined (Figure 2). Average diet CP concentrations (g/kg) during spring on Farm 1 (249), Farm 2 (186), Farm 3 (204) and Farm 4 (210) were 51%, 13%, 24% and 27% greater, respectively, than a diet CP concentration (165 g/kg) deemed sufficient for high-producing Holstein dairy cattle fed TMRs on confinement dairy farms (Broderick, Reference Broderick2003). Operators of grazing-based dairy farms typically have difficulty controlling dietary CP levels during early spring, because pastures are often higher in CP concentrations than the requirement of dairy cows, and that protein is highly degradable (National Research Council (NRC), 2001; Beever and Doyle, Reference Beever and Doyle2007).
Relationship between diet crude protein (CP) concentration and feed nitrogen use efficiency (FNUE) in spring and in autumn (Farms 1, 2 and 3).

MUN
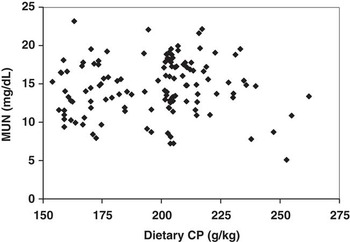
Relationships between dietary CP and MUN have been well-established for confined Holstein dairy cows (c.f., Johnson and Young, Reference Johnson and Young2003; Nousiainen et al., Reference Nousiainen, Shingfield and Huhtanen2004; Kohn, Reference Kohn2007), such that MUN is used by dairy nutritionists and producers to balance levels of dietary energy and CP. On the four grazing-based dairy farms of the present study, MUN concentrations varied greatly during both spring and autumn (Table 1). No significant relationships between diet CP and MUN were found on any farm during either spring or autumn (Figure 3). Only a few weak (R 2 between 0.20 and 0.25) significant relationships were found between the dependent variable MUN and the independent variables milk (l), milk N (g/kg), NI (g/day per cow) and NI : energy ratios (g/MJ). No significant relationships were found (data not shown) between MUN, parity or milking frequency, as observed on commercial confinement farms in the United States of America (Wattiaux, Reference Wattiaux2005).
Relationship diet crude protein (CP) concentration and milk urea N (MUN) on the four study farms in both spring and autumn.

On Farms 1, 2 and 3, average concentrations (mg/dl) of MUN in spring (13.5) and autumn (15.4) were within the range (11 to 18: Hutjens, Reference Hutjens1998 and 8 to 15: Kohn, Reference Kohn2007) observed for Holstein cows on confinement farms in the United States of America. However, the highest MUN levels on the present study's grazing-based farms were much higher than what is typically found on confinement farms. Of all (n = 144) MUN concentrations (mg/dl) measured on the study farms, 43% exceeded 15 and 15% exceeded 18, levels that could adversely impact the fertility of Holstein dairy cows that graze (van der Merwe et al., Reference van der Merwe, Dugmore and Walsh2001).
Possible causes of MUN concentrations outside the normal range include: (1) lower than expected milk yields, (2) poor diet formulation, (3) poor forage digestibility due to heat damage, (4) cow selection of only part of the diet and (5) inaccuracies in MUN analysis (Kohn, Reference Kohn2007). Of these possible causes, relatively low milk yields (Table 1 and Figure 1) and poor diet formulation because of great variability in amount and quality of pasture and supplements consumed (Table 2) likely resulted in highly variable MUN levels and lack of relationships between dietary CP and MUN. During spring on Farms 1 and 2 and during both seasons on Farms 3 and 4, diets contained 186 to 249 g CP/kg (Table 2). As mentioned previously, these dietary CP levels were 13% to 51% greater than a diet CP concentration deemed sufficient for high-producing Holstein dairy cows on confinement farms. Another possible reason for the lack of relationship between dietary CP and MUN may be associated with the present study's indirect calculations of pasture DMI and its CP concentration. As will be discussed in the next two sections, however, the relationships between feed nutrient intake and manure nutrient excretion (Table 3 and Figure 3) found in the present study correspond well to the measurements made on confinement dairy farm studies, which provides confidence in the accuracy of this study's estimates of pasture DMI and its CP (and P) concentration.
ExN
Comparisons of calculated ExN (present grazing study) with predicted ExN (algorithms developed for Holstein cows fed in confinement) are described in Table 3. On both confinement- and grazing-based dairy farms, milk production (l/day per cow) does not provide good predictions of ExN. Of the other input variables (DMI, NI and LW), NI provided the best relationships between calculated and predicted ExN. For data collected during both spring and autumn, NI multiplied by 0.72 (Yan et al., Reference Yan, Frost, Agnew, Binnie and Mayne2006) provided statistically similar values of calculated and predicted ExN (Table 3). Similarly, for data collected during spring, NI multiplied by 0.67 (Kebreab et al., Reference Kebreab, Strathe, Dijkstra, Mills, Reynolds, Crompton, Yan and France2010) and combined estimates of urinary N and dung N excretions based on NI (Kebreab et al., Reference Kebreab, France, Beever and Castillo2001) gave statistically similar values of calculated and predicted ExN. Bulley and Holbek (Reference Bulley and Holbek1982) found that NI multiplied by 0.71 and Wilkerson et al. (Reference Wilkerson, Mertens and Casper1997) found that NI multiplied by 0.69 (for cows producing 29 kg milk/day) were also good predictors of ExN.
There were similarities in the range of NI and NI multipliers used in the present grazing-based study to calculate ExN and those used in the confinement studies. The present study had a calculated NI range of between 203 and 1233 g/day per cow and the algorithms developed by Yan et al. (Reference Yan, Frost, Agnew, Binnie and Mayne2006) and Kebreab et al. (Reference Kebreab, France, Beever and Castillo2001and Reference Kebreab, Strathe, Dijkstra, Mills, Reynolds, Crompton, Yan and France2010) incorporated an NI range between 155 and 850 g/day per cow. For the present grazing-based study, an average NI multiplier of 0.76 (range of 0.65 to 0.89) could be used to calculate ExN; these NI multipliers being derived from the average FNUE of 24% (range of 11% to 35%; Figure 2) where FNUE = 100 × (MN ÷ NI). Estimates of ExN for confinement-based cows were based on NI multipliers of 0.67, 0.69, 0.71 or 0.77 (literature cited in the previous paragraph; Table 3). The correspondence between calculated and predicted ExN indicates that the present study's indirect methods provided accurate estimates of DMI and NI from pastures and supplements.
ExP
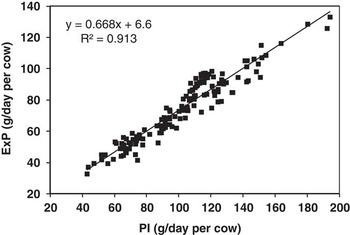
Beede (Reference Beede2001) evaluated six models to predict ExP, which included the independent variables LW, diet P concentration, PI and milk production. The conclusion of this evaluation was that ExP can be predicted most accurately from the simple difference between PI and milk P (all model parameters being expressed as g/day per cow). In the present grazing study, PI provided the most accurate prediction of ExP (Figure 4), with no obvious seasonal differences in estimation of ExP. The algorithm used to determine ExP from PI in the present study (Figure 4) corresponded closely to the relationship between ExP and PI for confinement dairy cows fed experimental TMRs (Wu et al., Reference Wu, Satter and Sojo2000; Weiss and Wyatt, Reference Weiss and Wyatt2004) and for commercial dairy farms in Wisconsin, United States of America (Powell et al., Reference Powell, Wu and Satter2001). As mentioned above, related to calculated and predicted relationships between ExN and NI, the correspondence between ExP and PI indicates that the present study's indirect methods provided accurate determinations of DMI and PI from pastures and supplements.
Relationship between total phosphorus intake (PI) and excreted manure phosphorus (ExP) in both spring and autumn (Farms 1, 2 and 3).

For lactating dairy cows fed in confinement, strong positive relationships have been determined between concentrations of P in diets and concentrations of P in dung (Wu et al., Reference Wu, Satter and Sojo2000; Powell et al., Reference Powell, Wu and Satter2001and Reference Powell, Jackson-Smith and Satter2002; Dou et al., Reference Dou, Ferguson, Fiorini, Toth, Chase, Knowlton, Kohn, Sims and Wu2003; Chapuis-Lardy et al., Reference Chapuis-Lardy, Fiorini, Toth and Dou2004; Satter et al., Reference Satter, Klopfenstein, Erickson and Powell2005). In the present grazing study, however, no significant relations were determined between concentrations of P in diets and concentrations of P in dung. This result was likely due to several reasons, including the very high levels and great variability in concentrations of diet P, the relatively low levels and great range in milk production and the very high levels and great variability in concentrations of P in dung. Holstein dairy cows require between 3.2 and 3.8 g P/kg of diet DM to produce between 25.0 and 54.4 l milk/day (NRC, 2001). On the four study farms, average diet P concentrations ranged from 4.4 to 6.4 g/kg (Table 2) and milk production ranged from 7.2 to 67.0 l/day (Table 1). In addition, concentrations of P in dung ranged from 4.7 to 14.0 g/kg on the study farms, which on average was much higher and more variable than concentrations of P in dung on the aforementioned confinement dairy farms. A large proportion (ranging from 25% to 40%) of the P consumed by lactating cows was derived from concentrate and/or grain (Table 2), indicating that better management of these diet components could reduce concentrations of P in dung such that dung P could be used to monitor and adjust dietary P concentrations, leading to enhance P use efficiency and reduced environmental impacts.
Conclusions
Estimates of DMI, NI and PI; relationships between dietary CP, NI, milk production, MUN, FNUE and ExN; and relationships between feed PI and ExP were determined for lactating cows fed a wide range of diets on four grazing-based dairy farms in southeastern Australia. Milk production response to DMI was lower during spring than during autumn, and milk responses to NI were similar during both seasons. Average concentrations of CP in diets during spring were 13% to 51% greater than levels deemed necessary for high-producing Holstein dairy cows fed on confinement dairy farms. In contrast to findings on confinement dairy farms, no significant relationships were determined between concentrations of CP in total diet DM and MUN. High dietary CP was likely due to dairy producers’ inability to know more precisely forage DMI during grazing, and therefore balance CP and energy intake with diet supplements. Feed NI provided the best predictions of ExN, and PI provided the most accurate prediction of ExP. The relatively good correspondence between this study's calculations of ExN and ExP to predictions using algorithms developed from confinement-based cows in various geographic settings suggests accuracy in the present study's indirect determinations of DMI, NI and PI. Therefore, it appears that NI and PI may be used to predict ExN and ExP on grazing-based dairy farms in this region of Australia. Improved feed management, including diet formulation, may enhance the predictive relationships between MUN and diet CP and between dung P and diet P.
Acknowledgments
The authors thank the farmers who participated in this study, providing the necessary information and allowing us to collect the required samples. We thank Lianne Dorling for her much needed technical assistance. This project was supported by the United States Department of Agriculture, Agricultural Research Service, US Dairy Forage Research Center; the Victorian Department of Primary Industries (MIS 06854), Dairy Australia and The Babcock Institute for International Dairy Research and Development, University of Wisconsin-Madison, USA.