


Human beings do not eat isolated nutrients, but meals consisting of a variety of foods with complex combinations of nutrients. Hence, the single-nutrient approach may be inadequate to account for complicated interactions among nutrients in studies analysing diet–disease associations.
Previous analyses of dietary baseline data in the Inter99 study (a study aiming to prevent diabetes and CVD) have indicated that analyses of dietary patterns may give a more balanced description of data compared to analyses of single nutrients(Reference Færch, Lau, Tetens, Pedersen, Jørgensen, Borch-Johnsen and Glümer1). Use of explorative statistical methods is one way to examine dietary patterns in populations. This approach is based on empirical data and not on a priori hypothesis. Confirmatory analysis, by contrast, is based on a priori hypothesis. It may be guided both by results from an explorative analysis and by knowledge of nutritional behaviour. Confirmatory analysis can be used to assess the reproducibility of dietary patterns identified.
The dietary patterns identified in other studies using explorative principal component analysis (PCA) have been characterised by a relatively high variation in intake of one or more of the following food groups: vegetables, fruit, pasta, rice, whole grains, low-fat dairy products, fish and poultry(Reference Osler, Helms-Andreasen, Heitmann, Høidrup, Gerdes, Jørgensen and Schroll2–Reference Maskarinec, Novotny and Tasaki11) in one pattern; or red meat, potatoes, refined grains, butter and lard, high-fat dairy products and confectionery in another pattern(Reference Osler, Helms-Andreasen, Heitmann, Høidrup, Gerdes, Jørgensen and Schroll2–Reference Fung, Willett, Stampfer, Manson and Hu7, Reference Togo, Heitmann, Sørensen and Osler9–Reference Maskarinec, Novotny and Tasaki11). Generally two to four dietary patterns have been identified.
The reproducibility of the patterns is often questioned because most studies only use explorative analyses like the PCA. Few reproducibility studies on dietary patterns exist; some have combined explorative PCA and confirmatory factor analyses (CFA)(Reference Togo, Heitmann, Sørensen and Osler9, Reference Maskarinec, Novotny and Tasaki11, Reference Newby, Weismayer, Akesson, Tucker and Wolk12) or applied the same procedure of PCA on two split-samples(Reference Togo, Heitmann, Sørensen and Osler9, Reference Newby, Muller and Tucker13, Reference Tseng, Breslow, DeVellis and Ziegler14) or on the same cohort one or more years apart(Reference Hu, Rimm, Smith-Warner, Feskanich, Stampfer, Ascherio, Sampson and Willett3, Reference Khani, Ye, Terry and Wolk10, Reference Newby, Weismayer, Akesson, Tucker and Wolk12). Both low and high reproducibility have been observed. The optimal method used to describe the reproducibility is still undetermined.
We aimed to identify dietary patterns in a Danish adult population (Inter99) and assess the reproducibility of the dietary patterns identified. Our first aim was to identify dietary patterns from explorative PCA. The second aim was to compare the results from the explorative analysis with the results from a CFA and an explorative analysis using a reduced number of food groups. The last aim was to compare results from explorative analyses between two split-samples. Bland Altman plots were used as an alternative and new method in the assessment of the reproducibility of identified dietary patterns.
Materials and methods
Study population
This study used baseline data from the Danish population-based Inter99 study, which is an intervention study on diet, physical activity and smoking with the aim to decrease the incidence of CVD and diabetes. The overall aim, data collection methods, non-dietary and dietary baseline results have been reported elsewhere(Reference Glümer, Jørgensen and Borch-Johnsen15–Reference Lau, Færch, Glümer, Toft, Tetens, Borch-Johnson and Jørgensen17).
The study base comprised 61 301 individuals born in 1939–40, 1944–45, 1949–50, 1954–55, 1959–60, 1964–65, and 1969–70, resident in eleven municipalities in the south-western part of Copenhagen County. An age- and sex-stratified random sample of 13 016 persons was drawn from the study base and 12 934 were eligible for further examination. All these individuals were invited for a health survey at the Research Centre for Prevention and Health in Glostrup. Baseline data were collected in 1999–2001, where 6784 (52·5 % of those invited) participated.
All participants gave written consent before taking part in the study. The protocol was in accordance with the Helsinki declaration and was approved by the local ethical committee (KA98155).
Dietary data
The participants completed a self-administered 198-item FFQ, where they were asked to report their dietary intake during the previous month. Consumption of each food item in the FFQ was estimated in g/d. A detailed description of the questionnaire and estimation of the dietary intake in the population is published elsewhere(Reference Lau, Færch, Glümer, Toft, Tetens, Borch-Johnson and Jørgensen17). However, in this study calculation of dietary intake was based on an updated version of the Danish Food Composition Data Bank(Reference Saxholt, Møller and Ygil18). Validation of the FFQ has shown that the FFQ provides a reasonable classification of individuals and a valid quantitative measurement of the dietary intake(Reference Toft, Kristoffersen, Ladelund, Bysted, Jakobsen, Lau, Jørgensen, Borch-Johnsen and Ovesen19).
We excluded individuals who had not filled in the FFQ, who had left five or more pages out of fourteen blank, or who had clearly misunderstood (including questionnaires where two or more answers per question line recurrently were ticked or questionnaires where only the highest response frequency was ticked repeatedly) the FFQ. A total of 6563 (96·7 %) individuals qualified for the present analyses.
Food intake assessed by questions in the FFQ was aggregated into thirty-four separate food groups (Appendix 1). The food groups were created based on food groups previously identified in Denmark(Reference Lyhne, Christensen and Groth20), the Danish food tradition, and the Danish dietary guidelines(21). Furthermore, criteria for categorising food items into one group were that the items shared macronutrient composition (e.g. fat or fibre content) or use (e.g. paté and high-fat meat for sandwiches), and that each food group only reflected one type of eating behaviour (e.g. not mixing vegetarian food items with meaty food items).
Statistical methods
Initially data were randomly split in two halves: sub-sample 1 and sub-sample 2 (Fig. 1). To identify and reproduce dietary patterns we applied PCA using the PROC FACTOR procedure and CFA using the PROC CALIS procedure in SAS version 8.2 (SAS Institute, Cary, NC, USA). Bland Altman plots were conducted to assess the agreement between the explorative analyses using R 2·1·0(22).
Scheme of statistical analyses. PCA, principal component analysis; CFA, confirmatory factor analysis; W, women; M, men. PCA 2 and CFA included the following food groups: paté and high-fat meat for sandwiches, mayonnaise salads, butter and lard, low-fat meat for sandwiches, potatoes, whole-grain cereals and bread, red meat, sauces, low-fat fish, high-fat fish, vegetables, fruit, mixed vegetables dishes, vegetable oil and vinegar dressing, poultry, pasta, rice and wheat kernels. The factor scores from PCA 4 were based on factor loadings estimated in PCA 1 and food intake of individuals in sub-sample 2. The arrows ( ↔ ) indicate that factor scores are compared using Bland Altman plots.

Identification of dietary patterns
Analyses of sub-sample 1 were conducted and decisions regarding the final factors were based on these results. We assumed, based on previous analyses(Reference Lau, Færch, Glümer, Toft, Tetens, Borch-Johnson and Jørgensen17), that different dietary patterns would be identified for men and women. Hence, analyses were conducted separately for each gender, too.
We conducted a PCA for sub-sample 1 (PCA 1; Fig. 1, step 1) using all the food groups (g/d) shown in Appendix 1. To identify the number of factors to be retained, we plotted the total variance associated with each factor (a Scree plot). After examination of the Scree plot we did an oblique transformation (promax rotation) to achieve a simpler structure with greater interpretability(Reference Loehlin23). Food groups with absolute factor loadings ≥ 0·40 were considered as significantly contributing to a pattern. The larger the loading of a given food group to the factor, the greater the contribution of that food group to the factor. If at least three food groups had loadings ≥ 0·40 on one factor it was considered a potential pattern. The more food groups loading high on a factor the more reliable it will be(Reference Hatcher24). We did not allow food groups to load ≥ 0·40 on more than one factor. PCA further provides factor scores that allow individuals to be ranked in terms of how closely they conform to the factor (dietary pattern).
Reproducibility of dietary patterns
We conducted a CFA and a second PCA (PCA 2) on a reduced number of food groups in sub-sample 1 (Fig. 1, step 2). These analyses were both based on results from PCA 1 only including food groups with loadings ≥ 0·40 and on (a priori) knowledge regarding two food groups (whole-grain cereals and bread, and high-fat fish) that according to the Danish nutritional behaviour traditionally are important food items in the diet. The root mean square error approximation was used to assess goodness of fit in the CFA. It should be < 0·05–0·10 for a good fit(Reference Loehlin23).
PCA 2 was conducted in order to estimate factor scores that could be compared with factor scores from PCA 1 in a Bland Altman plot (Fig. 1, step 3). In the Bland Altman plot the variation of the difference of the factor scores relative to the variation of average of them gives an impression of the reproducibility of the factor. The Bland Altman plot was used as an alternative and new method within this area. The degree of acceptable variation is a matter of judgement(Reference Bland and Altman25), but a ’small’ degree of variation is preferable.
To further assess the reproducibility of the factors identified in sub-sample 1 (PCA 1), we conducted analyses resulting in two sets of factor scores for sub-sample 2. First, a third PCA (PCA 3), following the same criteria as PCA 1, was conducted (Fig. 1, step 4) and factor scores of each factor were derived for each individual in sub-sample 2. Second, factor loadings on each factor estimated from PCA 1 were applied to the individuals in sub-sample 2, giving another set of factor scores in sub-sample 2. For simplicity this analysis is called PCA 4 (Fig. 1, step 5). The factor scores of each factor from PCA 3 and 4 were compared by Bland Altman plots (Fig. 1, step 6). These analyses were also done separately for men and women.
Pearson's correlation coefficient was calculated to assess the correlation between factor scores of similar factors from PCA 1 and 2, and PCA 3 and 4.
Results
The study population comprised 3191 (48·6 %) men and 3372 (51·4 %) women with complete dietary data. Baseline characteristics and dietary intake are presented in Appendices 2 and 3. The two sub-samples were comparable.
Identification of dietary patterns
For sub-sample 1 (PCA 1), two factors were identified whether the analyses were conducted on the entire sub-sample or for each gender (Table 1). We compared rotated factor solutions of two and four factors and found that the most meaningful factors were identified when only two factors were retained and rotated. We tested different rotation methods (varimax v. promax transformation) but did not find any significant differences in the final factors (data not shown). Hence, we allowed correlation between the factors using promax rotation.
Factor loading matrix of major factors (dietary patterns) identified using principal component analysis with promax rotation on food-frequency baseline data from sub-sample 1 in the Inter 99 study

* Sorted by factor loadings on ‘Traditional’ and ‘Modern’ factor for all in sub-sample 1. Food groups with loadings < 0·30 for all the factors listed were excluded from the Table. These were: mix of butter, margarine and oil; cheese; ice cream and chocolate milk; confectioneries; sweet spread; alcohol; and miscellaneous foods.
The factors were either labelled ‘Traditional’ or ‘Modern’. For the entire sub-sample 1, the factor ‘Traditional’ was characterised by high loadings ( ≥ 0·40) on paté or high-fat meat for sandwiches, mayonnaise salads, red meat, potatoes, butter and lard, low-fat fish, low-fat meat for sandwiches, and sauces. These food groups are traditionally eaten at lunchtime and in the evening in Denmark resulting in the label ‘Traditional’ for this factor. The ‘Modern’ factor was characterised by high loadings on vegetables, fruit, mixed vegetable dishes, vegetable oil and vinegar dressing, poultry, and pasta, rice and wheat kernels. These food groups are normally included in a modern and recommended diet, consequently the factor was labelled ‘Modern’. Some differences were observed between loadings of food groups on factors for women and men given the same label as factors of the entire sub-sample 1. Small differences were observed between women and men (Table 1). Red meat had a loading of 0·38 on the ‘Traditional’ factor for women, but a loading of 0·42 (high) on the ‘Modern’ factor for men. Low-fat meat for sandwiches did not load high on any of the factors for women, but had a loading of 0·42 on the ‘Traditional’ factor for men. Poultry, and pasta, rice and wheat kernels had loadings above 0·40 on the ‘Modern’ factor for men, but not for women. Thus, the ‘Modern’ factor was characterised by more variation in meat intake for men than for women. The total variance explained by the factors in sub-sample 1 was 17·1 % (15·4 % for women, 17·0 % for men).
From PCA 2 on sub-sample 1 we also identified two factors (a ‘Traditional’ and a ‘Modern’ factor) with very similar factor loadings to those identified from PCA 1 (difference in loadings < 0·07). In sub-sample 2 (PCA 3) the same number of meaningful factors was identified also. The greatest difference observed between the factors in sub-sample 1 (PCA 1) and sub-sample 2 (PCA 3) regarded low-fat fish and margarine. These food groups had loadings of 0·44 and 0·28 on the ‘Traditional’ factor in sub-sample 1, but loadings of 0·17 and 0·42, respectively, on the ‘Traditional’ factor in sub-sample 2. Furthermore, low-fat fish had a loading of 0·40 on the ‘Modern’ factor in sub-sample 2. Apart from these differences loadings between food groups significantly contributing to the patterns differed < 0·15.
Reproducibility of dietary patterns
The second aim of our study was to compare results from PCA 1 with those from a CFA in sub-sample 1. The loadings observed in the CFA were very similar to those observed in PCA 1 (difference in loadings < 0·15). The CFA resulted in a root mean square error approximation value equal to 0·08 indicating a good fit.
Furthermore, we aimed to assess agreement between PCA 1 and PCA 2 in sub-sample 1 using a Bland Altman plot (Fig. 2(a)). No systematic bias, across the range of average factor scores of similar factors from PCA 1 and 2, was identified. The variation in the difference between factor scores of the ‘Traditional’ factors from PCA 1 and 2 corresponded to 39·9 % of the variation in the average of the factor scores from these analyses and for the ‘Modern’ factors this relative variation (RV) was 37·6 %.
Bland Altman plots. Difference v. average of factor scores from (a) PCA 1 and 2 in sub-sample 1, and from PCA 3 and 4 in sub-sample 2 for (b) all, (c) women, and (d) men. Empirical 2·5 and 97·5 % quantiles of the difference and average of the factor scores together with the mean of the difference are given in the plots. The relative variation (RV) is the variation of the difference of the factor scores relative to the variation of average of the factor scores (RV = 95 % CI of difference of factor scores divided by 95 % CI of average of factors scores).
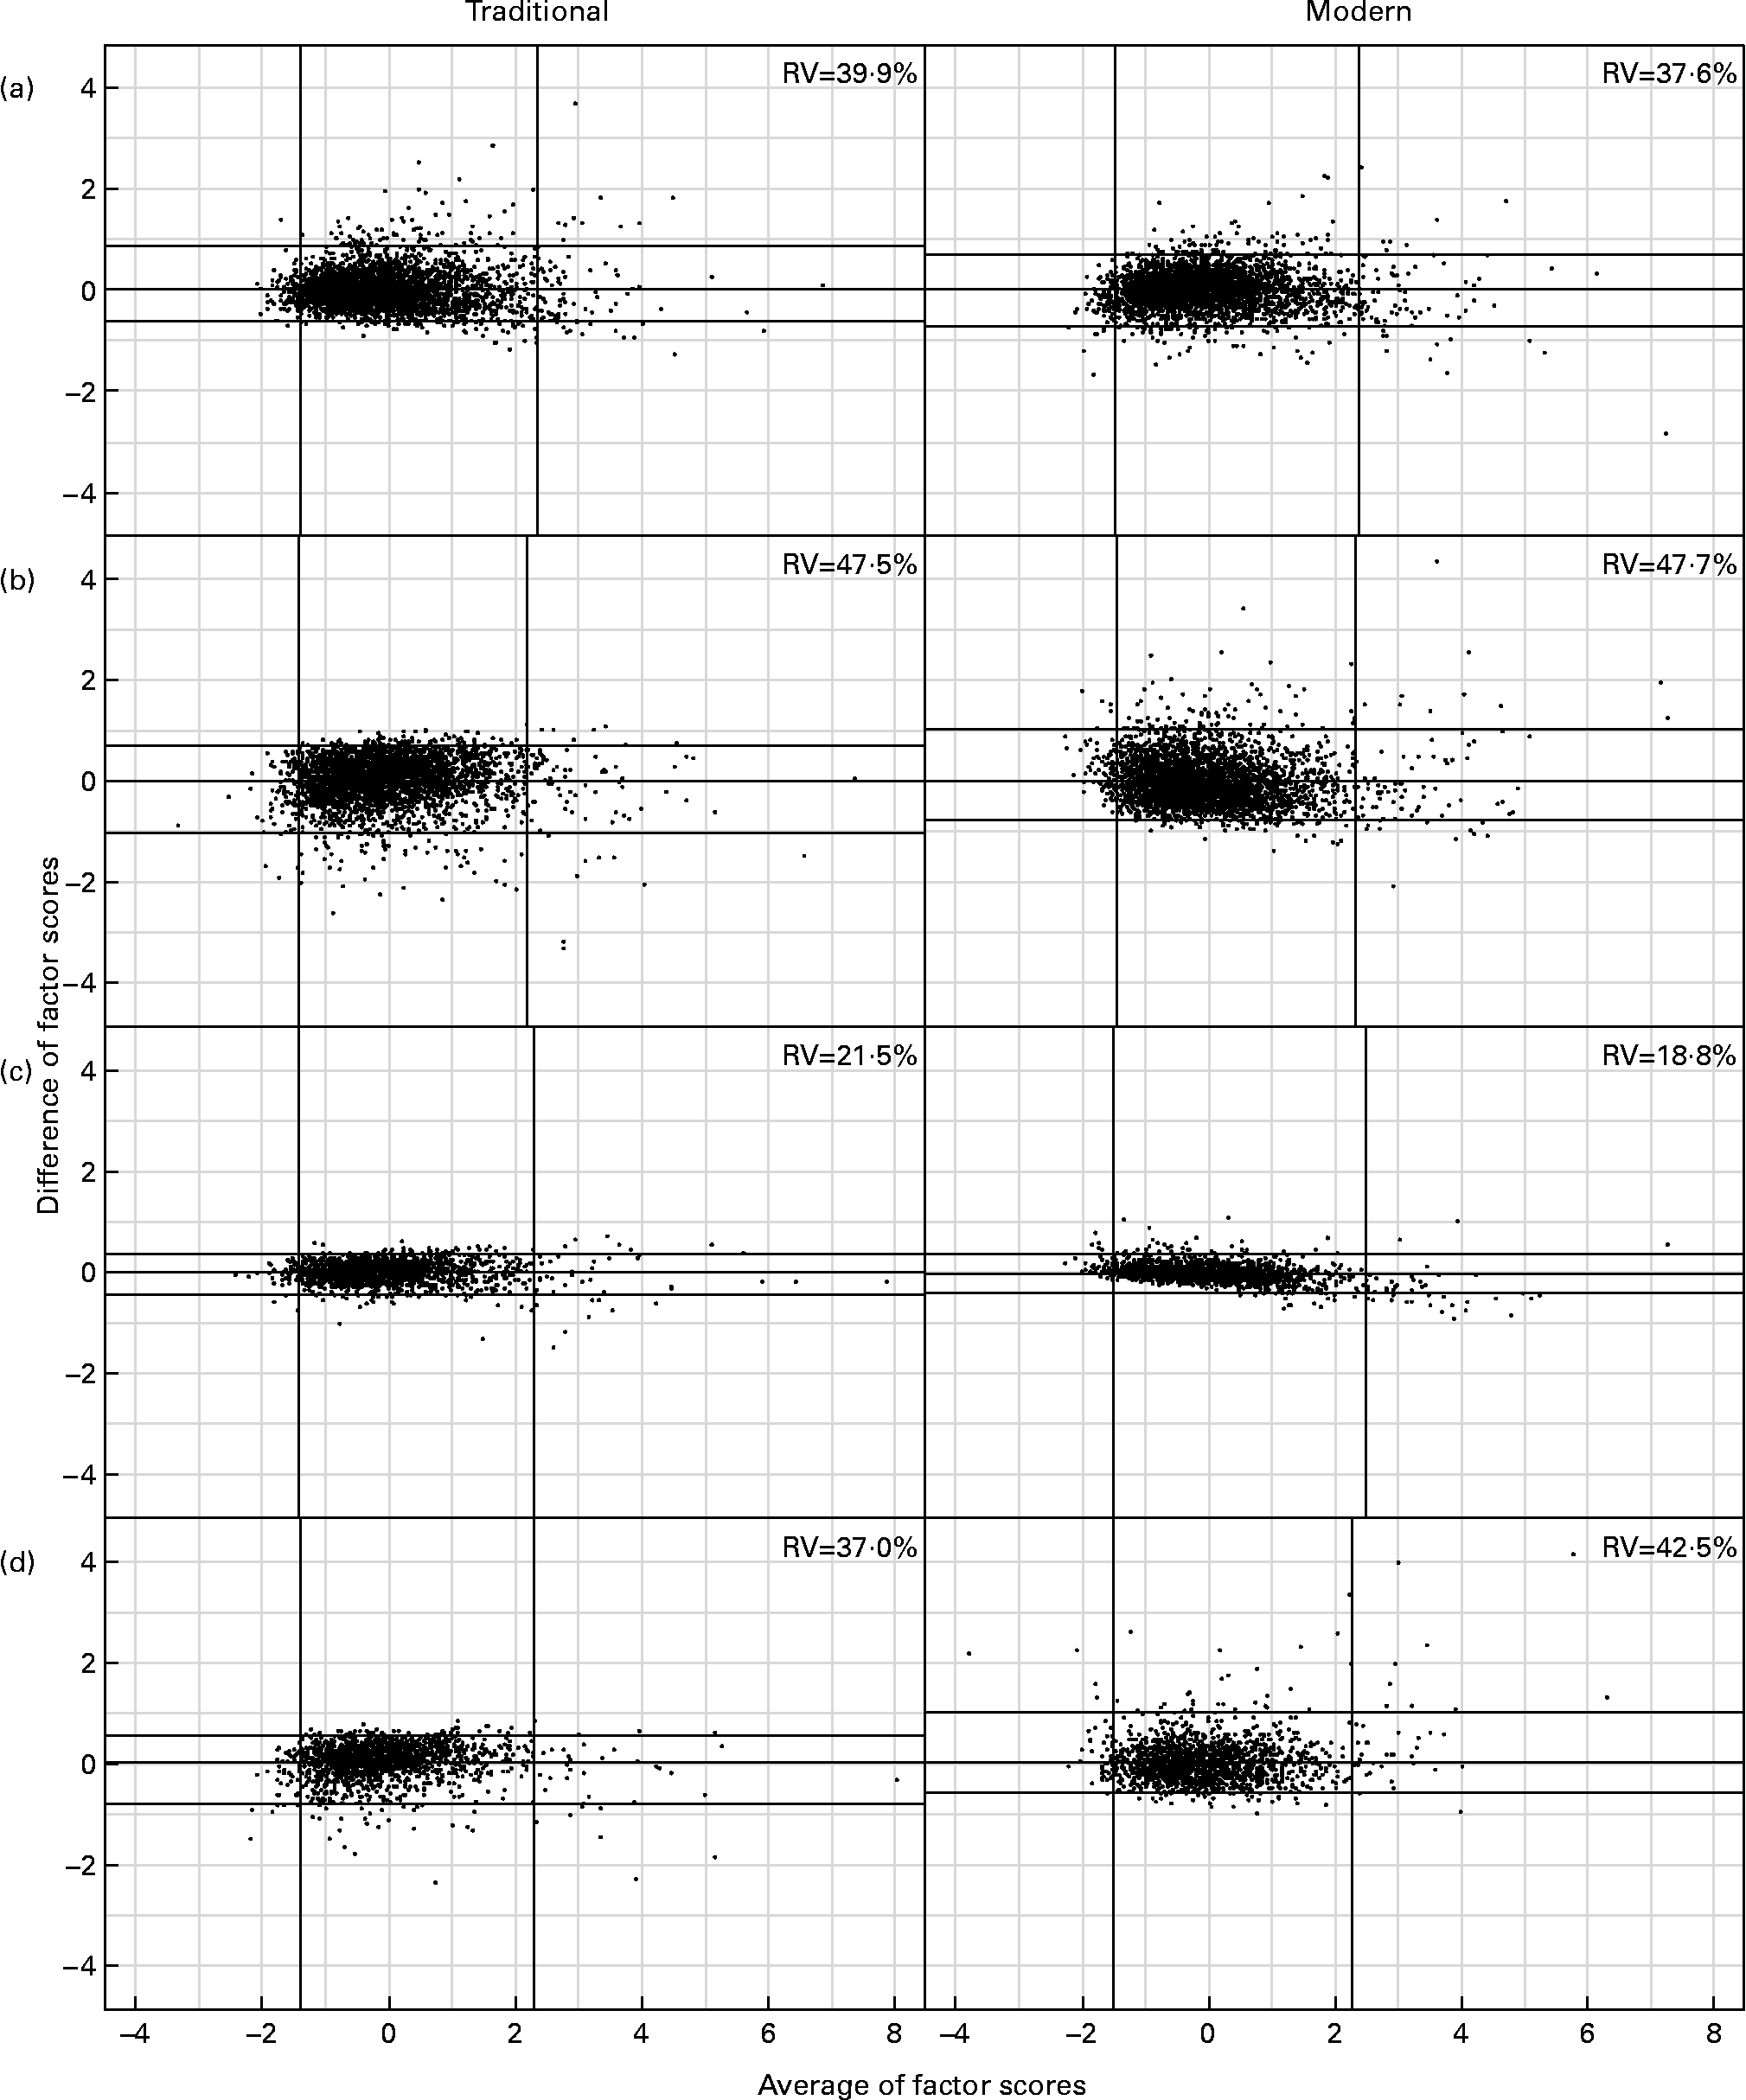
The reproducibility of the factors in the second sub-sample was then assessed. The variance in sub-sample 2 between the factors scores derived from factor loadings estimated in sub-sample 1 (PCA 4) and the factors scores derived within sub-sample 2 (PCA 3) are presented as Bland Altman plots in Fig. 2 (b, c and d). No systematic bias, across the range of average factor scores of similar factors from PCA 3 and 4, was identified. For all in sub-sample 2, the RV regarding the ‘Traditional’ factors from PCA 3 and 4 corresponded to 47·5 % and for the ‘Modern’ factors the RV was 47·7 %. For women in sub-sample 2, the RV corresponded to 21·5 and 18·8 % for the ‘Traditional’ and ‘Modern’ factor, respectively. For men in sub-sample 2, the RV corresponded to 37·0 and 42·5 %, respectively.
Finally, Pearson's correlation was calculated. The correlation between the factor scores from PCA 1 and 2 was 0·93 (P < 0·0001) for both the ‘Traditional’ and the ‘Modern’ factor. The correlations between the factor scores from PCA 3 and 4 were 0·89, 0·98 and 0·90 (P < 0·0001) for the ‘Traditional’ factor in all, women and men, respectively, and 0·89, 0·99, 0·93 (P < 0·0001) for the ‘Modern’ factor in all, women and men, respectively.
Discussion
Two major patterns were identified in the population: a ‘Traditional’ and a ‘Modern’ pattern. These patterns, with slight differences between food groups with high loadings, were also observed for each gender both in sub-sample 1 and 2.
Reproducibility of the patterns according to the CFA was acceptable. The RV and the correlations between factors from PCA 1 and 2, and PCA 3 and 4 on all individuals indicated that reproducibility of the patterns was moderate to high. The reproducibility of the patterns was better for women than for men, when analysed separately.
Identification of dietary patterns
Dietary patterns resulting from a posteriori analytical approaches across studies are complicated to compare because of differences in selected food groups, in assessment and analytical tools, and in decision criteria for the extracted factors. However, there seems to be some homogeneity of dietary patterns across populations. With the use of PCA, several studies have identified a ‘Western/Traditional’ pattern(Reference Osler, Helms-Andreasen, Heitmann, Høidrup, Gerdes, Jørgensen and Schroll2–Reference Montonen, Knekt, Härkänen, Järvinen, Heliovaara, Aromaa and Reunanen4, Reference Osler, Heitmann, Gerdes, Jørgensen and Schroll6, Reference Fung, Willett, Stampfer, Manson and Hu7, Reference Togo, Heitmann, Sørensen and Osler9, Reference Khani, Ye, Terry and Wolk10, Reference Newby, Weismayer, Akesson, Tucker and Wolk12, Reference Hu, Rimm, Stampfer, Ascherio, Spiegelman and Willett26) and a ‘Prudent/Healthy’ pattern(Reference Osler, Helms-Andreasen, Heitmann, Høidrup, Gerdes, Jørgensen and Schroll2–Reference Montonen, Knekt, Härkänen, Järvinen, Heliovaara, Aromaa and Reunanen4, Reference Osler, Heitmann, Gerdes, Jørgensen and Schroll6–Reference Khani, Ye, Terry and Wolk10, Reference Newby, Weismayer, Akesson, Tucker and Wolk12, Reference Hu, Rimm, Stampfer, Ascherio, Spiegelman and Willett26), but minor differences in dietary patterns between studies are always observed. In our study, whole-grain cereals and bread did not load high on the patterns identified from the PCA, whereas whole grains in most other studies load high on the ‘Prudent/Healthy’ pattern(Reference Osler, Helms-Andreasen, Heitmann, Høidrup, Gerdes, Jørgensen and Schroll2, Reference Hu, Rimm, Smith-Warner, Feskanich, Stampfer, Ascherio, Sampson and Willett3, Reference Osler, Heitmann, Gerdes, Jørgensen and Schroll6, Reference Fung, Willett, Stampfer, Manson and Hu7, Reference Togo, Heitmann, Sørensen and Osler9, Reference Newby, Weismayer, Akesson, Tucker and Wolk12, Reference Hu, Rimm, Stampfer, Ascherio, Spiegelman and Willett26). It may be that the food group including whole grains in our study was more diverse as it included rye bread, whole-grain bread, oats and muesli. The variation in the intake may therefore have been too small to be detectable in the PCA analyses. Another example is fish, which was part of the ‘Traditional’ pattern in sub-sample 1 analyses. When the analyses were conducted for men and women, separately, or on sub-sample 2 low-fat fish had a high loading on the ‘Modern’ pattern. These latter findings are more congruent to most other studies(Reference Hu, Rimm, Smith-Warner, Feskanich, Stampfer, Ascherio, Sampson and Willett3, Reference Fung, Willett, Stampfer, Manson and Hu7, Reference Togo, Heitmann, Sørensen and Osler9, Reference Khani, Ye, Terry and Wolk10, Reference Newby, Weismayer, Akesson, Tucker and Wolk12). Further, poultry contributed to the ‘Modern’ pattern in our study but not to the ‘Prudent/Green’ patterns in DAN-MONICA(Reference Osler, Helms-Andreasen, Heitmann, Høidrup, Gerdes, Jørgensen and Schroll2, Reference Togo, Heitmann, Sørensen and Osler9). A possible explanation is that poultry was not a separate food group in DAN-MONICA, but was included in a larger meat group with both red and white meat. Difference in the grouping of poultry may simply be a result of the time difference between the studies (7–14 years between DAN-MONICA and Inter99). Poultry has only recently achieved status as healthy and modern meat to eat compared to red meat. Comparison with the Danish DAN-MONICA studies was obvious because differences caused by country-specific differences in dietary habits were eliminated. Altogether, our results are similar because we, like Osler and co-workers(Reference Osler, Helms-Andreasen, Heitmann, Høidrup, Gerdes, Jørgensen and Schroll2), identified two dietary patterns of similar food and nutrient composition. Similar to the findings of Togo and colleagues(Reference Togo, Heitmann, Sørensen and Osler9), we also identified small differences between the patterns for men and women, which agree with our hypothesis. That patterns might vary slightly between sexes has been observed also in other studies(Reference Schulze, Hoffmann, Kroke and Boeing27). We labelled the dietary patterns of the entire sub-sample 1 and dietary patterns of women and men the same because most food groups contributing to the patterns for each gender were the same as those contributing to the patterns in the gender-combined sample.
The proportion of variance explained by the factors was between 15·4 and 17·1 % in this study. Other studies that apply PCA to dietary data and identify two patterns usually find that 17–25 % of total variance is explained(Reference Osler, Helms-Andreasen, Heitmann, Høidrup, Gerdes, Jørgensen and Schroll2, Reference Hu, Rimm, Smith-Warner, Feskanich, Stampfer, Ascherio, Sampson and Willett3, Reference Osler, Heitmann, Gerdes, Jørgensen and Schroll6, Reference Bamia, Orfanos and Ferrari8, Reference Togo, Heitmann, Sørensen and Osler9, Reference Hu, Rimm, Stampfer, Ascherio, Spiegelman and Willett26). Hence, variance explained by factors in our study was relatively low. Findings from this and other studies(Reference Osler, Helms-Andreasen, Heitmann, Høidrup, Gerdes, Jørgensen and Schroll2, Reference Hu, Rimm, Smith-Warner, Feskanich, Stampfer, Ascherio, Sampson and Willett3, Reference Osler, Heitmann, Gerdes, Jørgensen and Schroll6, Reference Bamia, Orfanos and Ferrari8, Reference Togo, Heitmann, Sørensen and Osler9, Reference Hu, Rimm, Stampfer, Ascherio, Spiegelman and Willett26) indicate that the number of food groups entering PCA affects the total variance explained by the factors. The larger the number of food groups entering the PCA, the lower is the proportion of total variance explained by the factors. Compared to studies where nearly 25 % of the variance was explained(Reference Bamia, Orfanos and Ferrari8, Reference Togo, Heitmann, Sørensen and Osler9) we included twelve to thirteen food groups more. Further, the lower the number of factors retained before rotation and score calculation or low variation in the diet may add to greater variation explained by the factors in the current studies.
In the identification of the dietary patterns we sought to use statistical methods as comparable as possible to methods used in other studies identifying dietary patterns. Furthermore, the number and/or nutrient composition of food groups entering the PCA was to a large extent similar to those observed in other studies(Reference Hu, Rimm, Smith-Warner, Feskanich, Stampfer, Ascherio, Sampson and Willett3, Reference Osler, Heitmann, Gerdes, Jørgensen and Schroll6, Reference Togo, Heitmann, Sørensen and Osler9, Reference Schulze, Hoffmann, Kroke and Boeing27, Reference Newby, Muller, Hallfrisch, Qiao, Andres and Tucker28), which may make comparison of the final number and character of the factors with other studies more straightforward and reliable.
If the diet in itself is a potential risk factor for different diseases, then the dietary patterns identified will be more likely to include the risk factor than single nutrients or foods, as the dietary patterns explain more variation. However, this does not rule out the possibility that single nutrients or foods may be of great importance for disease development. But dietary pattern analysis is relevant when analysing the overall effect of the diet in population-based studies. The dietary patterns identified in this study enable future analyses on the effect of overall diet in relation to disease.
Reproducibility of dietary patterns
CFA was used to examine the robustness and goodness of fit of the factor structures derived from the PCA and our understanding of the Danish nutritional behaviour (e.g. that rye bread is traditionally eaten at lunchtime in Denmark (S. Fagt, personal communication)). CFA is an intuitively appealing method because it can be based in theory and also reduces some of the subjectivity involved in explorative procedures(Reference Bollen29). As in other studies using the same approach(Reference Togo, Heitmann, Sørensen and Osler9, Reference Maskarinec, Novotny and Tasaki11) we demonstrated according to the root mean square error approximation a reasonable value ( < 0·10) of goodness of fit. Unfortunately, CFA cannot confirm that this is the best fit from the infinity of possible models that might have been tried(Reference Kline30) and it cannot test the degree of model agreement. Consequently, the Bland Altman plots conducted in this study were used as an alternative and new method within assessment of reproducibility of identified dietary patterns. Bland Altman plots have to our knowledge not previously been used to assess the reproducibility of dietary patterns. Thus, we also estimated correlations as most studies assessing reproducibility of dietary patterns have used this method. We want to note, though, that the correlations measure the relation between two variables, not the agreement between them(Reference Bland and Altman25). In principle, we do not favour this method in a setting comparing two methods.
We observed a high correlation between similar factors from PCA 1 and 2 (r 0·93), but when the reproducibility was assessed by Bland Altman plots the result was less impressive (RV = 37–40 %). Thus, data which seem to be in relatively poor agreement can produce relatively high correlations(Reference Bland and Altman25). An explanation for some of the relatively large variation between factors from PCA 1 and 2 may be that the number of food groups was greatly reduced in PCA 2, which affects estimates of factor loadings and hence factor scores. Others(Reference Togo, Heitmann, Sørensen and Osler9, Reference Newby, Weismayer, Akesson, Tucker and Wolk12) using Pearson's correlation between factor scores on similar factors have concluded that no noteworthy differences in results from the explorative compared to the confirmative analyses were observed. The results from the Bland Altman plots blur the picture of our results because intuitively we do not find a RV of 37–40 % reasonable. However, this degree of variation may be reasonable within nutritional epidemiology. We suggest that a variation of the size found in this study could also be identified by Togo et al.(Reference Togo, Heitmann, Sørensen and Osler9) and other studies examining dietary patterns. In summary, despite uncertainty regarding the Bland Altman plots, we find it reasonable to conclude that the two dietary patterns identified in sub-sample 1 were reproducible.
Next, we determined whether results from another sub-sample (2) conformed to what was expected from the findings in sub-sample 1. When data from both genders were analysed together the reproducibility assessed by Bland Altman plots was relatively poor (RV = 47 %); possibly affected by sample size. Hence, we assume that the RV would have been lower if the sample had been larger. For women, the variation in the Bland Altman plot for each factor was acceptable (RV = 18–22 %). For men, the variation in the plots was larger than for women (RV = 37–43 %). As observed in other studies(Reference Togo, Heitmann, Sørensen and Osler9, Reference Tseng, Breslow, DeVellis and Ziegler14) we found a high correlation between similar factors identified in the two different sub-samples (all, r 0·89; women, r ≥ 0·98; men, r ≥ 0·90). We and others(Reference Togo, Heitmann, Sørensen and Osler9) have further observed that the patterns identified between the two sub-samples were more homogeneous for women than men. Overall, our data indicate that the factors identified for the men were less reproducible. This finding may reflect that the dietary patterns are less structured between men than women. Women are generally more conscious about their dietary intake than men, which may generate less random variation.
General strengths and limitations of the study
Missing data or no intake with respect to a given food group for a great part of the population may be of concern working with PCA(Reference Loehlin23). Missing data on the food groups was hence coded as an intake of 0 g/d. Furthermore, intake of each food group included in the PCA should exceed 0 g/d for >50 % of the population. Food groups unfulfilling this criterion were: mix of butter, margarine and oil, miscellaneous foods and tea. In- or exclusion of these food groups did not change the character of the final factors retained significantly (data not shown). Consequently, the food groups were included in the final analysis because exclusion would give less information.
We did not test whether food groups adjusted for energy derived different factors than food groups without adjustment. However, a previous study(Reference Balder, Virtanen and Brants31) has found that energy-adjusted food groups did not alter the patterns.
An important strength of this study was that we assessed the reproducibility of identified dietary patterns using a supplementary method: the Bland Altman plot. We suggest that Bland Altman plots are used in future studies assessing the reproducibility of identified dietary patterns because it questions findings from previously used methods.
Conclusion
Our study has described a ‘Traditional’ and ‘Modern’ pattern of Danes aged 30–60 years living in Copenhagen County. These patterns were in many ways similar to major patterns identified in other studies. Replication of the patterns within the same sub-sample was acceptable. Moreover, the same factor pattern was identified in two different sub-samples and the reproducibility of the patterns between the sub-samples was acceptable but better for women than for men. We introduced Bland Altman plots as an alternative method to assess the reproducibility of the dietary patterns identified and found that it questions results from previously used methods. We conclude that the identified patterns were robust as markers of food intake patterns on group level.
Acknowledgements
This study was supported by the Danish Medical Research Council, the Danish Centre for Evaluation and Health Technology Assessment, Novo Nordisk A/S, Copenhagen County, the Danish Heart Foundation, the Danish Diabetes Association, the Danish Pharmaceutical Association, the Augustinus Foundation, the Ib Henriksen Foundation, the Becket Foundation and the Danish Research Counselling System.
The authors thank all the participants who took part in the survey and the staff for their serious efforts that made this study possible.
K. B. J, T. J. and C. G. were responsible for the study design, data collection and obtaining funding. C. L. and B. C. were responsible for data analysis. C. L. was responsible for drafting the manuscript and interpretation of the results. C. G., I. T. and U. T. provided advice and consultation. All authors edited and reviewed the manuscript. The authors had no conflicts of interest.
Food groups based on questions from FFQ, used in principal component analyses

Characteristics of the population

* BMI was calculated from measured weight and height. Information on physical activity, smoking and education was obtained from a self-administered general questionnaire. Due to missing values for BMI (n 2), physical activity (n 144), smoking (n 53), and educational level (n 489) the numbers of participants vary in the Table.
Dietary intake for the entire population(Medians and interquartile ranges (IQR))



