INTRODUCTION
Ardbear Salt Lake (53°28′N 10°00′W) is a shallow, almost completely enclosed tidal body of brackish water located south of Clifden town, County Galway. Periodically the Salt Lake experiences hypoxic and anoxic events that lead to the dramatic collapse of the ecosystem. Low dissolved oxygen levels affect benthic communities to an ever-increasing degree world-wide. Over 40 marine areas have been identified as being either periodically, seasonally or permanently oxygen depleted (Diaz & Rosenberg, Reference Diaz, Rosenberg, Ansell, Gibson and Barnes1995). The topography of these areas varies from continental slopes to enclosed fjordic and estuarine systems. Such events may be natural, and recorded over time in the geological record; however, eutrophication has increasingly become the main cause of low oxygen concentrations near urban shorelines (Officer et al., Reference Officer, Biggs, Traft, Cronin and Tyler1984; Stachowitsch, Reference Stachowitsch, Tyson and Pearson1991). Many factors, to varying degrees, have been deduced to cause hypoxia. For example, the development of hypoxia in a stratified system is dependant on oxygen consumption below the pycnocline and the strength of circulation of currents serving to re-oxygenate bottom waters (Rabolais et AL., Reference Rabolais, Turner and Wiseman Jar1991). The strength of phytoplankton blooms and subsequent decay of falling organic matter has been directly associated with the development of hypoxia in a number of areas, e.g. the northern Adriatic Sea (Justic, Reference Justic, Tyson and Pearson1991).
Whereas the occurrences of low dissolved oxygen events are well-documented for large estuaries and coastal areas of commercial importance, such as Chesapeake Bay and the Baltic Sea, this is not the case with Ardbear Salt Lake. However, the Salt Lake is important in ecological terms as it is one of only two locations in Ireland where reefs of a serpulid polychaete, Serpula vermicularis Linnaeus, are to be found (the second site being nearby Killary Harbour).
Bosence (Reference Bosence1973) mentioned the Salt Lake in relation to the presence of the serpulid reefs. In 1979 he returned to Ardbear and made a more extensive investigation of the lake ecosystem. To the authors' knowledge, this is the first reference in the literature to the presence of depleted oxygen levels at Ardbear. Mention of the Salt Lake is also made by Minchin (Reference Minchin1987) in reference to the reefs, although that paper mainly discusses the discovery of further living Serpula reefs at Killary Harbour. Reef status was also considered by ten Hove & van den Hurk (Reference Hove and Van Den Hurk1993) although this was primarily a review paper and no new work was instigated despite a reported decline in the serpulid population. The last major investigation at the lake was part of the work focus of a doctoral project by Leahy (Reference Leahy1991). She also dealt with the biology of S. vermicularis L. although some investigations into the hydrographic conditions at the lake were also carried out.
The aim of the present study was to try and establish the basis for the periodic hypoxic events at Ardbear, which lead to the collapse of the ecosystem at large, by investigating both the water column and the hard/soft seafloor. It was also hoped that should such an ecosystem crash occur during the course of the present investigation, the event would provide an opportunity to detail the response and recovery of the benthic community. An attempt was also made to model the Salt Lake ecosystem using data from the present study and those deriving from previous studies mostly limited to consideration of the work done by Leahy (Reference Leahy1991). The use of meteorological data in the production of a predictive regression model obviated the need to physically sample the lake to determine its health status.
The results presented in the present paper are based on field studies performed over a period of two years between November 1997 and November 1999. The field programme consisted of sampling hydrographic stations positioned along the salinity gradient from the eastern fresh-water region to the western seaward end of the lake. In the northern Adriatic Sea, the presence of reefs of the suspension-feeding serpulid Ficopomatus enigmaticus Fauvel are considered a stabilizing factor in an area which is oxygen-stressed, due to their ability to filter large amounts of particulate matter from the water column (Stachowitsch, Reference Stachowitsch, Tyson and Pearson1991). Harding (Reference Harding1994) also considered the filtering abilities of F. enigmaticus to be largely responsible for the maintenance of good water quality in a coastal, estuarine lake. Serpula vermicularis is also considered by the author to be the key benthic faunal component at Ardbear Salt Lake.
MATERIALS AND METHODS
Hydrographic survey
Between December 1997 and November 1999, near-monthly hydrographic samples were taken at four stations across a gradient from the head of the lake to the seaward side. Sampling locations were established using a Furuno GPS Navigation System. All hydrographic samples were collected from an inflatable boat using a peristaltic pump system. On each sampling date, duplicate 250 cm3 oxygen bottles and 200 cm3 salinity bottles were collected using normal procedures. Oxygen samples were analysed for dissolved oxygen content (DO mg/l) using Winkler titration and a bench salinometer was used to measure sample salinity (S ppt). A 2.5 dm3 acid-rinsed polypropylene container was filled to capacity for each station and at the different depths sampled. On return to the laboratory, the samples were filtered with a vacuum pump for the following parameters: particulate organic carbon (POC mgC/m3), suspended particulate matter (SPM g/l), chlorophyll-a (Chla μg/ml) and the nutrients nitrate (NO2 mg/l), nitrite (NO3 mg/l), ammonium (NH4 mg/l), silicate (mg/l) and phosphate (PO4 mg/l). In addition to the routine analysis for chlorophyll, qualitative samples in the general area of Station I were collected on ten dates between 17 September 1998 and 16 August 1999. For this purpose, a simple collared plankton net was towed behind the boat for approximately 10 minutes. Net mesh was 36 µm. The contents of the net were immediately fixed in 70% formalin. Enumeration and identification of plankton was according to Dodge & Priddle (Reference Dodge and Priddle1987) using a Nikon microscope. In conjunction with the physical sampling at the lake, the four hydrographic stations and a further 8 stations (X1–X8) were investigated to varying degrees using a Grant Yellow-Springs International (YSI) 3800 Water Quality System. This probe was used to remotely measure the vertical gradients of four environmental parameters: depth (m), temperature (°C), salinity (ppt) and dissolved oxygen (mg/l). Due to problems encountered with the instrument there are some gaps in the data. A standard temperature–salinity probe was used on the dates when the YSI was malfunctioning.
Bathymetry and sediment surveys
On 30 April 1999, the bottom topography at Ardbear was surveyed. This necessitated the use of a semi-rigid inflatable (RIB), an echo sounder, and a digitized Furuno GPS Model GP-30/35. The survey involved crossing the lake along a series of latitudinal and longitudinal transects of known co-ordinates. A grab survey of the lake sediments, for organic carbon composition and sediment granulometry, was carried out on 20 May 1999. Grab samples were taken from a suite of 41 stations located at regular intervals across the lake. A 1 m2 van Veen grab was deployed from a frame attached to the stern of the RIB. Duplicate plastic containers were filled with material returned at each station. On return to the laboratory, all samples were placed in a freezer at −18°C prior to processing. Sediment cores were taken by a SCUBA diver from various locations on the lake floor to determine the depth of the oxygenated layer. Granulometric analysis was attempted by laser diffraction particle analysis using a Malvern Mastersizer X. Organic carbon composition was determined both by a furnace ignition technique (Rowden et al., Reference Rowden, Jago and Jones1998) and a modification of the Schollenberger chromic acid oxidation technique (Walkley & Black, Reference Walkley and Black1934).
Meteorological data
Ambient weather data for the duration of this project and also for the time of the last study at the lake, by Leahy (Reference Leahy1991), were obtained by the Irish Meteorological Service (Government Department). Wind speed (knots) and direction (degrees from North), air dry bulb temperature (°C), relative humidity (%), insolation (hours) and rainfall (mm) data were supplied from the station at Belmullet (54°13′N 10°00′W), grid reference F691329 at 11 m above mean sea level. Rainfall readings were also available from a station at Clifden, grid reference L657496 at 18 m above mean sea level.
Lake modelling and consideration of previous studies
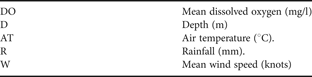
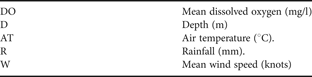
The complete data set collected during the study period was examined, with particular attention given to Station I, and a conceptual model of seasonal variation at the lake was generated. This schematic description of the lake included analysis of physical, chemical, biological and meteorological data. A more detailed treatment of the seasonal cycle at the Salt Lake involved the generation of regression models using Minitab Release 10.5 Xtra Power for the Power Macintosh. The main focus of these models is the formation on seasonal oxygen depletion at the five depths sampled at Station I, since this is the station which is certainly affected by oxygen depletion to some extent each season due to its depth. Regression Model 1 (RM1) is a descriptive model of seasonal variation at Station I during the first year of sampling (day 8–day 310). This model relates mean dissolved oxygen levels at the lake to meteorological data supplied from the nearest weather station at Belmullet, County Mayo. Since all data were normally distributed transformation of the data was unnecessary. Mean wind speed (knots), rainfall (mm), and air temperature (°C) data, for 3, 4, 5, 6, and 7 days prior to and including each sampling date were included in the database. All parameters used in the model manipulations are listed in Table 1. Each of the parameters was increased by a factor of 2 and 3. Stepwise linear regression of the database identified the parameters that influenced the occurrence of low dissolved oxygen, at a confidence interval of 0.95. These factors were then regressed linearly to provide an equation that described the dynamics of the water column at Station I. Oxygen values, calculated using the resulting equation, were then correlated with the observed values for day 8–day 310. Spearman's rank-correlation coefficients for each parameter were then determined. This nonparametric correlation gives a statistic that ranges from −1 through 0 to +1, indicating ‘perfect negative correlation’, ‘no correlation’ and ‘perfect positive correlation’ (Dytham, Reference Dytham1999). To aid interpretation of the model and elucidation of its accuracy, both observed and descriptive values for dissolved oxygen were plotted against Julian time at each depth sampled.
Parameters used in the development of the regression equation for RM1 and RM2.
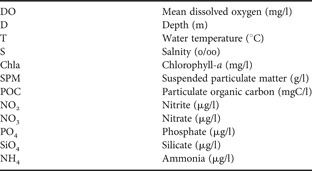
Each of the subsequent models was produced in the same manner as described for RM1. Regression Model 2 (RM2) investigated the predictive qualities of the RM1. In this case, the data collected for the second year of sampling at Ardbear (day 350–day 702) were substituted in the RM1 equation. Correlation coefficients and graphical representations of the model were produced as for RM1. Regression Models 3 and 4 (RM3 & RM4) attempted to elucidate the relationship between oxygen depletion at the Salt Lake and water quality. This model was based on 10 components which are listed in Table 2. Similar to RM1 and RM2, RM3 describes the variation in the selected parameters between day 8 and day 310, while RM4 predicts the cycle between day 350 and day 702. Regression Model 5 (RM5) further investigates the predictive power of the equation from RM1 and this database incorporates meteorological data from 1986–1987, the time of the last study at the Salt Lake, during which time the last known ecosystem crash was observed.
Parameters used in the development of the regression equation for RM3.

RESULTS
Hydrographic survey
A maximum dissolved oxygen level of 12.91 mg/l was recorded at Station B on 12 March 1998. Hypoxia was registered at Station I, at a depth of 30 m, from 3 July 1998, until 30 March 1999. The hypoxia was observed to rise off the bottom and radiate outwards horizontally over the bottom as the summer of 1998 progressed, as evidenced in the YSI profiles at Stations X6 and X7. Hypoxia reached a depth of 15 m from the surface on 22 September 1998. Surface dissolved oxygen was higher than bottom dissolved water at all times during the present study except in May of both years, when bottom waters were slightly more oxygenated. Surface dissolved oxygen levels were also generally seen to be higher at Station B, at the head of the lake, than those closer to the seaward end.
At Station I, bottom salinities were usually above 300/00, with one exception on 14 July 1999. Higher salinities were always associated with depleted levels of dissolved oxygen at the lake. Strong salinity gradients occurred with depth at Station I in July and August of 1998 and were associated with the occurrence of hypoxia. Surface salinities across the lake ranged from 0.50/00 at Station B on 16 February 1998 to 34.7580/00 at Station I 15 m on 24 August 1998. Surface salinities at the near-shore stations were much more variable than at Station I which is located closer to the centre of the lake, reflecting the influence of freshwater input from the shore.
Temperature trends at Stations B, J, F and I over the second year of sampling at the Salt Lake were generally higher than those recorded for 1998. Surface and bottom temperatures follow a similar pattern across the lake and, in the present study, ranged from 6.6°C on 14 January 1998 (F surface) to 18.10°C on 4 August 1998 (I surface) and 24 August 1998 (F surface), and from 7.9°C 16 February (I 30 m) to 17.40°C on 14 July 1999 (F 7 m), respectively. From the vertical profiles provided by the YSI probe, bottom temperatures were seen to increase uniformly with surface temperatures during the spring of both years. However, as the summer progressed, temperature at depth tended to lag behind the surface water temperatures and a thermocline was established. This stratification of the water column was seen to break down with increasing wind influence during winter months.
A maximum POC level of 2707.0 mgC/m3 was recorded, at the bottom, at Station F on 10 December 1997 (day 8), and the minimum value recorded, 12.10 mgC/m3, was observed at Station B, surface, on 30 June 1999 (day 575). Bottom levels of POC were generally greater than surface levels. POC values recorded at the head of the lake, Station B, were also characteristically lower than those recorded at the seaward end, Station J.
Surface SPM ranged from 0.001 g/l on 12 March 1998 and 18 February 1999 at Station B, and 21 July 1998 (B and F, surface) to 0.329 g/l on 14 July 1999. Peak SPM concentrations throughout the water column at the lake were observed to be coincidental with periods of high wind and rainfall. Temporal trends of SPM concentration were similar at all depths and stations through much of the study period. During winter months, surface SPM levels were higher than bottom measurements. Inversion of surface and bottom concentrations could be seen with the onset of the seasonal thermal stratification of the water column. As the thermocline develops the surface layer became diminished in SPM while, below 5 m, SPM concentration increased. Resuspension of SPM occurs only with breakdown of the thermocline, either by physical wind-mixing or a drop in temperature.
Chlorophyll-a concentrations indicating the annual cycle of phytoplankton biomass accumulation and degeneration, like SPM varied both vertically and temporally. During the summer of 1998, a chlorophyll maximum was observed along the thermocline. Plankton production appears to increase in the seaward direction with Stations F and I registering highest levels of chlorophyll-a. Diatoms are generally more numerous in the phytoplankton than are dinoflagellates. A large peak in March 1999 evidenced the spring diatom bloom with two further peaks indicated in July and August of the same year. Dinoflagellate numbers are low in the spring months but increase to maximum levels in autumn (8 October 1998). Zooplankton trends tend to mirror those of the phytoplankton although a slight lag is observed.
During the winter of 1997, levels of nitrate increased to the maximum observed during the study period. Maximum and minimum values of nitrate recorded at the lake were 2414 µg/l on 16 February 1998 at Station B and 0.22 µg/l on 24 August 1998 at Station I, surface. Surface nitrate levels fell as summer approached. However, at Stations I and F, near bottom levels were sufficient to support phytoplankton growth. By August 1998, nitrate concentrations became depleted in the bottom layer also. A slight peak in NO3 levels was observed through the water column in February 1999, probably in association with high rainfall and a homogenized water column. Nitrate levels were lower across the lake in 1999 than in the previous year, and were also seen to recover by August 1999.
Nitrite levels at Ardbear over the course of the investigation ranged from a minimum of 0.04 µg/l on 16 August 1999 at Station B, to a maximum of 45.36 µg/l on 18 February 1999 at Station I 30 m. Temporal changes over the lake were similar for each of the four hydrographic stations, with two peaks registered in July–August 1998 and in September 1999. Station I, 30 m, showed a slight deviation from this pattern with further peaks in May and July 1999.
Values of SiO4 in the water column peak during the winter months and become rapidly depleted in spring. Levels of SiO4 were relatively high in the summer of 1998, but dropped to a constant low level during the summer of 1999 until dramatically increasing on 14 July. As with SPM and chlorophyll-a measurements, surface and bottom SiO4 concentrations show an inverse relationship between winter and summer months. During the winter surface SiO4 is greater than bottom levels and this situation is reversed in the summer. High SiO4 levels in bottom waters at Station I are associated with high levels of SPM and hypoxia. SiO4 ranged from a minimum of 0.5 µg/l on 6 May 1999 at Station I surface, to 1470.79 µg/l on 22 September 1998 at Station I 30 m. SiO4 distributions clearly reflect the amount of freshwater supply and primary production in the Salt Lake.
A maximum value of 550.26 µg/l for dissolved orthophosphate was recorded on 21 July 1998, at Station I, 30 m. PO4 levels registered a minimum of 0.34 µg/l on 16 August 1999, at Station B. Two main peaks in PO4 concentration were observed at Stations B and F on 21 July 1998, and 14 July 1999. Station I showed a slightly different pattern. Each depth at this station also recorded a peak PO4 concentration on 21 July 1998. However, following this date, Station I registered 5 smaller peaks: on 22 September 1998 and on 16 February, 31 May, 7 July and 29 September 1999.
Levels of NH4 were high initially in winter 1997 and decreased until February 1998, from which time they remained at a constantly low level, until July, when a sharp increase was observed. Subsequently, the NH4 concentrations dropped to similarly low levels by 22 September 1998. Surface and bottom patterns were similar and mirrored the phytoplankton cycle. In 1999, three separate NH4 peaks were observed in the months of June, July and September but on a much smaller scale than during the previous summer. Surface values ranged from 2.11 µg/l on 22 June 1998 at Station F, to 1305.66 µg/l on 24 August 1998 at Station J. Minimum values at Station I, 30 m, ranged from 17.68 µg/l on 11 May 1998, to 6277.60 µg/l on 24 August 1998.
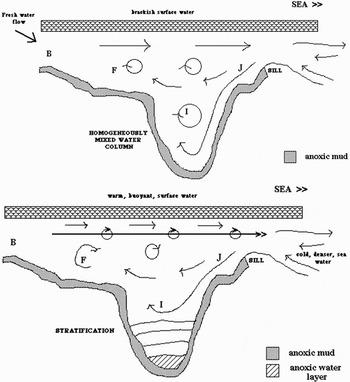
The Salt Lake has a seasonal tendency to assume one of two states (Figure 1). In winter months, there tends to be a uniform temperature–salinity depth profile. Air and water temperatures drop. Water movement is the result of wind turbulence and thermohaline circulation. Although sheltered, much of the energy for mixing at the lake is wind-generated and so varies seasonally. During winter, increased wind stress due to strong winds and storms produce a completely homogeneous water column. Strong tidal circulation is limited to the vicinity of Station J at the seaward end and simply involves the export and import of the top 1–2 m, i.e. the tidal range, and the cold, denser seawater sinks and mixes the water column further. Tidal forces across the rest of the lake appear to be negligible. Day length and light intensity are reduced, and as primary production in these latitudes is light limited, plankton growth shows an annual minimum at this time.
Schematic representation of the likely water circulation behaviour at Ardbear. During winter months (above) there is a freshwater flow and a uniform salinity–temperature depth profile. Stratification occurs during summer months (below).

The second state occurs during summer months and is characterized by a thermohaline density stratification of the water column, the extent and duration of which depends on the strength of the causative factors in any one year. In the spring, winds and storm frequency decrease. As solar radiation increases, the surface waters in the lake increase in temperature, become more buoyant and progressively inhibit vertical mixing of the water column. Once the thermocline is established, and only the surface layer is mixed by wind-driven turbulence, planktonic biomass increases. Phytoplankton growth is mainly influenced by light and nutrient availability and predation by zooplankton. Increased rainfall in spring has both advantageous and deleterious effects on the planktonic population. Osmotic stress due to salinity gradients in surface waters may flush populations out and runoff containing high loads of suspended particulates can create a turbid environment and thus limit light availability. However, high rainfall is also a major source of nutrient input, as is leaching from the surrounding rocks and this stimulates planktonic growth. The shallow surface mixed layer of warmer, less dense and fresher water sits on top of the colder, more saline water, and this coupled with greater insolation and longer day length as spring progresses, provide perfect conditions for population blooms.
Bathymetry and sediment surveys
As previously noted by Bosence (Reference Bosence, Larwood and Rosen1979) and Leahy (Reference Leahy1991), the study area in general is characterized by a predominantly muddy substrate. This mud has a high porosity and contains much peaty, fibrous material. Only 6 of the 41 stations sampled in the grab surveys during the course of the present investigation failed to yield any returns, and were recorded as being ‘clean’. In the tidal channel, close to the bridge, the bottom is composed of varying amounts of rock, gravel, pebbles and debris, such as mussel shells, crab carapaces, and dead serpulid reef fragments. Sublittoral rocky outcrops occur on the southern shore, in the vicinity of the steep slope towards Station I and also surrounding the island close to Station F. At 30 m, at Station I, the muddy bottom contains a high density of empty mussel shells, presumably discarded from the farm lines above. Debris from the serpulid reefs also comprises a fraction of the sediments where reef outcrops occur. The peaty nature of the mud sediments at Ardbear reflects the high supply of organic material to the lake. The oxygenated layer at all depths is very shallow, and the slightest disturbance to the sediment floor reveals the underlying black, anoxic layer. Sediment cores, taken on 10 July 1998 at 22 m in the vicinity of Station I, revealed an apparent redox potential discontinuity at just 0.5 cm.
There is a large discrepancy between results obtained by the two methods used to determine organic carbon levels and it is presumed that this emphasizes the inaccuracy of the combustion method. Consequently, only CAOVs are considered in the following description of sedimentary organic carbon across the bottom at Ardbear Salt Lake. Organic carbon values recorded from the 37 soft-bottomed stations range from 4.64 CAOV to 15.90 CAOV. These levels indicate that the substrates at Ardbear are rich in organic matter.
Meteorological data
Plots of the mean daily values recorded at Belmullet, County Mayo showed that the wind and rainfall regimes in the area of Ardbear follow similar patterns. The maximum daily wind speed recorded at Belmullet between December 1997 and November 1999, was 35.3 knots (3 January 1998), and the minimum value was 0.7 knots (2 December 1998). The mean air temperature ranged from 1.3°C (recorded on two occasions 28 January 1998 and 10 January 1999) to 18.9°C (21 September 1998). Rainfall varied from 0.0 mm (on many occasions during the sampling period) to 30.7 mm (20 October 1998). As Ardbear is a relatively sheltered lake, covering a small area, wind direction was not considered an important parameter for the purposes of this report and is therefore not included in the results.
Lake modelling and consideration of previous studies
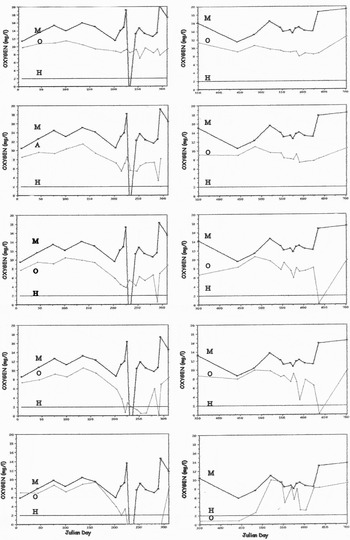
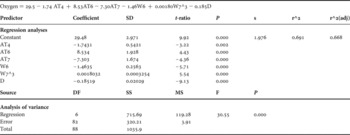
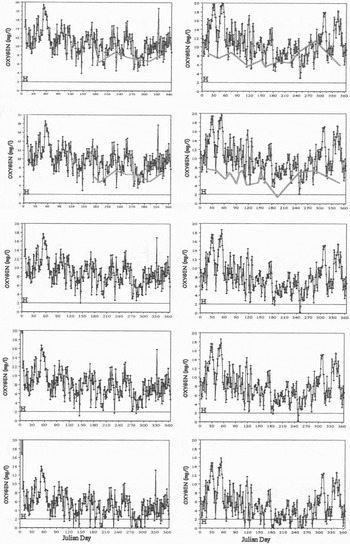
Table 3 gives the regression equation and results of regression analyses, along with results of analysis of variance on the regressions of the meteorological data and depth at Station I, between day 8 and day 310 of the study period. The oxygen values produced from this descriptive regression model are plotted against the observed oxygen values form the same time frame in Figure 2.
Results of regression analyses and analyses of variance on the regression of meteorological data and the predicted profiles of oxygen concentration with depth in the water column at Station I, Ardbear, based on data recorded between day 8 and day 310 of the study period.

Regression Model 1: results of regression analyses and analyses of variance on the regressions of meteorological data and the predicted profiles of oxygen concentration with depth in the water column at Station I, Ardbear, based on data recorded between day 8 and day 310 of the study period (AT4, AT6 and AT7 represent the average air temperature over 4, 6 and 7 days prior to and including the sampling date, respectively; W6 and W7^3 represent average wind speed over 6 days3 and 7 days3 prior to and including the sampling date respectively; and D is the depth at Station I between 0 m and 30 m).

Similarly descriptive and predictive plots for the analysis (Regression Models 3 and 4 respectively) were compared with the observed oxygen data over the two years of sampling at Ardbear and were seen to produce relatively good profiles of the oxygen situation at the Salt Lake. Regression Model 5 (RM5) further extends the equation from RM1, and describes the oxygen conditions at the Salt Lake in 1986 and 1987, the duration of the last documented ‘crash’ (Leahy, Reference Leahy1991). Figure 3 plots the continuous data set for 1986 and 1987 (day 1 = 1 January in both cases) alongside oxygen values record.
Predicted mean oxygen profiles for the years 1986 and 1987, the time of the previous work done by Leahy (Reference Leahy1991). The ‘crash’ occurred during August 1987 (day 213–day 243) and is clearly visible at all depths in these predictive graphs.

DISCUSSION
Deteriorating water quality in the marine environment is a growing concern worldwide. While it must be acknowledged that the occurrence of such regions in shallow coastal situations are increasing, and that this is linked to human activities, many marine areas are naturally hypoxic or anoxic (Rhoads et al., Reference Rhoads, McCall and Yingst1978; Rhoads & Germano, Reference Rhoads and Germano1986; Diaz & Rosenberg, Reference Chardy, Gros, Mercier and Monbel1995). Oxygen deficiency during thermal stratification of the lake water in the summer months is the predominant feature affecting the ecosystem at Ardbear. Currents over the entire area are negligible except for the tidal rapids close to Station J. This shallow area beneath the bridge acts as a sill and probably inhibits water exchange leading to weak currents at depth, stagnation and oxygen depletion. During summer months neap tides probably serve to enhance oxygen depletion. Tidal intrusion fronts are quite obvious under calm conditions at the Salt Lake. Signature lines of foam separating the water masses of different salinities extend from Station I and become diverged around the island at the centre. Pedersen (Reference Pedersen1993) demonstrated that the temporal and spatial variation in the buoyancy flux from the Baltic Sea into the Kattegat was the hydrodynamic controlling factor for phytoplankton production and hence for oxygen depletion. While this may also be a feature of the situation at Ardbear, on results of the regression analyses and models of the lake, salinity does not appear to be a major determinant in the development of hypoxia here.
The aim of cluster analysis is to identify ‘natural groupings’ of samples such that samples within a group are more similar to each other generally, than samples in other groups. Normal cluster analysis was performed during the analysis at hand based on similarity coefficients between the hydrographic sampling stations. Sampling station was chosen as entity and the parameters of oxygen (mg/l), temperature (°C), and salinity (0/00) as the attributes on which the similarity gradient was deduced. Four main groupings of the hydrographic stations are evident from the results of cluster analysis on the ten sampling stations by oxygen, temperature and salinity similarity matrices. Group 1 consists solely of Station B for each of the three parameters investigated by this technique. This is seen to reflect the high freshwater input at this station. Group 2 (Station F 0 m, Station I 0 m and Station J 0 m) and Group 3 (Stations F 7 m and Station I 5 m, 10 m and 15 m) had increased seawater influence and thus showed similar subdivisions for each of the three parameters analysed. An exception to this was Station I 15 m which, with respect to temperature, was more similar to the fourth group represented by Station I 30 m. From this dendrogram it would appear that the parameters of dissolved oxygen, temperature and salinity at the Salt Lake vary depending on depth from the surface and also on the degree of fresh/saline water influence.
There is a definite link between primary production, the flux of POM and after a short lag the development of oxygen deficient waters over the organic rich sediments. For example, at Station I, the area of Ardbear that experiences the most frequent and severe hypoxia, chlorophyll levels are higher at each depth than at other stations sampled and sedimentary carbon values are also high. Thus, it would appear that, apart from the direct input of POM from the hinterland, primary production and its resulting processes, rather than anoxia alone, regulate the progressive accumulation of carbon rich mud in the Salt Lake. A similar situation exists in the northern Adriatic Sea where the decay of organic matter produced by plankton blooms is directly associated with the development of hypoxia (Justic, Reference Justic, Tyson and Pearson1991). Riverine dissolved organic carbon is acknowledged to be a major source of carbon for the coastal marine environment (Moran et al., Reference Moran, Sheldon and Sheldon1999). At Ardbear, given the peaty nature of the shores surrounding the lake, the Derryvraun and Derryhorraun Rivers are more than likely large sources of plant material that also serves to increase the organic content of the area. Indeed, Station B in close proximity to the opening of the Derryhorraun River registered one of the highest organic carbon values over the study area. The mussel rafts close to Station I contribute to the oxygen depletion due to their filter feeding lifestyle and deposition and decomposition of faecal material to the lake bed, however, this fishery is a periodic feature. Therefore the mussels were not considered by the authors when developing statistical models describing oxygen depletion at the lake, as they believe hypoxia/anoxia to be an annual event. The effects of oxygen depletion in the lake on phytoplankton composition are unknown, although the ecological and economic significance may be substantial, especially in relation to the mussel lines at the lake.
While phytoplankton blooms are influenced by many factors, such as temperature, irradiance, and salinity, nutrient availability is by far the most important factor (Roelke et al., Reference Roelke, Eldridge and Cifuentes1999). In fresh water, estuarine and coastal environments, nitrogen and phosphorous are the nutrients most recognized to have the potential to limit phytoplankton growth. Silicon is also important for the growth of diatoms. Winter concentration of dissolved inorganic nitrogen and dissolved inorganic silicon are high. During each plankton cycle a certain amount of silicon is removed from the dissolved pool. With the formation of every diatom cell some silicon is irreversibly bound in the cell wall and on death of the cell is lost in a refractory pool. As is the case with freshwater lakes, this mechanism probably leads to the enrichment of silicon in detritus as noted for Lake Grevelingen (de Vries & Hopstaken, Reference De and Hopstaken1984). It is also evidenced in the fossil record for Chesapeake Bay (Cooper & Brush, Reference Cooper and Brush1993). Given the almost enclosed nature of Ardbear and the weak current regime over much of its spread it is probable that the silicon pool in the sediments there is substantial. The winter situation for nitrogen and silicon is reversed following the spring bloom and, in summer, the concentration of these chemical species is almost zero. Orthophosphate behaves in a different fashion. Several peaks are observed in orthophosphate levels across the lake and throughout the water column during the summers of 1998 and 1999. These peaks can be seen to lag slightly behind peaks of particulate organic carbon at the lake. Thus, it can be inferred that: (i) nitrogen and silicon, not phosphorous, are the limiting elements for primary production at Ardbear; and (ii) diagenetic release of orthophosphate was high at these times in response to the increasing pressure of organic enrichment. This is similar to the situation described for a salt water lake in the Netherlands, Lake Grevelingen (de Vries & Hopstaken, Reference De and Hopstaken1984).
Ammonium levels at Ardbear dropped steadily throughout the spring and early summer in both 1998 and 1999. The ammonium peak in both years was most likely due to the process of denitrification of nitrate in the sediments and subsequent release of ammonium into the water column. When oxygen availability decreases near the bottom, nitrification processes move upwards towards the aerobic part of the water column. This is what was happening during the summer of 1998 when the hypoxic layer was seen to move upwards and horizontally along the lake floor. Rysgaard et al. (Reference Rysgaard, Thastum, Dalsgaard, Christensen and Sloth1999) deduced that sedimentary ammonium adsorption capabilities decreased markedly with increasing salinities. In addition, Boynton & Kemp (Reference Boynton and Kemp1985) found that ammonium increased along a gradient of increasing salinity in Chesapeake Bay. This is also the case for the sediments at Ardbear.
The absence of large burrowing infauna from the sediments at Ardbear, as revealed by the grab surveys at the lake, has serious consequences for the potential occurrence of hypoxia in the future. Since the absence of such animals decreases the bioturbatory activity in the sediments the redox discontinuity layer throughout the entire area is very shallow. At all of the stations sampled during the present study, the black mud underlying the flocculent upper layer smelled strongly of hydrogen sulphide. Total organic content of this sediment is high. While not rich in fauna these sediments are rich in an assortment of biogenic debris such as empty polychaete tubes, fish pellets, empty mollusc and crab shells and much terrestrial vegetal remains. The almost complete absence of macrobenthos is a main feature of the lake sediments. However, they do have an important prokaryotic component in the form of bacterial mats composed of the sulphur oxidizing genera Beggiatoa (Leahy, Reference Leahy1991 and the present study). The presence of sulphur oxidizing bacteria indicate that the sediment surface and water interface over much of the lake bottom are likely to be close to anoxic for much of the year. Beggiatoa is restricted to the transition zone between oxic and anoxic environments where hydrogen sulphide and oxygen are continuously supplied along countergradients. Rosenberg & Diaz (Reference Rosenberg and Diaz1993) reported on a similarly poor sedimentary fauna from the Inner Stockholm Archipelago, where the predominant surface feature was bacterial mats of Beggiatoa. These authors concluded that if the rate of transportation of nitrate to nitrite by Beggiatoa was applicable to brackish water, as it already holds for fresh water, then the bacteria would significantly contribute to the removal of nitrate from the sediments. If this were the case it would also have serious implications for the enclosed and enriched system at Ardbear.
In shallow water lakes, a considerable amount of the particulate organic matter is decomposed on and in the bottom due to the rapid removal from the water column by sediments and grazing by suspension feeding bottom fauna (de Vries & Hopstaken, Reference De and Hopstaken1984). As a consequence of high aerobic respiration rates, marine sedimentary ecosystems often become anoxic. Under these conditions sulphate-reducing bacteria proliferate and in hypertrophic conditions sulphate respiration may even occur in the water column (Heijs et al., Reference Heijs, Jonkers, van Gemerden, Schaub and Stal1999). During the summer of 1998 bottom water collected from Station I registered the presence of hydrogen sulphide indicating that bacterial reduction of sulphate had moved from the sediment into the water column. Jørgensen (Reference Jørgensen1980) concluded that, in Limfjorden, a mechanism for the retention of hydrogen sulphide in the sediments is the rapid formation of iron sulphides when the surface sediments become reducing and hydrogen sulphide accumulates. Local residents of Limfjorden noticed a milky turbidity and unpleasant odour of the water during periods of anoxia. A white cloud was observed in the water at Ardbear on 10 July 1998 between 4 m and 8 m depth. This was most likely due to the presence of hydrogen sulphide in the water below 8 m. Mixing at this interface between anoxic and oxic waters probably caused hydrogen sulphide to be oxidized and released as minute granules of sulphur. Oxidizing bacteria such as Beggiatoa thus have the capacity to biologically buffer the sedimentary ecosystem with respect to free sulphide, until that is, oxygen becomes depleted. The role of nutrient recycling from shelf seas in maintaining high pelagic phytoplankton populations was assigned the term benthic pelagic coupling by Rowe et al. (Reference Rowe, Clifford, Smith and Hamilton1975). Bailey (Reference Bailey, Tyson and Pearson1991) demonstrated that where benthic pelagic coupling was inoperative along coastal upwelling areas the water column was not depleted in oxygen. At Ardbear, owing to its shallow depth, benthic pelagic coupling is a short, rapid and efficient process. On the basis of the available data, a delicate balance is demonstrated at Ardbear between the growth of phytoplankton, thermal stratification and organic enrichment.
Unfortunately, the long term monitoring data provides little insight into the short term dynamics of stratification and oxygen depletion at Ardbear owing to the relatively long sampling interval (4 weeks). Since it is the short term variation (days), as revealed by regression analysis, that produces the most pronounced impact on the oxygen levels at the Salt Lake, the weekly sampling programme initiated during the summer months at Station I provided much useful data. This importance of short term variation in meteorological conditions was also noted to be the case for stratification and bottom water hypoxia in the Pamlico River Estuary (Stanley & Nixon, Reference Stanley and Nixon1992). At Ardbear when the thermal stratification is broken down over the approaching winter months, oxygen values gradually return to normal. The water column returns to a state that is for the most part homogeneously mixed, although a reservoir of hypoxic or anoxic water may persist at the bottom at Station I. Should the break up of stratification occur suddenly by strong wind turbulence, in late summer or early autumn, a situation could ensue similar to that described for Limfjorden in the 1970s (Jørgensen, Reference Jørgensen1980). Such sudden dissipation of the water column could cause a flip of the stratification system and an eruption of anoxic water into surface layers. This would result in mass mortality of both benthic and pelagic fauna at the lake.
Modelling of hypoxia at Ardbear
The construction of an ecosystem model based on dissolved oxygen concentrations at the Salt Lake was a major aim of the present study. The objective was to generate a description of the system that could: (i) identify the main causes of oxygen depletion at the lake; and (ii) predict or anticipate future possible anoxic events. Station I, at a depth of 30 m, was chosen for investigation as it is the first area in the Salt Lake to experience hypoxia.
The seasonal cycle of oxygen concentration at Ardbear is reasonably simulated by the Regression Model 1 (RM1) which assessed the importance of the meteorological conditions of insolation, rainfall, air temperature and wind speed, along with the influence of depth in the development of hypoxia. The magnitude of the annual variations is quite realistic at 30 m but the peak on day 220 is overestimated. The model at 30 m also does not adequately simulate the duration of the anoxic event that occurred during the summer of 1998. However, from Figure 2, it can be inferred that once the model levels fall below approximately 4mgO2/l it is likely that the water at 30 m is experiencing hypoxic, if not anoxic, conditions. The model simulations for 15, 10, 5 and 0 m are more consistent with the observed cycle of oxygen concentration at the lake. They do not correspond as well in terms of magnitude, being slightly higher in value than the real data. These results suggest that wind, air temperature and depth data alone are sufficient to simulate the dynamics of the water column at Station I.
While a numerical model gives the behaviour of a state variable from known parametric values, the inverse method uses the observations of the state variables to estimate the parametric values (Chardy et al., 1991). With this in mind, it was decided to investigate the predictive powers of the numerical model RM1, which is generated from real data for day 8–day 310 of the study period (1998). To do this, an inverse model was applied (Regression Model 2: RM2). In this case, meteorological data for day 350–day 702 of the present study were substituted into RM1 and the resultant theoretical oxygen values were plotted against the observed values for the same time period. Again, the seasonal cycle was well simulated at all depths and the least deviation from observed values was registered at 30 m.
Limitations on RM1 and RM2 might be the exclusion of features such as fresh water input and tidal regime. However, as stated above, the model proposed here is structured on the basis of obviating the need to take physical samples from the lake. As a result, this regression approach to simulating oxygen conditions at the Salt Lake was considered a successful procedure for both describing and understanding the water column response to meteorological features prevailing at Ardbear. In this regard, the model is seen to be of great importance in future investigations as water quality at the Salt Lake can be monitored remotely using the meteorological data alone.
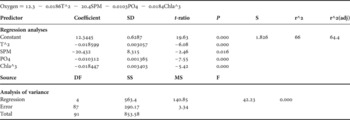
Formulation of Regression Model 3 (RM3; Table 4), a model describing the impact of water quality parameters, generated an equation that described the general dynamics of phytoplankton proliferation, sinking and enrichment of the sediment with increasing temperature. This strengthens the suggestion earlier that planktonic biomass is the single most important biological feature in the development of hypoxia at the Salt Lake. The parameters investigated were water temperature, salinity, chlorophyll-a, nutrients, depth and particulate organic carbon. The results suggest that depth, salinity, POC, and the nutrients nitrate, nitrite, ammonium and silicate are not regulating factors in the oxygen depletion at Ardbear. The shape of the descriptive and predictive (Regression Model 4: RM4; Table 2.33) curves produced for this data are in good agreement with the observations, although, a slight lag is observed. Compared with the structure of the real ecosystem the present model is very simple and many real processes are excluded. Improvements to the model could include consideration of the bacterial biomass at the lake, phytoplankton diversity, the filtration activity of the suspension feeding fauna, or the role played by the mussel lines in accelerating oxygen depletion at Station I. On the other hand, coastal lagoons and embayments are well defined ecosystems and are areas where variability is by and large predictable and a relatively simple, hydrodynamic model should be capable of describing them (Nicolaidou et al., Reference Nicolaidon, Simboura, Vamvakopoulou, Herman and Heip1991).
Regression Model 3: results of regression analyses and analyses of variance on the regression of water data and the predicted profiles of oxygen concentration with depth in the water column at Station I, Ardbear, based on data recorded between day 8 and day 310 of the study period (T^2 is water temperature on the sampling date to a factor of 2; SPM is suspended particulate matter on the sampling date; PO4 is orthophosphate on the sampling date and Chla^3 is chlorophyll-a on the sampling date to a factor of 3).

Validation of RM1 was achieved when the predictive abilities of the model were further extended to the time of the last study at the Salt Lake in 1986 and 1987. Once again the shape of the curves of predicted and observed data are comparable, although predicted values are slightly higher in most cases. If it can be held that water at Station I (30 m) is at least hypoxic when the model data reach 4mgO2/l and lower, this would imply that oxygen conditions at this depth had probably only briefly recovered from hypoxic/anoxic in the winter of 1986, when meteorological forcing created these conditions again in the spring of 1987. It must also be hypothesized from Figure 3 at 30 m the water remained anoxic for most of the year during 1987. This would appear to hold as it was during this time that the last major crash and mass mortalities occurred. At 15 m to the surface the recovery from the 1986 event was of longer duration but the model predicts that by the end of April or beginning of May, 1987 that conditions had deteriorated sufficiently to be of concern. Indeed, on 23 April 1987 Leahy (Reference Leahy1991) reported levels of 4.5mlO2/l at the bottom at 6 m. Such findings only serve to validate and strengthen the confidence in these models.
A comparison of the calculations from the numerical models RM1 and RM3 with real observations from Ardbear suggest that modelling the seasonal oxygen variation in this ecosystem has been successful. The results were obtained by stepwise regressions where the fitting of parameters was based on trial and error. The results indicate that the proposed RM2 is a not insignificant tool for predicting oxygen dynamics in the lake, and combined with RM4 would certainly be powerful.
ACKNOWLEDGEMENTS
The authors would like to acknowledge the generous support of Statoil Exploration (Ireland) Ltd and its partners ARCO Ireland Offshore Inc., Conoco (UK) Ltd., and Dana Petroleum plc in funding this work. Thanks are also extended to Dr Martin Solan for lending his skills to the development of the models, and Dr Richard Arnett for his criticisms and editorial work.