Coarctation of the aorta accounts for 4–7% of all congenital heart defects.Reference Jenkins and Ward1 It often occurs in the juxtaductal position distal to the left subclavian artery, with a left aortic arch. The development of thoracic aortic arch obstruction associated with stenosis and/or aneurysm, at the site of an initially successful surgical or catheter-based repair for coarctation of the aorta (referred to as re-coarctation), has been reported to occur in ∼10% of cases.Reference Dodge-Khatami, Backer and Mavroudis2 Medium follow-up, however, suggests a recurrence rate upwards of ∼20%, for patients operated on during infancy.Reference Kappetein, Zwinderman, Bogers, Rohmer and Huymans3 Over the past 15 years, catheter-directed endovascular stents have been successfully employed to treat re-coarctation in adolescents and adults, without major complications.Reference Forbes and Gowda4, Reference Vergales, Gangemi, Rhueban and Lim5 This procedure usually results in minimal residual pressure drop, significant increase in vessel diameter, and sustained haemodynamic benefit. Therefore, the prevailing opinion is that catheter-based intervention (balloon or stent) is the preferred alternative to surgery for re-coarctation. However, when there is an associated aneurysm, catheter-directed treatment remains controversial and is likely patient specific.
Traditionally, at cardiac catheterisation for re-coarctation, the measured absolute pressure values and overall pressure drop across the obstruction usually provide the necessary information required to make a decision about undertaking a catheter-based therapeutic intervention. In some cases, however, reliance on pressure drop alone, especially when it is minimal, e.g., a peak systole pressure drop less than ∼20 mmHg, may be insufficient to assess the efficacy, or preclude the use, of transcatheter treatment. Under these circumstances, one customarily looks for angiographic and/or magnetic resonance imaging/computed tomography angiography evidence of significant aortic arch narrowing and/or dilatation, or radiographic confirmation of prominent collateral flow, which can reduce the perceived pressure gradient in comparison to anatomic severity.
When coarctation of the aorta is associated with an aneurysmal enlargement, as in our case with a dilated ductal ampulla, the possibility of rupture must always be a concern.Footnote * Traditionally, it has been taught that the risk of rupture of an arterial aneurysm is primarily determined by its size. However, recent magnetic resonance imaging studies in conjunction with computational fluid dynamics simulations have focused on the underlying haemodynamics associated with blood flow through intracranial and abdominal aortic aneurysms. These results suggest that in some cases, rather than aneurysm size or arterial pressure, rupture is more likely to occur at sites in the aneurysm where “blood flow is sluggish, flow-induced shear stress is diminished and thrombus deposition predominates”.Reference Rayz, Boussel and Ge7, Reference Bluestein, Dumont and DeBeule8 Thus, a detailed knowledge about the flow characteristics associated with an aortic arch obstruction containing an aneurysm may be useful, if not essential, for arriving at an impactful clinical decision about interventional treatment.
Computational fluid dynamics is a methodology that is increasingly being applied to the cardiovascular system and incorporated into clinical practice. Specifically, it is employed to numerically solve the Navier–Stokes equations governing the pulsatile flow of blood, through say the aorta, with a certain degree of accuracy, based on patient-specific data.Reference Morris, Narracott and von Tengg-Kobligk9 This approach permits visualising evolving flow patterns; characterising pressure distributions and velocity fields; calculating wall shear stresses and oscillatory shear indices; and displaying particle stream traces. These are fluid dynamics features that cannot directly be ascertained from cardiac catherisation data or with standard imaging studies, but can have important clinical implications. Moreover, since most catheter-directed treatments intend to restore normal, or even improved, haemodynamics, computational fluid dynamics can provide detailed information about pre-operative flow conditions, and predict post-operative flow responses resulting from a specific intervention.
The causal relationship between flow-induced shear stress and aortic arch wall pathology is well established. Wall shear stress represents the longitudinal force exerted by a moving fluid on the luminal wall (per unit area) of the vessel. Wall shear stress is a vector quantity and thus possesses both magnitude and direction. Each of these components of the wall shear stress vector can influence the development and progression of aortic arch disease. Disturbed blood flow can create abnormal wall shear stress (either too low or high) and/or produce prominent changes in wall shear stress direction (over the cardiac cycle), which can induce intimal cells to become pro-thrombotic and/or excessively proliferate.Reference Davis10 Pulsatile flow-induced alterations in shear stress along the luminal wall of arterial vessels has also been shown to play a major role in the adverse vascular remodelling responsible for initiating aneurysm formation and accelerating vessel wall deterioration.
In this study, as a representative case, we present a young adult with an unusual form of re-coartation, i.e., one involving a dilated ductal ampulla along with narrowing of the aortic isthmus. At cardiac catheterisation, with the patient under sedation, the peak systolic pressure drop across the obstruction, prior to stent placement, measured only ∼8 mmHg. Nevertheless, based on our previous computational studies,Reference Ascuitto, Kydon and Ross-Ascuitto11, Reference Celestin, Guillot, Ross-Ascuitto and Ascuitto12 we postulated that the abrupt increase in the size of the blood flow pathway, created by the dilated ampulla, would give rise to flow separation, vortices, and re-circulation, which can create deleterious haemodynamic effects. Thus, the goal of the present work is to advance the understanding of blood flow through this uncommon, yet critically important, form of re-coarctation. In doing so, we hoped to demonstrate the unique complementary role computational fluid dynamics can play in assessing the severity of a complex aortic arch obstruction.
The computational fluid dynamics simulations confirmed that, prior to an intervention, flow in the ampulla and at sites in the thoracic descending aorta created vortices, and sites of abnormally low (and high)-velocity flow inducing correspondingly low (and high) wall shear stresses. Stream traces showed that particles following certain trajectories become trapped in the ampulla and at sites in the descending aorta, a condition that would be favourable for platelet activation/aggregation and thrombus deposition.Reference Shadden and Hendabadi13 This finding is important, since it recently has been shown that intraluminal thrombus buildup in an aneurysm of an arterial vessel is a major risk factor for progressive enlargement and ultimate rupture.Reference Bandon Bravo Bruinsma, Leicher and Haalebos6, Reference Rayz, Boussel and Ge7
We believe computational fluid dynamics modelling, based on patient-specific arch anatomy, can serve as a powerful complementary tool alongside cardiac catherterisation/angiography and other non-invasive imaging modalities. This approach can provide clinicians with a better understanding of the flow features underlying pressure gradients, velocity fields, and wall shear stresses arising as a consequence of blood traversing a region of re-coactation of the aorta.
Clinical summary
The patient is a 22-year-old female, who was born with a large membranous ventricular septal defect, bicuspid aortic valve, and critical coarctation of the aorta. The coarctation was repaired with a left subclavian flap aortoplasty during infancy. She subsequently underwent surgical closure of the ventricular septal defect. In her teens, she developed progressive systemic arterial hypertension requiring increasing doses of medication. Sphygmomanometry measurements showed a blood pressure difference between the right arm and left leg at rest of ∼10 mmHg. An exercise stress test, however, revealed an increase in systolic blood pressure to ∼200 mmHg and to ∼130 mmHg, at peak exercise (completed stage IV of the Bruce Protocol), in the right arm and left leg, respectively. The blood pressure difference was resolved in recovery. Magnetic resonance imaging was obtained. It showed a prominent bulge at the mid-isthmus measuring ∼23 mm across (normal isthmus is 14–15 mm, z score ∼0), a discrete narrowing at the distal isthmus to ∼12 mm and a slightly dilated proximal thoracic descending aorta of ∼18 mm. Given these findings, and since the patient was hypertensive despite aggressive medical management and developed a significant upper versus lower limb blood pressure difference at a high level of exercise, she underwent cardiac catheterisation with the possibility of an interventional procedure.
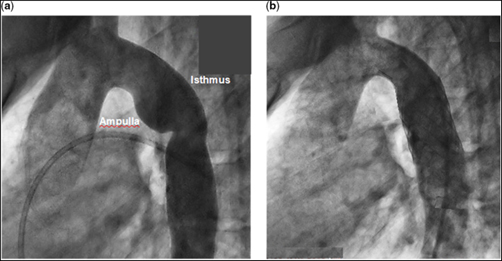
At cardiac catheterisation, with the patient under sedation, in vivo blood pressure measurements showed no obstruction across the aortic valve, an ascending aortic blood pressure of 78/50 mmHg, and a descending aortic pressure of 70/50 mmHg, by direct pull back. Angiography revealed a dilated ductal ampulla and discrete narrowing at the junction of the isthmus and the thoracic descending aorta (Fig 1a – see representative measurements in the caption). After reviewing the clinical information and the results of the computational fluid dynamics simulation studies, it was decided to treat the patient by catheter-directed stent implantation. A Palmaz P4010 XL stent (Johnson & Johnson, Miami, FL, United States of America) was chosen, which was manually mounted over a 22 × 5 NuMed BIB balloon (NuMED, Inc., Hopkinton, NY, United States of America) for insertion over a wire. A 16-French 70-cm Cook sheath (Cook Medical, Bloomington, IN, United States of America) was then advanced, under fluoroscopic guidance, over a 0.035 Amplatz Super Stiff exchange wire (Boston Scientific, Marlborough, MA, United States of America) that had previously been positioned in the right subclavian artery.
(a) Angiogram of the aorta with re-coarctation prior to stent implantation. Representative vessel diameter measurements, based on the cardiac catheterisation angiogram and the magnetic resonance imaging, are as follows: aortic annulus (entrance to the aorta), 17 mm; sinus of Valsava, 27 mm; sino-tubular junction, 18 mm; ascending aorta, 23 mm (at about the right pulmonary artery); proximal transverse aortic arch, 14 mm; distal transverse aortic arch, (entrance to the isthmus) 15 mm; the greatest distance from the wall of the ampulla to the lateral wall of the isthmus, 23 mm; narrowed distal isthmus, 13 mm; proximal thoracic descending aorta, 18 mm; distal thoracic descending aorta (exit from the aorta), 14 mm. (b) Angiogram of the aorta after stent implantation. There is a slight difference in angulation between the angiograms in (a) and in (b).
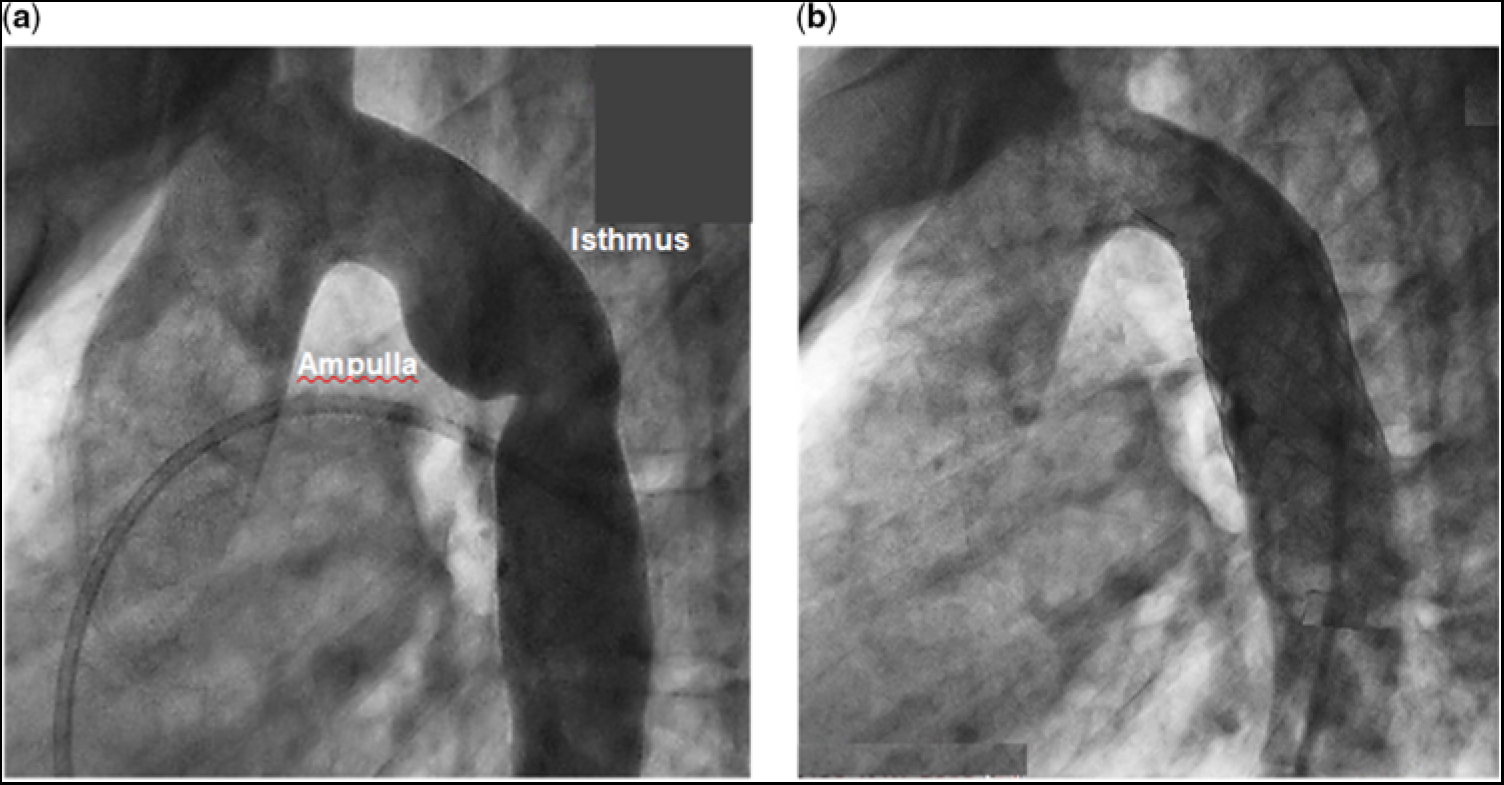
After unsheathing the complex, the stent was deployed at the desired location across the region of re-coarctation. The inner balloon was inflated to 6.2 atm followed by the outer balloon to 6.7 atm. After implantation, follow-up measurements showed the blood pressure in the ascending aorta to be 120/70 mmHg and descending aorta 120/70 mmHg. Follow-up angiography showed no residual region of abnormal dilatation or narrowing, and no evidence of a vascular tear, pseudo-aneurysm, or dissection (Fig 1b). The patient tolerated the procedure well and was discharged the following morning.
Computational fluid dynamics assessment
Methods
Geometric reproduction of the aortic arch with re-coarctation
We employed a three-dimensional planar representation of the thoracic aorta, prior to endovascular stent implantation, based on magnetic resonance imaging, and the patient’s aortograms obtained at cardiac catheterisation, as displayed in Figure 1a. The modelled aorta was taken as tubular with a circular cross-sectional area. The aortic wall was considered rigid and impermeable. This approximation greatly simplified the computational process. Representative anatomic dimensions of the in silico model are detailed in the caption to Figure 1a.
Fluid dynamics equations of motion
Flow studies were conducted using the commercial computational fluid dynamics software package Fluent 17.1 (Ansys, Inc., Lebanon, NH, United States of America). Fluent is a large-scale computer program capable of numerically solving the three-dimensional Navier–Stokes and continuity equations for an incompressible fluid, using the finite volume method, and subject to specific boundary conditions. The Navier–Stokes equations may be written as follows:
 $${\rm{\rho }}\left( {{{\partial \overrightarrow {\rm{V}} } \mathord {\left/ {\vphantom {{\partial \overrightarrow {\rm{V}} } {\partial {\rm{t}} + \overrightarrow {\rm{V}} \cdot \overrightarrow \nabla \cdot \overrightarrow {\rm{V}} }}} \right.} {\partial {\rm{t}} + \overrightarrow {\rm{V}} \cdot \overrightarrow \nabla \overrightarrow {\rm{V}} }}} \right) = - \overrightarrow \nabla {\rm{p}} + \overrightarrow \nabla \cdot \left( {{{\rm{\eta }}_{\rm{a}}}\overrightarrow \nabla \overrightarrow {\rm{V}} } \right)$$
(1)
where rho (ρ) is the density of blood, 1060 kg/m3, and eta (ηa) is the apparent viscosity. Here
 $\overrightarrow {\rm{V}} $
denotes the flow-velocity vector, with components Vx, Vy, and Vz, in the x, y, and z directions, respectively, and (p) is the local static pressure (henceforth referred to simply as pressure). Del (
 $ \overrightarrow \nabla $
) is the vector gradient operator.
The corresponding continuity equation becomes
 $$\overrightarrow \nabla \cdot \overrightarrow {\rm{V}} = 0$$
(2)
The unknown variables in the equations of motion are the flow-velocity vector and the pressure. The pressure is expressed in Pascals (Pa) or mmHg, depending on the information being presented; 1 Pa = 1 N/m2 and 1 mm Hg = 133.3 Pa. Volumetric flow rate is expressed in litre per minute, and 1 L/minute = 1.66 × 10⁻⁵ m3/second. Flow-velocity magnitude is expressed in metre per second.
In these calculations, we assumed the fluid to be of non-Newtonian character, in which the apparent viscosity (ηa) depends on the scalar shear rate (γ), i.e., the velocity gradient. The Carreu–Yasuda model was used to describe the relationship between ηa and γ.Reference Andrade, Petronilio, de A. Maneschy and de A. Cruz14, Reference Ascuitto, Ross-Ascuitto, Guillot and Celestin15
Finite volume method
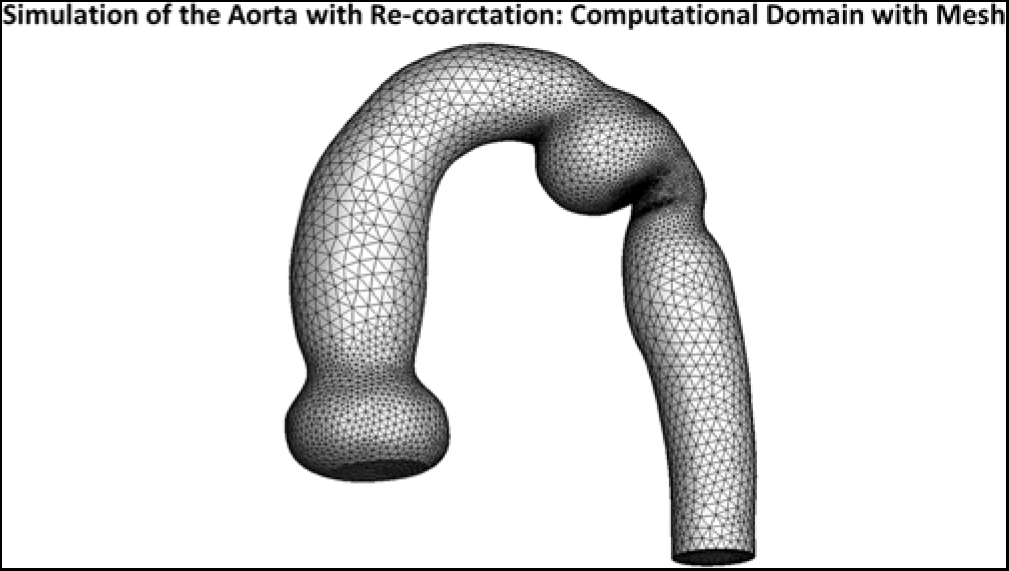
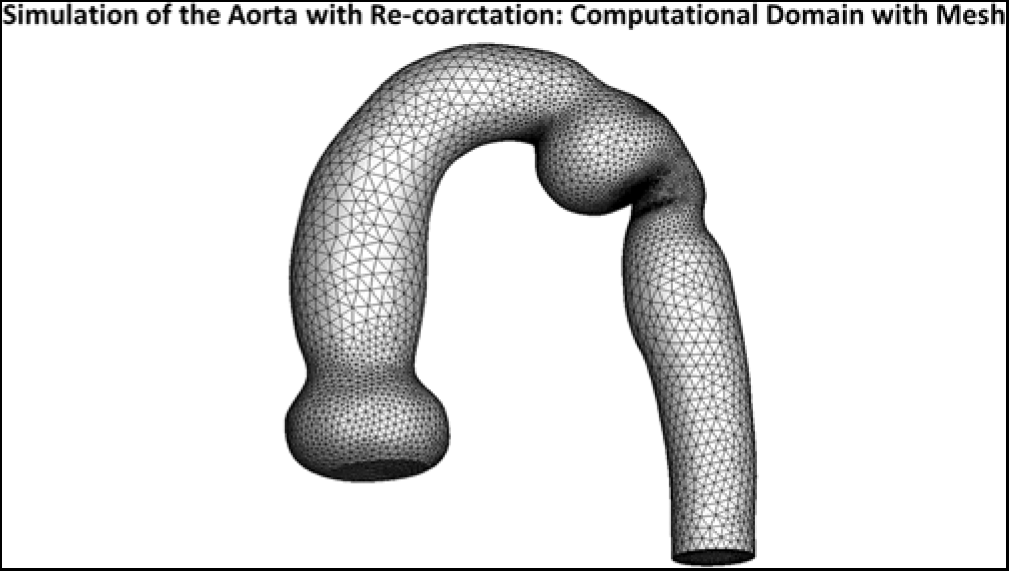
Fluent uses the finite volume method to discretise the Navier–Stokes equations, where the fluid domain is divided into a number of volumetric elements called cells (see Fig 2). The equations are integrated within each cell, and convective and diffusive fluxes are interfaced across cells. We used tetrahedral cells throughout, along with prismatic cells near the vessel walls. Typically, 283,164 cells with 12 layers of prismatic elements near the walls, to better resolve the velocity gradients.Reference Celestin, Guillot, Ross-Ascuitto and Ascuitto12
Three-dimensional simulation of the aorta with the re-coarctation. The dilatation of the ampulla and the narrowing of the distal isthmus are evident. Superimposed is the mesh required for the numerical calculations.
Inlet and outlet boundary conditions
Our goal in this study was to determine the haemodynamic consequences associated with flow crossing the abnormal region of the aorta. For all calculations, we assumed flow velocity to be zero at the luminal wall of the vessel, the so-called no-slip condition. Based on in vivo magnetic resonance imaging studies in adults of flow in an unobstructed aorta, a portion (∼30%) of the cardiac output is directed towards the supra-aortic arch vessels; the remainder (∼70%) passes through the transverse aortic arch and the thoracic descending aorta.Reference Alastruey, Xiao, Fok, Schaeffter and Figueroa16
In our case, there was no obstruction in the left ventricular outflow tract, across the aortic valve, in the ascending aorta or in the transverse aortic arch. Thus, the only significant effect caused by flow entering the arch vessels was to lessen the magnitude of the flow crossing the downstream region of re-coarctation.Reference Alastruey, Xiao, Fok, Schaeffter and Figueroa16 Consequently, for computational simplicity, we did not explicitly include the arch vessels in these calculations. We accounted for their omission, however, by taking the flow crossing the downstream obstruction and in the thoracic descending aorta to be ∼70% of the calculated cardiac output for the patient. However, we started this component of the flow at the inlet to the ascending aorta. This approach provided the flow, destined to cross the re-coarctation, with the proper anatomic pathway, i.e., the ascending aorta and transverse aortic arch, so that when it reached the inlet to the computational domain, it will have achieved a realistic velocity profile and flow-rate waveform.
For the numerical simulations, a flat uniform velocity profile in conjunction with a pulsatile, parabolic flow rate waveform was imposed as the inlet boundary condition for the ascending aorta. The systolic ejection period was 0.34 second and the heart rate 60 bpm.Reference Nerem17 The assumed time-varying parabolic flow rate is similar to what is obtained from in vivo magnetic resonance imaging measurements of flow in an unobstructed ascending aorta.Reference Alastruey, Xiao, Fok, Schaeffter and Figueroa16, Reference Keshavarz-Motamed, Garcia and Gaillard18 The in vivo mean flow rate entering the ascending aorta can be deduced from the patient’s magnetic resonance imaging study and checked against the cardiac catheterisation data. The magnetic resonance imaging stoke volume was 72 ml, which implied a mean flow rate of 4.2 L/minute in the ascending aorta. This result compared favourably to the calculated cardiac output determined from the cardiac catheterisation data, using the Fick principle and an assumed total body oxygen consumption index of 120 ml/minute/m2, of ∼4.3 L/minute. Thus, the flow rate crossing the site of re-coarctation became ∼0.7 × 4.3 L/minute or ∼3.0 L/minute. The temporal pressure waveform in the distal thoracic descending aorta, measured at cardiac catheterisation, was taken as the outlet boundary condition.
Wall shear stress and oscillatory shear index
Based on our choice of a pulsatile parabolic flow rate waveform entering the aorta, we determined the time average of the “magnitude” of the instantaneous wall shear stress vector, WSS (t), over “systole” (TAWSS) as follows:
 $${\rm TAWSS} = \left( {{1 {\left/ {{{{\rm Ts}}}} \right.}}} \right) \int \left|{\overrightarrow {\rm WSS} \left( {\rm t} \right)} \right|{\rm dt}$$
(3)
were Ts is the systolic ejection time (0.34 second). We believe averaging over systole provides a truer representation of the magnitude of the pulsed shear stress burden imposed on the luminal wall, since the contribution to wall shear stress during diastole is small, as there is essentially no flow.
To evaluate the temporal oscillations in the instantaneous
 $\overrightarrow {{\rm WSS}}$
vector, over the cardiac cycle, we used the oscillatory shear index, as followsReference Soulis, Lampri, Fytanidis and Giannoglou19:
 $${\rm{OSI}} = 1/2\left[ {1 - {{\left| {\int {\overrightarrow {{\rm{WSS}}} \left( {\rm{t}} \right)} {\rm{dt}}} \right|} \mathord{\left/ {\vphantom {{\left| {\int {\overrightarrow {{\rm{WSS}}} \left( {\rm{t}} \right)} {\rm{dt}}} \right|} {\left| {\int {\overrightarrow {{\rm{WSS}}} \left( {\rm{t}} \right)} } \right|{\rm{dt}}}}} \right.} \int {\left| {{\overrightarrow {{\rm{WSS}}} \left( {\rm{t}} \right)} } \right|{\rm{dt}}}}} \right]$$
(4)
Here, the integrals are over the total cardiac cycle (1.0 second), for a heart rate of 60 bpm. The oscillatory shear index has a range between 0 and 0.5. Zero means that the instantaneous wall shear stress vector is essentially aligned with the time-averaged wall shear stress vector over the entire cardiac cycle. A value of 0.5 implies that the instantaneous wall shear stress vector is almost never aligned with the time-averaged wall shear stress vector over the cardiac cycle.
Results
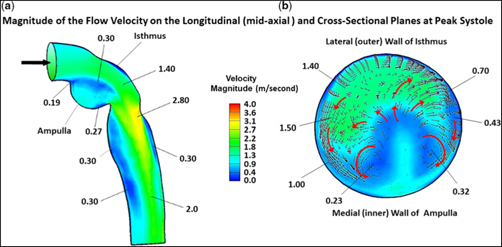
In this study, we focused on flow-velocity distributions and wall shear stresses in the region of re-coarctation, namely the distal transverse aortic arch, aortic isthmus, and thoracic descending aorta. In the ascending aorta and transverse aortic arch, flow was essentially laminar and remained fully attached to the vessel wall, not shown. Flow reversal did not occur, as its inertial force overcame any adverse pressure gradient induced by curvature in the aortic arch. However, the scenario became completely different as flow entered and traversed the ampulla/isthmus, and then the thoracic descending aorta. Figure 3a shows the magnitude of the flow velocity, in metre per second, as distributed over the longitudinal (mid-axial) plane, for the portion of the computational fluid domain of primary interest, at peak systole, and prior to stent implantation. As flow entered the isthmus, it could not abruptly change direction to adhere to the sharply curved wall of the aneurysmal ampulla. Consequently, flow separated from the aortic wall to form a wide, higher-velocity (∼1.4 m/second) stream (green region) that, due to centrifugal effects, travelled along the lateral (outer) wall of the isthmus. This stream gave rise to secondary flow in the ampulla/isthmus that consisted of counter-rotating vortices in the cross-sectional plane. These vortices ultimately led to re-circulating (retrograde) low-velocity (averaging ∼0.25 m/second) flow in the ampulla (prominent blue region) that eventually induced low shear stress on the wall of the ampulla. The vortices are shown in greater detail in Figure 3b.
Magnitude of the flow velocity, in m/second, as distributed over the (a) longitudinal (mid-axial) plane and (b) cross-sectional plane, for the portion of the computational domain of primary interest, at peak systole, and prior to stent implantation. The small black arrows and larger red arrows denote direction (not magnitude) of flow. In this figure, because of space limitation, representative values of flow velocity are shown without the units. The units are (m/second). The low velocity of (0.19 m/second) is near the point of flow separation from the aortic wall.
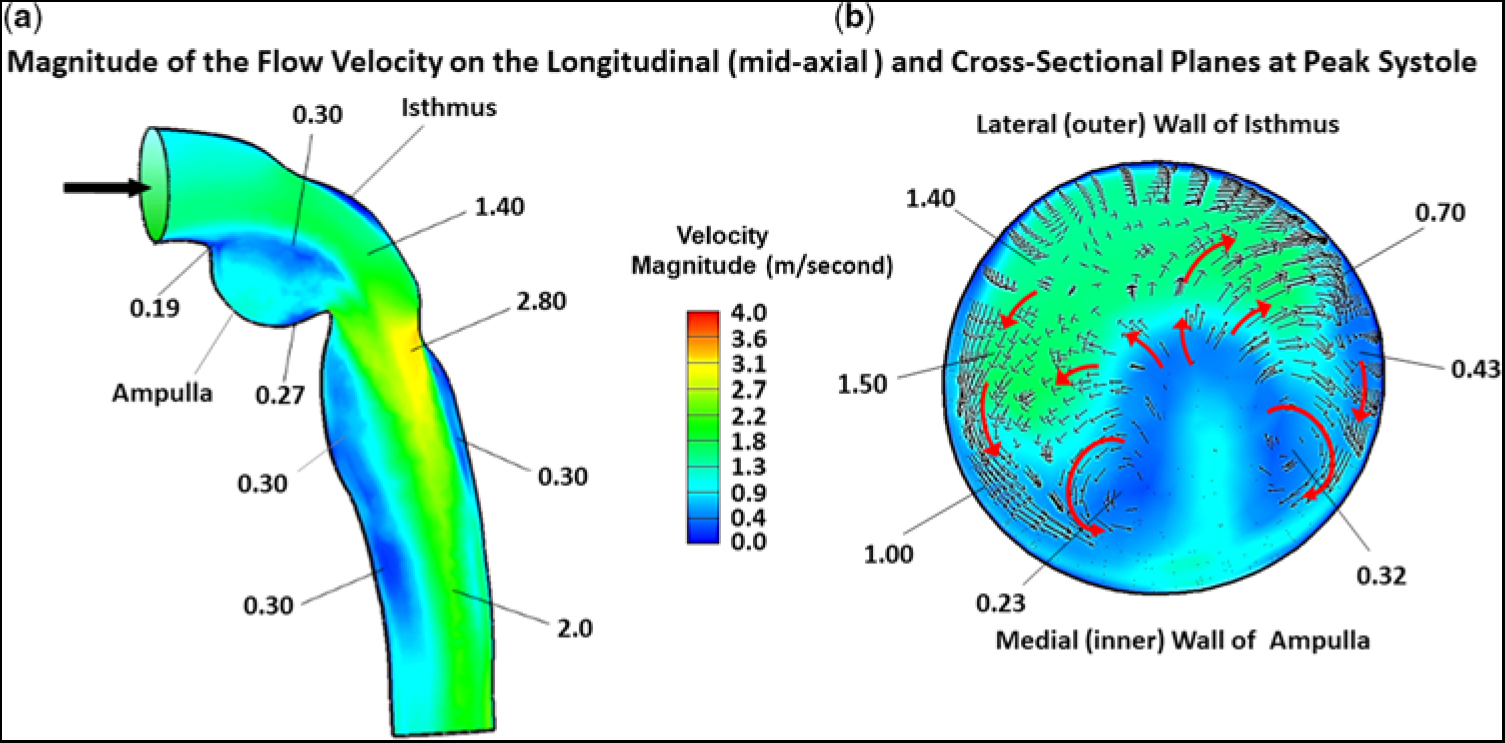
Figure 3a also displays the magnitude of the flow velocity, in m/second, as distributed over the longitudinal (mid-axial) plane, that is associated with the higher-velocity stream (green region) exiting the isthmus and entering the thoracic descending aorta. At the junction of the isthmus and the descending aorta, at peak systole, flow contracted, but, because of its increased speed, could not abruptly alter direction to follow the remaining bend in the aorta. Thus, flow again detached from the aortic wall, but now emerged as a high-velocity (∼2.8 m/second) eccentric jet that impinged on the lateral wall of the descending aorta (orange/yellow region). Under these circumstances, the maximum flow velocity was no longer at the centre line. A skewed velocity profile developed, where higher velocities occurred near the lateral wall of the descending aorta. As the eccentric high-velocity jet advanced in the descending aorta, it created re-circulating (retrograde) low-velocity (∼0.3 m/second) flow bilaterally in its wake, for a considerable distance along the medial wall (prominent blue region) and, to a lesser extent, the lateral wall (narrow blue region), of the aorta.
Figure 3b shows the magnitude of the flow velocity, in m/second, as distributed over the cross-sectional plane, positioned about midway along the lateral wall of the isthmus, at peak systole, and prior to stent implantation. This figure displays the re-circulating nature of the fluid currents initiated by the counter-rotating vortices. At this position in the isthmus, the vortex flow covered much of the cross section. The small black and larger red arrows signify direction (not magnitude) of the flow. The higher-velocity (∼1.4 m/second) stream (green region) that flowed adjacent to the lateral (outer) wall of the isthmus, shown previously in Figure 3a, and the more slowly moving (0.23–0.32 m/second) flow (blue region) near the centre of the vortices close to the medial (inner) wall of the ampulla are now displayed in the cross section.
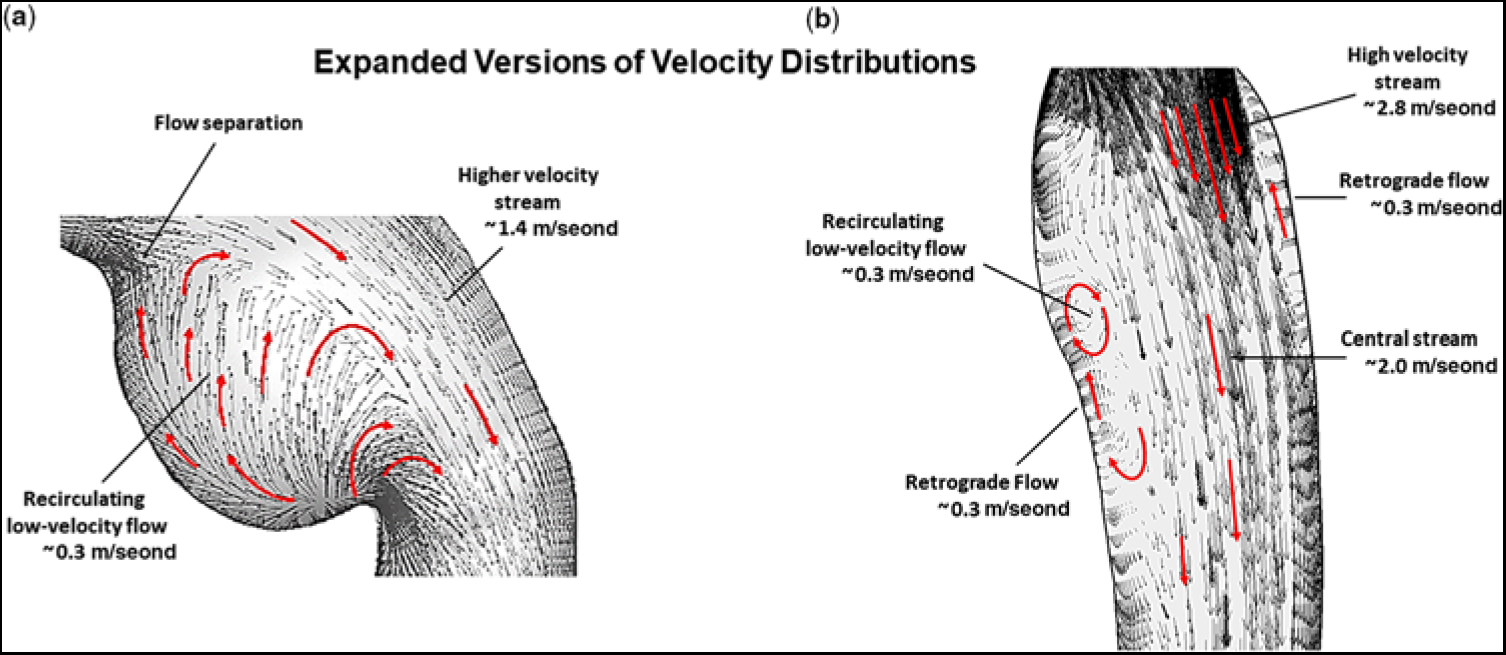
Figure 4a shows an expanded version of the ampulla which contained the low-velocity re-circulating flow. Likewise, Figure 4b shows an expanded version of the thoracic descending aorta beyond the obstruction. The velocity profile that became skewed towards the lateral wall, as the high-velocity (∼2.8 m/second) stream exited the isthmus, is designated by the group of longer straight red arrows. Moreover, as the high-velocity (∼2.0 m/second) central stream advanced along the descending aorta, it created the elongated zone containing low-velocity (∼0.3 m/second) re-circulating (retrograde) flow near the medial wall, and to a lesser extent at the lateral wall, thereby forming zones of sluggish flow, that would be highly favourable for platelet aggregation and thrombus formation. Again, the small black and larger red arrows signify direction of flow.
(a) Expanded version showing the magnitude of flow velocity, in m/second, for (a) the region of the ampulla/isthmus and (b) the thoracic descending aorta, for the portion of the computational domain of primary interest, at peak systole, and prior to stent implantation. The small black and larger red arrows denote direction of flow. In this figure, representative values of flow velocity are shown with the units (m/second).
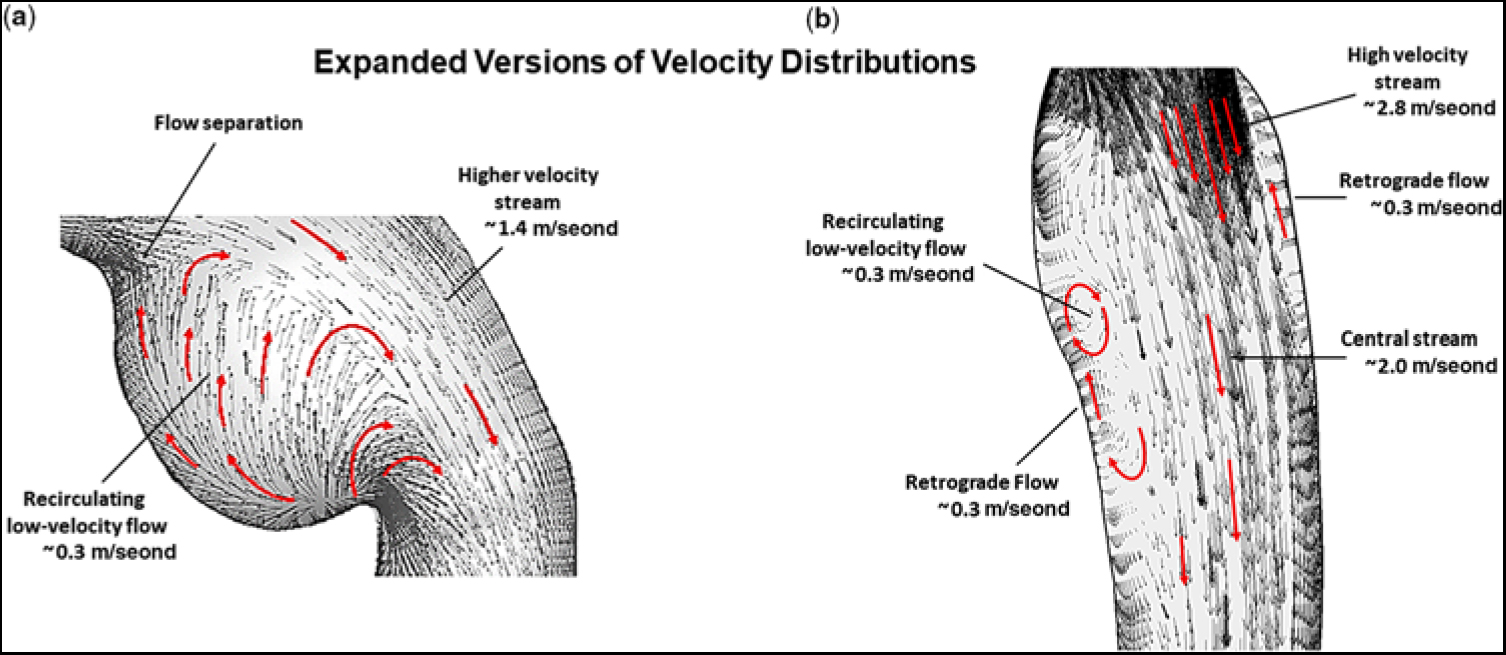
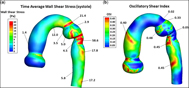
Figure 5a provides a contour plot of the TAWSS, in Pascals, for the entire computational domain, prior to stent implantation. In the ascending aorta, just above the sino-tubular junction (dark blue region), TAWSS was low (∼1.4 Pa), typical for an unobstructed ascending aorta. As flow advanced along the curved under surface of the transverse aortic arch (green region), TAWSS increased (∼12 Pa). When flow turned and entered the isthmus (red-ringed region), TAWSS increased further (∼21.4 Pa). However, on the adjacent lateral (outer) wall, just beyond the entrance to the isthmus (small dark blue region), TAWSS decreased nearly 10-fold (∼2.9 Pa). This area represents the proximal portion of the subclavian flap aortoplasty. The TAWSS was also relatively low (∼3.5 Pa) on the juxtaposed medial wall of the ampulla (small blue/green region). This is the location where flow detached from the aortic wall as it entered the enlarged ampulla/isthmus. TAWSS then dramatically increased (∼58.6 Pa) just beyond the junction of the isthmus and the thoracic descending aorta (prominent red region). This is the site where the emerging high-velocity (∼2.8 m/second) jet impinged on the lateral wall of the aorta – recall Figure 3a. As flow progressed along the descending aorta, two areas of elevated TAWSS (∼17.8 and ∼ 17.2 Pa) emerged on the lateral wall (orange regions), downstream from the re-coarctation. Moreover, the high-velocity central stream in the descending aorta also gave rise to low-velocity re-circulating (retrograde) flow that induced relatively low TAWSS (∼4.5 Pa) near the medial wall (blue region). Such a heterogeneous distribution of wall shear stress in the thoracic descending aorta can weaken the structure of the aortic wall by disrupting its extracellular matrix.
(a) Contour plot of TAWSS, in Pa, and (b) the distribution of OSI, for the entire computational domain, and prior to stent implantation. In (a), representative values of TAWSS are shown without the units. The units are (Pa). In (b), OSI has no units. The triads of low flow velocity, low TAWSS, and high OSI and high flow-velocity, high TAWSS, and low OSI have important pathological implications, as described in the Discussion. OSI = oscillatory shear index; TAWSS = time average of wall shear stress.
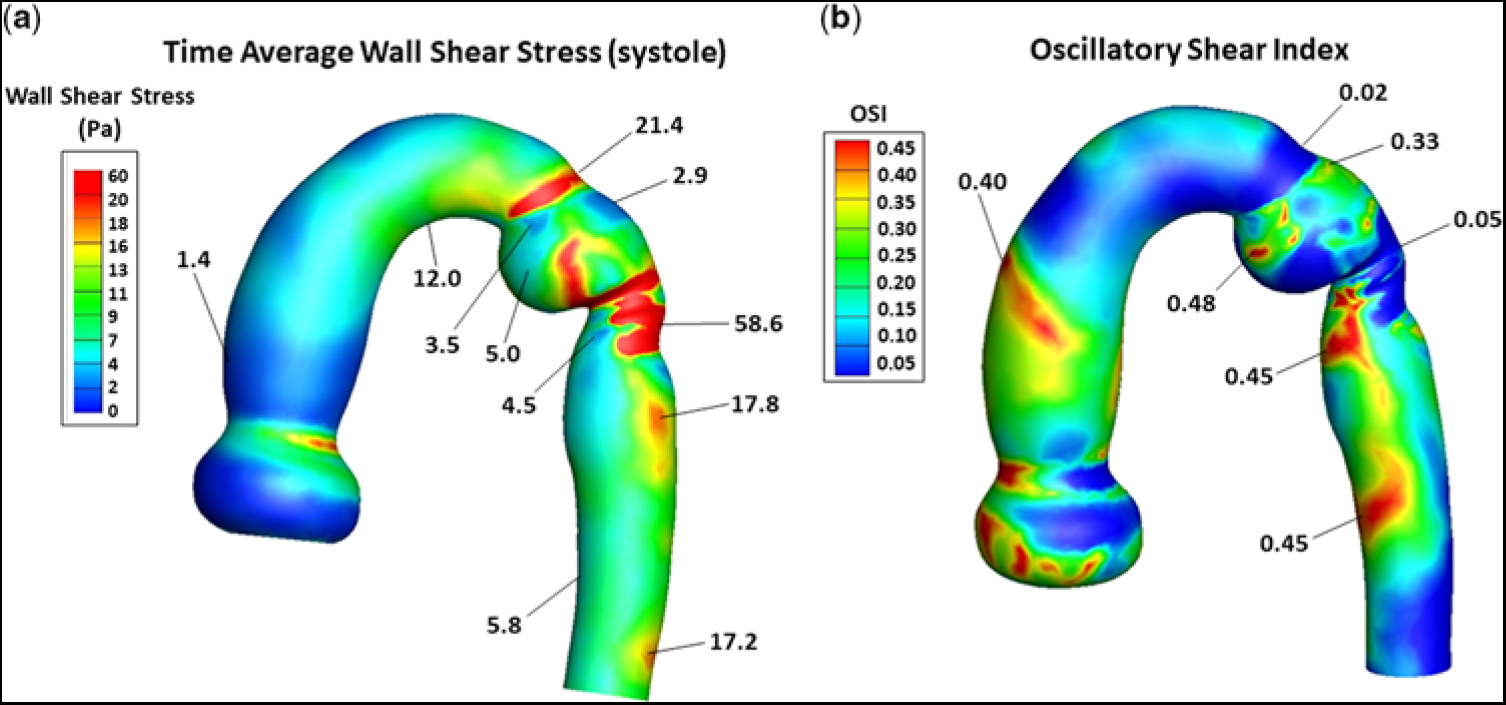
Figure 5b shows the distribution of oscillatory shear index, for the entire computational domain, and prior to stent implantation. It ranged between 0 and 0.45, where 0 denotes a unidirectional and 0.45 a multidirectional wall shear stress vector. A value of ∼0.3 or greater implies a wall shear stress vector undergoing substantial change in direction over the cardiac cycle. In the ascending aorta above the sino-tubular junction, a narrow band (orange region) of high oscillatory shear index (∼0.4) was present, reflecting flow’s encounter with the curved portion of the ascending aorta. As flow advanced along the under surface of the transverse aortic arch and at the entrance to the isthmus (dark-blue regions), oscillatory shear index remained very low (∼0.02), consistent with the instantaneous wall shear stress vector being oriented in the time-averaged direction over the cardiac cycle. However, on the adjacent lateral wall of the isthmus (small green region), oscillatory shear index increased considerably (∼0.33). This area of higher oscillatory shear index coincided with the area of low TAWSS (∼2.9 Pa) shown in Figure 5a. Then, at the site where the high-velocity jet emerged from the isthmus to strike the lateral wall of the aorta (dark blue region), oscillatory shear index decreased dramatically (∼0.05). This area of low oscillatory shear index coincided with the area of markedly elevated TAWSS (∼58.6 Pa) shown in Figure 5a. As flow progressed further along the descending aorta, two areas on the medial wall (red regions) had high oscillatory shear index (i.e., ∼0.45). These areas of high oscillatory shear index coincided with the areas of relatively low TAWSSs (∼4.5 and ∼5.8 Pa) shown in Figure 5a. Thus, sites of low oscillatory shear index tended to be associated with high TAWSS, and conversely high oscillatory shear index was coupled with low TAWSS. The inverse relationships between these shear stress metrics have important clinical implications.
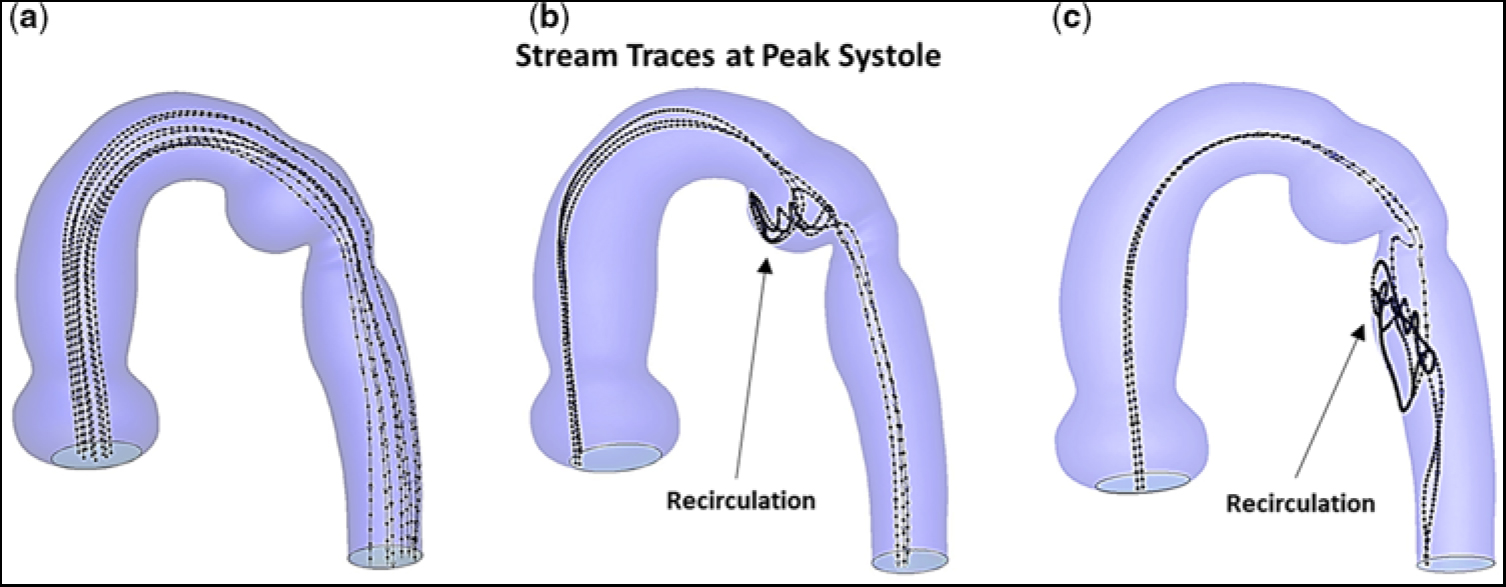
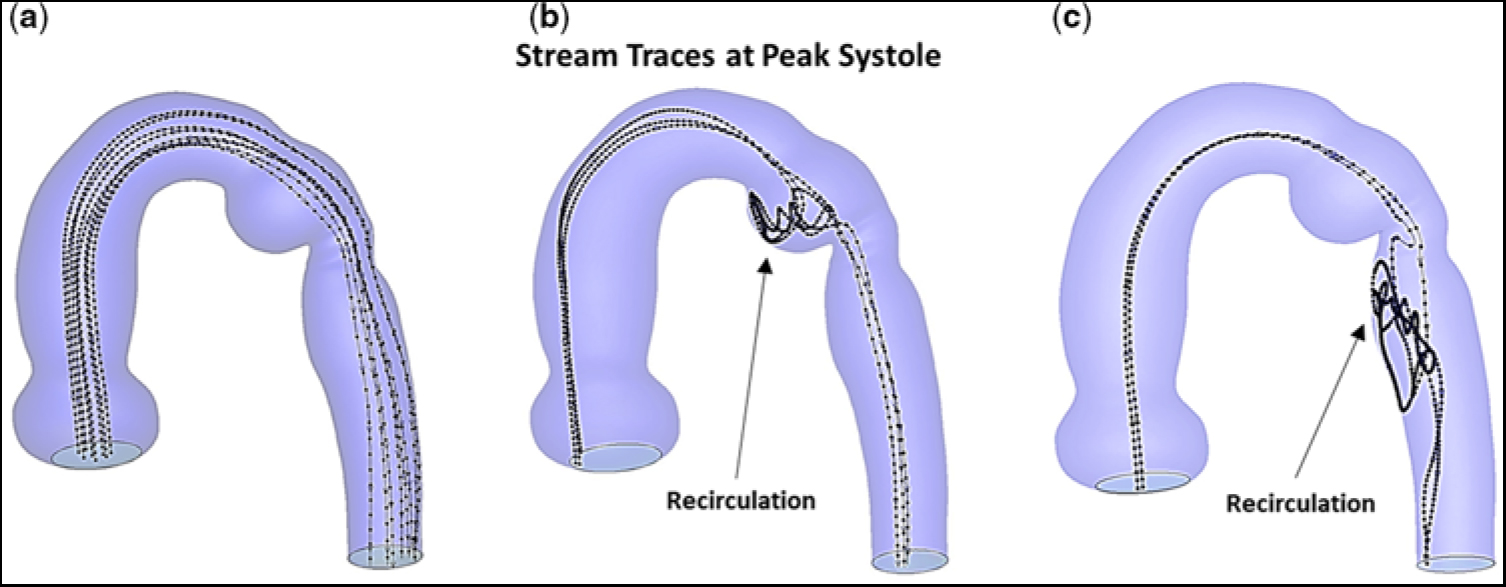
In actuality, blood is composed of plasma and formed elements, which are made-up of blood cells and platelets. Typically, the red blood cells concentrate near, and flow along, the central axis of an arterial vessel. However, due to a balance between viscous drag and inertial forces,Reference Segre and Silberberg20, Reference Segre and Silberberg21 the much smaller platelets tend to reside away from the central axis, and flow closer to the vessel wall, i.e., outward typically at ∼60% of the vessel radius.Reference Segre and Silberberg20–Reference Mountrakis, Lorenz and Hoekstra22 This led us to compare stream traces, at peak systole, and prior to stent implantation, for hypothetical particles released near the central axis to those for particles initially positioned outward from the central axis at ∼60% of the vessel radius. Figure 6 shows the corresponding stream traces for particles flowing throughout the aortic arch with re-coractation. Each stream trace remained unperturbed in the ascending aorta and transverse aortic arch, since there was no obstruction. Importantly, particles positioned near the central axis readily bypassed the ampulla and flowed undisturbed through the descending aorta, Figure 6a. In contrast, particles released at ∼60% of the vessel radius, Figure 6b and c, become entrapped in the ampulla (Fig 6b) prior to entering the descending aorta, or in a region on the medial aspect of the descending aorta just beyond the isthmus (Fig 6c). These are zones containing low-velocity re-circulating flow. Thus, particles in these areas would experience an increased residence time; and, therefore, if they were platelets, would be more likely to undergo activation/aggregation.
Stream traces, at peak systole, and prior to stent implantation. (a) Hypothetical particles released near the central axis. (b) Particles released lateral to the central axis and positioned at ∼60% of the vessel radius. (c) Particles released posterior to the central axis and positioned at ∼60% of the vessel radius. Note, in (b) and (c), particles released away from the central axis become trapped in the ampulla and undergo recirculation or become trapped in an elongated zone in the descending aorta and undergo recirculation.
Discussion
In this study, we employed transcatheter stent implantation to successfully treat a young adult with an unusual form of re-coarctation of the aorta, namely one involving an aneurysmal ductal ampulla (diverticulum) and aortic isthmus narrowing. Cardiac catheterisation, with the patient under sedation, revealed only minimal overall pressure drop across the obstruction. However, since the ampulla was dilated and its wall may have become fragile, intuitively, it carried an inherent risk for thrombosis and/or rupture, which is why we focused on understanding the haemodynamics in this region.
Thus, computational fluid dynamics simulations were employed to obtain additional information, such as blood flow patterns, velocity distributions, wall shear stresses, oscillatory shear indices, and particle stream traces, which cannot be ascertained from the cardiac catheterisation/angiography or magnetic resonance imaging data, but when abnormal have been strongly implicated in aneurysm initiation and pathologic changes in the aortic wall. The flow patterns arising in the dilated ampulla profoundly affected flow’s behaviour downstream from the re-coarctation, despite only a modest reduction in cross-sectional area at the distal isthmus. Pre-intervention blood flow was found to be highly thrombogenic in, and of a character to promote progressive enlargement of, the ductal ampulla; it was also found to be a risk for promoting structural degeneration in the descending aortic wall, especially in a patient with a bicuspid aortic valve and chronic hypertension.
Flow-induced platelet activation/aggregation plays a critical role in the development of arterial thrombosis. Platelet activation is determined by the magnitude of, and the time of exposure to, either abnormally low or high shear stress. The ductal ampulla and the junction of the isthmus and the thoracic descending aorta were considered to be areas of greatest concern, because flow velocity and shear stress undergo abrupt alterations in both magnitude and direction. As flow entered the isthmus, it separated from the aortic wall and initiated counter-rotating vortices, which led to re-circulating low-velocity flow that eventually induced low and multidirectional wall shear stress, as reflected by low TAWSS and high oscillatory shear index. Platelets carried by such slowly moving currents would have a residence time in the near-wall region that is significantly longer than normal. As a consequence, platelets could accumulate in zones of re-circulation containing low wall shear stress, undergo activation, readily form nascent aggregates, strengthen their molecular bonds by cross-linking with both fibrinogen and von Willebrand factor, and thereby initiate the clotting cascade. The presence of vortices can further contribute to thrombus generation by increasing platelet residence time. One may envision a process of vortex-induced platelet-dependent thrombosis that proceeds through a sequence of events: vortices capturing non-activated platelets; vortices mixing the trapped platelets with their activation arising near the periphery of the vortices where shear stresses are higher; vortices breaking up and releasing the activated platelets; and von Willebrand factor mediating aggregation of the activated platelets, ultimately leading to thrombus formation.
An important finding in our computational fluid dynamics study is that there are prominent regions in the ampulla and the descending aorta where flow induces low wall shear stress. Although normal values of wall shear stress promote release of factors from intimal cells that inhibit coagulation, sustained low wall shear stress shifts the profile of secreted factors and expressed surface molecules to ones that favour thrombosis. Clinical studies of abdominal aortic aneurysms, using serial computed tomography angiography imaging, have shown a strong correlation between the location of regions predicted by computational fluid dynamics to posses slowly moving flow and low wall shear stress and regions where thrombus deposition was actually observed to occur in vivo.Reference Rayz, Boussel and Ge7 More recent investigations of intracranial aneurysms, using magnetic resonance imaging data,Reference Bandon Bravo Bruinsma, Leicher and Haalebos6 have reported that the presence of intraluminal thrombus is a significant risk factor for progressive growth and rupture of these aneurysms. Intraluminal thrombus at the blood–vessel wall interface can become a biologically active neo-tissue with spatio-temporal dynamics. Pathogenic mediators and molecules activated within the thrombus layer can readily be transmitted to the tunica media and adventitia of the arterial wall, resulting in smooth muscle cell apoptosis and breakdown of the extracellular matrix.Reference Bandon Bravo Bruinsma, Leicher and Haalebos6, Reference Rayz, Boussel and Ge7 In our case, the “re-circulating low-velocity flow inducing low wall shear stress”, in the ampulla and at sites near the descending aortic wall, would provide an environment supportive of platelet-mediated thrombus formation.Reference Segre and Silberberg21, Reference Mountrakis, Lorenz and Hoekstra22
Although much is known about the deleterious effects of low wall shear stress on the arterial wall, high wall shear stress has recently emerged as an important regulator of pathologic vascular remodelling.Reference Haller, Crawford and Courchaine23–Reference Dolan, Kolega and Meng25 Since re-circulating low-velocity flow tends to create a large region of low wall shear stress (as in the ampulla), it appears to be primarily involved in aneurysm progression. In contrast, high-velocity flow (acting as a jet) results in a localised area of high wall shear stress (as on the lateral wall of the thoracic descending aorta), and thus is believed to primarily initiate aneurysm formation. In the case presented here, elevated TAWSS occurred at the proximal (entrance) and distal (exit) portions of the aortic isthmus. These sites of high wall shear stresses would provide a nidus at the lateral wall of the isthmus for aneurysm formation.Reference Theodore, Varma, Neema and Neelakandhan26
There are several technical limitations in this work that deserve additional consideration. In our model, the aortic wall was considered to be rigid. Therefore, our simulations do not account for effects of wall motion on boundary conditions, wall shear stress, or oscillatory shear index. Movement of the arterial wall could have an impact on the calculated values of wall shear stress. It has been shown that for instantaneous values of wall shear stress, wall motion can become important. However, when wall shear stress is time-averaged over the cardiac cycle, as we did, the influence of wall motion appears to be minimal.Reference Jin, Oshinski and Giddens27, Reference Lantz, Renner and Karlsson28 Thus, for TAWSS, as well as oscillatory shear index, a rigid wall model appears to be a good approximation for our purpose. In this study, we focused on the systolic phase of the cardiac cycle, with the aortic valve being considered rigidly open throughout. The good agreement between computational fluid dynamics simulations and magnetic resonance imaging velocity measurements in unobstructed aortas, which include moving valve leaflets,Reference Keshavarz-Motamed, Garcia and Gaillard18 indicates that this limitation would not significantly alter our conclusions.Reference Keshavarz-Motamed, Garcia and Kadem29
Computational fluid dynamics has made simulations of blood flow phenomena feasible in the clinical setting through advancements in computer technology, imaging modalities, and graphics software. There are a number of basic steps required in using cardiovascular computational fluid dynamics analysis. These include identifying the clinical problem to be investigated; creating a geometrical model of the blood flow pathway under consideration, usually from magnetic resonance imaging; defining the boundary conditions, such as pressures and flow velocities, that may be patient-specific, at the inlet(s) and outlet(s) of the computational domain; developing the mesh required for numerically solving the fluid dynamic equations, by employing commercial software such as Fluent (Ansys, Inc., Lebanon, NH, United States of America); and post-processing and visualising the results. Simulations of relatively complex pulsatile flow through various vessel arrangements can be performed on moderately priced desktop computers in a few hours. This is advantageous in a clinical setting where optimal treatments and/or surgical approaches are being planned.
Conclusions
In this study, we used endovascular stent implantation to successfully treat a patient who originally underwent repair of coarctation of the aorta by subclavian flap aortoplasty as a neonate, and subsequently presented as a young adult with an unusual form of re-coarctation, namely an aneurysmal residual ductal ampulla associated with narrowing of the aortic isthmus. Since, at cardiac catheterisation, only a minor pressure drop was measured by direct pull back across the obstruction, we employed computational fluid dynamics as a complimentary tool to more fully assess the underlying haemodynamics associated with the patient’s aortic arch anatomy, and therefore provide important information in helping to decide whether to employ catheter-directed therapy for the re-coarctation.
Pre-intervention computational fluid dynamics simulations identified two distinct pathogenic blood flow pathways to emerged in the region of the obstruction: first, upon entering the isthmus, flow separated from the aortic wall and underwent vortex formation leading to low-velocity flow, which ultimately induced low and multidirectional wall shear stress vectors (i.e., low TAWSS with high oscillatory shear index) in the ampulla, and second, upon exiting the isthmus, flow again separated from the aortic wall but now underwent jet formation leading to high-velocity flow, which eventually induced high and unidirectional wall shear stress vectors (i.e., high TAWSS with low oscillatory shear index) at sites in the descending aorta. These contrasting but pathogenic blood flow pathways are highly conducive to platelet-mediated thrombus formation in, and, of a character to promote progressive dilation of, the ductal ampulla, and can lead to increased fragility of the descending aortic wall. Such blood flow responses would place our patient, with a bicuspid aortic valve and possible aortopathy, at risk for thromboembolic events, rupture of the ampulla, and structural degeneration of the descending aortic wall.Reference Bauer, Pasic and Mayer30 Similar flow characteristics have recently been reported in association with ascending aortic aneurysms of saccular shape.Reference Siamo, Ferreira, Tomas, Fragata and Ramos31
Financial Support
This research received no specific grant from any funding agency, commercial or not-for-profit sectors.
Conflicts of Interest
None.