Implications
Greatly shortening the time interval between the two daytime milkings – in particular to confine them to the morning – may enable dairy farmers to better organize their activities and gain a better quality of life. This management would be of interest if milk production was not greatly reduced and milk composition not greatly affected. In this study, implementing 5 : 19 h milking intervals reduced milk yields by 10% and 4% when started during the ascending and the descending phase of lactation, respectively. The levels of fat, protein, somatic cells, Ca and P in the average daily milk were not affected.
Introduction
In the classic twice-daily milking (TDM) schedule of dairy cows, that is typically used by large and smaller dairy producers throughout the entire lactation, the milking times usually are early in the morning and late in the afternoon, with time ranges of 10 : 14 to 12 : 12 h time intervals between the two daily milkings. This large daily work segment is a major constraint for dairy farmers, especially those with no employees. Considered as the highest priority activity, milking sets the farmers’ time schedules, requiring them to organize all their other activities (other agricultural work, social activities, leisure, etc.) around milking. They and their families are often forced to relinquish certain activities (part-time jobs, late afternoon outings, etc.), mostly because of the afternoon milking. Greatly shortening the time interval between the two daytime milkings would relieve the milking constraint in many situations and help dairy farmers reconcile their different activities and those of their families.
In the last few decades various applied studies have been conducted on the impact of contrasting milking intervals in the TDM regime of dairy cows. Surprisingly, to our knowledge, the shortest intervals implemented have never been less than 8 h, with one exception. Only Ichikawa and Fujishima (Reference Ichikawa and Fujishima1982) have tested 6.5 : 17.5 h milking intervals compared with 11.5 : 12.5 h. They reported a slight but significant decrease in both milk and solid-no-fat yields (2.4%), and no change in fat yield.
The consequences of short (<8 h) or long (>16 h) milking intervals on milk secretion have essentially been determined in analytical experiments using specific designs: intervals tested once (Stelwagen et al., Reference Stelwagen, Farr, Nicholas, Davis and Prosser2008), or applied several times consecutively, which modifies the daily milking frequency (Schmidt, Reference Schmidt1960; Ayadi et al., Reference Ayadi, Caja, Such, Rovai and Albanell2004; Delamaire and Guinard-Flament, Reference Delamaire and Guinard-Flament2006); complete milk removal from the udder through oxytocin administration before the experimental interval in order to empty the mammary reservoirs (Schmidt, Reference Schmidt1960; Wheelock et al., Reference Wheelock, Rook, Dodd and Griffin1966); a standard 12 h milking interval preceding all the experimental intervals (Wheelock et al., Reference Wheelock, Rook, Dodd and Griffin1966; Fernando and Spahr, Reference Fernando and Spahr1983), and generally a short duration of experimentation (1 day to a few days), though not always (60 days for Villiers de and Smith (Reference Villiers de and Smith1976)). These experimental conditions differ from those met in practice and cannot provide reliable information on the effect of widely contrasting milking intervals on milk production in commercial TDM herds.
The objective of the present study was first to describe the milk production response of cows to the application of the widest range of milking intervals in the TDM schedule: from similar milking intervals (11 : 13 h) to once-daily milking (ODM) (two milkings merged). This was done in the first two experiments, after the peak of lactation. We then evaluated the 5 : 19 h milking regime in ascending and descending phases of lactation, which, in the light of the results from the first two experiments, might be a practical compromise between widely contrasting milking intervals and a moderate loss of milk. This milking regime was compared with the 10 : 14 h regime, and also to ODM, which permits the greatest reduction in the milking constraint and is marginally but increasingly implemented in France.
Material and methods
Experiments 1 and 2
Experimental design
The experiments were carried out in the INRA (Institut National de la Recherche Agronomique) experimental farm at Marcenat (002E50, 45N19; 1150 m above sea level) during late winter – early spring in 2003 (experiment 1) and 2005 (experiment 2). The same experimental scheme was applied with some differences in the milking intervals: (i) a 2-week pre-experimental period when all the cows were milked twice daily at 11 : 13 h milking intervals (routine interval), (ii) a 3-week experimental period when four milking regimes were compared: three regimes of TDM, with milking intervals of 11 : 13, 7 : 17 and 3 : 21 h in experiment 1, and 11 : 13, 5 : 19 and 2.5 : 21.5 h in experiment 2, plus an ODM group in each experiment and (iii) a 2-week post-experimental period when all the cows were milked twice daily at 11 : 13 h milking intervals.
Animals, housing, feeding and milking
Twenty cows (eight Holstein and 12 Montbeliarde; three primiparous) and 28 cows (20 Holstein and eight Montbeliarde; four primiparous) were used in experiments 1 and 2, respectively. They were housed in a tied-stall cowshed bedded with straw. In the two experiments, the cows were assigned to four groups of five and seven cows, respectively, at the end of the pre-experimental period, on the basis of breed, lactation rank, days in milk at the beginning of the experiment (44 ± 27 and 60 ± 31 for experiments 1 and 2, respectively), milk yield (26.9 ± 6.1 and 28.1 ± 5.8 kg/day) and milk composition recorded during the pre-experimental period. They were fed individually and received a limited amount of hay (3.5 and 4.3 kg/cow per day in experiments 1 and 2, respectively) from permanent grassland in the morning, hay from regrowth of permanent grassland (ad libitum) in the afternoon and a quantity of concentrate calculated weekly and individually from their expected milk yield (if they had all been milked at 11 : 13 h milking intervals) to meet their nutritional requirements (Institut National de la Recherche Agronomique (INRA), 1989). This yield was calculated for each cow from the quantity of milk produced in the pre-experimental period, applying a weekly decrease of 1.5% (primiparous cows) or 2% (multiparous cows). Cows were untied at each milking and moved to a 2 × 8 station milking parlour located in the same building as the stalls and equipped with automatic cluster removers and milk meters.
In all, four cases of clinical mastitis occurred in three cows in experiment 1 and nine in eight cows in experiment 2. No cow was discarded.
Sampling and measurements
Milk yield was automatically recorded at each milking, and milk components (fat, protein and somatic cell count (SCC)) were measured weekly (MilkoScan and Fossomatic 5000 devices; Foss electric, Hillerod, Denmark) in individual samples taken at each milking on two consecutive days. In addition, in experiment 2, milk samples were taken at each milking on day 18 of the experimental period to measure free fatty acid (FFA) content, which is taken into account in milk pricing. Samples were heated at 60°C for 30 min to destroy lipase activity and frozen for FFA content analysis (copper soap method; Jellema et al., Reference Jellema, Anderson, Heeschen, Kuzdal-Savoie, Needs, Suhren and van Reusel1991) (initial FFA).
Data analysis
The two experiments were analysed separately with the MIXED procedure of SAS (version 8.1; Statistical Analysis Systems Institute, 1999). The effect of factors was estimated by restricted maximum likelihood method (REML), and differences between means were identified using least significant differences method, based on t-test.
Average daily milk yield and composition (fat and protein content, and somatic cell count after log10 transformation) were calculated for the experimental and post-experimental periods after discarding the first 3 days of each period and analysed according to the model:

where treatment is the milking interval regime (n = 4), covariate 1 is the value of the studied variable recorded in the pre-experimental period and covariate 2 is the number of days in milk at the beginning of the experimental period. Lactation rank, breed and interactions lactation rank × treatment and breed × treatment were initially introduced, but were later removed as they were never significant. The composition of milk from individual milkings was analysed according to the model:

where treatment is the milking interval regime (n = 7), covariate is the mean daily value recorded in the pre-experimental period and cow (n = 20 or 28 for experiments 1 and 2 respectively) is the random effect. FFA content in milk from individual milkings (experiment 2) was analysed according to the model:

where treatment is the milking interval regime (n = 7) and cow (n = 28) is the random effect.
Experiment 3
Animals and experimental design
The experiment was performed on the INRA experimental farm at Orcival (002E51, 45N41; 1080 m above sea level). The 36 Holstein cows (12 primiparous) included in the experiment calved between 20 October and 22 December 2005. For the first 10 days of lactation, they were milked twice daily at 10 : 14 h milking intervals. On day 11, they were placed in three similar groups of 12 cows formed before calving, based on expected date of calving, lactation rank, expected milk yield for multiparous cows, milk yield genetic index for primiparous cows, body weight (BW) and body condition score (BCS, noted on a 0 to 5 scale) measured at return to stable (6 October 2005). Treatments consisted in (i) a group still milked twice daily at 0600 h and 1600 h (10 : 14 h group), (ii) a group milked twice daily at 0600 h and 1100 h (5 : 19 h group) and (iii) a group milked once daily at 0600 h (ODM group). These three milking regimes were implemented for the whole indoor period, until 8 May 2006 (week 25 of lactation on average). The cows were then turned out to pasture for a 5-week post-experimental period during which they were all milked with 10 : 14 h milking intervals. The experiment ended on 11 June 2006.
During the experiment, 16 cows suffered 50 occurrences of mastitis and were treated. One primiparous cow in the 5 : 19 h group was slaughtered, 5 weeks after calving, owing to a leg injury and discarded from analyses.
Housing, feeding and milking
During the indoor period the cows were housed together in a free-standing stable equipped with cubicles bedded with rubber mats and with individual troughs fitted with electronically controlled gates. Cows received, ad libitum, after the morning milking, the same total mixed ration composed of 34% maize silage, 23% grass silage, 7% hay from regrowth of permanent pasture, 31% commercial concentrate for dairy production and 5% soya bean cake, on a dry matter basis. This ration was calculated to meet the requirements of the group milked at 10 : 14 h intervals (INRA, 1989). When grazing (outdoor period), all the cows received 4 kg/day of the same concentrate. During both periods, they were milked in the same 2 × 6 station milking parlour equipped with automatic cluster removers and milk meters.
Sampling and measurements
Milk yield was recorded at each milking and energy-corrected milk was calculated according to Sjaunja et al. (Reference Sjaunja, Baevre, Junkkainen, Pedersen and Setälä1991). Milk samples were collected weekly at each milking of two consecutive days for protein, fat and lactose assays (Foss electric, Hillerod, Denmark) and SCC (see experiments 1 and 2). Other milk samples were taken at each milking: (i) on day 135 after calving, on average. Calcium and phosphorus were assayed by atomic absorption spectrophotometry. In daily samples (made up in proportion to the yield of each milking for the TDM groups), total nitrogen, non-protein nitrogen and non-casein nitrogen were assayed (Rowland, Reference Rowland1938); (ii) on day 146 after calving, on average. A sub-sample was treated as presented for experiment 2 for initial FFA content, and another sub-sample was stored at 4°C for 24 h, heated at 60°C for 30 min and then frozen for FFA24 analysis (Cartier and Chilliard, Reference Cartier and Chilliard1989). Difference between FFA24 and initial FFA is milk lipolysis.
Blood samples were collected from the tail vein 4 h after the morning milking, once in every 4 weeks from day 30 ± 9 after calving. Plasma was immediately separated by centrifuging and frozen for lactose analysis using colorimetric enzymatic reactions (kit for lactose/D-lactose; Scil Diagnostics GmbH, Meylan, France).
Individual dry matter intake (DMI) was measured indoors, 4 days a week. BW (double weighing in the first week following calving) and BCS were recorded once in a month.
Data analysis
The data were analysed with the MIXED procedure of SAS (version 8.1) as for experiments 1 and 2. Average daily milk yield and composition (fat, protein, lactose, SCC), DMI, BW and BCS recorded during the experimental and post-experimental periods were analysed according to the model:

where treatment is the milking interval regime (n = 3), lactation rank has three classes (1, 2, 3 or more), covariate 1 is the number of weeks spent by each cow in the experimental milking regime (introduced to take into account that cows calved in a range of 9 weeks but were turned out to grass on the same day), covariate 2 is either the value of the variable studied, measured in the pre-experimental period, or genetic index for fat and protein content of milk. In the study of fat and protein yield in milk, recorded milk yield in the pre-experimental period (covariate 3) was added to covariate 2 (genetic index). There was no genetic index for lactose and SCC analysis. The interaction lactation rank × regime was initially introduced in the model, but was removed as it was never significant. Lactose concentration in blood plasma, measured four times, was analysed according to the model:

where treatment is the milking interval regime (n = 3), lactation rank has three classes (1, 2, 3 or more), sampling number has four classes and cow (n = 35) is the random effect. FFA content of milk was analysed as for experiment 2 and the composition of milk from individual milkings was analysed as for experiments 1 and 2.
Results
Experiments 1 and 2
Milk yield
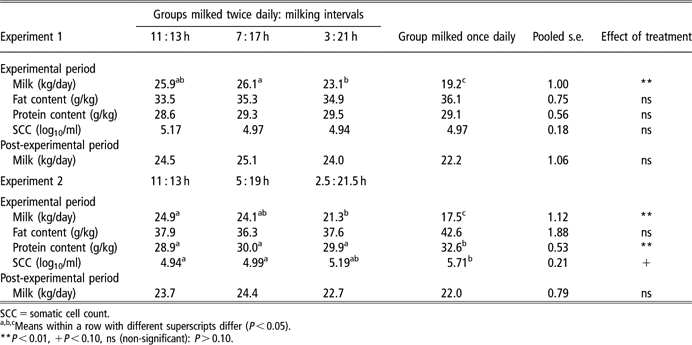
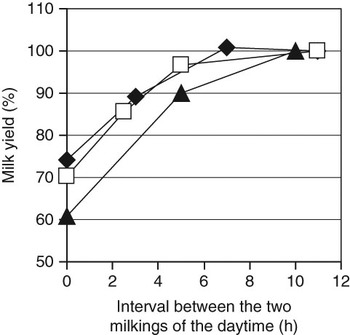
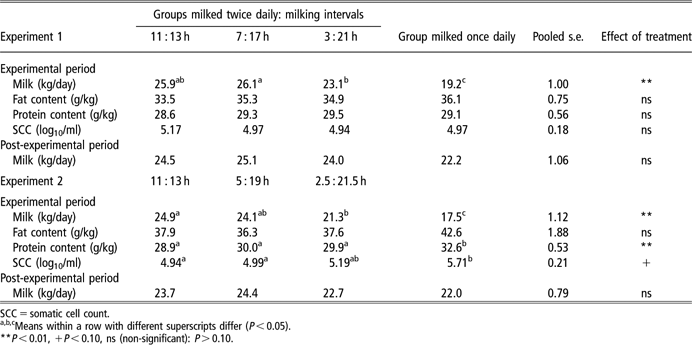
The daily milk yield of groups 7 : 17 and 5 : 19 h in experiments 1 and 2, respectively, compared with the group 11 : 13 h, did not differ significantly (Table 1 and Figure 1). Further decreasing the smaller time interval to 3 h or 2.5 h caused a significant reduction in daily milk yield, whereas ODM caused a further decrease. On average for the two experiments, and according to adjusted means (Table 1) or their interpolated values, the decrease in milk yield was 4.1% and 11.5% for 5 : 19 and 3 : 21 h milking intervals, and 28% for ODM. In the TDM groups, the milk yield at the end of the longest milking interval (21 h in experiment 1, and 21.5 h in experiment 2) was numerically higher (by 0.6 kg and 2.2 kg respectively; P > 0.10) than the milk yield of the ODM group (after 24 h secretion).
Effect of the milking intervals in the three groups milked twice daily, and of once-daily milking on the daily milk yield and composition (adjusted means; experiments 1 and 2 were performed in the descending phase of lactation; experimental periods were 3 weeks. Post-experimental periods were 2 weeks)
SCC = somatic cell count.
a,b,cMeans within a row with different superscripts differ (P < 0.05).
**P < 0.01, +P < 0.10, ns (non-significant): P > 0.10.
Effect of the time interval between the two milkings of the daytime and of once-daily milking on the daily yield of milk expressed as percent of the yield in the group milked with the 11 h interval (experiment 1: ⧫; experiment 2: □) or the 10 h interval (experiment 3: ▴). The figure was constructed from the data for milk yield (adjusted means) presented in Tables 1 and 2. Each point is the ratio (%) of adjusted means and has no variability.

In the post-experimental period, daily milk yield was no longer different across the four groups. The yield of the ODM group during the experimental period remained lower by 2 kg/day on average (P = 0.15 for both experiments; Table 1).
Milk composition
In the average daily milk, for both experiments, the three TDM groups did not show any differences between them in the fat and protein contents, and SCC (Table 1). In experiment 2, ODM group had higher protein content than the three TDM groups and a higher SCC than the 11 : 13 and 7 : 17 h TDM groups.
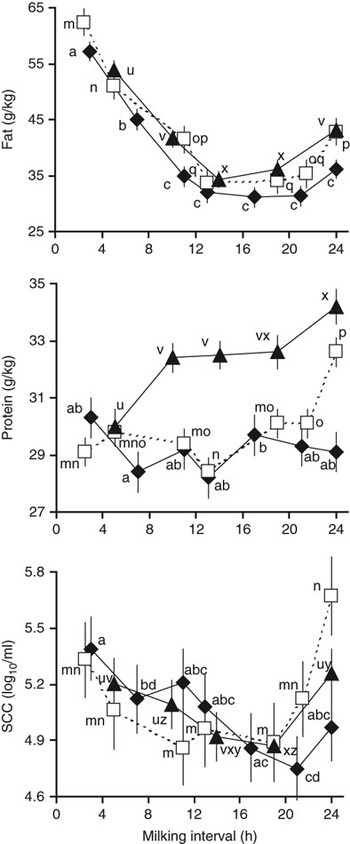
With regard to milk collected at each milking, fat content decreased rapidly (see significances in Figure 2) from about 60 to 30–35 g/kg as milking interval increased from 2.5 to 3 h up to about 12 h. Beyond this interval, milk fat content changed little (experiment 1) or tended to increase, in particular for the 24 h interval. SCC showed a similar trend (Figure 2). Protein content did not change steadily, but in experiment 2 it was significantly higher for the 24 h interval than for all the other intervals (Figure 2). The FFA content (measured in experiment 2) decreased linearly on average from 1.15 to 0.38 mEq/100 g fat as the milking interval increased from 2.5 h to 24 h (r = −0.66, P < 0.01).
Effect of the duration of the secretion preceding the milking on the fat and protein content, and SCC of the milk harvested at this milking (adjusted means and standard errors; experiment 1: ⧫; experiment 2: □; experiment 3: ▴). For each component (fat, protein and SCC) and each experiment (1, 2 and 3), each value is assigned a letter (letters) placed close to it. Letters a to d were used for experiment 1, letters m to q for experiment 2 and letters u, v, x, y and z for experiment 3. The values that do not share a common letter are significantly different (P < 0.05).

Experiment 3
Milk yield
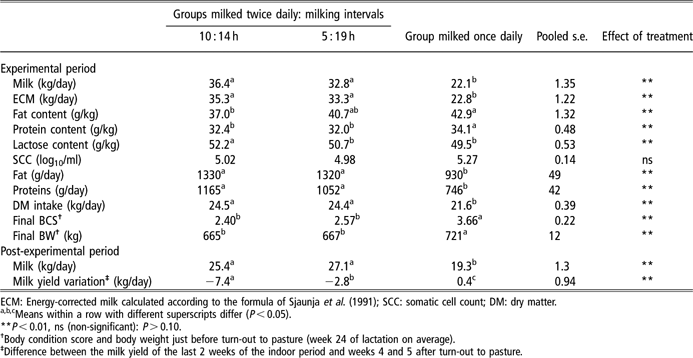
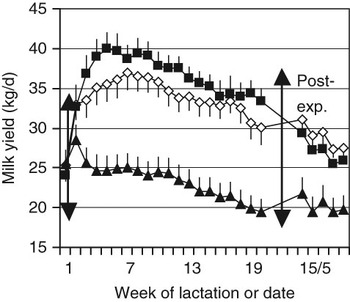
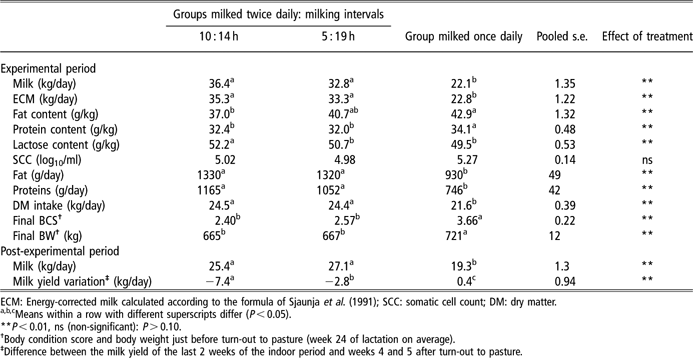
The milk yields of groups 5 : 19 h or ODM, compared with group 10 : 14 h, were lower by 3.5 kg/day (10%; P = 0.08) and 14.3 kg/day (40%; P < 0.01), respectively (Table 2 and Figure 3). Differences were less marked when expressed in energy-corrected milk: 2.0 kg/day (5.7%; P = 0.26) and 12.5 kg/day (35.4%; P < 0.01), respectively. When the ODM group was dropped from the statistical analysis, milk yield difference between the 10 : 14 and 5 : 19 h groups (3.8 kg/day) was significant (P = 0.04). As in experiments 1 and 2, the quantity of milk harvested after 19 h secretion in the 5 : 19 h group was numerically higher (by 2.3 kg; P > 0.10) than the milk yield of the ODM group. The differences in daily milk yield between the three groups of cows remained constant from the 2nd month of lactation up to the turn-out to pasture (6th month of lactation, on average) (Figure 3). The relationship between the milk yields in the pre- and experimental periods was high and significant for groups 10 : 14 and 5 : 19 h (r = 0.79, P < 0.01 and r = 0.69, P < 0.05, respectively), but low and not significant for group ODM (r = 0.37).
Effect of the milking intervals in two groups milked twice daily, and of once-daily milking on the daily milk yield and composition, and some nutritional indices (adjusted means; experiment 3 was performed from the second week of lactation upto the 25th week, on average)
ECM: Energy-corrected milk calculated according to the formula of Sjaunja et al. (Reference Sjaunja, Baevre, Junkkainen, Pedersen and Setälä1991); SCC: somatic cell count; DM: dry matter.
a,b,cMeans within a row with different superscripts differ (P < 0.05).
**P < 0.01, ns (non-significant): P > 0.10.
†Body condition score and body weight just before turn-out to pasture (week 24 of lactation on average).
‡Difference between the milk yield of the last 2 weeks of the indoor period and weeks 4 and 5 after turn-out to pasture.
Experiment 3. Milk yield (kg/day; arithmetical means and standard errors) of the three groups of cows (10 : 14 h milking interval: ▪; 5 : 19 h milking interval: ◊; once daily milking: ▴) for the first 20 weeks of lactation (common to all cows) and the first 5 weeks after turn-out to pasture. To the left of the left vertical arrow (day 1 to 10 after calving), the three groups were milked twice daily at 10 : 14 h intervals (pre-experimental period); to the right of the right vertical arrow, the three groups were at pasture and milked twice daily at 10 : 14 h intervals (post-experimental period).

During the post-experimental period, daily milk yields of the two groups milked twice daily during the experimental period were no longer different (Table 2). Milk yield of the previously ODM group made up about half the difference from the 10 : 14 h group (Figure 3) but remained lower by 24% (P < 0.05).
Milk composition
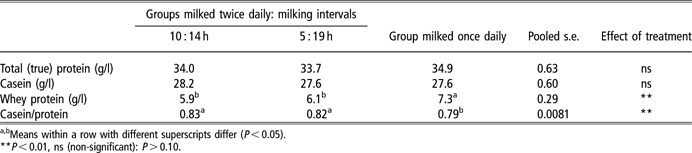
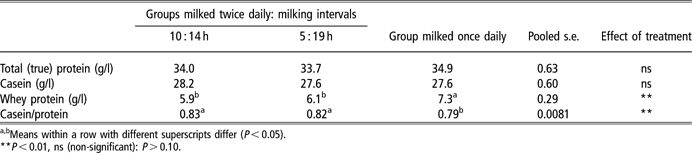
In the average daily milk, fat and protein contents were (or tended to be) higher for the ODM group than for both TDM groups; the reverse was observed for lactose content (Table 2). Casein content was not different across the three groups (Table 3), but the whey protein content was higher for the ODM group than for the two TDM groups, by 1.3 g/kg (22%; P < 0.01) on average. Daily fat yields were identical for the 10 : 14 and 5 : 19 h groups (Table 2). Protein yield was 9.6% lower for the 5 : 19 h group than for the 10 : 14 h group (P = 0.07). Both yields were lower in the ODM group than in the two other groups.
Effect of the milking intervals in the two groups milked twice daily, and of once-daily milking on the content of protein, casein and whey protein in the daily milk (experiment 3; adjusted means)
a,bMeans within a row with different superscripts differ (P < 0.05).
**P < 0.01, ns (non-significant): P > 0.10.
For a given milking, milk content in fat, protein and SCC changed with the milking interval in a similar manner as in experiments 1 and 2 (Figure 2). Initial FFA content was not significantly related to milking interval, but FFA lipolysis declined on average from 0.29 to 0.15 mEq/100 g fat as milking interval increased from 5 h to 24 h (r = −0.47, P < 0.01). Total calcium and phosphorous contents ranged from 1.08 to 1.13 g/l and 1.00 to 1.10 g/l respectively between the different groups, and were not related to the milking interval.
Nutritional indices and udder performance
DMI during the experimental period, and BW and BCS at the end of experimental period were similar for the 10 : 14 and 5 : 19 h groups (Table 2). Group ODM showed a lower DMI than either of the TDM groups (by 2.8 kg of dry matter/day), and significantly higher final BW and BCS. Blood plasma level of lactose decreased with the advancement of the stage of lactation (by 0.043 mg/l per day between day 30 and day 120; P < 0.01). It was higher for the ODM group than for the 10 : 14 h group (19.4 v. 15.4 mg/l respectively; P < 0.05); the value for the 5 : 19 h group (16.6 mg/l) was intermediate and did not differ from the other two groups. In the ODM group, blood plasma level of lactose was not related to the milk yield difference between the pre-experimental and the experimental period.
Discussion
Although a powerful experimental design, including a pre-experimental period, was used in the three experiments, some expected differences between treatments failed to be significant. This results from the high variability in the response of cows to the long milking intervals. In experiment 3, pre- and experimental milk yields were not significantly related in the ODM group, and pre-experimental milk yield, used as a covariate in the milk yield analysis, was not significant. Consequently, the difference of 3.5 kg milk between the two TDM groups was not significant (P = 0.08) when the three groups were analysed together. To palliate this variability, more cows per treatment should have been used.
Milk yield
General effect of contrasting intervals of milking
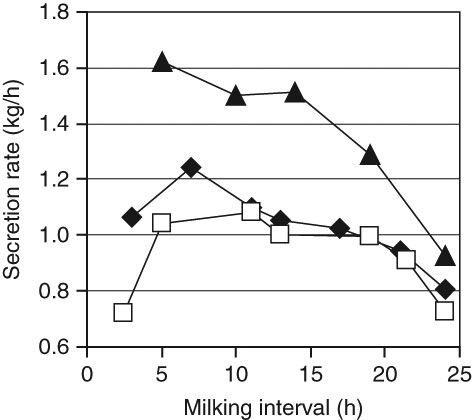
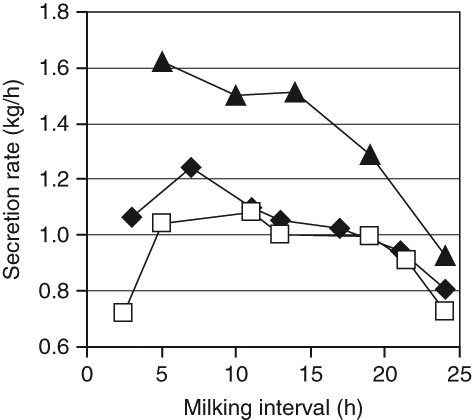
The daily milk yield reduction for the 5 : 19 h milking schedule was modest (4.1%) in experiments 1 and 2, in agreement with the 2.4% recorded for 6.5 : 17.5 h intervals by Ichikawa and Fujishima (Reference Ichikawa and Fujishima1982). It results from the slow decrease in the hourly milk secretion rate up to a milking interval of about 19 h (Figure 4), which seems less marked than the losses recorded in analytical conditions (8% to 12% for milking interval of 16 h to 20 h; Schmidt, Reference Schmidt1960; Wheelock et al., Reference Wheelock, Rook, Dodd and Griffin1966; Delamaire and Guinard-Flament, Reference Delamaire and Guinard-Flament2006). In our TDM groups, long milking intervals alternated with short ones, which may have tempered their detrimental effects on milk secretion rate (Turner, Reference Turner1955; Wheelock et al., Reference Wheelock, Rook, Dodd and Griffin1966). This alternation of long and short milking intervals might also explain the higher milk yield (1.9 kg for the three experiments pooled; P = 0.08) recorded after the longest milking intervals in the TDM groups (19 h to 21.5 h) compared with the 24 h interval in ODM. The doubled number of milkings in the TDM schedule compared with ODM may have supported the activity of mammary tissue more through hormonal action (see Lollivier et al. (Reference Lollivier, Guinard-Flament, Ollivier-Bousquet and Marnet2002) and Boutinaud et al. (Reference Boutinaud, Guinard-Flament and Jammes2004)).
Apparent milk secretion rate (kg/h) for the different milking intervals (experiment 1: ⧫; experiment 2: □; experiment 3: ▴). Each point is the ratio of the quantity of milk (kg, mean for the group) harvested at each milking on the duration of secretion before the milking (h).
Effect of early lactation
For the 5 : 19 h milking regime, the higher loss of milk recorded in experiment 3 (which included early lactation) than in experiments 1 and 2 conducted in the declining phase (10% v. 4%) suggests an effect of stage of lactation. These data are consistent with our observations on ODM: a milk loss of 30% to 45% when it was implemented before peak of lactation, but 20% to 30% afterwards (Rémond and Pomiès, Reference Rémond and Pomiès2005). Down-regulation of milk secretion in response to increasing milking interval occurs from shorter milking interval in early lactation compared with the descending phase (Figure 4). This may result from a lower capacity of the udder to enlarge its capacity for storing milk in early lactation, leading to greater alveolar distension (cf. Davis et al., Reference Davis, Farr and Stelwagen1999). It must be emphasized that whatever the stage of lactation when contrasting milking intervals were implemented, no residual loss of milk was observed after resumption of conventional milking intervals. This contrasts with the residual losses observed after only about 2 weeks of ODM implementation, mainly in early lactation (Rémond and Pomiès, Reference Rémond and Pomiès2005).
Between-cows variability
The declining coefficient of correlation between the pre- and experimental milk yields for groups 10 : 14 h, 5 : 19 h and ODM (r = 0.79, 0.69 and 0.37, respectively) in experiment 3 suggests that as the milking intervals become more unequal, the milk yield of the cows depends less and less on their milk yield capacity (appraised by the milk yield on a conventional milking regime) and more and more on their tolerance to long milking intervals. This tolerance (appraised by percentage loss of milk) is not related to their milk yield capacity (Hansson et al., Reference Hansson, Claesson, Brannang and Gustafsson1958; Wheelock et al., Reference Wheelock, Rook, Dodd and Griffin1966) and shows a wide between-cow variability (coefficient of variation of 29%, for a mean loss of milk of 27%, in a set of 237 cows switched from a conventional TDM regime to ODM; Rémond and Pomiès, Reference Rémond and Pomiès2005). This explains the non-significant relation between the pre- and experimental milk yields in the ODM group of experiment 3. This tolerance does not seem to be related to the increased permeability of the udder (appraised by the lactose content in blood) since this content was not correlated to the percentage loss of milk in ODM group of experiment 3 (r = 0.07). For Knight and Dewhurst (Reference Knight and Dewhurst1994), this tolerance to long milking intervals is positively related to the proportion of milk stored in the cistern.
Milk composition
Fat content
The milk stored in the udder just before milking is the sum of (i) the residual milk (rich in fat) left at the end of the preceding milking in proportion to the quantity of milk in the udder before the milking (Turner, Reference Turner1955) and (ii) the milk (medium fat content) secreted between the two milkings. As the milking interval increased from 2.5–3 h to 12–15 h, the first fraction decreased, while the second one increased, the two effects jointly lowering the fat content in the harvested milk (Figure 2). This trend should have continued up to the longest milking intervals (19 to 21.5 h, according to the experiment), but it was increasingly thwarted by the earlier slowdown of the lactose secretion rate compared with the fat secretion rate, beyond a milking interval of 15 to 18 h (Wheelock et al., Reference Wheelock, Rook, Dodd and Griffin1966). Consequently, milk fat content ceased to decrease and even increased, as previously described by Wheelock et al. (Reference Wheelock, Rook, Dodd and Griffin1966). This increase was magnified for the 24 h interval (Figure 2), as often recorded (Davis et al., Reference Davis, Farr and Stelwagen1999; Rémond and Pomiès, Reference Rémond and Pomiès2005). Although the fat content varied widely according to the milking interval, its value in average daily milk varied little between the TDM regimes, because high fat contents were associated with short milking intervals and low milk yields.
Somatic cell count
The dilution of residual milk by newly secreted milk probably also accounts for the progressive lowering of SCC as milking interval increased (Figure 2). Such a trend has previously been observed in cows (Fernando and Spahr, Reference Fernando and Spahr1983; O’Brien et al., Reference O’Brien, O’Connell and Meaney1998), and is consistent with the observations of a higher SCC in alveolar milk (McKusick et al., Reference McKusick, Thomas, Berger and Marnet2002; in ewes) or residual milk (Vangroenweghe et al., Reference Vangroenweghe, Dosogne and Burvenich2002) than in cisternal milk. These results, in addition to the comparable size of somatic cells and fat globules, suggest that somatic cells are partly sequestered in alveoli and small vessels, like fat globules. However, the trend in SCC shows two differences from that of fat content: (i) it continues up to the longer interval in the TDM regime (except for experiment 2), suggesting an exclusive effect of the ratio: residual milk/newly secreted milk; (ii) the rise in SCC in ODM group compared with the longest milking interval in TDM regime (Figure 2) may be related to a higher tight junction permeability – attested by the increased lactose content in blood in experiment 3 – and a mild inflammatory response of the udder (Davis et al., Reference Davis, Farr and Stelwagen1999).
Protein content
The lack of variation in protein content in the milk of milking for most milking regimes and intervals, except for 24 h, has two causes: (i) the secretion of casein (80% of milk protein) is sensitive to the lengthening milking interval similarly to lactose (Wheelock et al., Reference Wheelock, Rook, Dodd and Griffin1966) and (ii) casein content is the same in alveolar and cisternal milk (Ayadi et al., Reference Ayadi, Caja, Such, Rovai and Albanell2004). The increased protein content in the ODM group results from higher whey proteins (Table 3), probably due to leakage of serum proteins from blood into milk (Stelwagen et al., Reference Stelwagen, Farr, McFadden, Prosser and Davis1997). A positive effect of improved energy balance of the cows (cf. Coulon and Rémond, Reference Coulon and Rémond1991) attested in the ODM group of experiment 3 by the higher BW and BCS at the end of the experimental period, cannot be ruled out.
In milk from milking, the decrease in initial FFA content (experiment 2) and lipolysis (experiment 3), as milking interval increased, is consistent with previous observations (Suhren et al., Reference Suhren, Hamann, Heeschen and Tolle1981; Wiking et al., Reference Wiking, Nielsen, Bavius, Edvardsson and Svennersten-Sjaunja2006; Rémond and Pomiès, Reference Rémond and Pomiès2005).
Conclusion
Our results suggest that it is possible to milk relatively high-yielding cows using twice-daily milking schedules with much wider time intervals than typically used, without marked losses in milk production when applied either during the ascending or descending phase of lactation. These encouraging results were recorded in only a small number of cows and in limited situations of nutrition and management. Further work is now required on larger numbers of cows and in other husbandry contexts.
Acknowledgements
The authors thank P. Pradel and the technicians at the experimental farms of Marcenat and Orcival (INRA) for management of the experiments and care of the cows, and the GALA association (35150, Janzé, France) and the Agence de Développement Agricole et Rural (ADAR) for their financial support.