INTRODUCTION
The blue jack mackerel Trachurus picturatus (Bowdich 1825) has a broad geographic distribution in the eastern Atlantic, from the southern Bay of Biscay to north-west Africa, including the Macaronesian archipelagos, Mediterranean Sea and Black Sea, and it also occurs in the south Atlantic around Tristan da Cunha and Gough Islands (Smith-Vaniz, Reference Smith-Vaniz, Whitehead, Bauchot, Hureau, Nielson and Tortonese1986). It is a pelagic fish species which occurs on the continental shelf, as well as around offshore islands, banks and seamounts down to 400–500 m depth (Menezes et al., Reference Menezes, Sigler, Silva and Pinho2006, Reference Menezes, Rosa, Melo and Pinho2009). However, different size structures have been observed between island shelf and offshore areas, with the former functioning as nursery or growth zones, while the seamount/bank offshore areas are important feeding zones where adults predominate (Menezes et al., Reference Menezes, Sigler, Silva and Pinho2006).
Trachurus picturatus is an important fishery resource, especially in the Macaronesian islands of Azores and Madeira, where it is the main pelagic fish species caught in artisanal fisheries. In the Macaronesian region, the main catches are those from multi-species artisanal fleets using purse seine nets (Vasconcelos et al., Reference Vasconcelos, Alves, Gouveia and Faria2006; Jurado-Ruzafa & Santamaría, Reference Jurado-Ruzafa and Santamaría2013). In the Azores, T. picturatus is the only species of the genus Trachurus that occurs in the region, and is exploited by various fleets and métiers. The main catches are from the artisanal fleet that operates with several types of surface nets, the most important being the purse seine. Purse seines are also used by the tuna bait boat fleet, which targets the blue jack mackerel as live bait for tuna. The multi-species demersal fleet, composed of vessels using longlines and a variety of handlines, also has as by-catch blue jack mackerel. Purse seiners usually target juveniles in island shelf areas, while bottom longliners may target adults around seamounts. It is also a popular species among the Azorean shore anglers that fish along the coasts of all the islands (Diogo & Pereira, Reference Diogo and Pereira2014).
Azorean landings of T. picturatus were considerably higher during the 1980s, however changes in the local markets led to a strong reduction in the catches afterwards. This reduction was also accompanied by a sharp decrease in the fleet targeting small pelagic fishes. Since 1990, the catches have been at a more stable level, in part due to self regulation adopted by the fishermens' associations due to market restrictions. Continuous reductions in consumer demand led to the catch limits adopted by the fleet, which explains the reduced catches observed in recent years. During the past 5 years the total estimated catches of blue jack mackerel per year in the Azores were around 1850 tonnes while the landings averaged 1200 tonnes (ICES, 2012). Studies conducted by ICES (2012) showed that the relative abundance of blue jack mackerel in the Azores had a stable trend based on a standardized catch per unit effort (CPUE) index, with the results of a production model showing a probability of 0.79 that the stock was not overfished and not undergoing overfishing.
The knowledge of the life-history parameters and ecological characteristics of fish species can greatly assist management strategies because responses to exploitation are partly determined by their adaptive suite of attributes (King & McFarlane, Reference King and McFarlane2003; Winemiller, Reference Winemiller2005). It provides a general means to predict the demographic resilience and production potential. The establishment of morphometric relationships is fundamental for the calculation of production and biomass of a fish population. The study of the age and growth are essential to understand the population dynamics. The aspects of the reproductive biology such as spawning season and the analysis of the evolution of maturity stages together with the age structure are fundamental to determine the age at first maturity and the age at first capture. Thus, integrating aspects of morphometrics, age, growth and reproduction provide important biological information for assessment and management. The rational management of this stock is also important as this species may play an important role in the surrounding ecosystem as T. picturatus can be an important prey for a variety of taxa, such as demersal and coastal pelagic fish (Morato et al., Reference Morato, Solà, Grós and Menezes1999; Barreiros et al., Reference Barreiros, Morato, Santos and Borba2003), cephalopods (Martins, Reference Martins1982), marine seabirds (Xavier et al., Reference Xavier, Magalhães, Mendonça, Antunes, Carvalho, Machete, Santos, Paiva and Hamer2011) and marine mammals (Quérouil et al., Reference Quérouil, Silva, Cascão, Magalhães, Seabra, Machete and Santos2008). Therefore, an accurate management of T. picturatus population is required as it may affect the food web structure due to trophic cascade effects.
Despite the historical importance of the Azorean fishery for T. picturatus, very little is known about the population parameters for this wide-ranging area in the north-east Atlantic (ICES area Xa2). Few previous studies have focused on estimating population parameters of T. picturatus from the eastern Atlantic, including age, growth, morphometric and reproductive aspects (Isidro, Reference Isidro1990; Jesus, Reference Jesus1992; Vasconcelos et al., Reference Vasconcelos, Alves, Gouveia and Faria2006). For the Azores, the only study carried out on this species was conducted by Isidro (Reference Isidro1990), and this study compared ages estimated from sectioned and whole otoliths, and provided information on weight-length relationships and the reproductive cycle.
In this context, the objectives of the present study were to estimate population parameters of T. picturatus from north-east Atlantic waters (ICES area Xa2), namely the morphometric relationships, age composition, growth rate, maturity and spawning season. This study aimed to update the results obtained by Isidro (Reference Isidro1990), including an increased sample size, verification of the periodicity of growth increments on T. picturatus otoliths, back-calculation of the age and obtaining updated growth and reproductive parameters.
MATERIALS AND METHODS
Study area and data collection
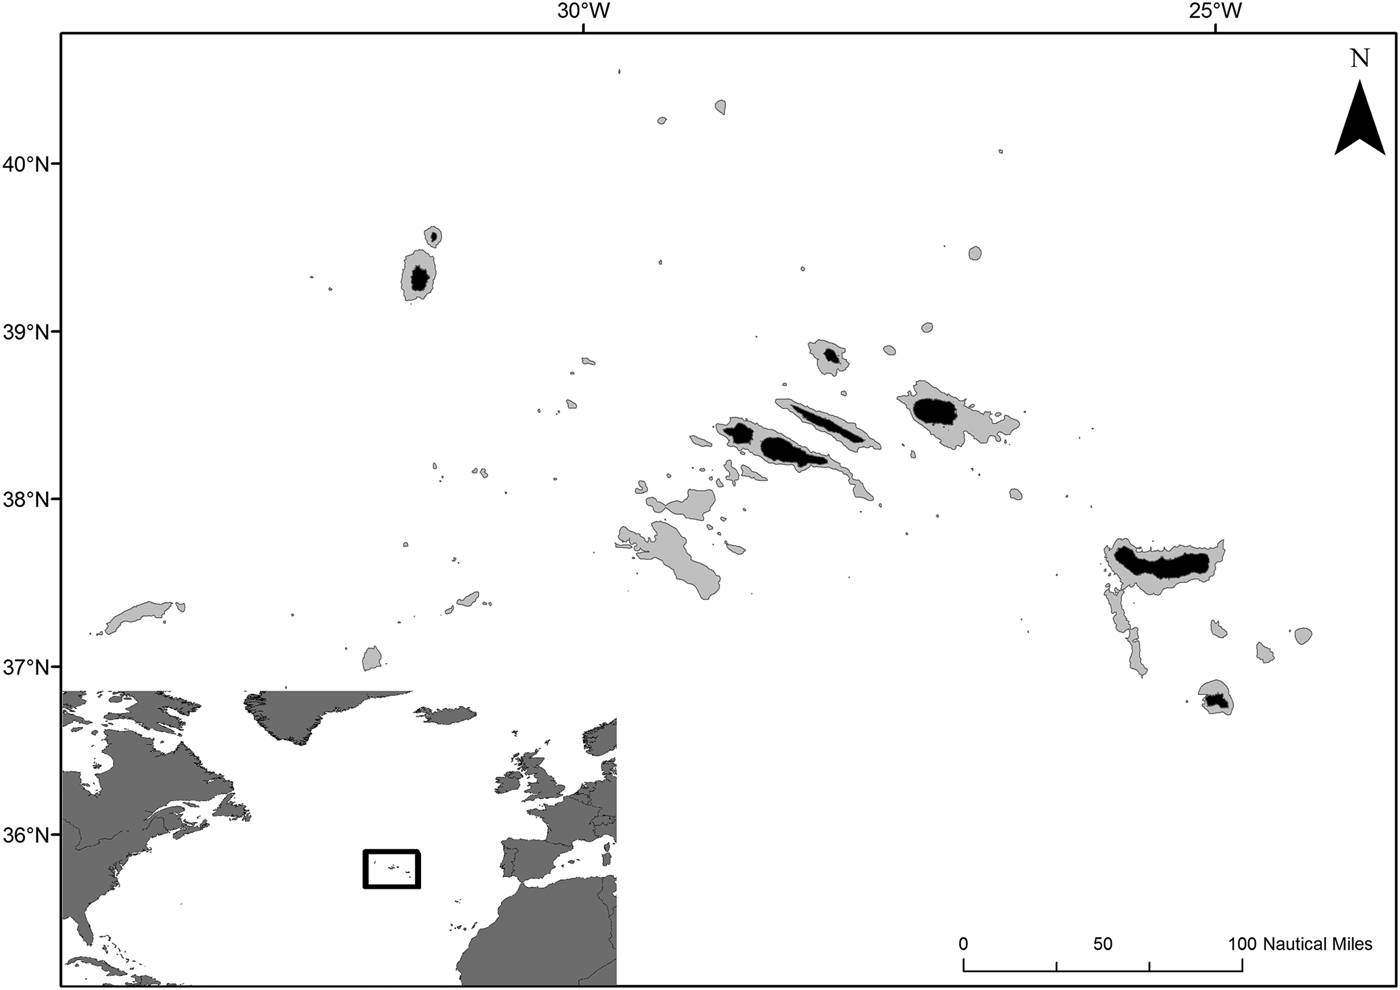
Monthly samples of Trachurus picturatus were collected within the Portuguese fisheries data collection framework between 1998 and 2011. Specimens were caught by the artisanal Azorean fleet working with two different fishing gears, namely bottom longline (90%) and purse seine (10%), in the whole Azorean Economic Exclusive Zone (EEZ), ICES area Xa2 (Figure 1).
Geographic distribution of the catches of Trachurus picturatus by the artisanal fleet in the north-east Atlantic waters (ICES area Xa2). Grey region around the islands (black) represents the 600 m bathymetric.

All individuals were measured for the total (L T), fork (L F) and standard length (L S) to the nearest millimetre and weighed for total (W T) and eviscerated weight (W E) to the nearest milligram. Each specimen was sexed and the gonads were weighted (W G) to the nearest centigram and classified according to the maturity scale defined by Macer (Reference Macer1974), adapted to 10 stages (Appendix I). The sex and maturity stage of each specimen were determined by macroscopic analysis of the gonads. The saggittal otoliths were removed from each sampled specimen, cleaned, dried and stored in Eppendorf tubes for subsequent reading.
Linear regression analysis was used to estimate the length-length relationships (L = a + bL) between the variables L T, L F and L S without any data transformation and the length-weight relationships (W = aL b) between variables L T, L F, L S, W T and W E with natural logarithm transformation of data. Parameters a and b of the relationships were estimated with the least square method and the association degree between variables was calculated by the coefficient of determination (r 2). The t-test (Sokal & Rohlf, Reference Sokal and Rohlf1987) was used to compare the obtained b values (i.e. regression slopes) between sexes.
AGE ESTIMATION, VALIDATION AND GROWTH MODELLING
For age and growth studies, otoliths collected between 1998 and 2007 were used and the individuals grouped in 5 mm size classes. However, the overall measures of each otolith (total radius and annuli radius) were taken only from the otoliths collected between 2005 and 2007.
Age reading was done by immersing the whole left otolith from each pair in 1:1 glycerin (87%) and ethanol (96%) solution under compound microscope with amplification between 12.5 and 20×. Otoliths were observed under reflected light and dark background with sulcus acusticus placed downwards, so dark (hyaline) and white (opaque) rings could be seen in alternate positions. Ages were estimated from reading digital images taken with the camera DC300 and analysed with IM500 software. Hyaline rings corresponding to true annuli were counted preferentially along the posterior (post-rostrum) axis but ring continuity was checked along the anterior (rostrum) axis and the dorso-lateral edge. Each otolith was read twice by the same reader about 2–3 months apart with no knowledge of fish length, sex and previous readings. When there was not an agreement between counts of hyaline rings, otoliths were read for a third time. If agreement could not be reached, those otoliths were excluded from further analysis.
The time and periodic trends of annulus formation was studied following mean marginal increment ratio (MIR), according to the formula (Tserpes & Tsimenides, Reference Tserpes and Tsimenides1995):
 $${\rm MIR}={{\lpar S - {r_n}\rpar } / S}\comma \;$$
where S is the otolith radius and r n the radius of the most recent annulus. When measurements were taken from otoliths they were always performed along the posterior axis. The mean MIR (±SD) was computed by month and age group, for sexes combined. Specimens estimated to be younger than 3 years and older than 12 years were not included in the MIR analysis due to the lack of sufficient number of samples. Analysis of variance (ANOVA) was used to test for differences in the monthly MIR values along the year and the Student–Newman–Keuls (SNK) multiple comparisons tests used to assess differences between pairs of months.
Estimated age of the specimens collected between 1998 and 2007 was used to model the growth according to the von Bertalanffy growth function, expressed as:
 $${L_F}={L_\infty }\lpar 1 - {{\rm e}^{ - k\lpar t - {t_0}\rpar }}\rpar \comma \;$$
where L ∞ is the asymptotic length, k is the growth coefficient and t 0 is the theoretical age when L F = 0.
The von Bertalanffy growth model was fitted to the observed and back-calculated length-at-age data. Growth parameters for males, females and sexes combined were estimated iteratively using the ‘Gauss-Newton’ algorithm for non-linear least squares estimation (Bates & Chambers, Reference Bates, Chambers, Chambers and Hastie1992).
The back-calculation analysis (Francis, Reference Francis1990) was performed with the estimated age and the measured otoliths collected between 2005 and 2007. To back-calculate length at previous ages the relationship between S and LF data was achieved through power function analysis (L F = aS b) (Ehrhardt, Reference Ehrhardt1992). The relationship parameters (a and b) were estimated by the nonlinear least squares method and together with the distance from the focus to each annulus were used to estimate the length-at-age using the Monastyrsky formula (Bagenal & Tesch, Reference Bagenal, Tesch and Bagenal1978):
 $${L_{Fn}}={\lpar {{{S_n}} / S}\rpar ^b}{L_F}\comma \;$$
where L Fn = L F when the annulus n was formed; L F = length at the time of capture; b = the exponent of the regression of L F on S and S n = distance from the otolith focus to annulus n. Sex differences in the L Fvs S relationships were tested for equality of slopes by means of Analysis of Covariance (ANCOVA) (Dixon & Massey, Reference Dixon and Massey1985). Differences in mean length estimated for males and females were tested using the Student's t-test (Zar, Reference Zar1996). The von Bertalanffy growth curves obtained for males and females were compared using the F-test and the growth parameters estimated by otolith reading and back-calculation were compared using the Student's t-test (Zar, Reference Zar1996). Statistica 6.0 (StatSoft Inc., 2001) software was used for all statistical procedures and all statistical inference was based on ±95% confidence interval.
Reproductive cycle and maturity
For reproduction studies, the samples collected between 2002 and 2011 were used. A total of 880 female and 1035 male gonads were classified and used to fit length-based maturity ogives. The spawning period was identified following the mean monthly trend of the relative frequency of the spawning specimens (maturity stages VI for males and females) and the gonadosomatic index (I G) that was computed according to the formula:
 $${I_G}=\lpar {{GW} / {{W_E}}}\rpar \times 100$$
Analysis of variance (ANOVA) was used to test for differences in the monthly I G values along the year within each sex and the Student–Newman–Keuls (SNK) multiple comparisons tests used to assess differences between pairs of months.
The proportion of mature individuals was estimated for size classes of 5 mm and sex to fit length base maturity ogives and to estimate the mean size at first maturity, the mean size at which 50% of the fish become mature (Batts, Reference Batts1972). The logistic curve was fitted by non-linear least squares regression, according to:
 $${P_{LF}}=\lpar 1/1+{{\rm e}^{ - b\lpar {L_F} - {L_{50}}\rpar }}\rpar$$
where P LF is the proportion of mature individuals in the size class L F, b the slope and L 50 the size at which 50% of individuals are mature. According with Macer's scale (Appendix I), individuals were considered mature between macroscopic stages VI–VIII for males and females. Age at first maturity was calculated by applying the growth equation to the estimated size at first maturity.
RESULTS
Sample characteristics
A total of 2895 specimens were sampled, 1204 females (41.6%), 1334 males (46.1%) and 357 immature (12.3%). The size ranges of these samples were 125–498 mm L F (mean = 319 mm, SD = 85 mm) for females, 100–542 mm L F (mean = 307 mm, SD = 92 mm) for males and 98–170 mm L F (mean = 123 mm, SD = 11 mm) for immature specimens.
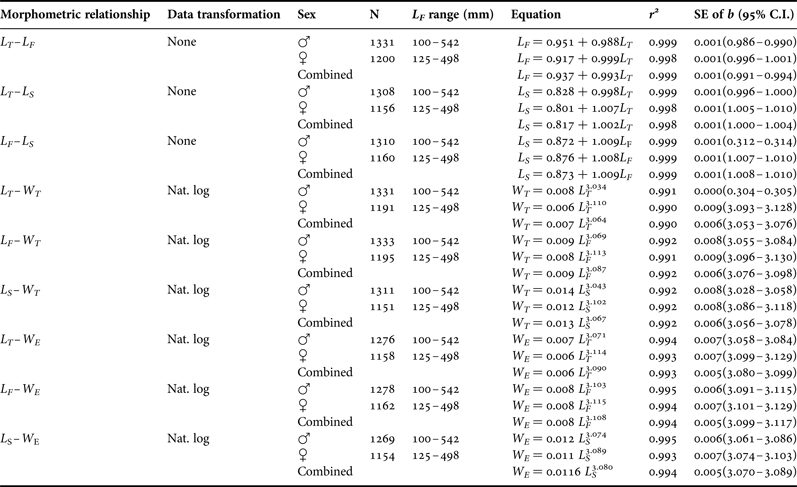
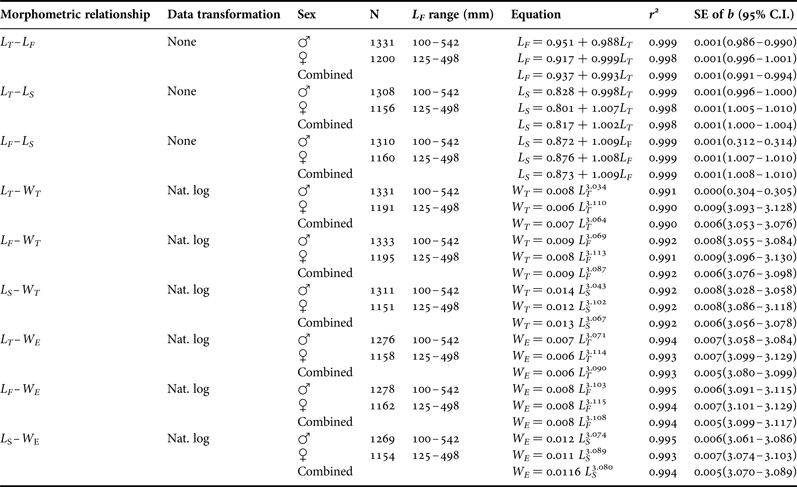
The morphometric relationships established between L T, L F, L S, W T and W E for Trachurus picturatus from north-east Atlantic (ICES area Xa2) are given in Table 1. Significant correlations (high determination coefficient, r 2 > 0.9) were found for all relationships. The comparison between sexes using pooled data showed that all relationships were significantly different (t-test: P < 0.001).
Parameters of morphometric relationship established between L T, L F, L S, W T and W E for Trachurus picturatus from the north-east Atlantic waters (ICES area Xa2).
AGE ESTIMATION, VALIDATION AND GROWTH MODELLING
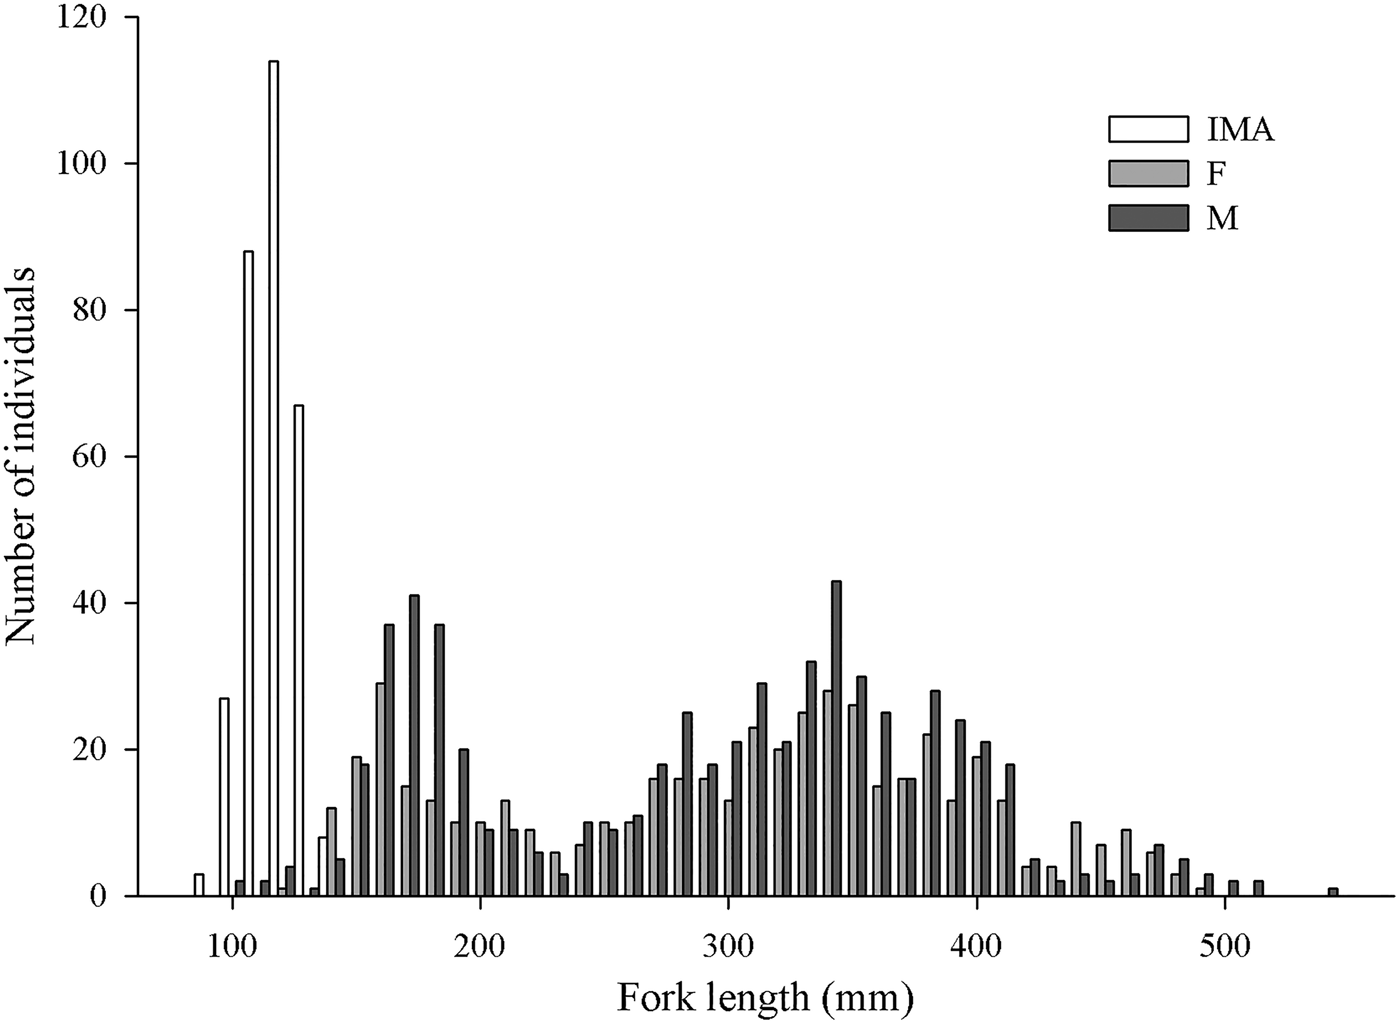
A total of 1450 otoliths were collected, 498 from females (34.3%), 645 from males (44.5%) and 307 from immature specimens (21.6%). The sizes of the sampled individuals were 125–498 mm L F (mean = 301 mm, SD = 92 mm) for females, 101–542 mm L F (mean = 293 mm, SD = 93 mm) for males and 98–144 mm L F (mean = 122 mm, SD = 10 mm) for immature specimens (Figure 2).
Length distribution of aged Trachurus picturatus from the north-east Atlantic waters (ICES area Xa2).
A concentric pattern of hyaline and opaque bands was observed easily in 1420 otoliths (97.9%) (487 females, 626 males and 307 immature). Unclear hyaline-opaque area or ageing discrepancies between readings were noted for the remaining 30 otoliths.
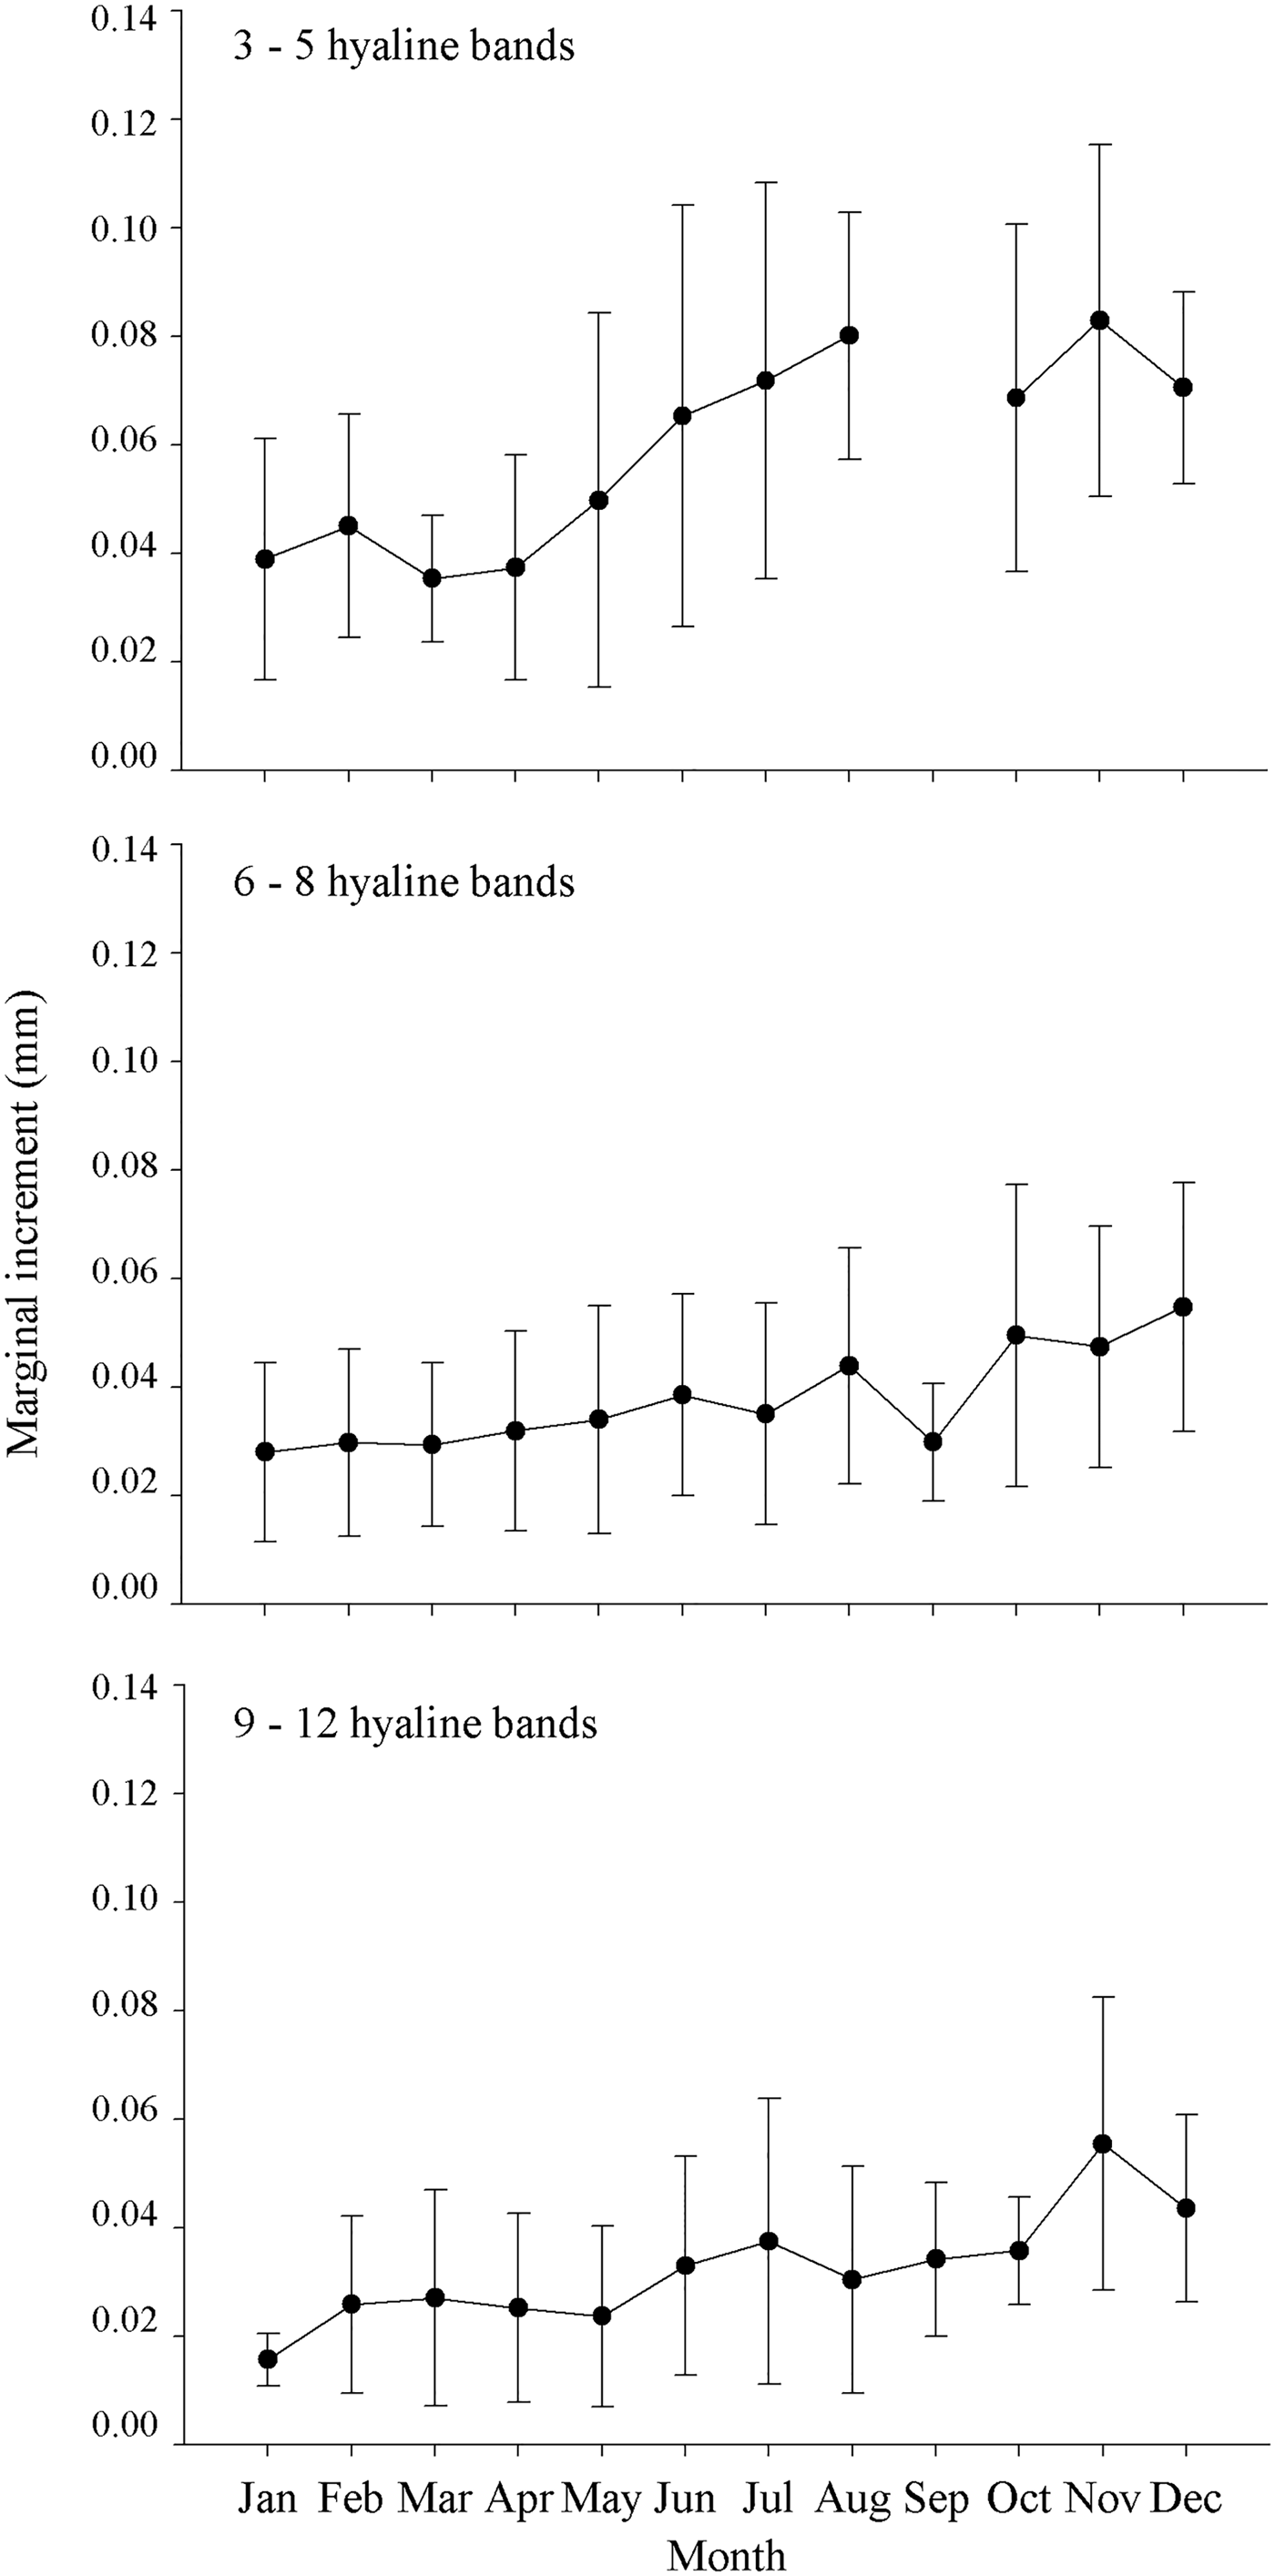
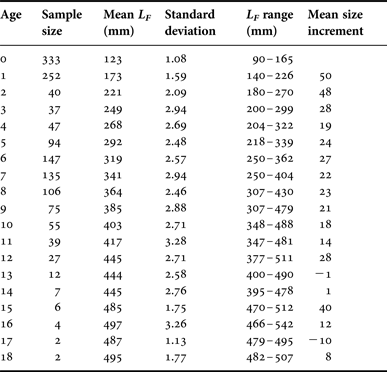
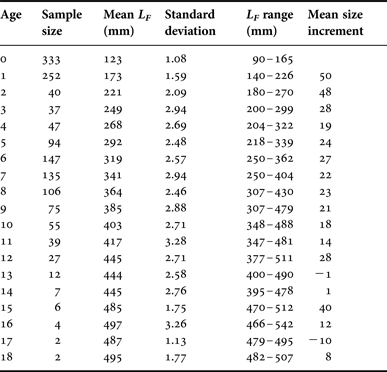
Estimated ages varied between 0+ and 18+ years (sexes pooled), with 93% of the specimens between 0+ and 10-year age classes (Table 2). Individuals attained over 50% of their maximum observed size during the fifth year of life. MIR analysis was computed with individuals whose age and otolith measures were taken (796 otoliths). When all age groups were considered statistically significant differences were found between mean MIR values over the different months of the year (ANOVA: F = 3.29; P < 0.05). The SNK multiple comparison tests showed that there were significant differences between November and the months with the lowest MIR values (January–April). Based on these observations it was assumed that growth bands 3–12 were deposited annually. The mean monthly evolution of MIR for the three age groups (3–5; 6–8; 9–12) presented the same pattern despite the slight decrease of the MIR values in older specimens (Figure 3). In fact, there were no statistically significant differences in mean MIR values achieved in each age group (ANOVA: P > 0.05). The growth band started to form in January, corresponding to a sharp decrease in the MIR values. A progressive increase of MIR values was then observed in later spring with a peak observed in November and December.
Mean monthly evolution of the marginal increment in the otoliths of Trachurus picturatus from the north-east Atlantic waters (ICES area Xa2). Vertical bars represent ± standard deviation.
Descriptive statistics on sizes of aged Trachurus picturatus from the north-east Atlantic waters (ICES area Xa2).
Otolith radius ranged between 1.44 and 6.11 mm. The relationship between S and L F used to back-calculate length-at-age data was a power function described by the following equation:
 $${L_F}= 83. 67 \times {S^{ 1.0 7}}\lpar {r^2}=0. 84\rpar$$
No significant differences were observed in L Fvs S relationships between sexes (ANCOVA: F 2.712 = 0.08; P = 0.93).
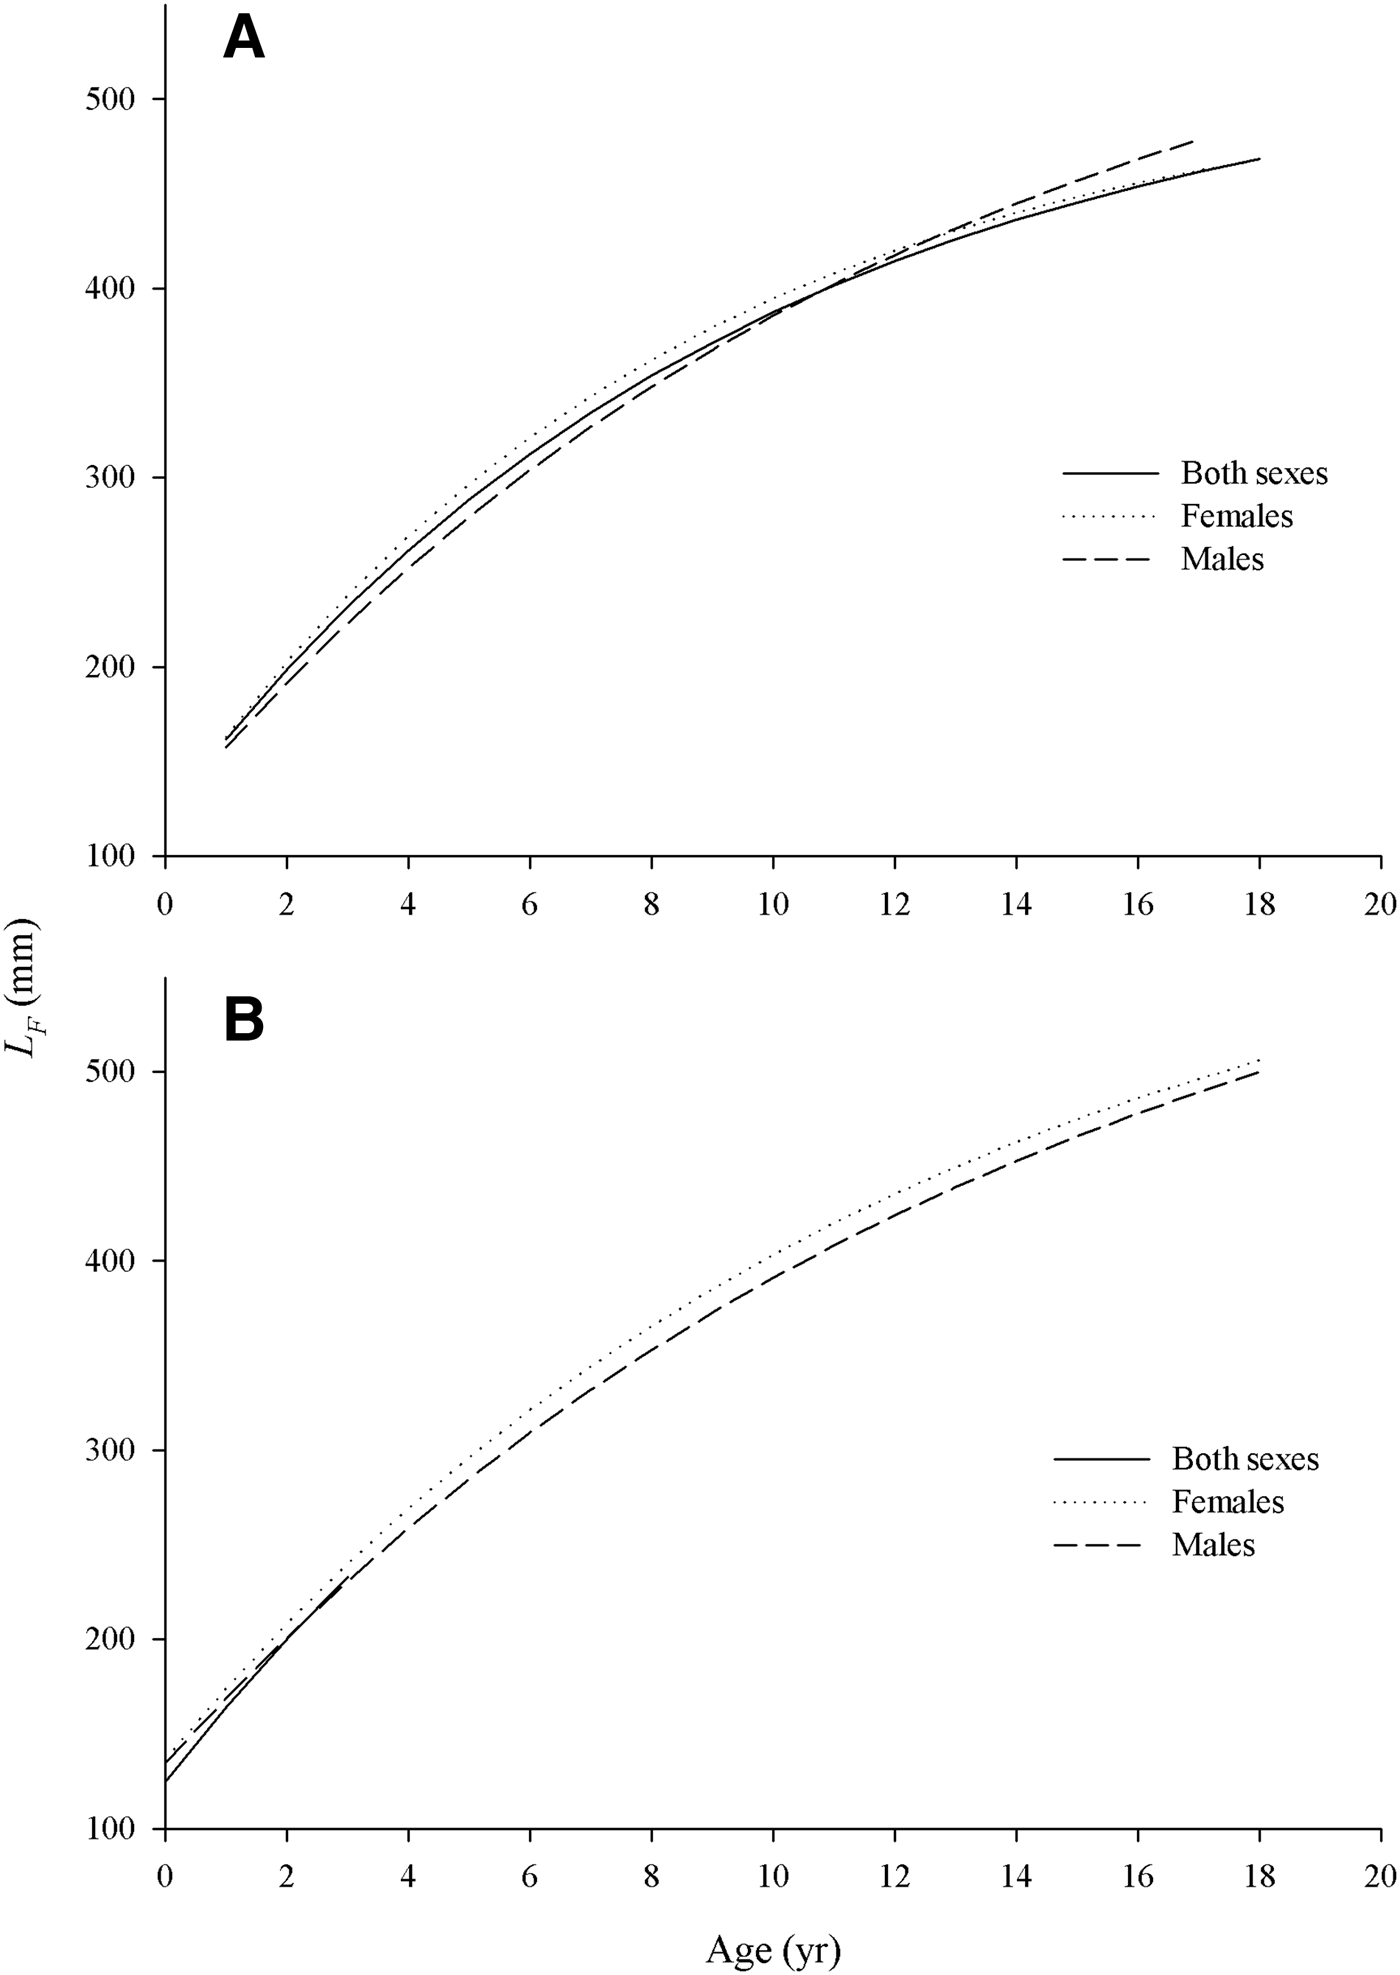
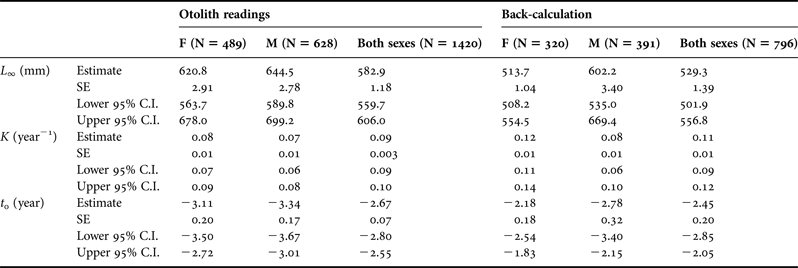
There were no significant differences in mean length-at-age (t-test: P > 0.05, for all age classes) and in the von Bertalanffy growth curves (F-test: P > 0.05) between sexes. The von Bertalanffy models used to estimate growth based on back-calculated length-at-age and observed data both gave good fits exhibiting high values of r 2. Therefore, both models are adequate for modelling the growth of this species; however the results obtained with observed data produced more biologically reasonable parameters. The growth curves created with observed data resulted in higher asymptotic size and lower growth rate (Table 3 and Figure 4). Back-calculated length-at-age data were slightly lower than observed length for individual age groups but no statistically significant differences (t-test: P > 0.05) were observed between them.
von Bertalanffy growth curves for females, males and both sexes of Trachurus picturatus from north-east Atlantic waters (ICES area Xa2). (A) back-calculated length-at-age data; (B) observed length-at-age data.
Estimated parameters with the respective standard error (SE) and the limits of the 95% confidence intervals (C.I.) of the von Bertalanffy growth equation for females, males and both sexes of Trachurus picturatus from north-east Atlantic waters (ICES area Xa2) using otolith readings and back-calculation methods.
Reproductive cycle and maturity
A total of 2056 specimens were used to observe the I G variation throughout the year. The sex ratio of the sampled specimens was marginally dominated by males (annual average ratio M/F = 1.11 ± 0.38).
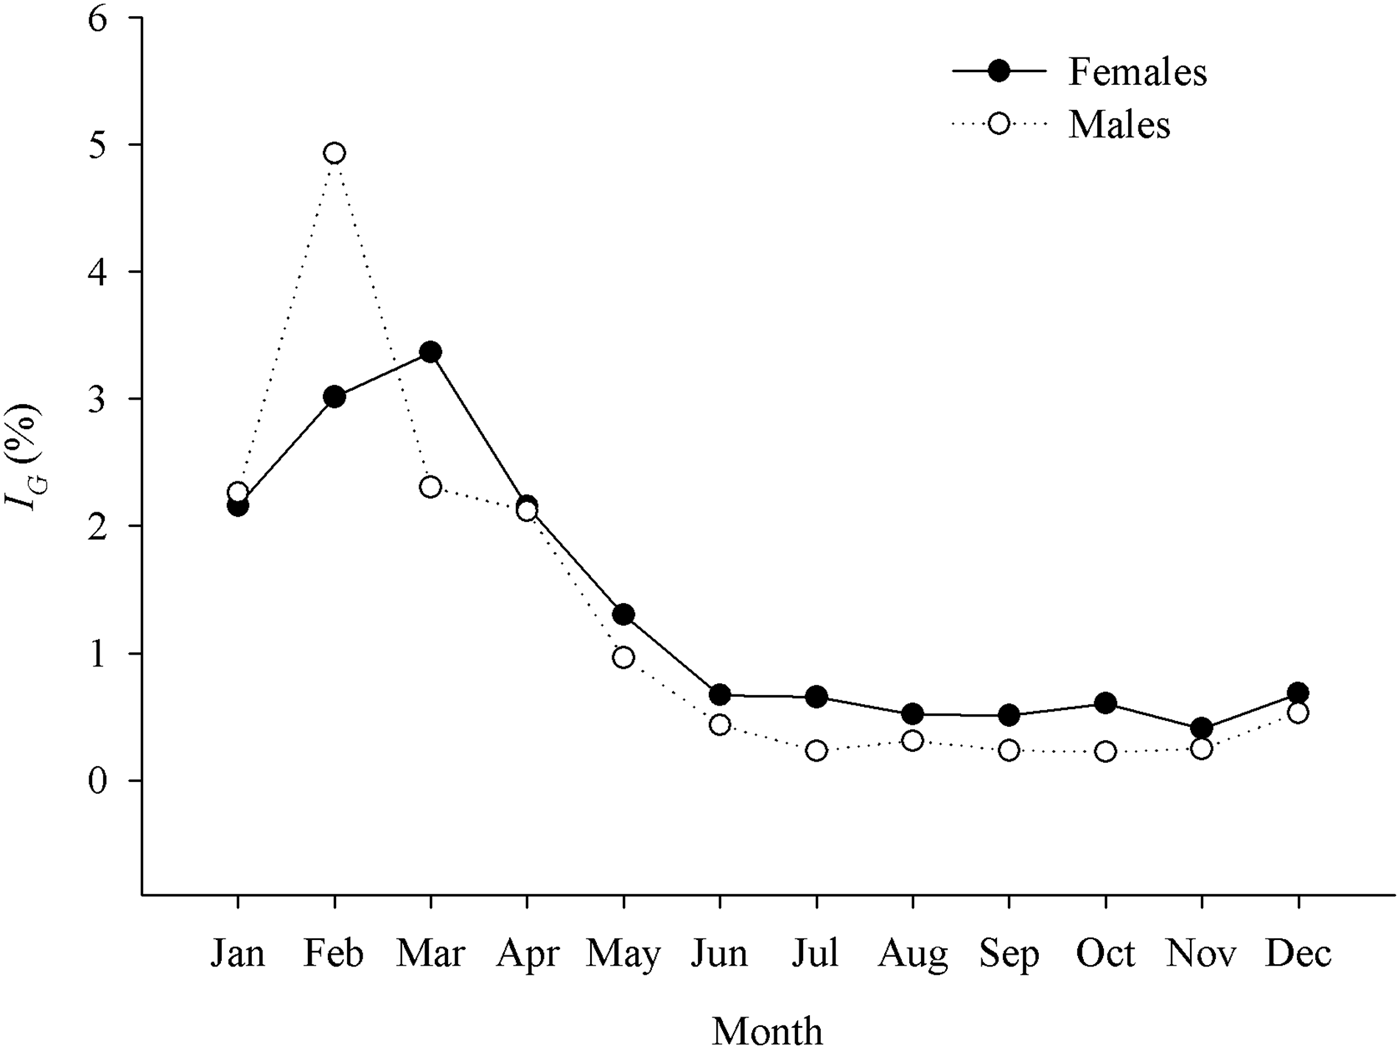
The results suggested that T. picturatus spawn in winter–spring. The reproductive period starts in December and extends until May with peaks in February for males and March for females (Figure 5). The resting period extended from June to November. Males and females had similar spawning and resting periods despite the slightly higher I G values observed for females than those of males, excluding in February where the I G values were higher for males (Figure 5). Significant differences in the mean monthly I G values were observed both for males (ANOVA: F = 59.73; P < 0.01) and females (ANOVA: F = 41.94; P < 0.01). The SNK multiple comparison tests showed that the period between June and November was statistically significantly different with the months presenting the higher I G values (December–May) while the later months display statistically significant differences between each other. The same pattern was obtained for both males and females.
Monthly evolution of gonadosomatic index (I G) (males and females) for T. picturatus from north-east Atlantic waters (ICES area Xa2).
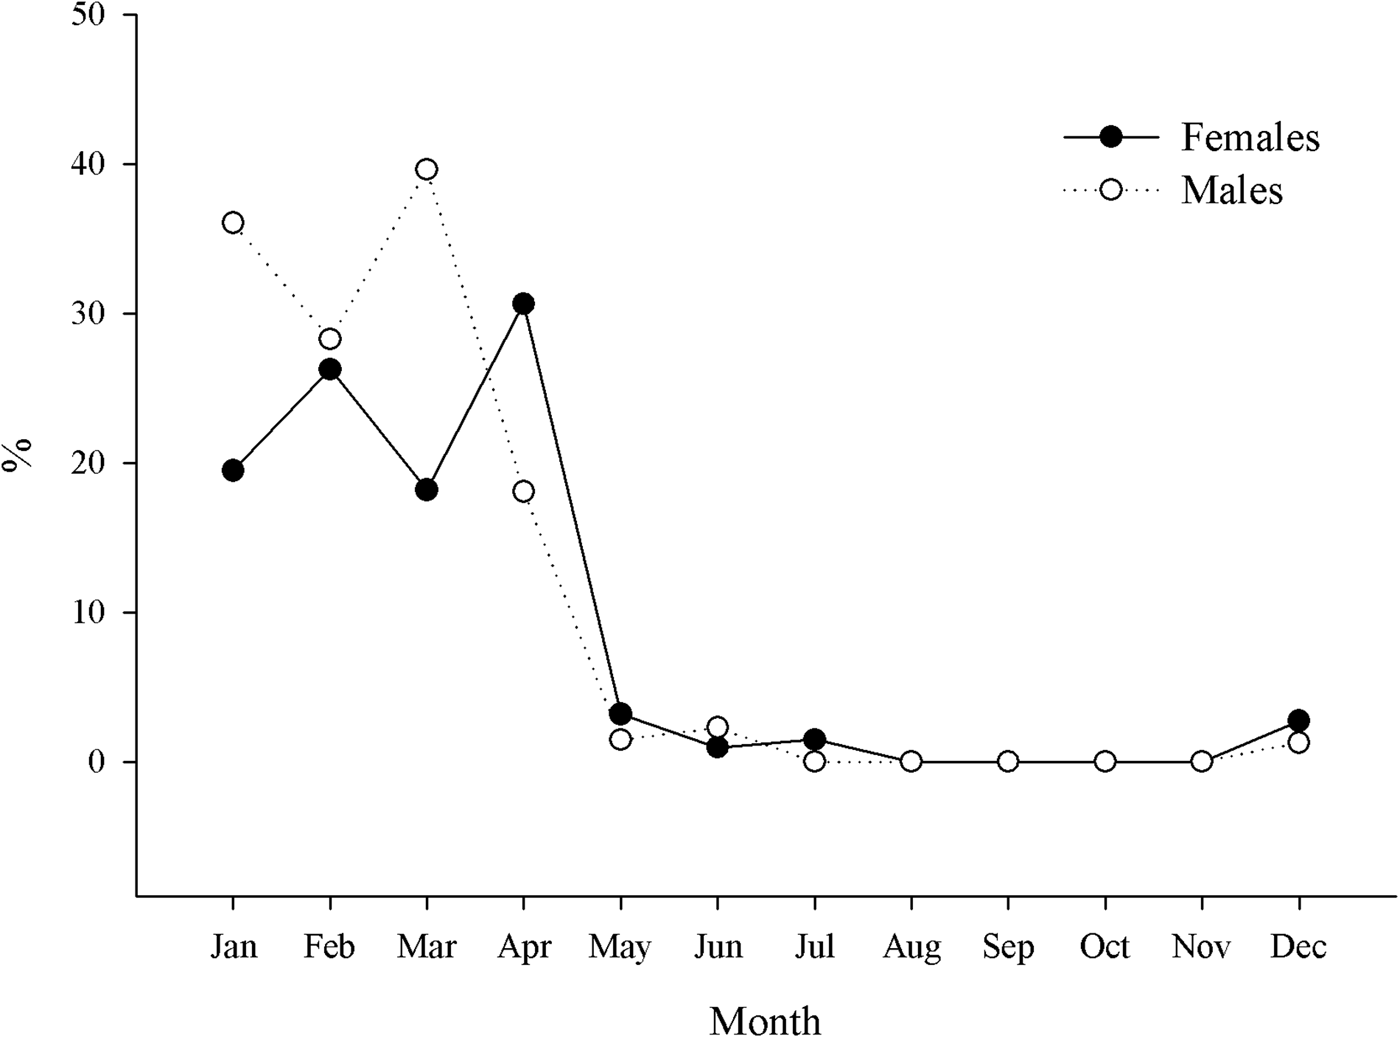
Macroscopic analysis of the gonads also showed a pattern with the same general spawning period (Figure 6). The highest percentage of spawning individuals (stage VI for both males and females) occurred in March and April for males and females, respectively. Moreover, the spawning period started in December for both sexes.
Monthly evolution of the relative frequency of the spawning stage (stage VI) for males and females of T. picturatus from north-east Atlantic waters (ICES area Xa2).
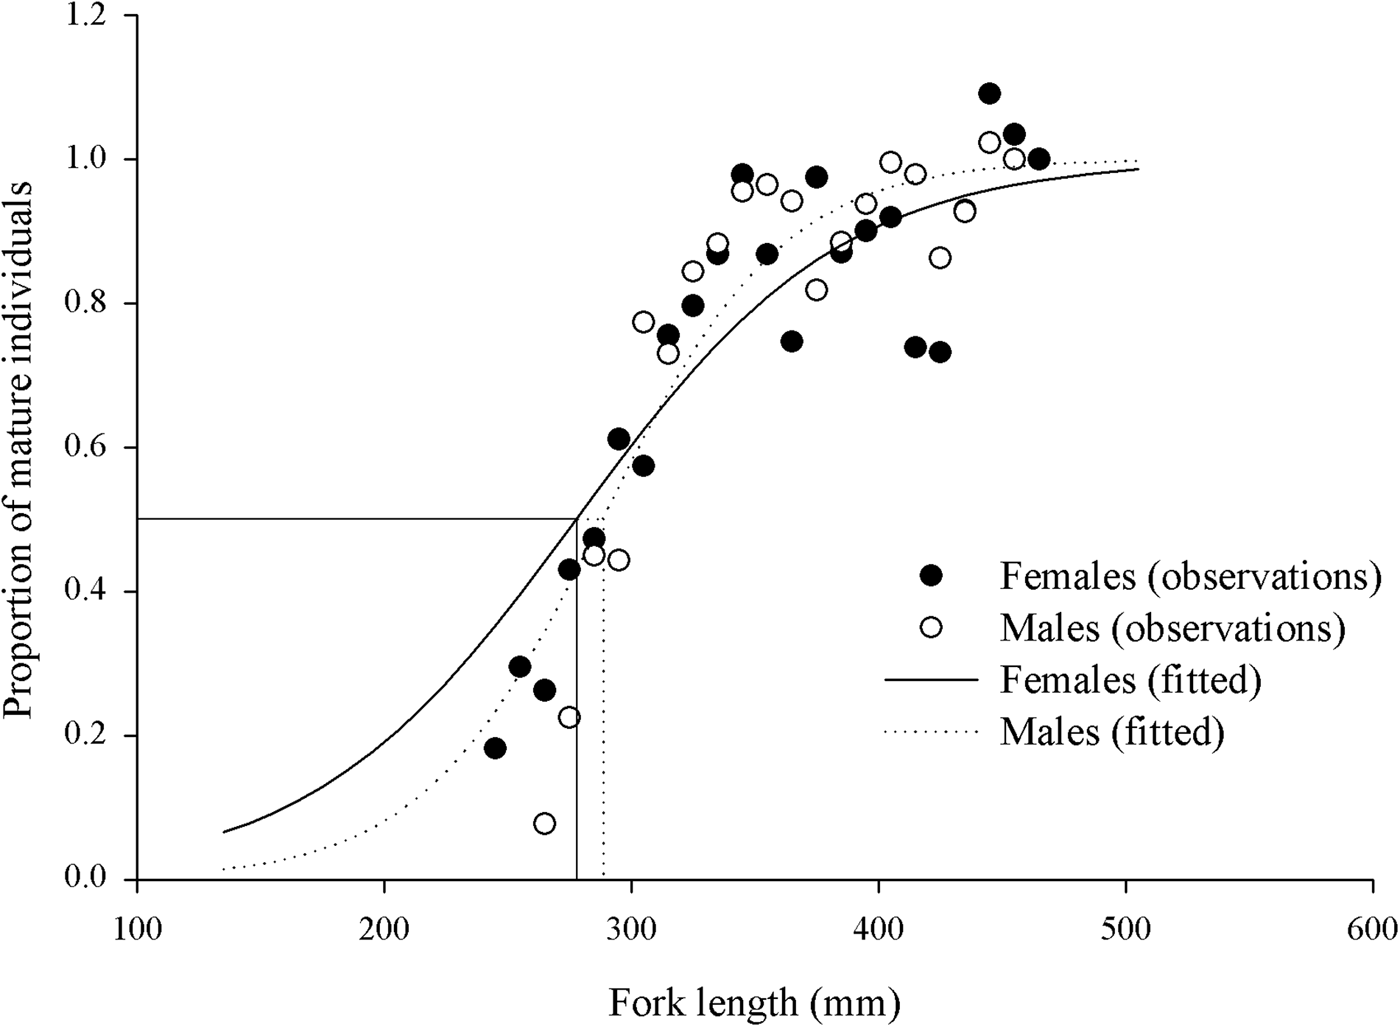
The largest immature female T. picturatus was 410 mm L F and the largest immature male was 450 mm L F. Mature females ranged between 241 mm and 495 mm L F and mature males between 262 mm and 542 mm L F. The logistic curve fitted to the proportion of sexually mature females and males estimated L 50 at 277 mm L F (SE = 1.04; 275–285 mm CI) for females and 288 mm L F (SE = 1.19; 284–289 mm C.I.) for males (Figure 7). The estimated ages at L 50, calculated with the growth equation for observed data, were 4.4 years for females and 5.1 years for males.
Length-based maturity ogive (logistic curve – ‘fitted’), proportion of mature individuals by fork length (‘observations’) and size at sexual maturity (L F50) for T. picturatus females and males from north-east Atlantic waters (ICES area Xa2).
DISCUSSION
Due to fishing gear selectivity, most samples do not include all available lengths, which limit the use of the established morphometric relationships as these could differ from the true estimation of the population parameters. Accordingly, Petrakis & Stergiou (Reference Petrakis and Stergiou1995) suggested that the use of the achieved relationships should be limited to the size ranges used for the estimation of the linear regression parameters. Therefore, Pepin (Reference Pepin1995) and Bagenal & Tesch (Reference Bagenal, Tesch and Bagenal1978) stressed that it is particularly dangerous to extrapolate data to fish larvae or immature individuals. Moreover, samples were collected over an extended period of time and are not representative of a particular season or time of year. Thus, the estimated parameters should be considered only as mean annual values as suggested by Petrakis & Stergiou (Reference Petrakis and Stergiou1995) and Gonçalves et al. (Reference Gonçalves, Bentes, Lino, Ribeiro, Canário and Erzini1997). The estimated parameters a and b are similar to the values obtained by Isidro (Reference Isidro1990) in the Azores, by Mendes et al. (Reference Mendes, Fonseca and Campos2004) off western Portugal and by Merella et al. (Reference Merella, Quetglas, Alemany and Carbonell1997) in the western Mediterranean Sea. In contrast, Borges et al. (Reference Borges, Olim and Erzini2003), for T. picturatus from the southern coast of Portugal, estimated a b value slightly higher and an a value lower than those achieved in the present study. According to Bagenal & Tesch (Reference Bagenal, Tesch and Bagenal1978), the parameter b is characteristic of the species and generally does not vary significantly throughout the year, while the parameter a may vary seasonally, daily and/or between different habitats. Other authors refer to a as the relative condition factor (Anderson & Gutreuter, Reference Anderson, Gutreuter, Nielsen and Johnson1983).
Age determination in Trachurus picturatus, as for the other species in the genus, has often been referred to as difficult due to the interpretation of hyaline rings in older specimens and the identification of the first annulus (Isidro, Reference Isidro1990; Jesus, Reference Jesus1992; Karlou-Riga, Reference Karlou-Riga2000; Abaunza et al., Reference Abaunza, Gordo, Karlou-Riga, Murta, Eltink, Garcia-Santamaria, Zimmermann, Hammer, Lucio, Iversen, Molloy and Gallo2003; Vasconcelos et al., Reference Vasconcelos, Alves, Gouveia and Faria2006). In the present study the interpretation of the growth bands was consistent (96.8% concordant readings) which revealed the adequacy of these calcified structures for age estimation.
Marginal increment analyses demonstrated successfully the seasonality of band formation and partially validated the method used (ages 3–12). Waldron & Kerstan (Reference Waldron and Kerstan2001) alleged that marginal increment analysis can be used successfully to validate the horse mackerel growth. However, as otolith growth in older fishes is considerably reduced, an accurate validation of the method could usefully include mark–recapture techniques (Beamish & McFarlane, Reference Beamish and McFarlane1983). In the present study, the growth band is formed every year in middle winter which is through the spawning period for T. picturatus. The same relationship was found for T. mediterraneus (Karlou-Riga, Reference Karlou-Riga2000) and T. trachurus (Costa, Reference Costa2001). In fact, several other growth studies revealed that the spawning activity is the main mechanism regulating cyclic deposition of growth increments, as the fish use more energy to produce gametes than for growth, resulting in a less calcified ring (Sun et al., Reference Sun, Wang and Yeh2002; Coelho et al., Reference Coelho, Bentes, Correia, Gonçalves, Lino, Monteiro, Ribeiro and Erzini2010). Other studies pointed out the importance of environmental factors as the determining factor for annulus deposition (Campana, Reference Campana1999).
The largest specimen in this study was a 542 mm L F male and the smallest 98 mm L F, while the oldest specimen aged was an 18-year-old male measuring 507 mm L F. No previous studies on T. picturatus have examined specimens as large or small as those reported in this study. In fact, the size ranges sampled in Madeira were 100–360 mm L F (Jesus, Reference Jesus1992) and 170–460 mm L F (Vasconcelos et al., Reference Vasconcelos, Alves, Gouveia and Faria2006). In Azorean waters, Isidro (Reference Isidro1990) examined fish over the length range 110–430 mm L F.
The von Bertalanffy growth curve fitted to the observed and back-calculated data adequately explained the growth pattern for the observed size range of blue jack mackerel. The estimated growth parameters are similar to those estimated by other authors for the same species, but those presented the highest L ∞ and the lowest k. In the only previous study carried out in Azorean waters (Isidro, Reference Isidro1990), L ∞ was lower (529 mm) and k higher (0.20 year−1) than in the present study. In Madeira, L ∞ ranged from 423 mm (Vasconcelos et al., Reference Vasconcelos, Alves, Gouveia and Faria2006) to 443 mm (Jesus, Reference Jesus1992) while k values ranged from 0.16 year−1 (Vasconcelos et al., Reference Vasconcelos, Alves, Gouveia and Faria2006) to 0.32 year−1 (Jesus, Reference Jesus1992). This difference is likely related to the larger specimens present in this study. This affects the estimation of t 0 and L ∞ and consequently the k (King, Reference King1995). In fact, the t 0 value obtained in the present study was strongly negative when compared with those estimated by other authors (Isidro, Reference Isidro1990; Jesus, Reference Jesus1992; Vasconcelos et al., Reference Vasconcelos, Alves, Gouveia and Faria2006).
The sex ratio (M:F) obtained was dominated by males. A similar pattern was observed off the Canary Islands by Jurado-Ruzafa & Santamaría (Reference Jurado-Ruzafa and Santamaría2013), but was in contrast with the results obtained by Jesus (Reference Jesus1992) on Madeira, where females dominated the samples. The deviance from 1:1 sex ratio could be due to changes in the equilibrium, such as the growth rates that affect the vulnerability of juveniles to predation, the recruitment or migrations (Vicentini & Araújo, Reference Vicentini and Araújo2003; Amenzoui et al., Reference Amenzoui, Ferhan-Tachinante, Yahyaoui, Kifani and Mesfioui2006). All these factors may cause changes in sex proportions and catchability of a certain sex (Vicentini & Araújo, Reference Vicentini and Araújo2003; Silva, Reference Silva2007).
Monthly variation of I G indicated that the reproductive season of T. picturatus in the north-east Atlantic extends between January and May (winter to early spring), with a peak in February–March. This period is coincident with the reproductive season reported by Isidro (Reference Isidro1990) for the Azores and by Jurado-Ruzafa & Santamaría (Reference Jurado-Ruzafa and Santamaría2013) for the Canary Islands. The reproductive season in Madeira, however, extends from November until April (Jesus, Reference Jesus1992). For other small pelagic species, such as Trachurus trachurus (Abaunza et al., Reference Abaunza, Gordo, Karlou-Riga, Murta, Eltink, Garcia-Santamaria, Zimmermann, Hammer, Lucio, Iversen, Molloy and Gallo2003) and Sardina pilchardus (Stratoudakis et al., Reference Stratoudakis, Coombs, Lago de Lanzós, Halliday, Costas, Caneco, Franco, Conway, Santos, Silva and Bernal2007) the spawning season is protracted and may occur year round in the Atlantic Ocean. The I G values were lower for males than for females which is in accordance with other studies for other species (Macer, Reference Macer1974; Treasurer & Holliday, Reference Treasurer and Holliday1981).
The length at 50% maturity for females was 277 mm L F, which corresponds to 4.4 years and for males was 288 mm L F corresponding to 5.1 years. Isidro (Reference Isidro1990) considered for both sexes that the age at maturity of T. picturatus might occur at age classes 2 or 3, corresponding to an L50 of 200–250 mm L F. Jurado-Ruzafa & Santamaría (Reference Jurado-Ruzafa and Santamaría2013) reported a L50 for both males and females between 220 and 230 mm L F. For T. mediterraneus, Viette et al. (Reference Viette, Giulianini and Ferrero1997) had recorded 2 years and 16 cm for age and length at first maturity, respectively. The methods used in the previous studies for the estimation of the age at first maturity are not known; for this reason they should be compared with caution as differences could be due to different growth rates.
In conclusion, this study suggests that T. picturatus population (ICES area Xa2) had lower growth rate and larger maximum size than those reported in Azores by Isidro (Reference Isidro1990) and also to the T. picturatus population from Madeira. In terms of reproductive seasonality, this population presented the same pattern observed by Isidro (Reference Isidro1990). Moreover, in the Azores archipelago the exploitation of this species seems to cover all stages of their life history. The biological parameters presented here suggest that T. picturatus is more vulnerable to fishing than previously expected, however catch limits adopted by the fleet in recent years will certainly contribute to the protection of the species in the long term.
ACKNOWLEDGEMENTS
This study was supported by the E.U. Data Collection Framework. The authors express their gratitude to R. Rosa and F. Mendes for their help on fish sampling and also to D. Rosa for histological processing.
APPENDIX I