

1. INTRODUCTION
The narratologist David Herman defines narrative as ‘a basic human strategy for coming to terms with time, process, and change’ (Herman Reference Herman2009: 2). According to the composer Curtis Roads, we constantly construct narratives from our sensory experiences ‘by anticipating the future and relating current perceptions to past’ (Roads 2015: 323). If listening to music can be characterised as an artistic experience of contrasts and surprises in various dimensions of sound, the act of composition can be regarded as building up expectations, and then either meeting or evading them. In music, cultural norms prepare listeners for what to anticipate (Huron Reference Huron2006: 3); however, the electronic medium provides composers with a ‘wide-open sound world’ (Smalley Reference Smalley1997: 107), which can defy such norms. We can then ask: what is to be unexpected in electronic music if everything can be expected of it? It could be argued that the network of expectations in electronic music is inherited from everyday life. This does not imply that every work of electronic music revolves around everyday narratives. Neither does it suggest that listening to electronic music is rooted exclusively in representations. But as I will further discuss in the third section, abstractness is nevertheless a negation of reality; artists and audiences construct the unreal based on their knowledge of the real.
Furthermore, when the extensive vocabulary of electronic music expands that of a culturally established understanding of music, it instigates for the listener a profusion of references rooted in events in the environment. Following a cross-disciplinary interpretation of narrativity, I will set up the fourth section by characterising environmental events as the units by which our everyday narratives move forward. I will relate these events to environmental sounds and, furthermore, to gestures in electronic music. Through this association, I will delineate the narrative function of a gesture in electronic music in terms of meaning, spatiotemporal configuration, intentionality and causality. I will support this discourse with the results of an experimental study I conducted between 2011 and 2014 in affiliation with the Leiden University, the Institute of Sonology and the Delft University of Technology. I will begin by offering the details and the results of this study.
2. Experiment
2.1. Related work
Although listener-based research on electronic music is not unprecedented, it has been deemed an ‘exception rather than the rule’ (Landy Reference Landy2007: 39). In one of the earlier examples of subject-based analysis of electronic music, the researcher Michael Bridger conducted a study to collect experience reports from listener groups (Bridger Reference Bridger1989). Using short sections of five electronic music pieces that heavily incorporate the human voice, Bridger administered repeated listening sessions to acquaint the participants with the selected works. This was followed by discussions with each listening group, during which Bridger annotated audio plots with listener comments. This method, although lacking statistical control as Bridger points out, yielded several interesting insights such as the listeners’ attentiveness to the human voice, conventional musical instruments and spatial movements of sound.
In another study, the researcher François Delalande asked eight subjects with varying expertise in electroacoustic music to listen to a short movement from Pierre Henry’s Sommeil and to fill out a survey in the form of a ‘relaxed interview’ (Delalande Reference Delalande1998: 24). Delalande describes his goal with this study as a search for consistencies ‘not directly in what listeners hear but in […] their listening behaviours’ (23). Accordingly, he concludes that there are coherences across separate listening behaviours that can be considered as analytical points-of-view. Addressing the limitations of his experimental model, Delalande acknowledges the lack of a systematic approach to the analysis as well as the insufficiency of the number of participants for drawing a statistical conclusion (25).
During the latter half of the 1990s, the composer Andra McCartney conducted a programme of listener-response studies using Hildegard Westerkamp’s works of soundscape music (McCartney Reference McCartney1999). In this study, the participants, who had varying degrees of experience with electroacoustic music, were asked to listen to a soundscape piece and respond to questions about it in survey format. McCartney then analysed the feedback through an ‘open interpretation’ to create a dialogue between different ideas and ways of thinking (198).
In the Intention/Reception Project, Leigh Landy and Rob Weale conducted a series of surveys with composers and listeners to gauge accessibility and appreciation in electroacoustic music (Landy Reference Landy2007: 44). The participants included people with no prior experience with electroacoustic music as well as those who had either a fundamental or a developed knowledge of it. Over three listening sessions, the participants were asked to complete questionnaires both during and after listening to a piece, while they were gradually provided with more information about the work. The experiments, which were conducted with fixed stereo pieces that include ‘real-world sounds that are identifiable’ (ibid.), revealed that when inexperienced listeners are given dramaturgical information about a piece, they are able to use it to guide themselves through parts of the music that are problematic in terms of access and appreciation (Weale Reference Weale2006: 196).
2.2. Aim
While the study discussed here shares similarities with the projects mentioned above, it offers a novel approach in terms of its aim and methodology. Specifically, the current experiment aims to explore a) how fixed works of electronic music operate on perceptual, cognitive and affective levels, b) what common concepts are activated in listeners’ minds when listening to such a work and c) how such concepts relate to the composer’s narrative. The design of the experiment is aimed at extracting both contextual and in-the-moment impressions while offering a natural listening experience.
A series of preliminary experiments were conducted between October 2011 and February 2012 with 12 participants (Çamcı Reference Çamcı2012). This study revealed necessary improvements to the experiment design ranging from interface refinements to the broadening of the collected data. Another session on extracting general impressions was conducted with eight participants in May 2012.
2.3. Participants
Sixty participants from 13 different nationalities took part in the current experiment between May 2012 and July 2014. Twenty-three participants were female while 37 were male. The average age of the participants was 29 with ages ranging from 21 to 61. Twenty-two participants identified themselves as having no musical background. Among the remaining 38 participants were musicians, music hobbyists, composers and students of sound engineering and sonic arts.
2.4. Stimuli
Five complete pieces of electronic music, in 44.1 kHz, 16-bit WAV format, were used in the experiments. Four of these were my works, namely Birdfish, Element Yon, Christmas 2013 and Diegese.Footnote 1 The fifth piece was Curtis Roads’s 2009 piece Touche pas. These pieces utilise a wide range of forms, techniques (e.g. live performance, micromontaging, algorithmic generation), tools (e.g. audio programming environments, DAWs, physical instruments) and material (i.e. synthesised and recorded sounds). As described below in detail, some of these works were structured around predetermined stories while others revealed their narratives over the course of the compositional process. The main reason for focusing on my own works was to have an unmediated understanding of the goals, themes and processes underlying these works, which, I believe, has yielded unique perspectives both when evaluating and communicating the results.
2.4.1. Birdfish (2012, 4′40″, Sound example 1)
Birdfish, which was composed between October 2010 and February 2012, is the second piece to come out of a tetralogy on evolutionary phenomena. In two movements, the piece narrates the transmutation of underwater beings into avian creatures. Synthesised sounds of water, amphibians, fish and birds are introduced at various levels of intelligibility throughout the piece. Such actors intermittently morph into a recurring melodic leitmotif that marks the transitions between sections. The individual sound elements, their motion trajectories and the resonant spaces they move within are designed to instigate clear representations of the beings that populate the universe of the piece. The narrative situates the audience at varying vantage points, shifting between third- and first-person views, with the compositional intention of transforming the listener from a non-diegetic observer to one who is situated inside the story. The sounds of Birdfish were created using a complex combination of pulsar, granular and frequency-modulation synthesis, as well as custom delays and filters. These were later micromontaged onto a timeline according to the pre-determined narrative.
2.4.2. Element Yon (2011, 3′45″, Sound example 2)
Element Yon was composed concurrently with Birdfish during the nine-month period between October 2010 and June 2011. It emulates several structural characteristics of Birdfish while using a different vocabulary of sounds. The two pieces are similar in terms of their temporal pace, phrase lengths and their use of silence. Unlike the sounds of Birdfish, which were digitally crafted over time, the sonic gestures that make up Element Yon were performed with a subtractive synthesiser. To emphasise a non-representational quality throughout the piece, waveforms with little or no partials are used. In this respect, Element Yon is conceived as an abstract counterpart of Birdfish. A sense of narrative abstractness is further instated with the final gestures of the piece, which are intended to obfuscate any motivic closures to the piece.
2.4.3. Christmas 2013 (2011, 2′16″, Sound example 3)
The sound material of Christmas 2013 was extracted from the jazz trio Tin Men and the Telephone’s 2011 album The Very Last Christmas, which consists of avant-garde jazz interpretations of famous Christmas songs. Inspired by the ill-conceived prophecies of the world’s expected end in 2012, Christmas 2013 is set in a post-apocalyptic world, about a year after the demise of mankind. The theme of the piece is future nostalgia; the snippets selected from the audio recordings were therefore processed to sound electronic and antiquated at the same time. The piece begins by quoting the Christmas carol ‘Silent Night’ to prime the listener with an intelligible instrumental reference. From a structural point of view, the piece exhibits a temporal unfolding marked by distinctive staccato sounds. The recurrence of these sounds in various timbres establishes an obscure rhythm that operates on various time scales. The spatiotemporal organisation of the staccato sounds envelops the listener in a vast, animated environment. Brief reprises of the piano sounds are spread throughout the piece to remind the listeners of the present as it is observed from the future. Throughout the piece, the present becomes an object of nostalgia through the contrast between an unsettling post-apocalyptic landscape and a happy memory.
2.4.4. Diegese (2013, 1′54″, Sound example 4)
My initial motivation for composing Diegese was to illustrate several concepts discussed in my article ‘Diegesis as a Semantic Paradigm for Electronic Music’ (Çamcı Reference Çamcı2013). The piece particularly explores the idea of ‘music within music’, or in other words, the use of musical quotations as diegetic actors within the universe of another piece, similar to the use of a television within a movie scene. The first quotation is an algorithmic emulation of a texture from Roads’s piece Touche pas. The second quotation is a phrase from Beethoven’s Piano Sonata No. 27 in E minor. This pairing was motivated by the metaphorical similarities between the perceived motion in each quotation (i.e. descent, spillage). The quotations are blended into the narrative flow of the piece rather than being juxtaposed with the remainder of the sonic textures.
2.4.5. Touche pas (by Curtis Roads, 2009, 5′30″)
The material for this piece is extracted from the granulation of a three-second sound fragment into a ten-minute texture (Roads 2016, personal communication). From this texture, the composer selected salient structures and ordered them in several stages of construction. These were then interjected with microfigures, which Roads describes as rapid successions of transient sounds that are intended to make the listener ‘aware of the ever fleeting present instant in a direct and physical way’ (ibid.).
2.5. Apparatus
The experiment interface is designed for web browsers using HTML and JavaScript. The UI communicates with a local SQL database for data storage. The listening sections are conducted with closed-back (e.g. Beyerdynamic DT-770) or semi closed-back (e.g. AKG K240) stereo headphones, which are tested as being capable of reproducing the entire frequency spectrum of the works used in the experiments. The experiments are conducted in individual units.
2.6. Procedure
Based on a between-subjects design, the pieces are rotated across participants to achieve a random allocation with an equal number of instances for each piece. Verbal instructions are provided prior to each section. The experiment procedure involves the following four sections.
2.6.1. Initial listening
The participants are seated in front of a computer that runs the experiment software seen in Figure 1a. They are told that once they press the play button, an entire piece of music will playback without interruptions. No information regarding the piece (e.g. title, duration, composer name) is disclosed. They are asked to simply listen to the piece and try to enjoy it as they would with any piece of music. This section is intended to offer the participants a listening experience that is not primed by an experimental task.
User interface for the initial listening task.

2.6.2. General-impressions task
When the initial listening section is completed, the participants are asked to write, on a sheet of A4 paper, ‘their general impressions as to anything they might have felt or imagined, or anything that came to their minds, as they listened to the piece’. This instruction is intended to cover a wide range of mental activations that could represent perceptual, cognitive and affective processes. It is explained that the participants can write freely in any form and to any extent they prefer without time constraints. Once a participant indicates that they are done with the general-impressions task, they are asked to return to the computer.
2.6.3. Real-time input exercise
A real-time input exercise is administered to acquaint the participants with the software and hardware layout of a real-time free association task. In this exercise, the participants are greeted with the interface seen in Figure 1b. It is explained that once the participants press play, they will hear a speech recording. They are instructed to pick random words from this speech, type them and hit the enter key to submit them one at a time.
User interface for real-time input tasks.

2.6.4. Real-time free association task
In this section, the participants use an interface identical to that from the exercise section to complete a real-time free association task. Prior to this task, it is described to the participants that once they click the play button, the piece which they previously heard will play a second time. It is explained that in this section, they are expected to submit ‘descriptors as to what they might feel, imagine or think, the moment such descriptors come to their mind as they hear the piece’. The participants are advised to be relaxed and spontaneous. They are also asked to disregard any typing errors and submit their descriptors as soon as they type them.
2.7. Results
The participants reported their general impressions in one or a combination of various forms, including list of words, list of sentences, prose and drawings. Table 1 gives an overview of the number of descriptors submitted during the free-association task. The vast majority of the descriptors were single words or two-word noun phrases. The longest descriptor submitted was ‘trying to make the puzzle but can’t quite do it’ with ten words. A participant’s experience with electronic music did not significantly impact the categorical distribution or the number of the descriptors submitted by that participant. Technological listening, where a listener recognises the technique behind a work (Smalley Reference Smalley1997: 109), was infrequently apparent in the responses by sonic arts students.
Total and average numbers of real-time descriptors (RTDs) per piece, participant and minute.

A dynamic single-timeline visualisation (Figure 2a) for within-piece analysis, and a multiple-timeline visualisation (Figure 2b) for cross-participant analysis were created. Both visualisations allowed for scrubbing through the track to inspect descriptors contextually.
Single-timeline dynamic visualisation of real-time inputs submitted for Element Yon by 12 participants.

Multiple-timeline visualisation of real-time descriptors submitted for Birdfish by two participants.

2.7.1. Categorisation of descriptors
For the analysis of the descriptors gathered from the real-time free association task, a categorisation was imposed upon the data following many previous studies dealing with auditory perception (Ballas Reference Ballas1993; Marcell et al. Reference Marcell, Borella, Greene, Kerr and Rogers2000; Gygi et al. Reference Gygi, Kidd and Watson2007; Guastavino Reference Guastavino2007; Özcan Reference Özcan2008). In the preliminary study, an iterative process of thematic analysis was applied to the data to produce a set of descriptor categories. Once the emergent categories were determined, the categorical membership of each real-time input was assessed through forced-choice categorisation. The categories derived from the preliminary study were source, concept, scene, emotion and perceptual descriptors.
Some 1202 real-time inputs gathered from the current experiment were categorised under these five groups. If a descriptor consisted of multiple words, it was split up into its constituents, which were categorised individually (e.g. ‘computers underwater’ was broken into ‘computers’ and ‘underwater’). After several iterations of the categorisation process, it became apparent that some of the categories gathered from the preliminary study were either too broad and had to be split up into subcategories, or were insufficient to represent certain descriptors, making it necessary to add new categories.
The final list of descriptor categories includes the following: source descriptors (SD – subcategorised into object descriptors, action descriptors and musical descriptors); concept descriptors; location descriptors; affective descriptors (AD – subcategorised into emotion descriptors, appraisal descriptors and quality descriptors); perceptual descriptors (PD – subcategorised into auditory descriptors and feature descriptors); meta-descriptors; onomatopoeia.
The source descriptor category covers submissions which can broadly be prefixed by the phrase ‘sound of’. The three subcategories refer to object source descriptors (e.g. ‘water’, ‘telephone’, ‘frogs’, ‘wind’), action source descriptors (e.g. ‘breathing’, ‘explosion’, ‘scratching’, ‘bouncing’) and musical source descriptors (e.g. ‘lullaby’, ‘Mozart’, ‘pop band’).
The concept descriptor category includes such descriptors as ‘waiting’, ‘lights’ and ‘summer’, which do not refer to sounding objects or phenomena in themselves. On the other hand, these descriptors might refer to concepts that imply such phenomena, as in ‘war’, ‘Chinese’ and ‘science fiction’.
Location descriptors refer to imagined spaces different from the one inhabited by the listener (e.g. ‘jungle’, ‘underwater’, ‘cave’, ‘hallway’). A location descriptor can also indicate imaginary spatial attributes as in ‘distant’, or merely imply an imaginary yet non-specific environment as in ‘space’ and ‘outdoors’.
Affective descriptors are grouped into three subcategories. Emotion descriptors define feelings that relate to the listener’s experience, such as ‘curious’, ‘stress’ and ‘relief’. Appraisal descriptors such as ‘cool’, ‘lovely’ and ‘great’ are often followed by a source descriptor as in ‘nice piano’ or ‘cool low’. These descriptors denote a listener’s basic appraisal of certain components of the piece on a binary basis (i.e. good or bad). Quality descriptors such as ‘weird’, ‘familiar’ and ‘exciting’ are affective traits which the listener attributes to an external object, as in ‘relaxing rhythm’. Therefore, the difference between emotion and quality descriptor categories is that while the former denotes an affective state of the listener, the latter describes that of an object.
Perceptual descriptors are grouped into two subcategories. Auditory descriptors denote perceptual qualities of the sound such as ‘bass’, ‘fade in’ and ‘pan’. Feature descriptors denote non-auditory perceptual qualities of the imagined objects, as in ‘small (impacts)’, ‘deep (cave)’ and ‘dark (forest)’.
Meta-descriptors refer to the material entity of the piece in itself and not the experience of it (e.g. ‘(great) opening’, ‘want more bass’, ‘pause’, ‘end’). Such descriptors can also refer to form and technique (e.g. ‘counterpoint’, ‘granular’, ‘motif’, ‘pitch-shifter’). The onomatopoeia category includes a small number of descriptors such as ‘boooooom’, ‘ding’ and ‘hummm’.
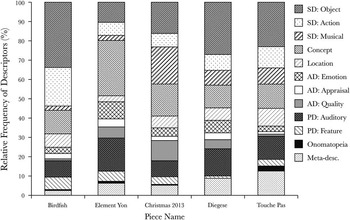
Figure 3 shows the frequency distribution of each category by piece. The reader of this article is invited to listen to these works and compare the results below with their own impressions.
Categorical distribution of real-time descriptors by piece.

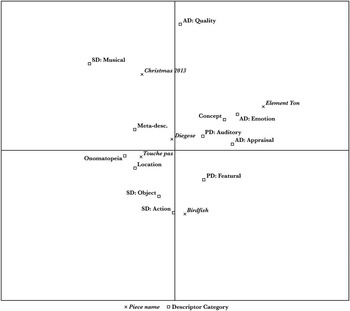
As seen in Figure 4, a correspondence analysis, which is used to display categorical data on a two-dimensional plane, not only reveals how pieces are distributed in relation to the categories, but also how the categories and the pieces correlate amongst themselves.
Correspondence analysis between pieces and descriptor categories.

3. Narrativity
The results of the experiment reflect the experiential complexity of electronic music: comparing, for instance, the categorical distributions for Birdfish and Element Yon, we get a glimpse of how varied the experiences of two pieces can be. Now let’s look at what underlies this complexity from a narrative perspective.
The cultural theorist Mieke Bal characterises narrative as a text in which a story is told in a particular medium, such as language, sound or imagery (Bal Reference Bal1997: 5). Bal further specifies a story as ‘a fabula presented in a certain manner’. A fabula, which represents a series of chronologically connected events, is the result of a reader’s interpretation of a text that is manipulated by the story (9). In Jean Molino’s theory of musical semiology, the classical model of communication (i.e. Sender → Message → Receiver) is replaced by a unidirectional process involving poiesis (i.e. the sender’s act of creation), trace (i.e. a neutral level where the symbolic form, in this case music, is embodied), and esthesis (i.e. the receiver’s reconstruction of a meaning from the trace) (Nattiez Reference Nattiez1990: 17). Bal’s model can be adapted to this theory as follows:

Listeners inhabiting the spatial domain of the concert hall superimpose semantic representations over their embodied experience of electronic music. The affective quality of the artwork is immanently informed by this esthesic act (i.e. the listener’s construction of a fabula). Here are two impressions of Birdfish as reported by two participants:
I heard robotic bugs moving around being commanded by more intelligent robotic beings. There was water, stepping into water, robotic dialogues and also progress made by the robotic bugs in their task.
This music reminded me of a cartoon I used to watch when I was in high school. I related the piece to the story of the cartoon, which told the struggles of liquid-like alien creatures who on the one hand were not from this world but on the other hand had to adapt to survive.
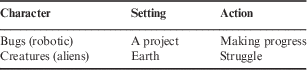
In the real-time descriptors submitted by the first participant during the free-association task, the same narrative is apparent with ‘bugs’ that are ‘flying’ and ‘walking’ while making progress on a task. In the second participant’s real-time descriptors, instead of aliens, there are other creatures referenced as actors, such as ‘baby bird’, ‘huge ant’, ‘snail’ and ‘worm’. The narrative, on the other hand, persists with such descriptors as ‘sent to earth’, ‘can’t fit in’ and ‘struggle again’. The timing of the latter coincides with that of such descriptors by the first participant as ‘some adjustment’ and ‘project continues’. A correspondence chart between two reports can therefore be constructed as seen in Table 2.
Correspondence chart.

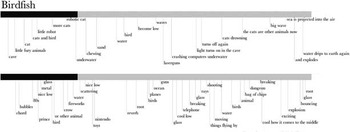
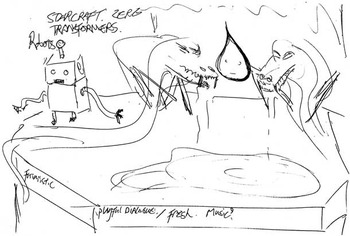
In these cases, we can observe two distinct fabula constructed from the same narrative. However, there is an apparent pairing between how these two separate stories are set up, and how the actors populating these stories act. Figure 5 shows another impression of Birdfish in the form of a drawing submitted by a third participant.
A participant’s general impression of Birdfish in the form of a drawing.2

3.1. The role of reality in narratives
But how are such narratives constructed on both esthesic and poietic levels? Deleuze and Guattari define the artist’s greatest challenge as making an artwork stand up on its own; this requires ‘from the viewpoint of lived perceptions and affections, great geometrical improbability, physical imperfection, and organic abnormality’ (Deleuze and Guattari Reference Deleuze and Guattari1994: 465). In his Aesthetic Theory, Theodor Adorno describes art as the language of wanting the other: ‘The elements of this other are present in reality and they require only the most minute displacement into a new constellation to find their right position’ (Adorno Reference Adorno1997: 132). An artwork is a demonstration of such abnormalities or displacements in reality.
In literature, if a text demands too much interpretation, it prompts the reader to naturalise it by using acquired knowledge to resolve narrative inconsistencies (Mikkonen Reference Mikkonen2011: 113). In doing so, an assumption of world semantics is transferred from the real world to the fictional world (Bunia Reference Bunia2010: 699), which makes impossible fiction ‘an ostensible oxymoron’ (Ashline Reference Ashline1995: 215). While there is no narrator in non-vocal music comparable to that in a literary text, listeners partly assume this role by constructing stories out of their experience of a narrative. The artwork does not need to provide every element of the story, since listeners expand their physical experience of a piece by filling in the gaps semantically. In such cases, ‘the principle of minimal departure’ mandates that we structure our interpretation of alternative realities as closely as possible to our own reality (Ryan Reference Ryan1980: 403). A narrative can therefore restrict the information it communicates about a universe to a small set of actors and events that populate it (Bunia Reference Bunia2010: 686). We project things we know about the real world upon the implied reality of a story.
This principle also applies to our auditory cognition, which constantly seeks new information about the environment and ‘compares it to stored experience’ (Truax Reference Truax1984: 26). Previous research has shown that the memory of a sound shares a highly correlated perceptual space with the actual experience of the sound itself (Gygi et al. Reference Gygi, Kidd and Watson2007: 853); this is why our knowledge of likely sequences of sounds significantly aids auditory recognition (Gygi et al. Reference Gygi, Kidd and Watson2004: 1262). The structured environments with which we co-evolve establish a context for our future auditory experiences (Windsor Reference Windsor2000: 20).Footnote
This human disposition is also evident in artistic practice. Composers’ knowledge of how sounds unfold over time is rooted in their former experiences with auditory phenomena. This does not necessarily imply that our mental catalogue of sounds normalises what we imagine as sonically possible. But the abstract is nevertheless a negation of the concrete; reality defines what is unreal. In this vein, Adorno identifies the artistic transformation of material into the unknown as a function of the material itself (Adorno Reference Adorno1997: 148).
4. From Events to Gestures
We develop cognitive representations of acoustic phenomena as components of meaningful events occurring in our daily environments. These representations are collective in terms of their relevance to the observer’s membership in a community of experiences (Dubois et al. Reference Dubois, Guastavino and Raimbault2006: 869). When our mental catalogue of musical experiences fails to guide us through a piece of electronic music, our minds resort to a more general catalogue of experiences: a lack of a musical reference conjures up a profusion of other kinds of references. Smalley refers to this reflex as source bonding, which can occur in ‘the most abstract of works’ (Smalley Reference Smalley1997: 110).
The composer Barry Truax argues that sound-based art shows a strong communicative potential when contextualised in real-world experience (Truax Reference Truax2012: 8). Accordingly, the composer Gary Kendall characterises the experience of meaning in electronic music as being ‘in essential harmony with that in everyday life’ (Kendall Reference Kendall2010: 73). The esthesic complexity of electronic music matches that of environmental sounds,Footnote 3 which ‘can hardly be reduced to a set of physical parameters’ (Dubois Reference Dubois2000: 49). The researcher Nancy VanDerveer describes an environmental sound as being meaningful by virtue of specifying events in the environments (VanDerveer Reference VanDerveer1979: 17). Experimental evidence supports this definition by delineating that environmental sounds are ‘processed and categorised as meaningful events providing relevant information about the environment’ (Guastavino Reference Guastavino2007: 54).
4.1. Event
Events are units through which we make sense of our immediate surroundings (Gibson Reference Gibson1986: 12). The sun rises, the traffic light turns red, the water boils and the clock ticks. A progression of such events constitutes our everyday narratives. Multimodal stimuli originating from these events are picked up by our sensory mechanisms to be processed by our cognitive faculties. Accordingly, cognitive representations of acoustic phenomena are not only auditory but also visual, kinesthetic and vestibular (Dubois et al. Reference Dubois, Guastavino and Raimbault2006: 869). Environmental sounds are in an indexical relationship with such multimodal events: ‘a sound is news that something’s happening’ (Jenkins Reference Jenkins1985: 117).
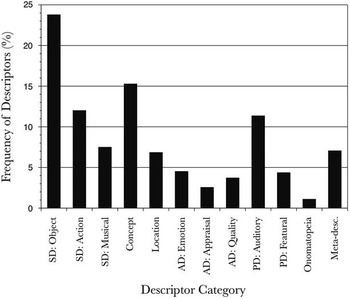
Therefore, in daily life, we listen to events rather than sounds themselves (Gaver Reference Gaver1993: 285). This proposition is corroborated by previous research on auditory cognition. In an experiment-based study on the categorisation of everyday auditory events, Dubois et al. found that a majority of participants classified sounds based on either source or action characteristics (Dubois et al. Reference Dubois, Guastavino and Raimbault2006: 867). Several other studies delineate these properties as the most salient features used by the participants when describing everyday sounds (Gygi et al. Reference Gygi, Kidd and Watson2007: 853; Brazil, Fernström and Bowers Reference Brazil, Fernström and Bowers2009: 2). Marcell et al., who conducted an experiment on confrontation naming of environmental sounds, generated 27 labels based on the descriptors provided by the participants. These labels were primarily based on object types, followed by event types and finally on the location or the context within which the event is heard (Marcell et al. Reference Marcell, Borella, Greene, Kerr and Rogers2000: 830). Such reports portray an intrinsic relationship between environmental sounds and events on the basis of source and action properties. The results of the current study reveal a similar association between sound elements in electronic music and the perception of objects and actions as seen in Figure 6.
Overall categorical distribution of real-time descriptors.

Obviously, electronic music and environmental sounds do not warrant a one-to-one comparison. This is particularly apparent from the salience of the concept and the perceptual descriptors, which were prominently used for Element Yon. However, the source (SD) and the location descriptors combined constitute an overwhelming majority across all pieces.
4.2. Gesture
According to VanDerveer, environmental sounds are not part of a communication system (VanDerveer Reference VanDerveer1979: 17). From this point of view, they lack the active participation inherent to poietic and esthesic processes. A concept that shares various cognitive features with environmental events while at the same time bearing a poietic initiative is gesture. The music theorist Robert Hatten defines human gesture as ‘any energetic shaping through time that may be interpreted as significant’ (Hatten Reference Hatten2006: 1). The composer Wilson Coker offers a converging view when he describes gesture as ‘a recognisable formal unit’ that signifies musical or non-musical objects, events and actions (Coker Reference Coker1972: 18). We can formulate gesture as a trace unit in electronic music as a counterpart of events in the environment.
A gesture in electronic music…
4.2.1. …is a meaningful narrative unit
When the human mind is processing information, it looks for hierarchies and structural units to form systematic organisations (Özcan and Egmond Reference Özcan and van Egmond2007: 198). We utilise these meaningful units to navigate through the progression of our experiences. This is why Gibson considers events as the timescale of the environment (Gibson Reference Gibson1986: 12). Accordingly, we can consider gesture as the scale at which a piece of electronic music ticks. Gestures act as cognitive units through which listeners make sense of their experience.
The composer Leonard Meyer groups musical meaning into two categories (Meyer Reference Meyer1956: 35): a designative meaning is communicated when a stimulus indicates an event that is different from itself in kind (e.g. a word designating an object that itself is not a word); conversely, when the two are of the same kind, an embodied meaning is established. These can be applied to the semantic relationship between electronic music and environmental events as follows:

The electronic music gesture and everyday sounds are of the same modality. Through the principle of source bonding, the semantic relationship between the two is embodied. An environmental sound, however, communicates a designative meaning pertaining to an event, and it cannot exist as a disembodied phenomenon stripped of its causality. Although the composer and the listener meet in an absence of multimodal cues that could simplify the negotiation between a concept and its percept, sounds nevertheless induce event-related information in multiple modalities (Warren et al. Reference Warren, Kim and Husney1987: 326). The semantic relationship between an electronic music gesture and an environmental event can be severed by obfuscating the embodied meaning between the gesture and environmental sounds, which is a common technique of musique concrète.
From a poietic perspective, a gesture can be abstract and incite an emotion or a perceptual awareness. It can also be representational with the intention of triggering mental imagery. Listener reports that reflect both types of meaning are spread throughout this text. From an esthesic perspective, the semantic play between two such meanings will be fluid. In Diegese, a particular moment in the piece was marked by separate participants with both affective descriptors, such as ‘creepy’, ‘fear’, ‘alien’ and ‘weird’, and source descriptors, such as ‘creature’, ‘insects’ and ‘take these bugs out of my ears’.
The quotation of traditional musical forms within electronic music reveals an interesting facet of musical meaning that can be exploited to evoke affective states (Çamcı Reference Çamcı2014). In Christmas 2013, I used instrumental sounds to instill a sense of familiarity into a relatively alien sound world. Regarding the final piano gesture in Christmas 2013, a participant with no musical background submitted the descriptor ‘sounds like music’. In his general impressions, another participant reported that although most of the sounds caused him to feel like being in ‘a place not on this earth’, the piano sound made him ‘come back to earth, and reminded [him] that it was music [he] was listening to’. Similarly, one participant wrote ‘in an imaginary world, suddenly something real begins to move’. Another participant referred to the piano sound as ‘something to hold onto in the insecure environment’.
4.2.2. …coexists with other gestures at various timescales
A gesture in electronic music can range from the briefest sound that can be perceived to the longest sound that can be recognised as having a discrete form. This quality of gestures is also shared by environmental sounds: both the sound of a drill working throughout the day and the sound of a buzzer going off once represent singular events. Regardless of their temporal extent, we manage to discern them as self-contained phenomena. As Lakoff and Johnson state, we ‘impose artificial boundaries that make physical phenomena discrete just as we are: entities bounded by a surface’ (Lakoff and Johnson Reference Lakoff and Johnson2003: 26).
A narrative is a temporal progression, and the time needed to consume it is the time needed to traverse the narrative (Genette Reference Genette1980: 34). In literature, this time is borrowed from the pace of reading. In music, the physical time needed to move through a narrative is predetermined by the composer. However, our understanding of time is a result of the ‘experience of successions’ (Fraisse Reference Fraisse1963: 1). Since perceived time ticks in events, the time experienced by the listener can therefore speed up or slow down relative to the unremitting progression of seconds. In Christmas 2013, various participants referred to their experience of time with comments such as ‘trying to stop time by going ultra slowly’, ‘objects in slow motion’ and ‘the piece made my brain slow down for a moment’.
Just as we are able to distinguish simultaneous events transpiring in our immediate environments from one another, we can also make a meaningful segmentation of concurrent gestures in music. This is why Stockhausen describes multilayered spatiality as not only a composition technique but also a prevalent feature of human experience (Stockhausen Reference Stockhausen1989: 106). The coexistence of gestures is inherently coupled with their ability to operate at various timescales. A variety in timescales can be crucial in articulating the figure and ground roles between gestures. The relationship between these two roles, which are inherited from Gestalt theory, is similar to the subject and background contrast used in photography. In Diegese, between 0′24″ and 0′49″, gestures of different timescales are layered on top of each other. In the layer that is the farthest in terms of its spatial positioning, an ambient texture persists throughout the entire section. Coming closer, a low frequency textural element is initiated at 0′32″. In a concurrent layer, another gesture pulsating at the granular scale establishes a third texture. Although this layer is in closer proximity to the listener when compared to the first two layers that are heavily reverberated, it is stripped of a figure role through an audio decorelation of the left and right channels. Lastly, in a fourth layer, another gesture consisting of percussive elements assumes an unmistakable figure role as it travels the entire spatial extent of the piece, which has already been articulated by the first three layers. Around the same moment in this part of the piece, separate participants submitted the following descriptors: ‘ambient’, ‘sense of space’, ‘saw’ (oscillator), ‘bug’ and ‘someone at the door’. Such descriptors reveal that listeners not only are capable of distinguishing between coexisting gestures, but also may not necessarily prioritise figure elements at any given time.
4.2.3. …operates within causal networks
As Gibson states, ecological events can be nested within longer events (Gibson Reference Gibson1986: 110). While a gesture is a temporal unfolding in itself, a multitude of gestures can mark the temporal unfolding of a higher-level form that represents a causal network. In Roads’s words:
Interactions between different sounds suggest causalities, as if one sound spawned, triggered, crashed into, bonded with, or dissolved into another sound. Thus the introduction of every new sound contributes to the unfolding of a musical narrative. (Roads Reference Roads2015: 328)
According to Wishart, contextual cues not only change our recognition of an auditory image, but also how we interpret the events we hear (Wishart Reference Wishart1996: 152). Accordingly, cognitive cues can be used to instigate semantic contexts for gestures. In Birdfish, clear references to water and organic creatures, which were the two most salient types of descriptors for this piece, caused listeners to imagine possible environments (i.e. contexts) such as ‘underwater’, ‘lake’ and ‘aquarium’. When the recognition of amphibian-like sounds was evaluated within a space articulated with heavy reverberation, such descriptors as ‘cave’ and ‘dungeon’ appeared with the former being one of the salient descriptors gathered from the preliminary study. When combined with the inference of a cave, liquid-like sounds have lead to general impressions such as ‘water dripping off of a cave wall’ and ‘slimy rocks and stalactites’. Such combinations of descriptors instigate high-level semantic processes beyond what the individual components of these combinations would achieve alone. In other words, the semantic coherence between the actors can imply environments or even new actors, since, as the neuroscientist Moshe Bar states, ‘recognition of an object that is highly associated with a certain context facilitates the recognition of other objects that share the same context’ (Bar Reference Bar2004: 617).
Once listeners establish a semantic context, they display a tendency to hold on to it for the remainder of the piece. For instance, a listener of Birdfish who used such labels as ‘underwater’, ‘sand’ and ‘waves’ early on in the piece, described the ending of the piece with ‘big waves’, ‘the sea is projected in the air and explodes’. The participant who imagined a story of robotic bugs working on a project, which was mentioned earlier, described the ending of the piece with such descriptors as ‘workers are pleased’, ‘big cheers’ and ‘project successful’. Here we can see that both participants felt a need to address the climactic ending of the piece; but how this climax was situated in their respective fabulae shows a semantic coherence with their existing causal networks, which, in literature, is considered a product of readers’ narrative interpretation that ‘represent the relationships between the causes and consequences of events in a story’ (Gerrig and Egidi Reference Gerrig and Egidi2003: 44).
The final section of Element Yon, which I have previously described as being composed ‘to obfuscate any motivic closures to the piece’, exploits the listener’s reliance on causality. During the experiments, this resulted in several descriptors and impressions relating to anticipation. One participant in her general impressions wrote: ‘Unpredictable. I liked that a lot.’ Later, in her real-time descriptors, this participant marked the final section of the piece with the word ‘unpredictable’. At an approximate moment in the piece, another participant submitted ‘when it’s over, I can’t tell’ as a descriptor.
In Christmas 2013, the juxtaposition of a Christmas carol with causally unfolding electronic gestures was intended to evoke a sense of nostalgia in a vast post-apocalyptic environment devoid of human beings. An inexperienced listener wrote in her general impressions that the opening was familiar, but as the melodic component dissipated, the piece took a turn to what she would later refer to in her real-time descriptors as causing ‘suspense’:
It started to sound like bits and pieces of sounds and noises that I failed to make sense of. But these sounds, when they are together, they gave me this tense, mysterious feeling I don’t know why.
4.2.4. …implies intentionality
Unlike environmental sounds, gestures are part of a communication system. Intentionality is what separates a gesture in electronic music from an environmental sound.Footnote 4 Gritten and King state that for a sound to be marked as a gesture, ‘it must be taken intentionally by an interpreter’ (Gritten and King Reference Gritten and King2006: xx). Gestures arouse mental imagery, which, similar to all devices of communication, ‘bears intentionality in the sense of being of, about, or directed at something’ whether that something is real or unreal (Thomas Reference Thomas2010).
Actions on the part of the electronic music composer result in intentional gestures. However, an electronic sound can also be a composite of numerous actions performed separately. The result can nevertheless imply a unified intention. Furthermore, not all gestures are the outcome of a poietic initiative, for instance, when algorithmic processes are used. Electronic music composition can indeed encompass approaches that are devoid of poietic narrative arcs. However, the composer’s conception of a musical work, in terms of goals and techniques, will not always correspond to what is perceived by the listener (Smalley Reference Smalley1997: 107). For instance, a participant expressed in his general impressions that Element Yon might be a generative piece, although its sound material was almost entirely performed. Conversely, some participants have associated the algorithmically generated sections of Diegese with choreographed narratives.
This implies that a gesture can originate in both the poiesis and the esthesis. What forms a gesture in the trace is intentionality: by imposing a unitary function to the physical artefact that is the trace, the listener extracts an intentional gesture. Conflicts of intentionality between the poietic and the esthesic processes are impossible to avoid. Esthesic intentionality will result in gestural hierarchies which may or may not serve the narrative goals of the composer; but they will nevertheless be obedient to the listener’s construction of a fabula. However, a translation of intentionality is also possible. Here is a general impression response from the preliminary experiments conducted with Birdfish:
The sounds heard and experienced by a baby in its mother’s womb prior to birth, and its eventual coming to earth.
In terms of its actors and settings, this description is in disagreement with the story I was trying to communicate. However, there is an uncanny congruence between the two interpretations of the narrative in terms of the metaphors and the story arcs: it was my intention to narrate a story of organic forms that evolve as they travel from beneath the ocean into the sky. In this particular case, once the participant constructed an alternative narrative, my poietic intentions were translated. Gestures that give a sense of a cavernous, underwater environment were interpreted as a womb. Having established such a setting, the participant contextualised the remainder of the gestures accordingly.
5. Conclusion
Based on the qualities described above, we can arrive at an idiomatic definition as follows: a gesture in electronic music is an intentional narrative unit that coexists with other gestures in causal relationships at various timescales. Most of the traits that contribute to this characterisation are tightly coupled with one another: coexistence is a function of causality, which in turn is a function of intentionality, and vice versa. While sound-producing events in our environments also bear meaning, coexist at various timescales, and operate within causal networks, intentionality is what sets gestures apart as narrative units. Relying on its poietic and esthesic dimensions detailed in this text, gesture can be utilised as an analytical tool in electronic music, particularly when dealing with the narrative structure of a work.
The current study can be considered a new look at the age-old question of what we hear in electronic music. The use of the electronic medium to compose music entails a variety of cognitive idiosyncrasies, which are experienced by both the artist and the audience. The categorical analysis of the experiment results presented here highlights a substantial variety from one piece to another in terms of the cognitive determinants of the listener experience. In 1986, the composer Simon Emmerson suggested that even if the artist is not interested in manipulating the images associated with electronic music, the duality between mimetic and abstract contents must at least be taken into account (Emmerson Reference Emmerson1986: 19). In the same article, Emmerson called for future research to investigate ‘deeper levels of symbolic representation and communication’ (21). I believe that the current study responds to this call in its pursuit of furthering our understanding of narrativity in electronic music.