Introduction
The lower atmospheric duct commonly encountered in marine boundary layer is an anomalous electromagnetic environment, which is caused by small changes of the index of refraction due to the sharp variation in the vertical atmospheric temperature and humidity above the sea surface. Hence, the performance of the radar system and the communication system that are designed to operate under standard atmospheric conditions with a typical slope of 0.118 M-units/s work in the non-standard environment may be greatly changed, such as the maximum operation range, creation of radar holes where the radar is practically blind, and strengthened sea surface clutter, etc [Reference Yardim, Gerstoft and Hodgkiss1, Reference Yardim, Gerstoft and Hodgkiss2]. Clearly, accurate prediction of atmospheric environment is crucial for evaluating the performance of both the radar and communication systems in the marine environment.
Since the radar sea clutter is significantly changed by the atmospheric duct, in turn, radar sea clutter contains useful information on atmospheric environment, which makes it possible to determine refractivity from clutter (RFC) [Reference Rogers, Hattan and Stapleton3–Reference Karimian, Yardim, Gerstoft, Hodgkiss and Barrios5]. The RFC technique is widely used in the field of atmospheric duct estimation, which has the advantages of simple devices and low cost. Obviously, atmosphere duct estimation using RFC technique is an inverse problem, and the optimization algorithm can exactly find the best refractivity profile among the candidate profiles according to the objective function defined by the observed and simulated clutter power. The smaller the objective function value, the better match gets. The best refractivity profile corresponds to the minimum objective function value, and vice versa.
Gerstoft et al. estimated the atmospheric refractivity from radar sea clutter observations and provide the specific steps involved in RFC [Reference Gerstoft, Rogers, Krolik and Hodgkiss4]. Karimian et al. provided the latest developments in RFC and the area that needs further investigation [Reference Karimian, Yardim, Gerstoft, Hodgkiss and Barrios5]. Yardim et al. applied a Markov chain Monte Carlo samplers to the estimation of the refractivity profile using radar clutter [Reference Yardim, Gerstoft and Hodgkiss6]. Vasudevan et al. utilized the recursive Bayesian estimation framework in the RFC [Reference Vasudevan, Anderson, Kraut, Gerstoft, Rogers and Krolik7]. Douvenot et al. adopted the least square support vector machine method to estimate the refractivity profile of the surface duct based on a pregenerated database [Reference Douvenot, Fabbro, Gerstoft, Bourlier and Saillard8]. Yardim et al. tracked the lower atmospheric refractivity with RFC [Reference Yardim, Gerstoft and Hodgkiss1]. Wang et al. employed the particle swarm optimization algorithm to retrieve the evaporation duct height [Reference Wang, Wu, Zhao and Wang9]. Zhao et al. introduced the simulated annealing algorithm to study the atmospheric duct estimation problem [Reference Zhao, Huang, Xiang and Shi10]. Zhang et al. introduced a four-parameter modified refractivity profile model for the evaporation duct estimation with RFC [Reference Zhang, Wu, Zhu and Wang11]. The artificial bee colony (ABC) algorithm [Reference Karaboga and Basturk12, Reference Karaboga, Gorkemli, Ozturk and Karaboga13] inspired by the intelligent foraging behavior of honey bee swarm is one of the most recently proposed bio-inspired swarm intelligence algorithm, and it is applied to the electromagnetic optimization problem [Reference Karaboga, Gorkemli, Ozturk and Karaboga13] and atmospheric duct estimation [Reference Yang14, Reference Yang, Zhang and Guo15]. Yang employed the ABC to the atmospheric duct estimation, and the results showed that the performance of ABC is better than particle swarm optimizer according to the comparative analysis results [Reference Yang14]. Yang et al. proposed the ABC algorithm combined with opposition-based learning and global best search equation (OGABC) to improve the problems of the slow convergence speed and sinking into local optima appear in the duct estimation problem, and investigation results indicate that the OGABC achieves good performance compared with the ABC and the modified invasive weed optimization [Reference Yang, Zhang and Guo15].
Although there are certain improvements on the ABC, there is still room for seeking a balance between the exploration and exploitation. This is because that both exploration and exploitation are necessary for evolutionary algorithms, but the two aspects contradict to each other [Reference Zhu and Kwong16]. Owing to the search equation in ABC is good at exploration but poor at exploitation, an orthogonal crossover artificial bee colony (OCABC) algorithm based on orthogonal experimental design (OED) is proposed by incorporating the orthogonal crossover (OC) into ABC, which makes use of the OC to improve the search ability. In addition, a novel transmission vector, which will take part in the OCABC, is given to take the advantage of the information of global best solution to generate new candidate solutions with the purpose of enhancing the poor exploitation in ABC.
The forward problem and inverse problem model
The parameterized environmental model
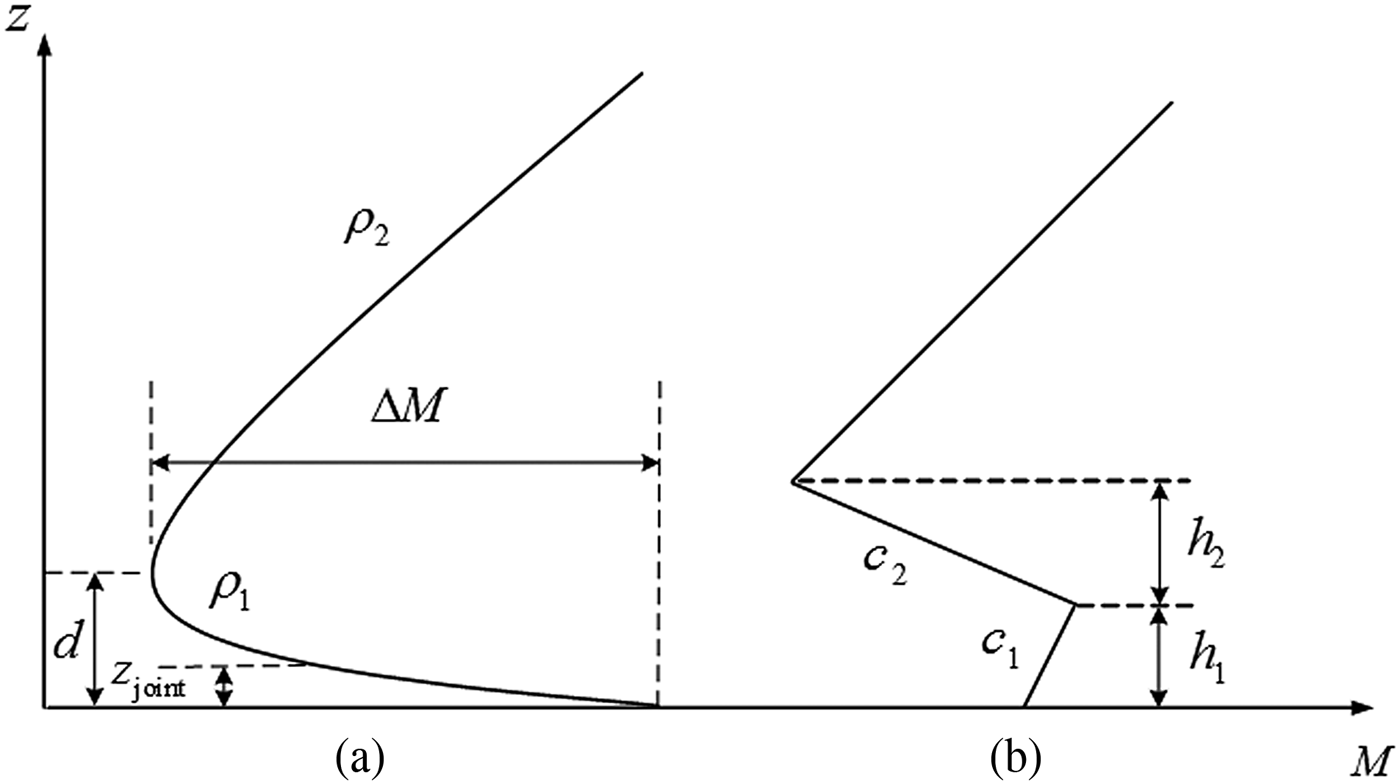
In this paper, we focus on the inversion of the evaporation duct and surface duct estimation problem, and their refractivity profiles are shown in Fig. 1. Owing to the potential drawback of one parameter log-linear profile in describing the evaporation duct, the following four-parameter model is adopted [Reference Zhang, Wu, Zhu and Wang11]
 $$M(z) = M_0 + kz\quad z \le z_{\,jo{\mathop{\rm int}} },$$
 $$\eqalign{& M(z) = M_0 + (k - 0.125\rho _1)z_{\,jo{\mathop{\rm int}} } + \cr & \quad 0.125\rho _1z + 0.125\rho _1d\ln \left( {\displaystyle{{z_{\,jo{\mathop{\rm int}} } + z_0} \over {z + z_0}}} \right)z_{\,jo{\mathop{\rm int}} } < z < d,} $$
 $$\eqalign{M(z) = & \, M_0 + (k - 0.125\rho _1)z_{\,jo{\mathop{\rm int}}} + 0.125(\rho _1 - \rho _2)d \cr & + 0.125\rho _2z + 0.125d\ln \cr & \quad \left[ {\displaystyle{{{(z_{\,jo{\mathop{\rm int}}} + z_0)}^{\rho _1}} \over {{(d + z_0)}^{\rho _1 - \rho _2} \cdot {(z + z_0)}^{\rho _2}}}} \right]\quad z \ge d,}$$
where M 0 is the base refractivity, k is the slope of the line, z is the height above the sea surface, d is the evaporation duct height, z 0 is the roughness factor usually taken as  $0.00015,\;z_{jo{\mathop{\rm int}}} $ represents the specific height, ρ 1 and ρ 2 are the adjustment factors for the profile less and greater than d, respectively. It is noted that ΔM represents the evaporation duct strength, which is related to k by implicit equation (4)
 $$\eqalign{& \Delta M = (0.125\rho _1 - k)\left( {\displaystyle{d \over {1 - 8k/\rho _1}} - z_0} \right) \cr & \quad + 0.125\rho _1d\ln [(d + z_0)(1 - 8k/\rho _1)/e/d].}$$
The model of refractivity profile. (a) Four-parameter evaporation duct; (b) surface duct.

Once equation (4) is solved for k, the  $z_{jo{\mathop{\rm int}}} $ can be easily obtained by equation (5)
 $$z_{\,jo{\mathop{\rm int}}} = \displaystyle{d \over {1 - 8k/\rho _1}} - z_0, \;k \le 0.$$
Obviously, the four-parameter evaporation duct profile can be obtained by equations (1)–(5) and determined by the parameter vector  ${\bi m} = (d,\Delta M,\rho _1,\rho _2)$.
The surface duct can be represented by the four-parameter trilinear refractivity profile [Reference Yardim, Gerstoft and Hodgkiss1]
 $$\eqalign{& M(z) = M_0 + \cr & \quad \left\{ \matrix{c_1z \qquad\qquad\qquad\qquad\qquad\qquad\qquad \!\! z \lt h_1 \hfill \cr c_1h_1 + c_2(z - h_1) \qquad\qquad\qquad\qquad h_1 \le z \le h_2 \hfill \cr c_1h_1 + c_2h_2 + 0.118(z - h_1 - h_2) \qquad \!\!\! z \gt h_2 \hfill} \right.,}$$
where c 1 and h 1 are the slope and thickness of the base layer, whereas c 2 and h 2 are the slope and thickness of the inversion layer. The slope of the top layer is treated as a constant at 0.118 M-units/m. Similarly, the surface duct refractivity profile can be described by the parameter vector  ${\bi m} = (c_1,c_2,h_1,h_2)$.
The propagation model
The most commonly adopted method to calculate the over-the-horizon propagation of electromagnetic wave in the atmospheric duct is the split-step Fourier solution of parabolic equation due to its stability and accuracy. If the initial field u(x 0, z) is given, the split-step Fourier solution is obtained by [Reference Barrios17, Reference Sirkova18]
 $$\eqalign{& u(x_0 + \Delta x,z) = e^{ik_0\Delta xM({\bi m},z){10}^{ - 6}} \cr & \quad F^{ - 1}\left\{ {e^{(i\Delta x/2k_0)p^2}F[u(x_0,z)]} \right\},}$$
where k 0 is the free-space wavenumber, M is the modified refractivity,  ${\bi m}$ is the refractivity parameter vector used to describe the refractivity profile of the atmospheric duct, p is the transform variable, Δx is the distance interval, and F and F −1 are the Fourier transform and inverse Fourier transform, respectively.
Correspondingly, the propagation loss  $L(x,{\bi m})$ and the radar sea clutter power
 $P_c^r (x,{\bi m})$ can be easily obtained by the following equations [Reference Gerstoft, Rogers, Krolik and Hodgkiss4, Reference Douvenot, Fabbro, Gerstoft, Bourlier and Saillard8]
 $$\eqalign{& L(x,{\bi m}) = 32.45 + 20\lg f \cr & \quad + 20\lg x - 20\lg (\sqrt x \left \vert {u(x,z)} \right \vert ),}$$
 $$P_c^r (x,{\bi m}) = - 2L(x,{\bi m}) + \sigma ^ \circ + 10\lg (x) + C,$$
where f denotes the frequency in MHz, x is the propagation distance, u(x, z) represents the field distribution, σ° is the radar cross-section, C is a constant.
The objective function
To estimate the parameter vector  ${\bi m}$, the following least squares objective function is used [Reference Gerstoft, Rogers, Krolik and Hodgkiss4]
 $$f_{obj}({\bi m}) = {\bi e}^{\rm T}{\bi e},$$
 $${\bi e}{\rm =} {\bi P}_c^{obs} - {\bi P}_c^r ({\bi m}) - {\hat {\!T}},$$
 $${\hat T} = {\bar{\bi P}}_{c}^{obs} - {\bar{\bi P}}_{c}^{r} ({\bi m}),$$
where  ${\bi P}_c^{obs} $ and
 ${\bi P}_c^r ({\bi m})$ stand for the observed and received clutter power at different ranges, and the bar stands for the mean across the elements.
Basic ABC algorithm
The ABC algorithm proposed by Karaboga and Basturk [Reference Karaboga and Basturk12] is a relatively new swarm optimization algorithm, which simulates the foraging behavior of honey bee swarm. In ABC, a colony contains three types of bees: employed bees, onlooker bees, and scouts. The employed bees find the food sources and share the valuable information with onlooker bees. The onlooker bees in the hive need to choose the excellent food sources according to the information gathered by the employed bees. A food source is abandoned by the employed bee when its quality cannot be improved through a predetermined condition, and the employed bee becomes a scout. Then, the corresponding food source is randomly replaced by a new food source in the vicinity of the hive.
In ABC, a food source position stands for a possible solution of the optimization problem and the nectar amount of each food source represents the corresponding fitness. In ABC, first half of the colony is treated as the employed bees and the second half is called the onlookers, and the number of the employed bees or the onlookers is equal to the number of food source in the colony.
In the initialization phase, ABC generates a randomly distributed initial population. Each initial solution X i = [x i,1, x i,2, …, x i,D] is given by
 $$x_{i,j} = x_{min,j} + rand(0,1)(x_{max,j} - x_{min,j}),$$
where i = 1, 2, …, SN, j = 1, 2, …, D, SN is the number of the solutions and D is the dimension of the optimization problem; rand(0, 1) represents a uniformly distributed random number in the range (0, 1), x min,j and x max,j are the lower and upper bounds of the jth dimension, respectively.
In the employed bee phase, a new candidate solution V i is generated by the old one X i according to the following equation
 $$v_{i,j} = x_{i,j} + \phi _{i,j}(x_{i,j} - x_{k,j}),$$
where j ∈ {1, 2, …, SN} and k ∈ {1, 2, …, SN} are randomly chosen indices and satisfy i ≠ k, ϕ i,j is a uniform random number in the range ( − 1, 1).
In the onlooker phase, the food source is selected according to the probability value p i related to the employed bees
 $$p_i = \displaystyle{{\,fit_i} \over {\sum\nolimits_{\,j = 1}^{SN} {\,fit_j}}},$$
where fit i is the fitness value of the solution i. In addition, the chosen food source position is updated by equation (14) to produce a new candidate food source. A greedy selection method is utilized to choose the better food source between the old and the new one in the employed bee phase and the onlooker bee phase.
In the scout phase, if a food source cannot be improved further through a predetermined parameter, called limit, it is abandoned and should be replaced by a new food source using equation (13). Then, the corresponding employed bee becomes a scout.
THE OCABC algorithm
The performance of evolutionary algorithms can be greatly improved by the OC since OED may be a powerful tool to discover the useful information from each food source's previous search experiences and utilize the valuable information to find an excellent candidate solution [Reference Gao, Liu and Huang19–Reference Xiong, Shi and Duan23]. In the following, an improved ABC named OCABC is proposed based on OED.
Orthogonal experimental design
The orthogonal array (OA) is the core in the OED. With the help of an OA, the best combination may be obtained by testing a small number of well-representative experimental cases. Let L M(Q N) stands for an OA with N factors and Q levels per factor, and L represents the OA and M is the number of combinations of levels. The estimation problem in this paper is a four-parameter inverse problem, so the L 9(34) OA [Reference Gao, Liu and Huang19–Reference Xiong, Shi and Duan23] is suitable
 $$L_9(3^4) = \left[ {\matrix{ 1 & 1 & 1 & 1 \cr 1 & 2 & 2 & 2 \cr 1 & 3 & 3 & 3 \cr 2 & 1 & 2 & 3 \cr 2 & 2 & 3 & 1 \cr 2 & 3 & 1 & 2 \cr 3 & 1 & 3 & 2 \cr 3 & 2 & 1 & 3 \cr 3 & 3 & 2 & 1 \cr}} \right].$$
In L 9(34), there are four factors, three levels per factor and nine combinations of levels. Each row in L 9(34) denotes a combination of levels, namely, a test. The OA in equation (16) has four columns, meaning that it is suitable for the estimation problem with at most four-parameter.
Orthogonal crossover
The OC is first introduced by Leung and Wang, and it works on two parent solutions  ${\bi r} = (r_1, \ldots, r_D)$ and
 ${\bi t} = (t_1, \ldots, t_D)$. Thus, the corresponding solution range is defined by [Reference Leung and Wang20]
 $${\bi l} = [\min (r_1,t_1),\min (r_2,t_2), \ldots, \min (r_D,t_D)],$$
 $${\bi u} = [\max (r_1,t_1),\max (r_2,t_2), \ldots, \max (r_D,t_D)].$$
Evidently, the solution range for x i is [l i, u i] = [min (r i, t i), max (r i, t i)]. Now, we quantize the i th dimension of  $({\bi l},{\bi u})$ into Q levels
 $$l_{i,j} = l_i + \displaystyle{{\,j - 1} \over {Q - 1}}(u_i - l_i)\quad j = 1, \ldots, Q.$$
The solution range defined by  ${\bi r}$ and
 ${\bi t}$ will have Q D points after quantization since each factor has Q possible values. Here, we take the L 9(34) OA mentioned above as an example to explain the advantages of OED. Although it has 34 feasible solutions after quantization, only nine high-quality representative points that scattered uniformly over the solution range are tested to reduce the amount of computation and choose the best individual.
The OC operator based on OED is a powerful search tool, which is employed to find a promising candidate solution by combining the information of X i and T i. In this paper, the vector X i is randomly selected from the current population and T i is a transmission vector.
In order to enhance the poor exploitation ability of ABC and make a balance between the exploration and exploitation ability, a novel transmission vector T i is constructed via the following equation
 $$T_i = X_{best} + rand(0,1) \cdot (X_{r1} - X_{r2}),$$
where X best is the global best solution, the subscripts r 1 and r 2 are different indices uniformly randomly selected from (1, SN) and satisfy r 1 ≠ r 2 ≠ i. In equation (20), rand(0, 1) is used to add more variation to the optimization process, and X best is employed to improve the poor exploitation ability in ABC.
It should be noted that the computation cost will rapidly increase from SN to SN × (M + 1) at the employed bee stage if the OC operator is applied to each food source X i. Hence, it is unwise to perform the OC operator on each pair of X i and T i at each generation. In this paper, the OC is executed five times at each generation to reduce the computation cost and improve the performance of the algorithm.
The procedures of OCABC
Since the search equation of ABC is good at exploration but poor at exploitation, the improved ABC named OCABC algorithm based on OC is proposed. The OC is used to discover the good information from X i and T i to produce an excellent candidate solution V i, and the information of global best solution in the transmission vector can strengthen the exploitation ability and accelerate convergence. The main steps of OCABC are summarized below:
Step 1 Set the parameters and initialize the population;
Step 2 Randomly choose a small number of indices from (1, SN) to form a index vector o, where SN is the number of food sources;
Step 3 At the employed bee stage
Step 3.1
If i is not equal to one of the elements in the index vector o
Step 3.1.1 Generate a candidate food source V i by the search equation (14) in ABC;
Else
Step 3.1.2 Generate a vector T o(k) by equation (20) and a suitable L M(Q N) OA;
Step 3.1.3 Perform the OC operator on T o(k) and X o(k) to produce M tested candidate food sources Z j(1 ≤ j ≤ M) according to the OA generated in Step 3.1.2;
Step 3.1.4 Evaluate each of the tested candidate food source Z j(1 ≤ j ≤ M) and find the best candidate food source Z b, namely, the V o(k);
Step 3.2 Select the better food source between X i and V o(k);
End
Step 4 At the onlooker bee stage
Step 4.1 Update the position of food sources;
Step 4.2 Select the better food source again.
Step 5 Memorize the best solution so far.
Step 6 At the scout stage
The food source is replaced by a new random solution when the trial counter exceeds the limit.
Step 7 Repeat Step 2 to Step 6 until a terminating condition is reached.
Results and discussion
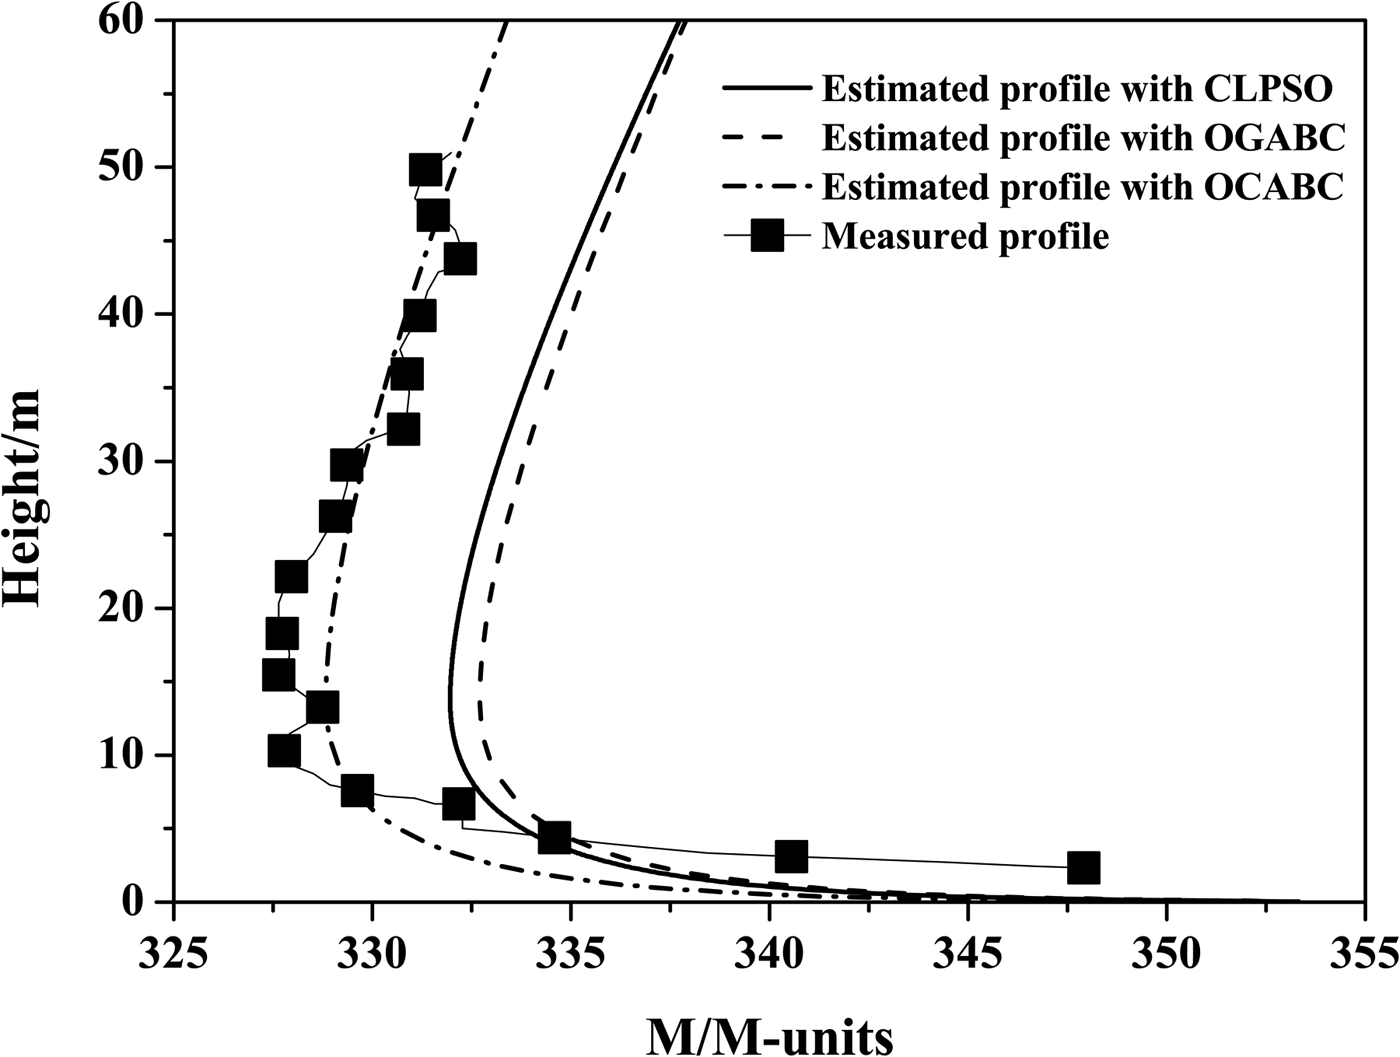
In the following, the OCABC is applied to the atmospheric duct estimation problem with the RFC technique, and the results of OCABC are compared with those of the comprehensive learning particle swarm optimizer (CLPSO) [Reference Liang, Qin, Suganthan and Baskar24] and the OGABC [Reference Yang, Zhang and Guo15]. Firstly, the measured data collected in East China Sea [Reference Wang, Wu, Zhao and Wang9] are utilized to test the accuracy of the OCABC. Especially, the most common used one-parameter log-linear refractivity model is replaced by the four-parameter one [Reference Zhang, Wu, Zhu and Wang11] owing to its potential drawback in describing the evaporation duct environment. That is to say, the four characteristic parameters in the vector  ${\bi m} = (d,\Delta M,\rho _1,\rho _2)$ of evaporation duct need to be estimated. The parameter settings for OCABC in the evaporation duct estimation are presented as follows: the population size is 60, the number of food sources is 30, the parameter limit is 25, the OC is executed five times at each generation, the maximum number of function evaluations (FEs) is 6000 in each run for a fair comparison, the L 9(34) OA is adopted, and the estimated profile is obtained with averagely 10 independent runs. In addition, the radar system parameters are identical to Ref. [Reference Wang, Wu, Zhao and Wang9].
Figure 2 shows the comparison of the estimated refractivity profiles obtained by CLPSO, OGABC, and OCABC with the measured one. It can be observed from Fig. 2 that the estimation profile obtained by the OCABC matches well with the measured one compared with the CLPSO and OGABC.
The comparison of the estimated refractivity profiles with the measured one.

Then, we apply the OCABC to the surface duct estimation with the simulated radar clutter power obtained by the split-step Fourier solution of parabolic equation to further test the stability and accuracy. As you know, the surface duct is commonly represented by the four-parameter refractivity profile, namely, the four characteristic parameters  ${\bi m} = (c_1,c_2,h_1,h_2)$ of surface duct also need to be estimated. The search range of surface duct is defined by: 0 ≤ c 1 ≤ 0.25, − 3.5 ≤ c 2 ≤ −1.0, 25.0 ≤ h 1 ≤ 50.0, 10.0 ≤ h 2 ≤ 30.0. In simulations, the radar works at a frequency of 10 GHz, antenna height of 7 m, power of 91.4 dBm, antenna gain of 52.8 dB, 600 m range bin, beam width of 0.7°, and HH polarization (Horizontal transmit and Horizontal receive). Besides, the radar clutter power simulated by the profile vector
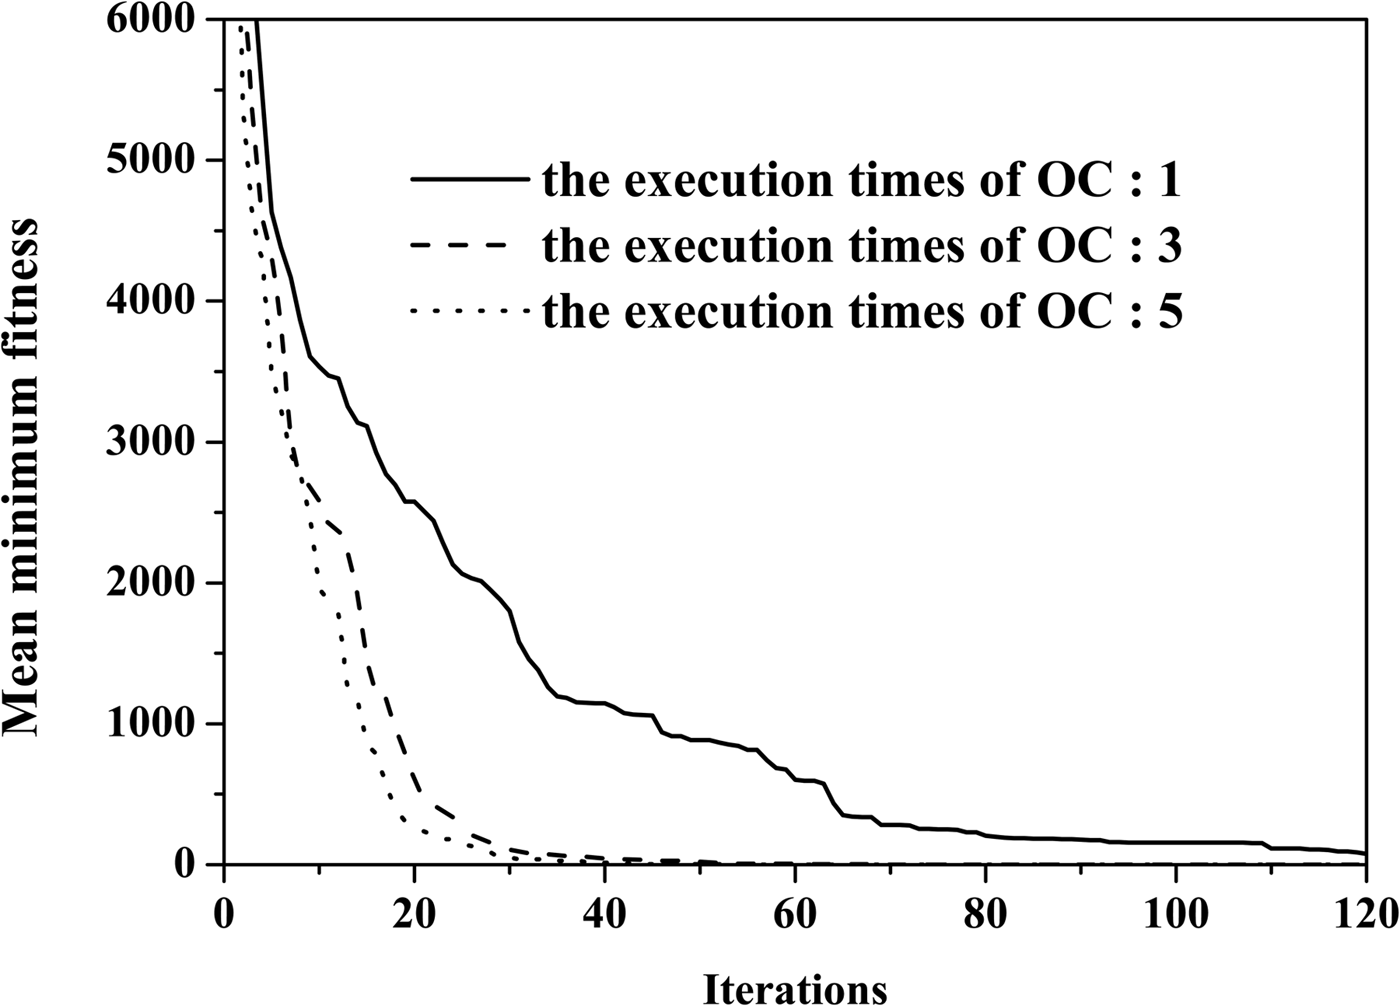
 ${\bi m} = (0.13, - 2.5,40,20)$ is treated as the observed radar clutter power. The Gaussian noise with zero mean is taken into account in the simulated radar clutter power to add the fluctuation to it, and the standard deviation denotes the noise level. The most parameter settings used in OCABC for the surface duct estimation are the same as those given above except for the number of iterations which is 120 and all the estimation results are obtained based on 30 independent runs for each algorithm. Owing to the execution times of OC is of crucial importance to the performance of OCABC. Thus, we will explain how to determine the execution times of OC in the following.
Figure 3 gives the comparison of the convergence progresses with different execution times of OC in the case of without noise. It can be seen that the convergence speed is significantly improved with the increasing number of the execution times of OC, and the difference of the convergence progresses between three and five times is not clear. However, the convergence progress with five times is slightly faster than that of the three times. For this reason, the OC is executed five times at each generation.
The convergence progresses with different execution times of OC.

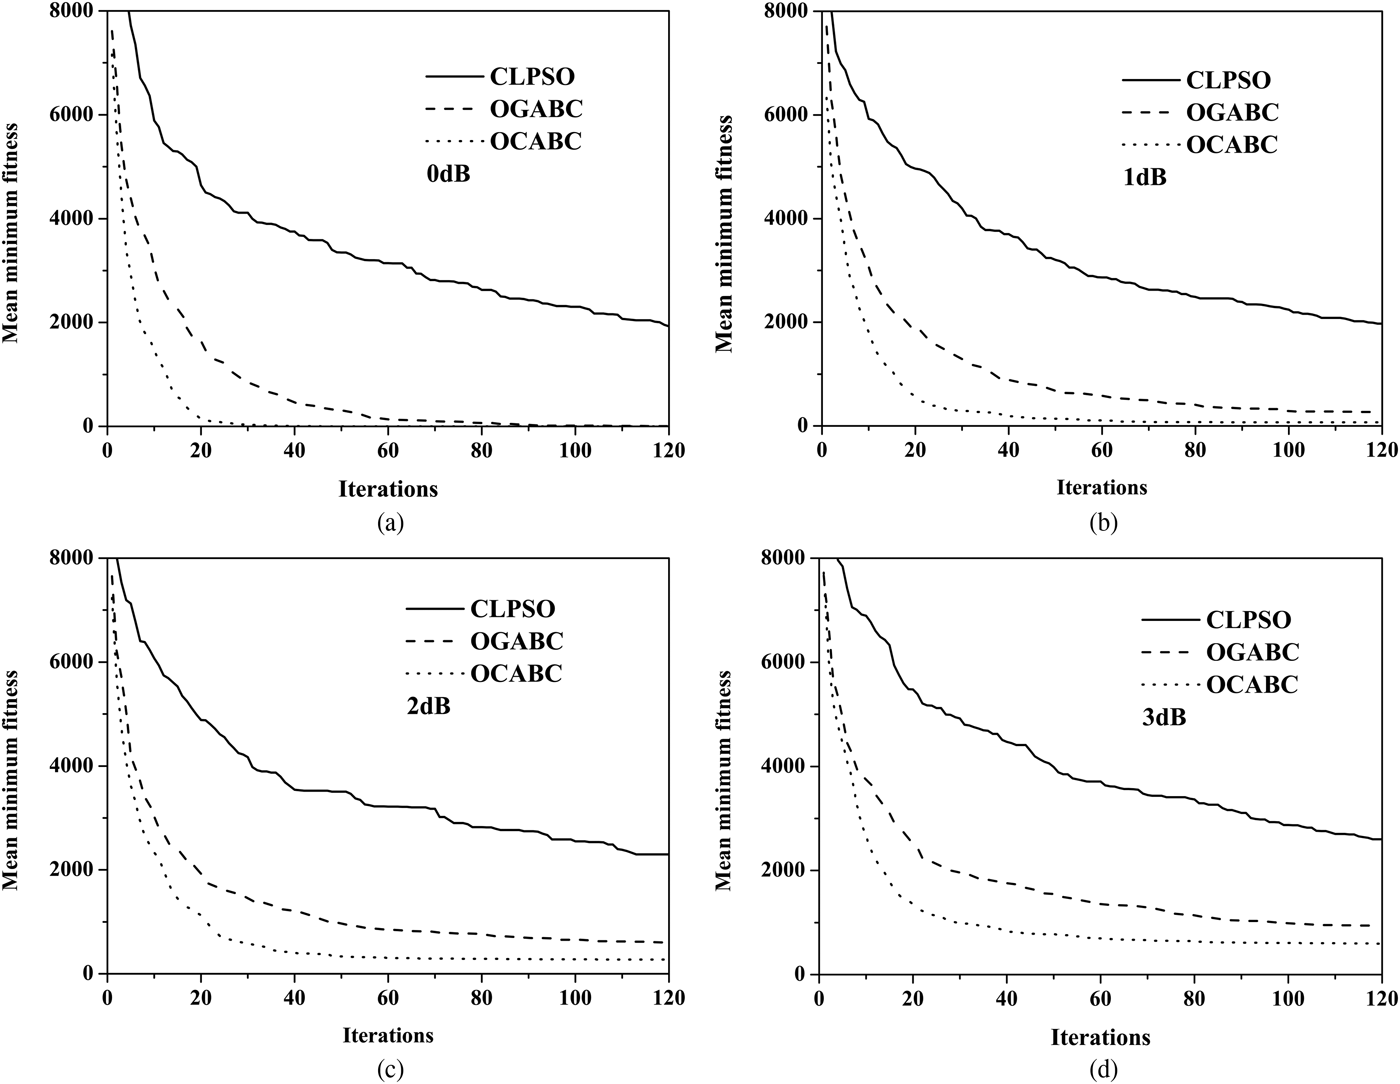
To study the convergence performance of the proposed OCABC, the convergence progresses of OCABC are compared with those of the CLPSO and OGABC, and their convergence progresses are plotted in Fig. 4. We can see from Fig. 4 that OCABC is noticeably faster than CLPSO and OGABC for any noise level. In addition, the OCABC can reach the lowest or the same mean minimum fitness value at a high convergence speed. This may be due to the fact that the global best solution in the transmission vector equation not only strengthen the exploitation ability but also accelerate convergence, and the OC operator can extract useful information from their previous search experiences to produce a better candidate solution.
The comparison of the convergence progresses of CLPSO, OGABC, and OCABC regarding the iterations for the same noise level. (a) 0 dB; (b) 1 dB; (c) 2 dB; (d) 3 dB.

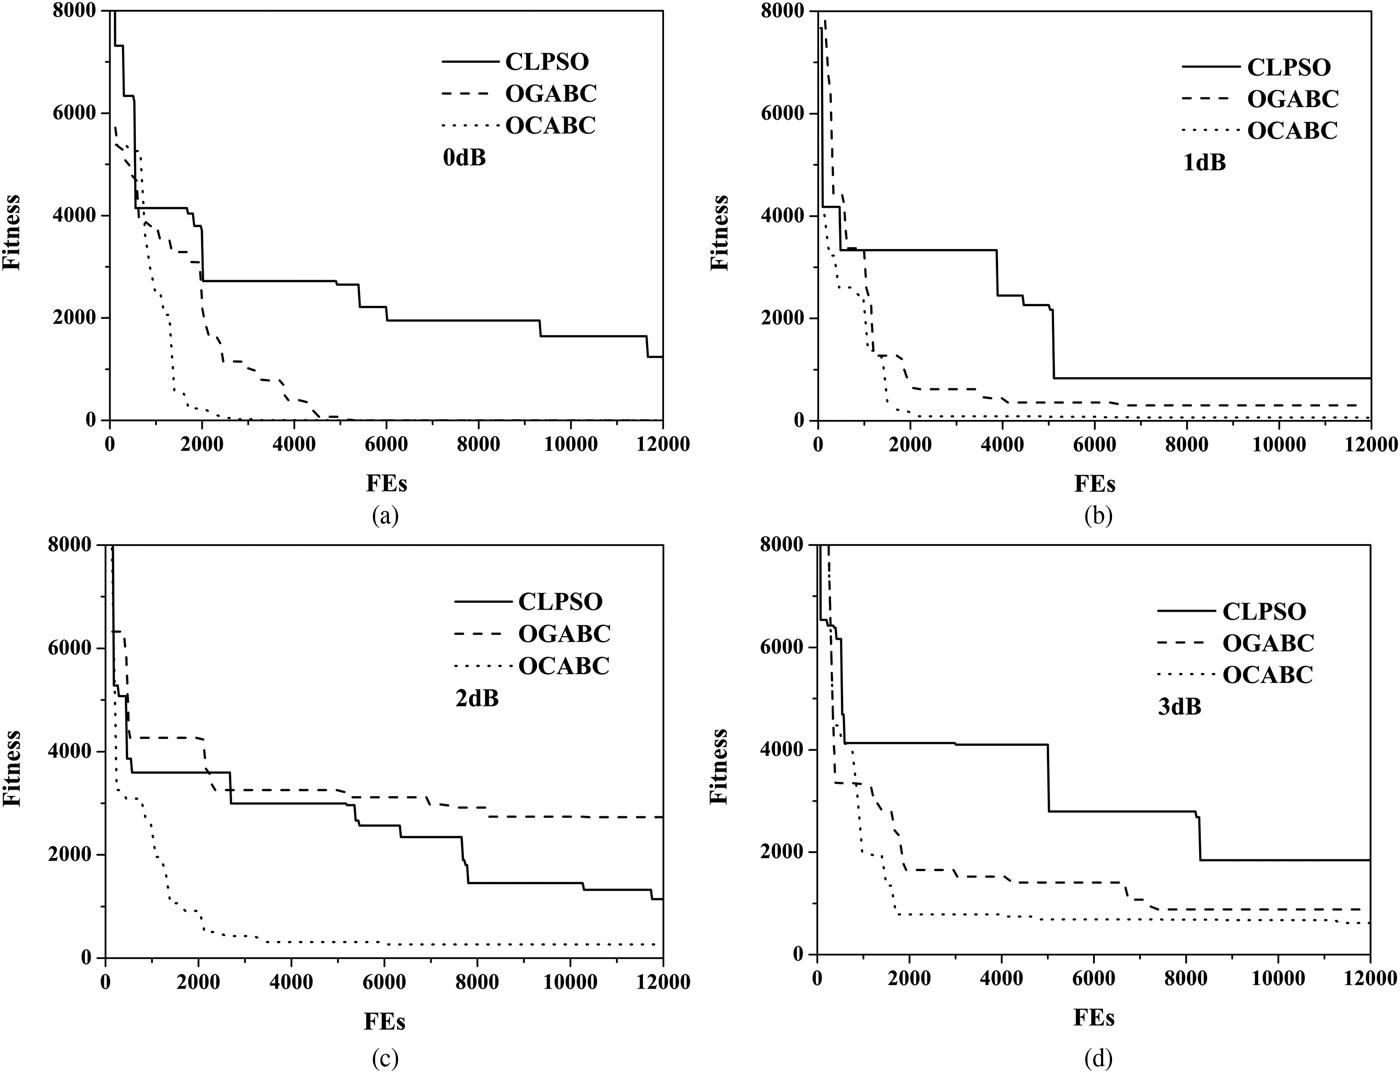
Furthermore, the optimization mechanism of the algorithms seems to be different; all the algorithms are further verified by the same maximum number of FEs 12000 in each run for a fair comparison, and the convergence curves are obtained based on a randomly selected run due to the number of FEs of each iteration is changed randomly during the optimization process, and the other parameters of algorithms for the surface duct estimation are consistent with those given above.
The comparison of the convergence curves of CLPSO, OGABC, and OCABC with respect to the number of FEs is presented in Fig. 5. From the results, it is obvious that the convergence speed of OCABC is still much better than those of the other two algorithms, and the OCABC can achieve best fitness value and overcome the disadvantage of trapping into local optima.
The comparison of the convergence curves of CLPSO, OGABC, and OCABC regarding the function evaluations with the same noise level. (a) 0 dB; (b) 1 dB; (c) 2 dB; (d) 3 dB.

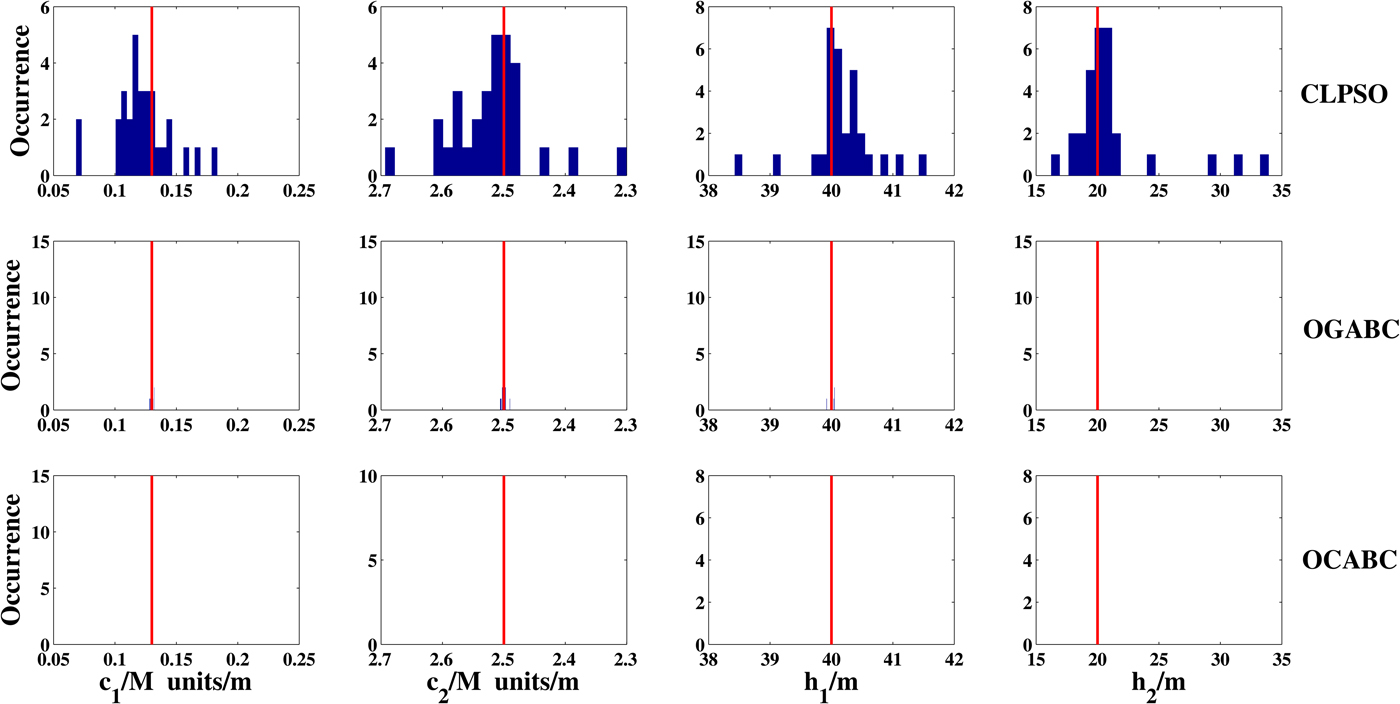
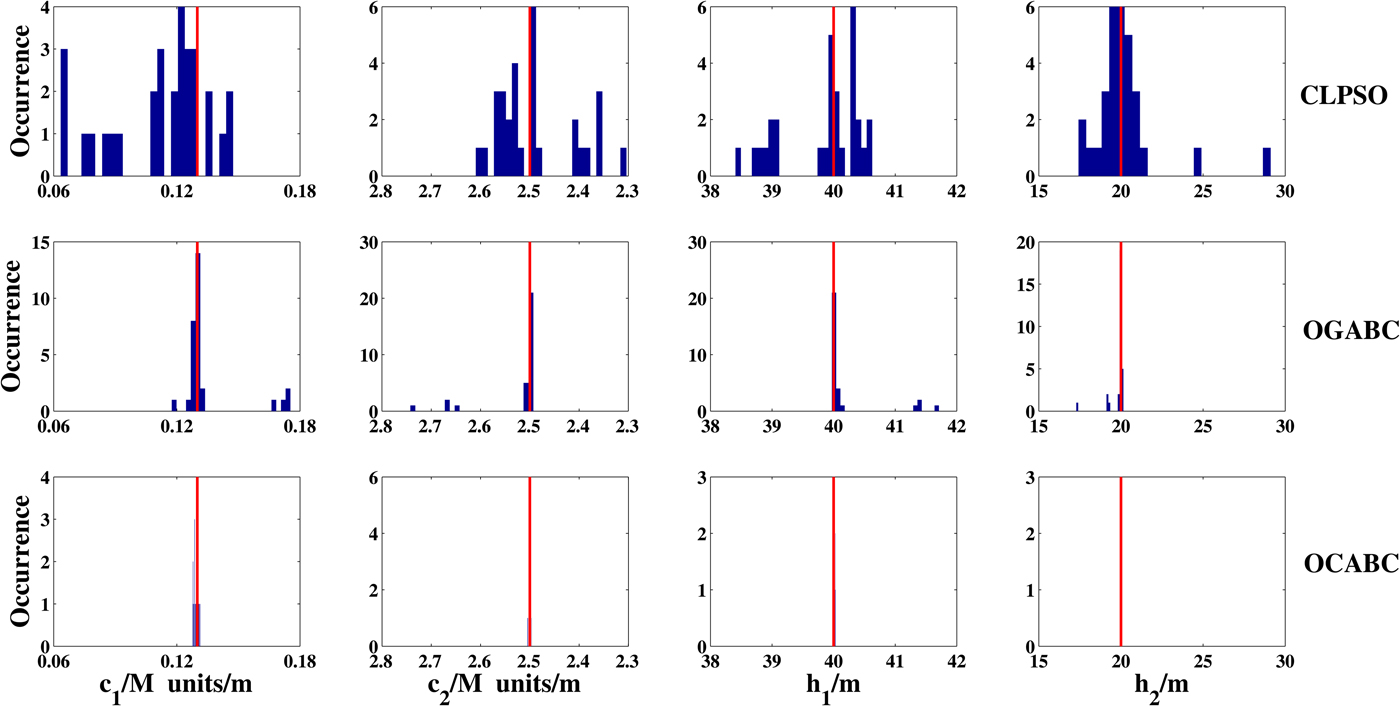
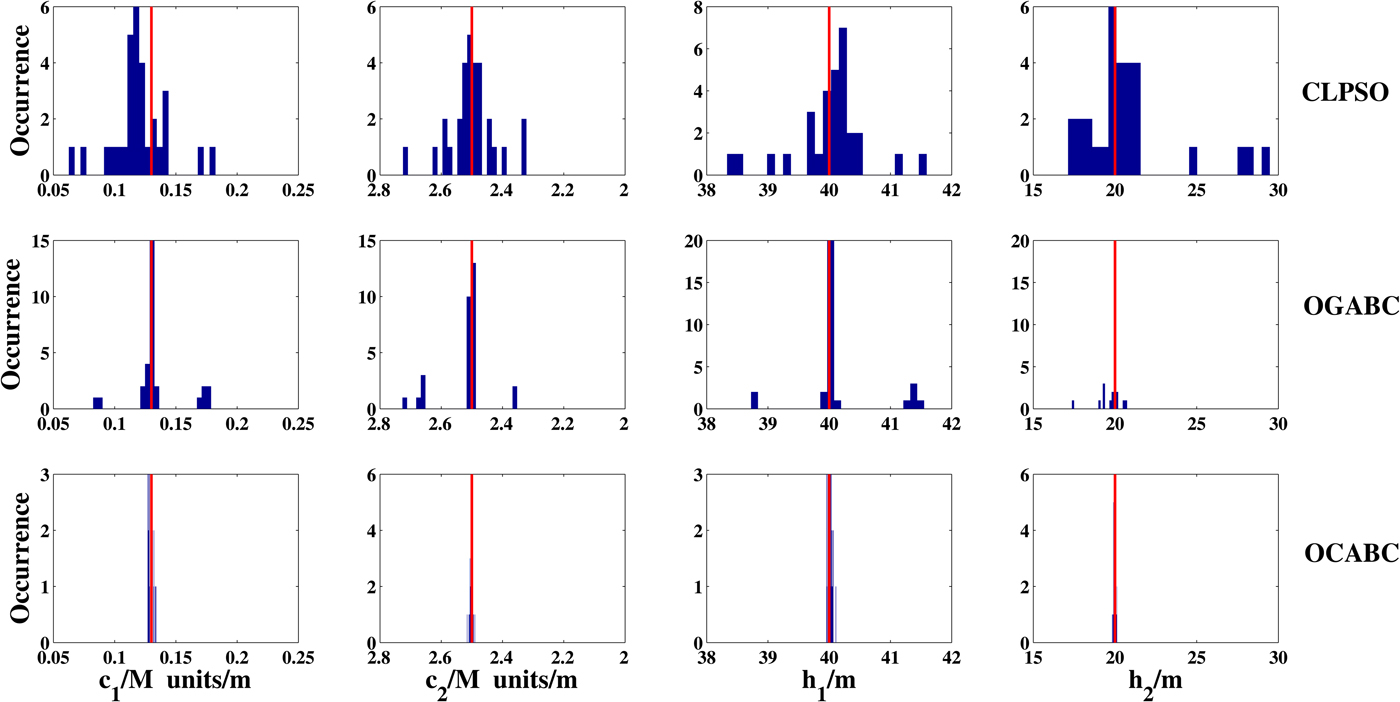
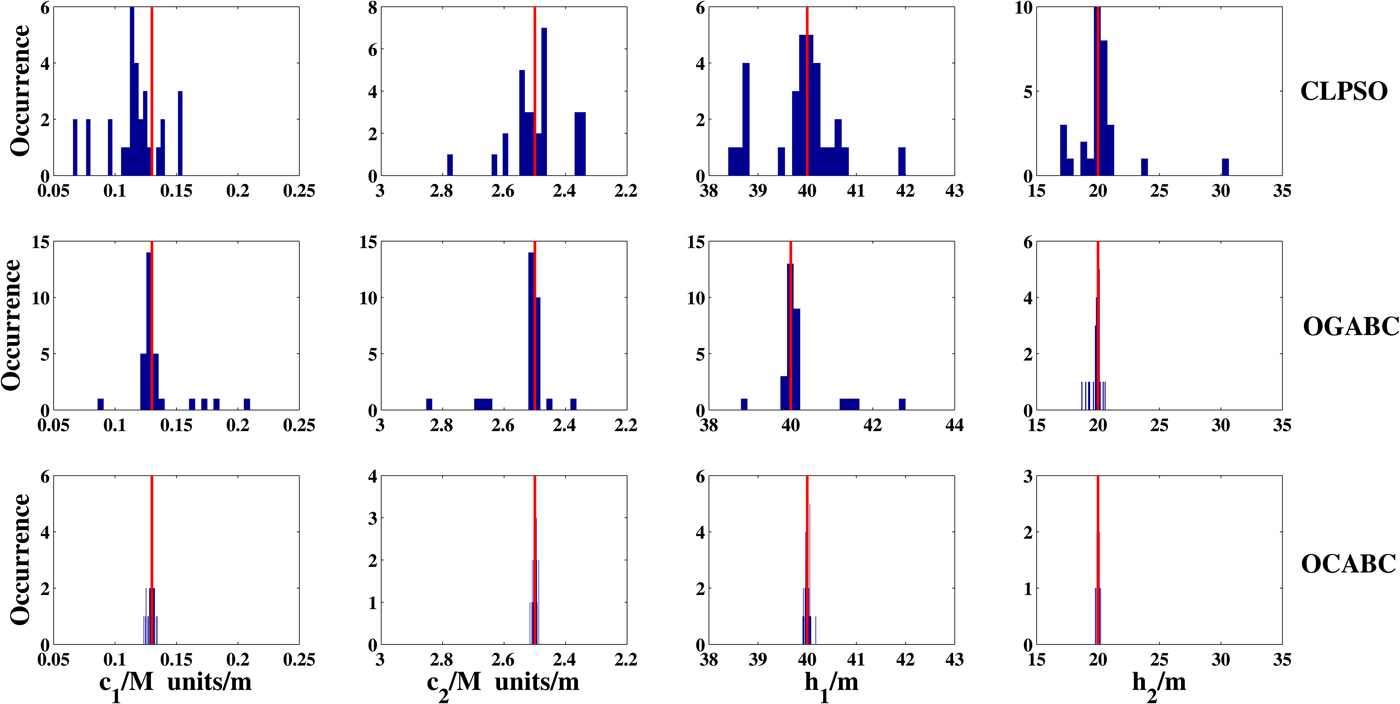
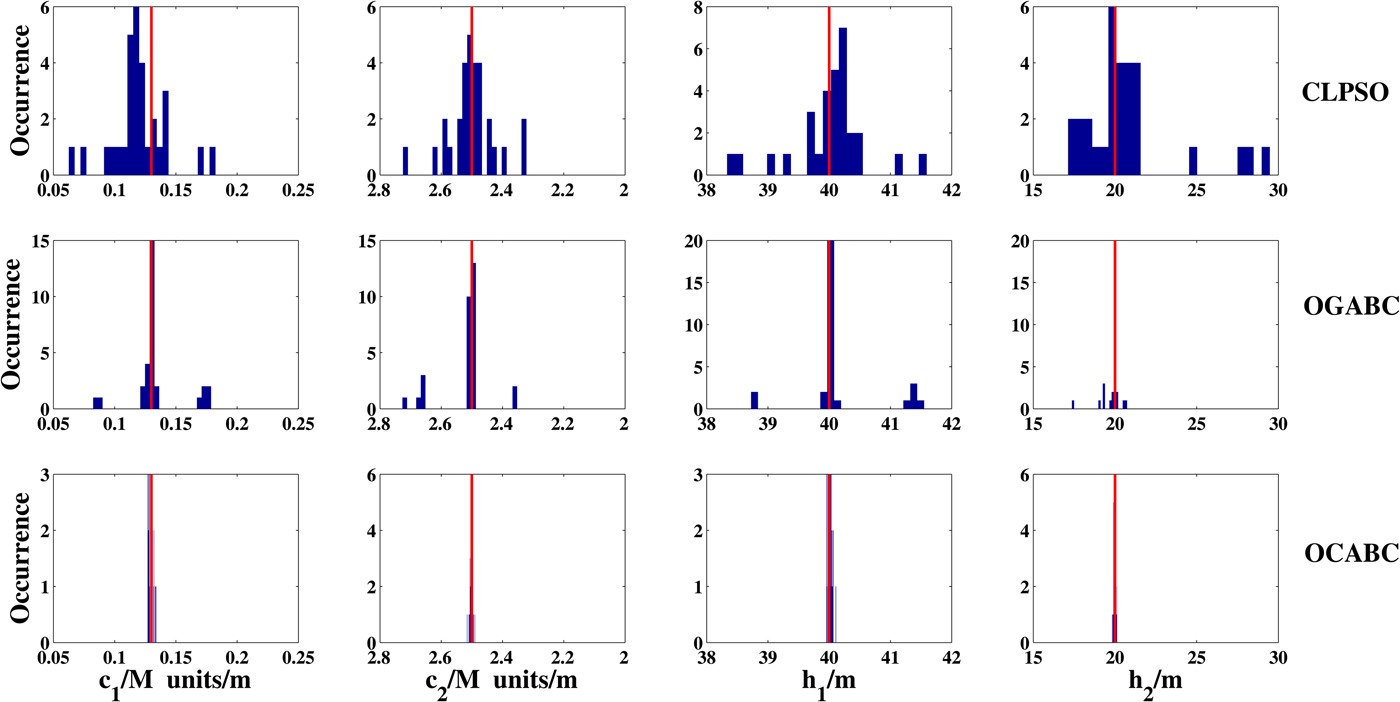
A further comparative analysis of the accuracy and stability based on 30 independent runs for the surface duct estimation are provided in the subsequent section. Figures 6–9 exhibit the comparison of the histograms of the estimation results obtained by CLPSO, OGABC, and OCABC with the same noise level, where the red lines represent the position of real parameter of surface duct. It can be observed that the accuracy and stability of OCABC and OGABC are much higher than that of CLPSO in all cases. Both of the OCABC and OGABC almost obtain the same results in the case of without noise. Although the local optima appear in OGABC with the increasing of the noise level, the OCABC still perform well on accuracy and stability. This is caused by the fact that the OC not only can improve the poor exploitation ability of ABC but also make a balance between the exploration ability and exploitation ability, which help ABC to jump out of the local optima.
The comparison of the histograms of CLPSO, OGABC, and OCABC with the noise level of 0 dB.
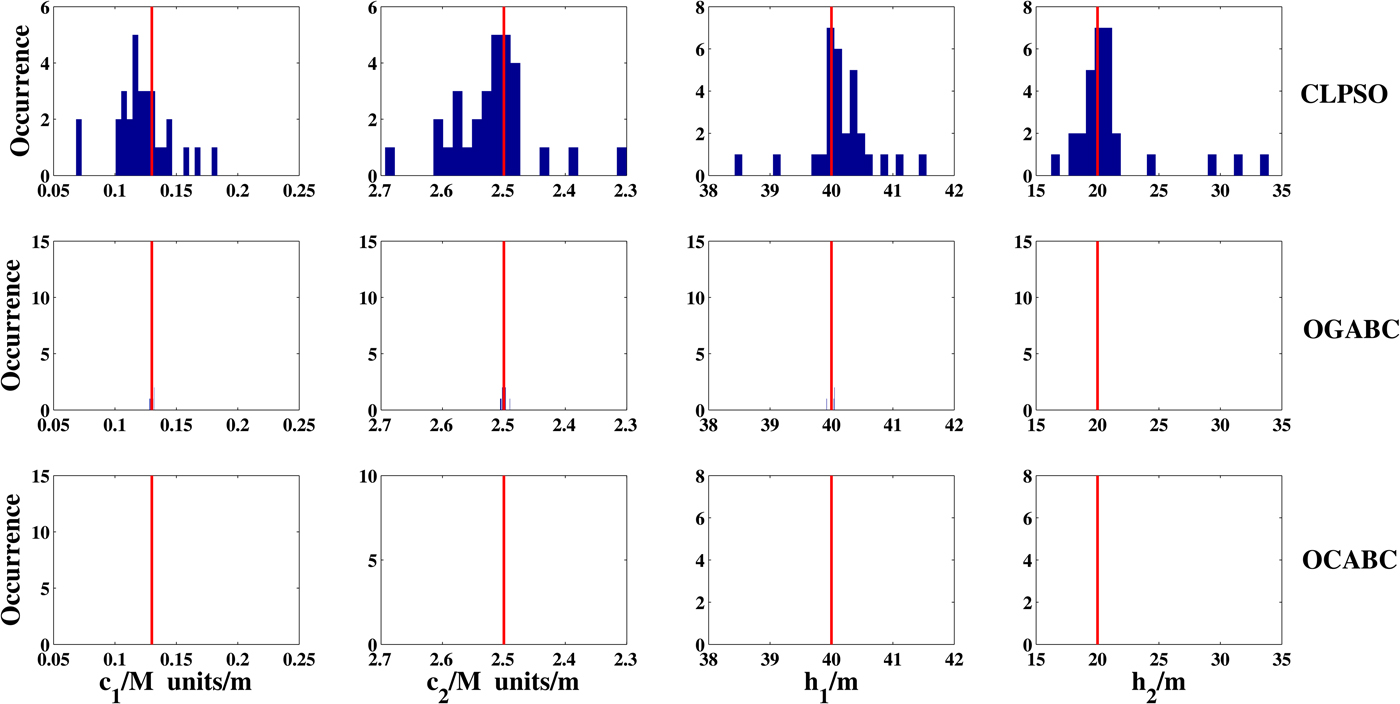
The comparison of the histograms of CLPSO, OGABC, and OCABC with the noise level of 1 dB.
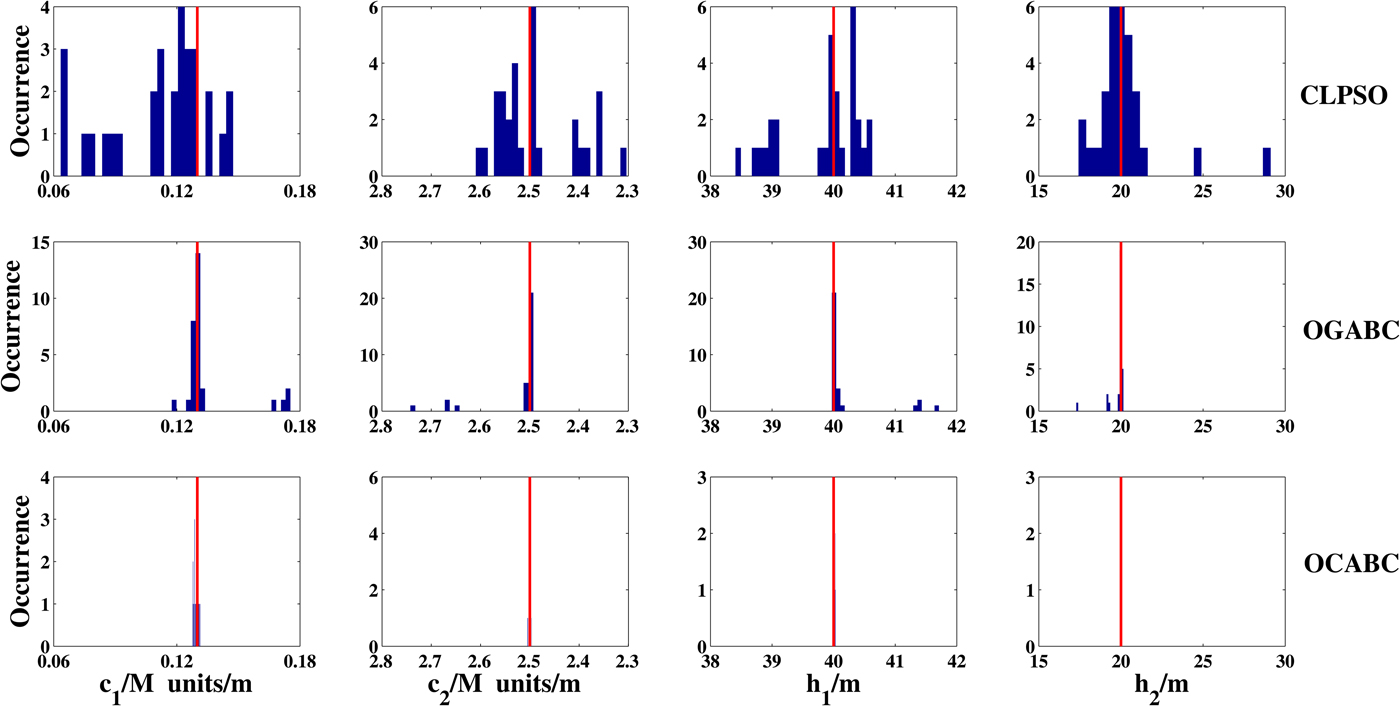
The comparison of the histograms of CLPSO, OGABC, and OCABC with the noise level of 2 dB.
The comparison of the histograms of CLPSO, OGABC, and OCABC with the noise level of 3 dB.
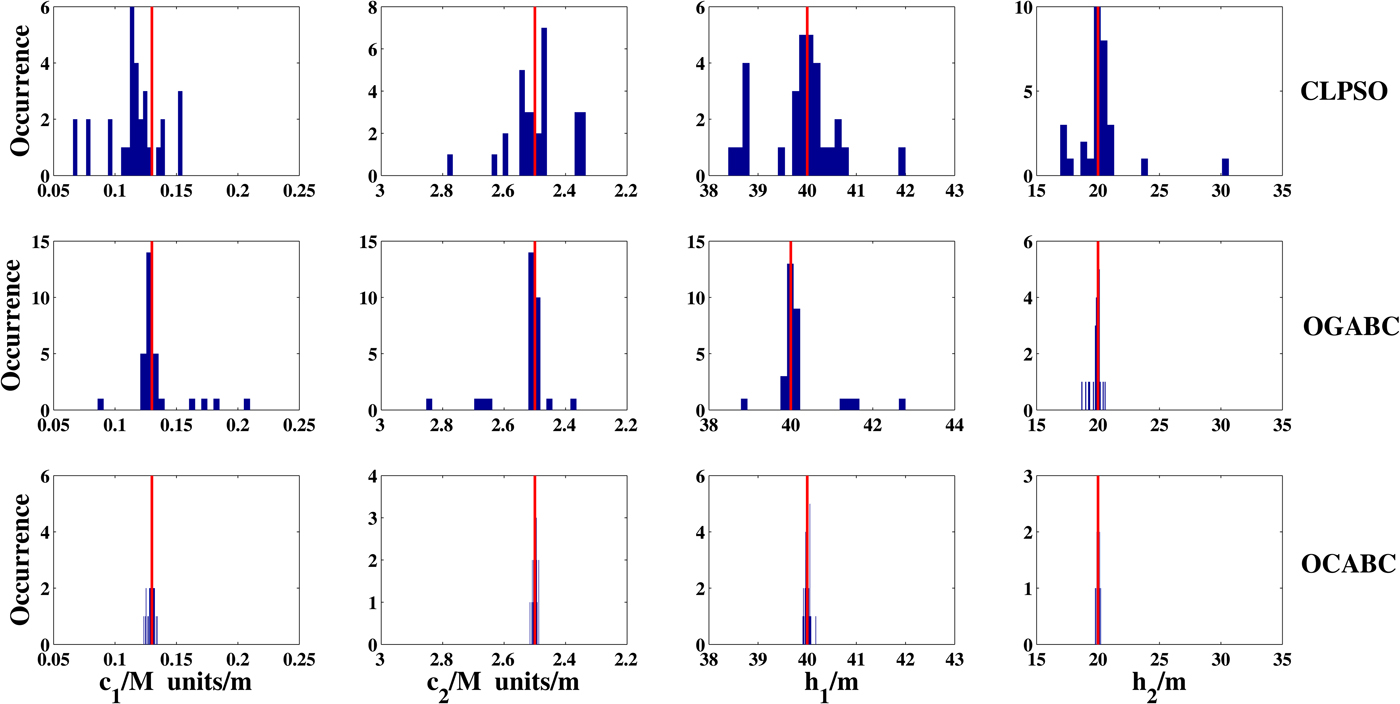
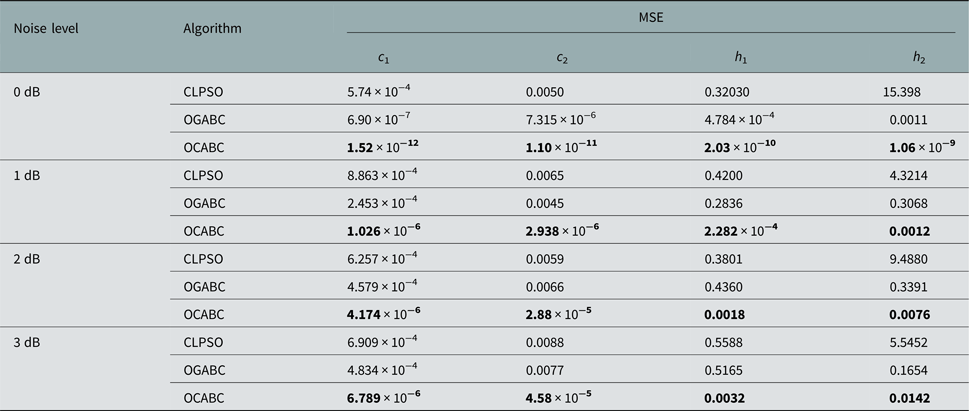
The corresponding statistical analysis are given in Table 1, and the best results in Table 1 are marked in boldface. It can be clearly observed that the estimation results of OCABC for different noise level are superior to those of CLPSO and OGABC regarding the mean squared error (MSE) defined in Ref. [Reference Notarnicola, Angiulli and Posa25], which also quantitatively indicate that the accuracy and stability of OCABC are better than those of CLPSO and OGABC.
The comparison of the statistical results of CLPSO, OGABC, and OCABC

Conclusion
Owing to the search equation in ABC is good at exploration but poor at exploitation, an improved ABC algorithm named OCABC based on OED is presented by incorporating the OC and a novel transmission vector into ABC. In OCABC, the global best solution in the transmission vector can not only strengthen the exploitation ability but also accelerate convergence, and the OC operator can extract useful information from their previous search experiences to produce an excellent candidate solution. The measured and simulated clutter power are utilized to validate the accuracy and effectiveness of the proposed OCABC. The comparative results demonstrate that the performance of the OCABC is superior to that of CLPSO and OGABC for the atmospheric duct estimation.
Acknowledgement
This work was supported by the Young Scientists Fund of the National Natural Science Foundation of China under grant number 61302050.
 Chao Yang received his Ph.D degree in Radio Physics from Xidian University, Xi'an, China in 2010. He is now an Associate Professor at the School of Science, Xi'an University of Posts and Telecommunications, Xi'an, China. His research interests include electromagnetic wave propagation and scattering in complex and random media, and optimization techniques in electromagnetic problems.
 Lixin Guo received the M.S. degree in Radio Science from Xidian University, Xi'an, China, and the Ph.D degree in Astrometry and Celestial Mechanics from Chinese Academy of Sciences, China, in 1993 and 1999, respectively. He is currently a Professor at the School of Physics and Optoelectronic Engineering, Xidian University, China. His research interests include electromagnetic wave propagation and scattering in complex and random media, computational electromagnetics, inverse scattering, antenna analysis and design.