I. Introduction
Corporate misconduct poses significant risks to shareholders, employees, and the broader economy, often resulting in erosion of public trust, regulatory penalties, and a loss of shareholder wealth (Karpoff, Lott, and Wehrly (Reference Karpoff, Lott and Wehrly2005), Karpoff, Lee, and Martin (Reference Karpoff, Lee and Martin2008), and Kedia and Philippon (Reference Kedia and Philippon2009)). While extensive research has explored how corporate governance and internal mechanisms mitigate misconduct, the role of external forces, particularly product market competition, has received relatively limited attention.Footnote 1 Our article seeks to fill this gap by examining whether product market competition disciplines and deters corporate misconduct.
From a theoretical standpoint, the effect of product market competition on a firm’s propensity to commit misconduct is ambiguous. On the one hand, competitive pressure can exacerbate managerial myopia, leading managers to prioritize short-term financial performance over compliance (Caskey and Ozel (Reference Caskey and Ozel2017), Heese and Pérez-Cavazos (Reference Heese and Pérez-Cavazos2020)). Likewise, when the perceived benefits of illicit strategies outweigh expected penalties, competition may incentivize illegal or unethical behavior (Shleifer (Reference Shleifer2004), Cummins and Nyman (Reference Cummins and Nyman2005)).
On the other hand, competition could discipline firms by increasing the expected costs of misconduct. Prior research shows that many violations carry direct reputational consequences, as affected stakeholders reduce their engagement with the firm.Footnote 2 For example, financial misreporting deters investors and raises capital costs (Murphy, Shrieves, and Tibbs (Reference Murphy, Shrieves and Tibbs2009)), while consumer fraud drives away customers and reduces sales (Karpoff and Lott (Reference Karpoff and Lott1993)). Other violations, such as environmental offenses, may not trigger immediate financial losses if the harmed parties are not the firm’s direct stakeholders, but they can still have a significant effect on the firm’s stakeholder relations. Building on this insight, we argue that product market competition amplifies the reputational consequences of misconduct along three dimensions: i) it increases direct reputational losses by lowering stakeholder switching costs; ii) it generates indirect reputational spillovers, whereby harm to one stakeholder group undermines trust among others; and iii) it strengthens values-based responses, as stakeholders can more easily act on moral disapproval when alternatives exist. In competitive markets, where stakeholders have greater options and rivals can exploit misconduct to gain market share (Cao, Fang, and Lei (Reference Cao, Fang and Lei2021), Von Meyerinck, Pursiainen, and Schmid (Reference Von Meyerinck, Pursiainen and Schmid2025)), the threat of losing customers, employees, and investors imposes substantial costs, incentivizing managers to prevent violations and avoid actions that could be publicized or exploited.
The mixed theoretical possibilities motivate our empirical investigation. To measure competition, we use the product market fluidity variable, Fluidity, constructed by Hoberg, Phillips, and Prabhala (Reference Hoberg, Phillips and Prabhala2014). Fluidity is a firm-level measure of competitive threats based on descriptions of a firm’s product space and its rivals’ moves in their 10-K filings. Specifically, this text-based measure captures the similarity between a firm’s product description vocabulary and the change in the overall vocabulary used by its rivals, with a higher similarity indicating a more competitive product market. Following prior studies (e.g., Heese and Pérez-Cavazos (Reference Heese and Pérez-Cavazos2020), Heese, Pérez-Cavazos, and Peter (Reference Heese, Pérez-Cavazos and Peter2022), and Chen, Su, Tian, Xu, and Zuo (Reference Chen, Su, Tian, Xu and Zuo2025)), we obtain data on corporate misconduct from Violation Tracker, which covers a wide range of violations and the resultant penalties issued by federal regulatory agencies and all parts of the Justice Department.
To set the stage, we begin by documenting a negative relation between product market fluidity and a firm’s propensity to engage in misconduct. The result holds after controlling for various firm characteristics known to influence misconduct. We further corroborate this finding with a variety of robustness tests, including alternative model specifications, different subsamples, and a difference-in-differences (DiD) approach based on tariff reduction events. While these additional tests enhance the credibility of our findings, we remain cautious about making causal claims. Instead, we interpret the results as robust empirical associations consistent with the view that product market competition serves as a disciplinary force against corporate misconduct.
Next, we delve deeper into the potential drivers behind the disciplining effect of product market competition. Our central argument is that competition deters misconduct by intensifying its consequences through stakeholder responses. To substantiate this argument, we analyze how different types of misconduct relate to firm outcomes in competitive versus non-competitive environments. Specifically, we categorize misconduct into three main groups, namely consumer-related, employee-related, and environmental violations, and assess their respective effects on firm outcomes in the product, labor, and capital markets. By linking misconduct types to outcomes across these markets, we assess whether competitive pressure intensifies direct reputational losses, whether harm to one stakeholder group spills over to others, and whether stakeholders disengage on values-driven grounds even when direct costs are limited.
Our findings are threefold. First, using sales growth as an indicator of product market performance, we show that all three types of violations are negatively associated with sales growth, with the negative relations being more pronounced in competitive markets. This finding suggests that consumer responses are driven by both concerns about product quality and alignment with personal or societal values, with competition facilitating easier substitution. Second, regarding labor market outcomes, employee-related misconduct is associated with lower productivity and higher turnover, particularly in competitive markets, and there is some evidence that employees also respond negatively to environmental misconduct. These findings suggest that misconduct can undermine employee morale and commitment through both pecuniary effects (e.g., reduced safety and productivity) and values-based disengagement. Third, in terms of capital market consequences, all three types of misconduct are associated with a higher cost of equity in competitive markets, likely reflecting heightened perceived reputational and operational risks. Similarly, stock market reactions to violation announcements—which capture investors’ expectations of the value impact of these violations—are significantly more negative for firms operating in highly competitive markets, especially for customer- and employee-related violations.
Overall, these results reinforce the notion that, in competitive markets, firms that engage in misconduct are more likely to experience adverse consequences, such as lower sales growth, reduced labor productivity, higher employee turnover, increased capital costs, and more negative market reactions, which collectively create a strong deterrent to misconduct.
To shed light on the plausible mechanisms through which the estimated competition effect occurs, we explore the policies firms adopt under competitive pressure that could plausibly reduce misconduct. Our results suggest that firms facing greater competitive pressure are more likely to incorporate environmental, social, and governance (ESG)-related incentives in executive compensation contracts, adopt better worker safety practices, invest more in innovation that supports environmental compliance, and employ a Big Four auditor. These findings align with the notion that competitive threats from the product market motivate firms to implement practices that help mitigate misconduct.
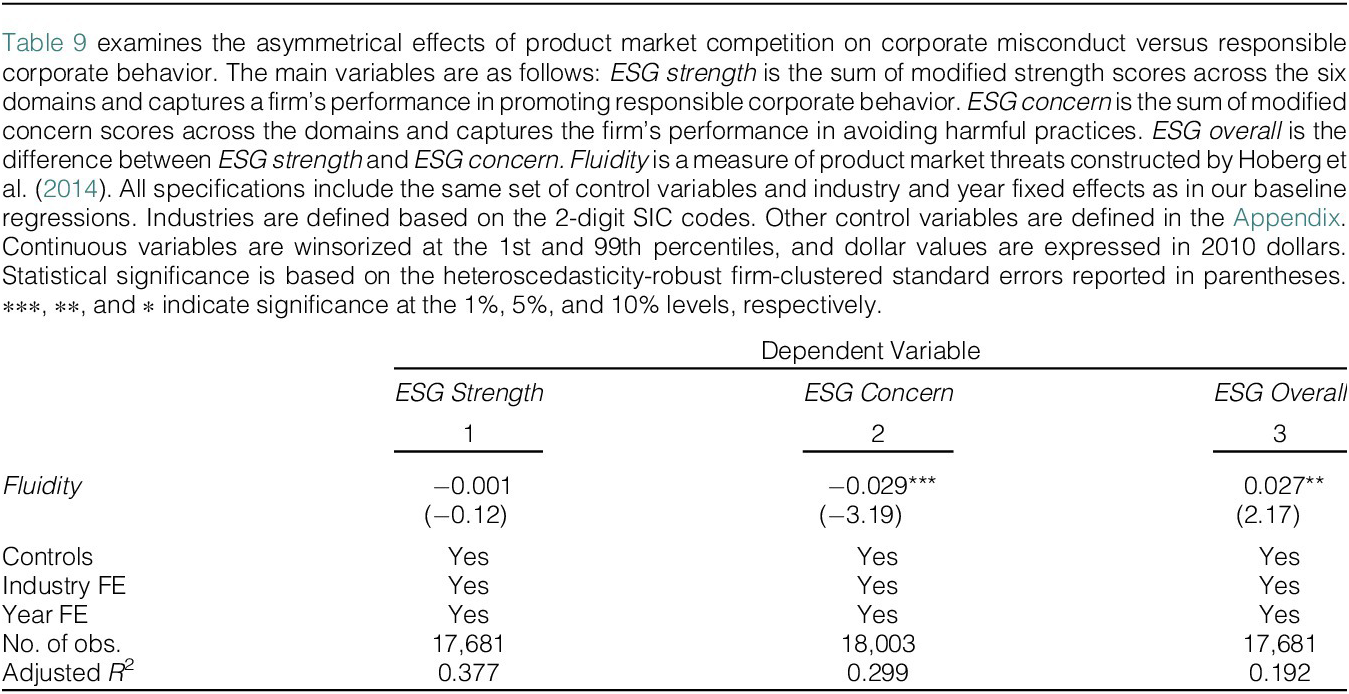
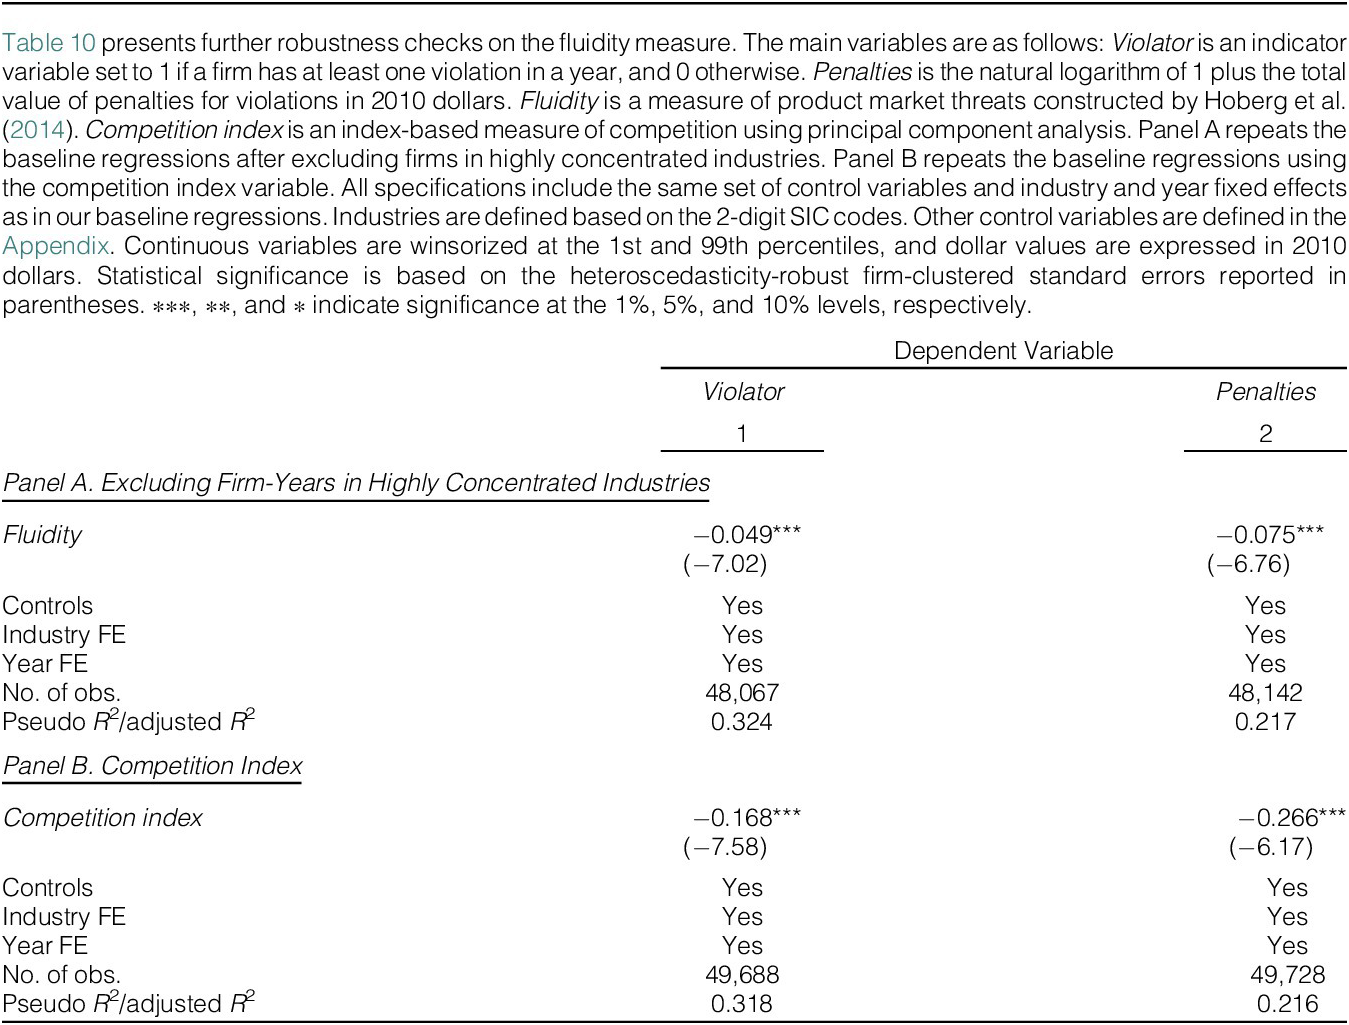
Finally, we conduct two sets of analyses to explore alternative explanations for the negative relation between product market competition and misconduct. In the first set of tests, we examine whether competition, in addition to disciplining misconduct, also promotes responsible corporate behavior. The results suggest that although competition helps to stifle wrongdoing, it is not associated with enhanced stakeholder-oriented practices. This evidence is more consistent with the disciplining explanation than with an alternative perspective that considers reducing misconduct and strengthening relations with stakeholders as a competitive strategy. In the second set of tests, we consider an alternative interpretation of the fluidity measure, as suggested by Fathollahi, Harford, and Klasa (Reference Fathollahi, Harford and Klasa2022), and demonstrate that our findings are robust to a subsample in which the interpretation of the fluidity measure is clearer, as well as to an alternative index measure that captures different aspects of competition.
This article makes two main contributions to the literature. First, it advances research on corporate misconduct. Existing studies emphasize the role of monitoring mechanisms—such as headquarters visits (Heese and Pérez-Cavazos (Reference Heese and Pérez-Cavazos2020)), Enterprise Resource Planning (ERP) system implementations (Heese and Pacelli (Reference Heese and Pacelli2025)), and corporate governance structures (Kedia and Philippon (Reference Kedia and Philippon2009))—in curbing misconduct. However, prior work largely focuses on internal monitoring, with limited evidence on broader, market-driven deterrents. This highlights the importance of examining how external market forces influence firm behavior. For example, Egan, Matvos, and Seru (Reference Egan, Matvos and Seru2019) find that lenient career consequences for misconduct contribute to a high prevalence of repeat offenders, underscoring the role of labor market discipline. Extending this research, our results suggest that product market competition serves as an additional external deterrent. Competitive pressures increase the expected costs of misconduct by reducing stakeholder switching costs, generating direct reputational costs, creating trust-eroding spillovers, and facilitating values-based responses when alternatives exist. In such markets, the heightened risk of losing customers, employees, or investors imposes substantial costs, motivating managers to prevent violations.
Second, our study contributes to the literature on stakeholder responses to corporate misconduct by demonstrating that competitive product markets amplify the disciplining effects of these responses. Prior research shows that misconduct can trigger negative reactions from corporate and government customers as well as retail consumers (Johnson, Xie, and Yi (Reference Johnson, Xie and Yi2014), Duan, Li, and Michaely (Reference Duan, Li and Michaely2024), Houston, Lin, Shan, and Shen (Reference Houston, Lin, Shan and Shen2025), Chen, Jing, Keasey, and Xu (Reference Chen, Jing, Keasey and Xu2026), and Meier, Servaes, Wei, and Xiao (Reference Meier, Servaes, Wei and Xiao2025)), undermine employees’ perceptions of their employers and intrinsic motivation (Hur, Moon, and Ko (Reference Hur, Moon and Ko2018), Rice and Schiller (Reference Rice and Schiller2025)), and erode household trust, leading to reduced financial participation (Giannetti and Wang (Reference Giannetti and Wang2016), Dupont (Reference Dupont2025)). Murphy et al. (Reference Murphy, Shrieves and Tibbs2009) further document that allegations of corporate wrongdoing reduce earnings and increase risk, underscoring the role of reputational penalties. Collectively, these studies highlight the significant costs firms face when stakeholders respond negatively to misconduct. Yet, the literature has not fully explored how the competitive environment shapes the intensity of these reactions. Our article addresses this gap by linking specific types of misconduct to their primary stakeholder groups, illustrating the direct, indirect, and values-driven consequences, and showing that product market competition amplifies stakeholder responses across the product, labor, and capital markets.
Our findings differ from Flammer (Reference Flammer2015), who shows that firms facing competition strategically engage in corporate social responsibility to attract customers. In contrast, we find that product market competition amplifies the adverse consequences of misconduct, providing firms with stronger incentives to avoid harmful practices and ensure compliance. Therefore, our study complements Flammer (Reference Flammer2015) by demonstrating that product market dynamics influence firms through heightened deterrence against actions that could damage stakeholder relations.
The rest of the article is organized as follows: Section II develops theoretical hypotheses that link competition to misconduct. Section III describes the sample and variable constructions. Section IV reports main results and robustness checks. Section V examines how product market competition amplifies the negative consequences associated with misconduct. Section VI presents further analyses. Section VII concludes.
II. Hypothesis Development
The nature of the relation between product market competition and corporate misconduct remains a contentious issue in the literature. On the one hand, market competition could lead firms to engage in misconduct for at least two reasons. First, competitive pressure can exacerbate managerial myopia, whereby managers focus on short-term financial targets at the expense of long-term sustainability (Graham, Harvey, and Rajgopal (Reference Graham, Harvey and Rajgopal2005)). This, in turn, may lead to a prioritization of financial targets over compliance, increasing the likelihood of misconduct (Caskey and Ozel (Reference Caskey and Ozel2017), Heese and Pérez-Cavazos (Reference Heese and Pérez-Cavazos2020)). Second, competition can foster an environment in which firms resort to socially unproductive or even illegal strategies to gain an advantage over rivals. For example, in developing countries with a weak rule of law, Shleifer (Reference Shleifer2004) contends that competition puts firms under pressure to engage in bribery of government officials to secure contracts or favorable treatment. Cummins and Nyman (Reference Cummins and Nyman2005) similarly argue that if the benefits of engaging in illicit behavior outweigh the potential costs of getting caught, competitive threats could motivate firms to engage in such behavior.
The existing literature also offers justification for a negative relation between product market competition and corporate misconduct. Competition amplifies the reputational consequences of misconduct, thereby giving managers stronger incentives to avoid violations ex ante.Footnote 3 Our theoretical framework organizes these consequences along three dimensions. First, misconduct can generate direct reputational losses when stakeholders who transact with the firm, such as customers or employees, respond negatively. For example, consumer fraud reduces sales (Karpoff and Lott (Reference Karpoff and Lott1993)), while employee-related violations can impair productivity and labor market outcomes. These losses are likely magnified in competitive markets, where stakeholders can more easily switch to substitutes (Dai, Liang, and Ng (Reference Dai, Liang and Ng2021), Von Meyerinck et al. (Reference Von Meyerinck, Pursiainen and Schmid2025)), and employees have greater access to alternative employment opportunities (Brogaard, Le, Nguyen, and Sila (Reference Brogaard, Le, Nguyen and Sila2026)).
Second, misconduct affecting one group of stakeholders could generate spillover effects for others (Duan et al. (Reference Duan, Li and Michaely2024), Houston et al. (Reference Houston, Lin, Shan and Shen2025), Meier et al. (Reference Meier, Servaes, Wei and Xiao2025)). For instance, mistreating employees may erode consumer trust, reducing sales in addition to employee attrition and productivity loss. Such spillovers are particularly pronounced in competitive markets in which distrust is more costly. Third, some stakeholder responses are motivated by non-pecuniary, values-based considerations (Starks (Reference Starks2023)). Customers or employees could punish firms for environmental violations even when they are not directly affected. The presence of competitive substitutes lowers the cost of acting on these values, suggesting that such effects are stronger in competitive markets.
Moreover, competitive dynamics among firms themselves can serve as a deterrent to misconduct. One prominent phenomenon is negative peer disclosure, whereby firms publicize the misconduct of their rivals, particularly in highly competitive markets. Cao et al. (Reference Cao, Fang and Lei2021) show that firms under intense competition are more likely to publicize rivals’ wrongdoing, further amplifying reputational losses and raising the expected costs of misconduct.
In summary, the interplay between product market competition and corporate misconduct illustrates a critical pathway through which competitive pressures influence firm behavior. As firms recognize that misconduct not only invites regulatory penalties but also jeopardizes customer relations and employee morale, their incentives to mitigate violations become stronger. This perspective, which we term the disciplining hypothesis, integrates the direct, indirect, and values-based dimensions of stakeholder responses and highlights how competition magnifies these effects across the product, labor, and capital markets.
III. Data and Descriptive Statistics
A. Sample Selection
Our sample is obtained from several sources. We start by collecting corporate misconduct data from the Violation Tracker database over the period of 2000–2018.Footnote 4 2000 is the earliest year for which misconduct information is available from Violation Tracker. We then merge this data set with product market fluidity data obtained from the Hoberg–Phillips Data Library, and with financial and accounting information obtained from Compustat.Footnote 5 We winsorize all continuous variables at the 1st and 99th percentiles to mitigate the potential effects of outliers. Following the product market competition literature (e.g., Hoberg et al. (Reference Hoberg, Phillips and Prabhala2014)), we exclude financial and utility firms (SIC codes 6000–6999 and 4900–4999). We drop observations with missing values for the variables used in the baseline specifications, yielding a primary sample comprising 64,173 firm-year observations for 8,427 U.S. firms.
B. Variable Construction and Empirical Specifications
1. Measuring Corporate Misconduct
Our study uses, as the dependent variable, a firm’s degree of misconduct. Following prior studies (e.g., Heese and Pérez-Cavazos (Reference Heese and Pérez-Cavazos2020), Heese et al. (Reference Heese, Pérez-Cavazos and Peter2022), and Chen et al. (Reference Chen, Su, Tian, Xu and Zuo2026)), we construct corporate misconduct variables using data from Violation Tracker, which contains the records of all civil and criminal cases brought against U.S. firms during our sample period. In compiling the data set, Violation Tracker brings together agency enforcement records obtained from federal regulatory agencies and all parts of the Justice Department and complements these records with information collected from settlements announced in press releases.Footnote 6
Individual violations are reported initially at the facility level and then linked to parent companies by Violation Tracker.Footnote 7 This parent matching enables us to aggregate facility-level violations and penalties to the firm level to capture a firm’s engagement in misconduct. We keep all cases in which the parent company is a publicly traded firm and drop companies whose headquarters are not in the United States. Our final sample consists of 39,325 violations perpetrated by 1,318 unique firms, representing approximately 80% of Fortune 500 firms. Note that the Violation Tracker database reports only facilities and firms that have had a violation over the sample period and does not include those without violations. Similar to Heese and Pérez-Cavazos (Reference Heese and Pérez-Cavazos2020) and Heese et al. (Reference Heese, Pérez-Cavazos and Peter2022), if Violation Tracker does not report any offenses for a firm in a year, we consider the firm to have zero violations and penalties for the year.
We construct two measures of corporate misconduct. The first measure, Violator, captures the incidence of misconduct. It is a dummy variable that equals 1 for firm-year observations with at least one violation, and 0 otherwise. While the violator indicator provides a simple measure of the probability of a sample firm being a violator, it does not take into account the severity of the wrongdoing. Therefore, our second measure, Penalties, is the natural logarithm of 1 plus the total penalties incurred by a firm in a given year, adjusted to 2010 dollars using the U.S. GDP deflator from World Bank Data. A higher value of Penalties indicates more severe violations.
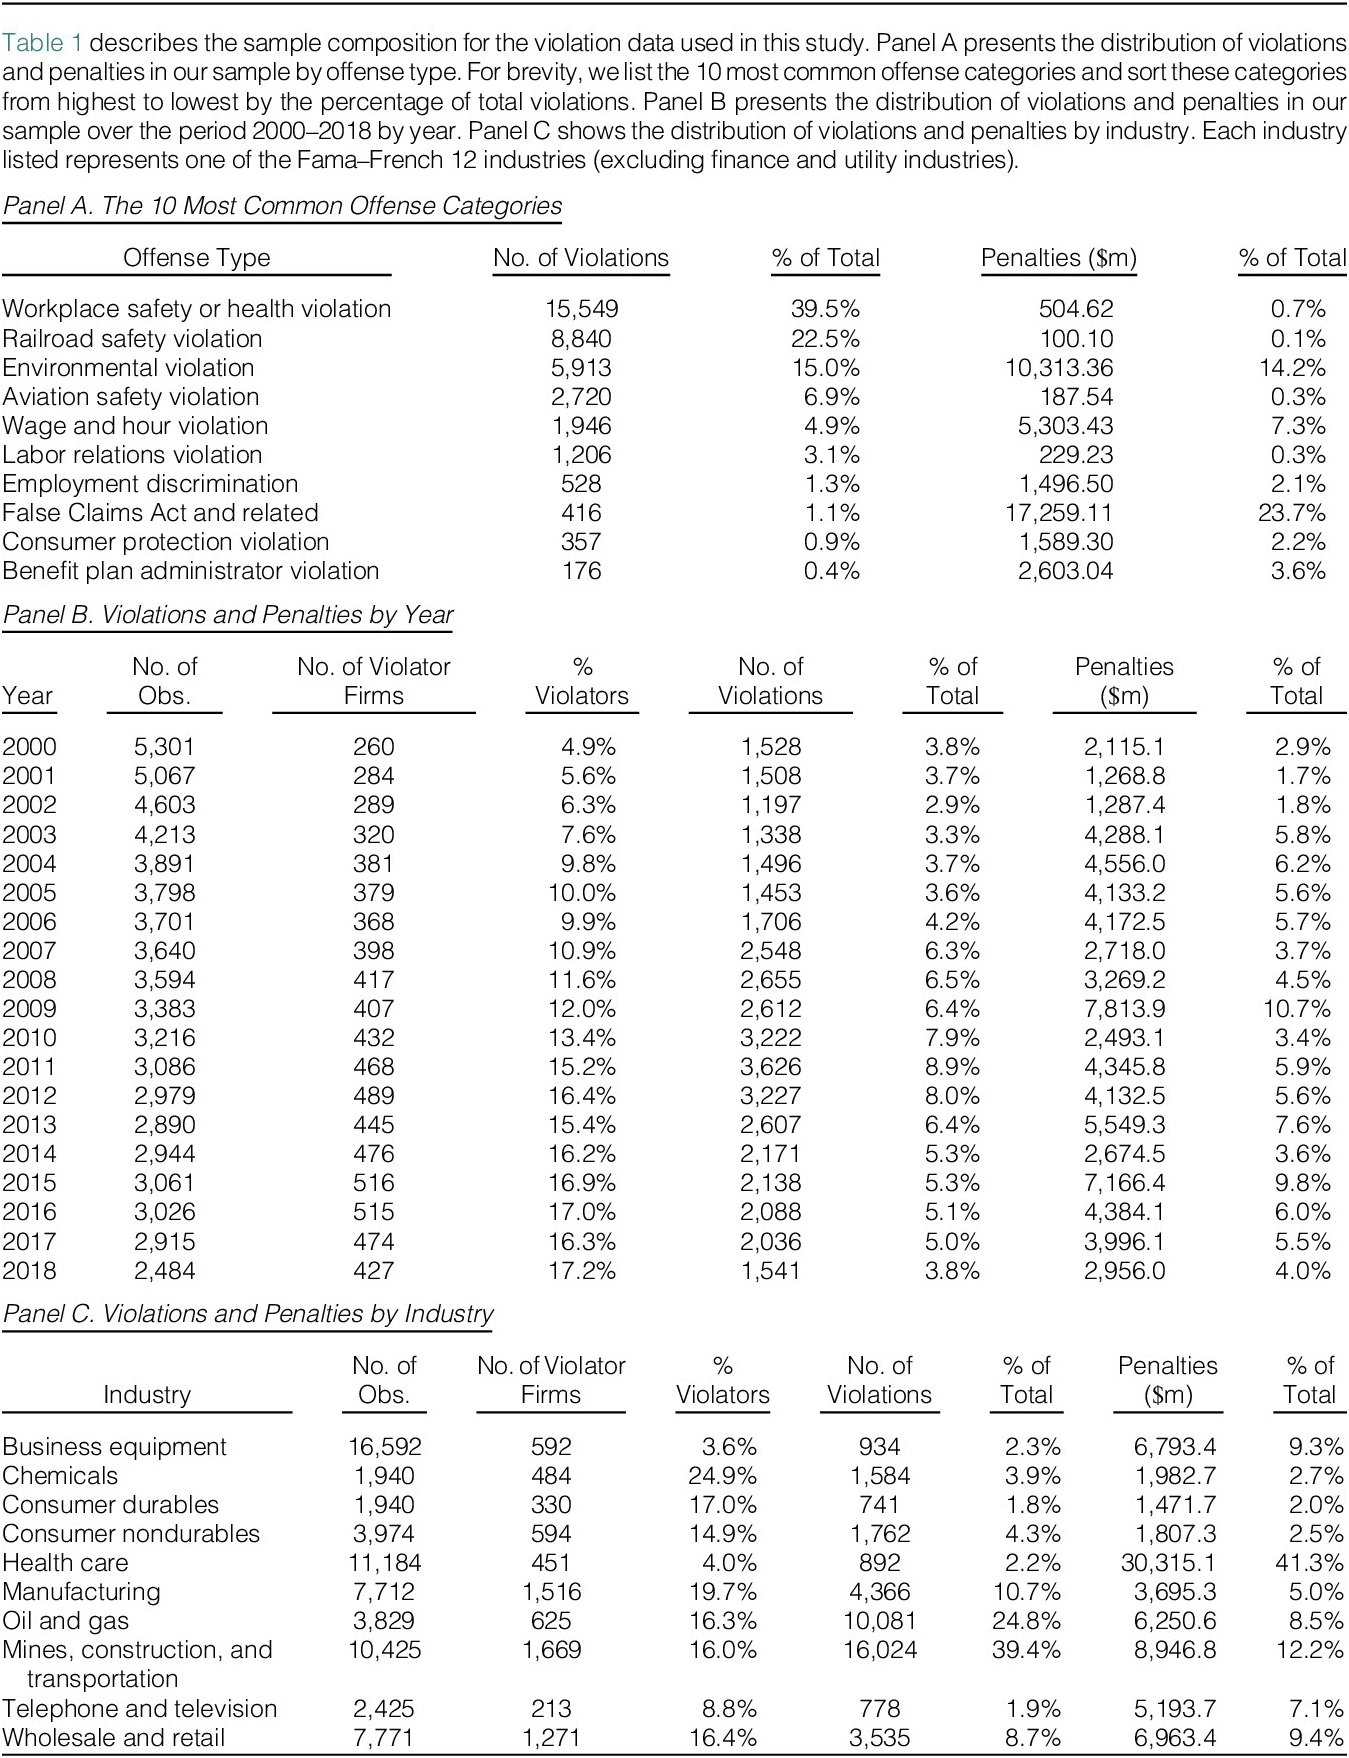
Corporate misconduct can take different forms, such as safety violations, environmental pollution, and fraud. Based on the classification defined by Violation Tracker, our final sample comprises 66 offense categories, of which the 10 most common categories are listed in Panel A of Table 1. As one can see, the most prevalent offense in terms of the number of violations is workplace safety violations, which account for 39.5% of the total violations. The most prominent offense categories in terms of total penalty amount are environmental violations and the False Claims Act (FCA) related violations, representing 14.2% and 23.7% of the total penalties, respectively.

TABLE 1 Long description
This table describes the sample composition for the violation data used in this study. Panel A presents the distribution of violations and penalties in our sample by offense type. For brevity, we list the 10 most common offense categories and sort these categories from highest to lowest by the percentage of total violations. Panel B presents the distribution of violations and penalties in our sample over the period 2000-2018 by year. Panel C shows the distribution of violations and penalties by industry. Each industry listed represents one of the Fama-French 12 industries (excluding finance and utility industries).
Panel B of Table 1 reports the number of violator firms, the number of violations, and the penalties by year. It is noteworthy that we have fewer observations in more recent years of the sample period than in earlier years. This observation is consistent with prior studies documenting that the universe of public firms in the United States has shrunk significantly since the late 1990s (e.g., Doidge, Karolyi, and Stulz (Reference Doidge, Karolyi and Stulz2017), Kahle and Stulz (Reference Kahle and Stulz2017)). In our data, the number of firms in our sample decreases from 5,301 in 2000 to 2,484 in 2018. Over the same period, however, the number of violator firms increases from 260 to over 400. As a result, the proportion of violator firms goes from 4.9% of the public firms in 2000 to 17.2% by 2018. The data also show that corporate misdeeds are scattered through time in terms of both the number of violations and penalty amount, with 2011 being the year with the largest number of violations (8.9% of total) and 2009 the year with the highest amount of penalties (10.7% of total).
Panel C of Table 1 reports the number of violator firms, the number of violations, and the amount of penalties by industry in the Fama–French 12 industry classifications. We observe considerable variation across industries as well as across the three aspects of misconduct. While violations are scattered across industries in terms of the number of violator firms, violation counts, and penalties appear to be less evenly distributed. For example, the number of violations is much higher in blue-collar industries, such as oil and gas, manufacturing, mining, construction, and transportation. A vast majority of penalties are from the aforementioned blue-collar industries and health care. The significant cross-industry variation also highlights the importance of including industry effects in explaining corporate misconduct, which we do in our regression analysis.
2. Measuring Product Market Competition
Our main proxy for competition intensity, Fluidity, is a text-based measure of product market fluidity. This measure was first developed by Hoberg et al. (Reference Hoberg, Phillips and Prabhala2014) and has subsequently been employed in a number of papers to study various corporate decisions.Footnote 8 Intuitively, Fluidity captures the change in a firm’s product space due to moves made by its competitors. In doing so, it analyzes the firm’s product descriptions in its 10-K filings and computes the degree to which these descriptions are similar to the changes in rival firms’ product descriptions in their 10-Ks. In other words, Fluidity is the similarity between a firm’s product description vocabulary and the change in the overall vocabulary used by its rivals. A higher similarity or fluidity means the firm’s products overlap more with the dynamic changes of its rivals’ products, pointing to more contestable product markets that pose greater competitive threats.
Compared to the traditional competition measures, such as the Herfindahl–Hirschman Index (HHI), the fluidity variable offers several advantages. First, Fluidity is measured at the firm level and contains firm-specific information that is not captured in the industry-level variables. Second, the product descriptions in a firm’s 10-Ks reflect top management’s assessments about product market threats that are legally required to be accurate and current (Hoberg et al. (Reference Hoberg, Phillips and Prabhala2014)). Drawing upon these descriptions, the fluidity variable therefore offers not only a sharper characterization of the competitive structure of product markets, but also a more timely measure of its dynamics than accounting numbers, which tend to be backward-looking. Further, another advantage of using product descriptions to examine competitive threats is that they correspond more closely to the intensity of interactions within the firm’s product space, thereby encapsulating more granular aspects of the disciplinary role of market competition. Finally, Fluidity captures competition not only from public firms but also potentially from private firms. In support of this view, Hoberg et al. (Reference Hoberg, Phillips and Prabhala2014) show that Fluidity is significantly correlated with the competitive threats from private entrepreneurial firms. While the aforementioned reasons justify our focus on the fluidity variable, in Section IV.B we show that our results are robust to alternative measures based on industry-specific attributes.
3. Empirical Specification
To examine the relation between product market fluidity and corporate misconduct, we consider the following regression model:

where i indexes firm and t indexes time. The constructions of Misconduct and Fluidity are discussed in detail in Sections III.B.1 and III.B.2. Control represents a vector of firm characteristics that could influence a firm’s propensity for misconduct. In the baseline regressions, the control variables include firm size measured as the natural logarithm of total assets in 2010 dollars (Size); growth opportunities measured as the market-to-book ratio (M/B); leverage measured as the ratio of total debt to total assets (Leverage); capital intensity measured as net property, plant and equipment scaled by total assets (PPE/TA); profitability measured as the return on assets (ROA). Industry and Year stand for industry and year fixed effects, respectively, which are included to account for differences in corporate wrongdoing across industries and over years.Footnote 9 Throughout all of our empirical analysis, we cluster the errors by company to obtain standard errors that are robust to heteroskedasticity and cross-sectional correlation.
C. Descriptive Statistics
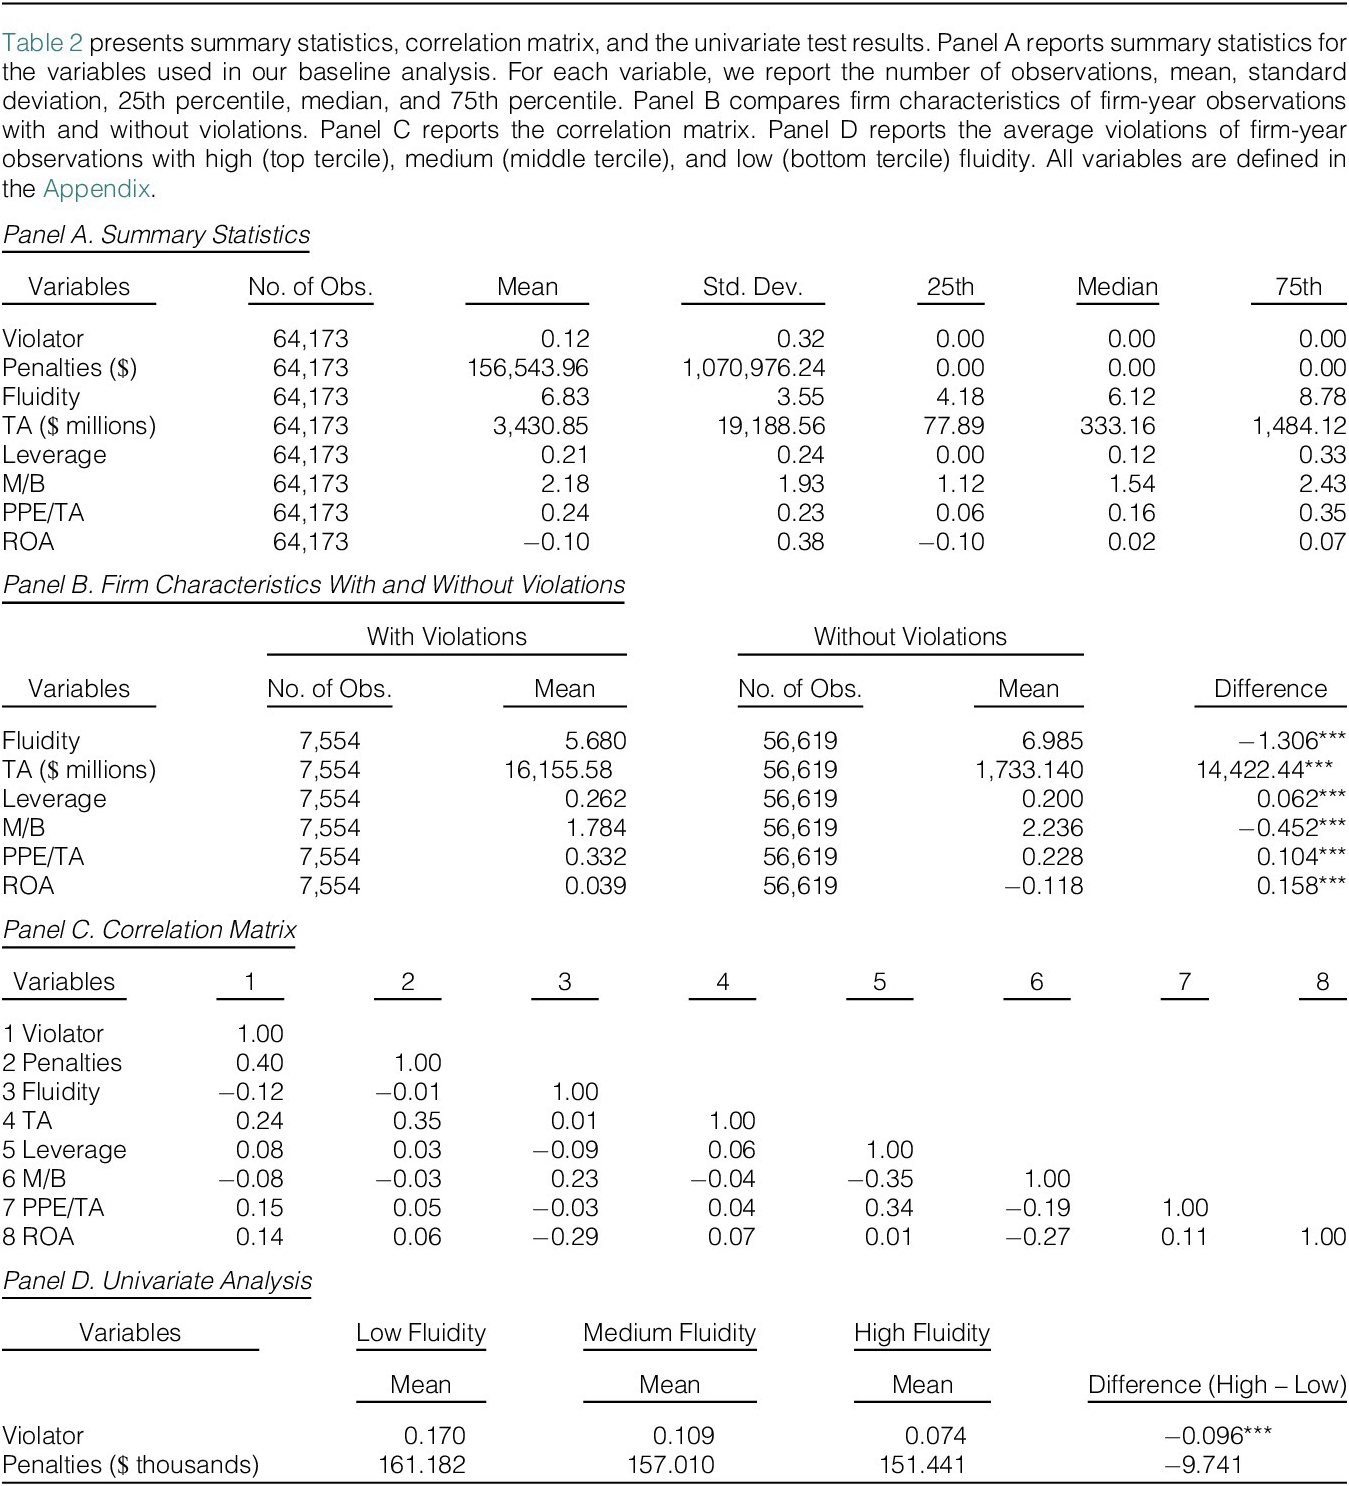
Table 2 reports summary statistics, correlation matrix, and the univariate test results for the variables used in our baseline analysis. Panel A of Table 2 shows that about 12% of the sample firm-year observations have at least one violation.Footnote 10 Corporate misconduct is costly to firms. The mean penalty per firm-year is $0.16 million. Our product market competition measure, Fluidity, has a mean of 6.83 and a standard deviation of 3.55. An average firm in our sample has total assets of $3.43 billion, a leverage of 21%, a market-to-book ratio of 2.18, a PPE-to-assets ratio of 24%, and an ROA of −10%.

TABLE 2 Long description
This table presents summary statistics, correlation matrix, and the univariate test results. Panel A reports summary statistics for the variables used in our baseline analysis. For each variable, we report the number of observations, mean, standard deviation, 25th percentile, median, and 75th percentile. Panel B compares firm characteristics of firm-year observations with and without violations. Panel C reports the correlation matrix. Panel D reports the average violations of firm-year observations with high (top tercile), medium (middle tercile), and low (bottom tercile) fluidity. All variables are defined in Appendix A.
Panel B of Table 2 presents a comparison of firm-year observations with violations and those without. There are significant differences (all at the 1% level) between the two groups. Firm-year observations with violations are associated with less fluid product markets, as indicated by a significantly lower Fluidity. In addition, firms with violations tend to be more mature firms as reflected by higher leverage, greater total assets, lower growth opportunities, more tangible assets, and higher return on assets.
Panel C of Table 2 reports pairwise correlation coefficients. From this correlation matrix, it is evident that multicollinearity is unlikely, since the correlation coefficients between the independent variables are relatively small. It is also clear that product market competition correlates negatively with corporate misconduct. The correlations between Fluidity and the two misconduct variables, namely Violator and Penalties, are −0.12 and −0.01, respectively.
To get an initial insight into the disciplining effect of competition, in Panel D of Table 2, we assess the distribution of the misconduct variables across groups of firms based on product market competition. Specifically, we split the sample into three groups based on Fluidity. Observations with a top tertile fluidity fall into the group of firms operating in competitive product markets (High fluidity). Observations with a bottom tertile fluidity fall into the group of firms operating in non-competitive markets (Low fluidity). The last column compares the means of the misconduct variables between the top and bottom tertiles. We observe large differences between the high and low fluidity groups. For instance, 17% of the firm-years in the low fluidity group have at least one violation. This fraction decreases monotonically as fluidity escalates. In the high fluidity group, only 7.4% of the sample observations have a violation. The difference of 9.6 percentage points is economically and statistically significant. Similarly, there is a significant difference of $9,741 in mean penalties between the high and low fluidity groups. Overall, these univariate test results suggest that proxies for corporate misconduct vary significantly with the intensity of product market competition.
IV. Product Market Competition and Corporate Misconduct
A. Baseline Results
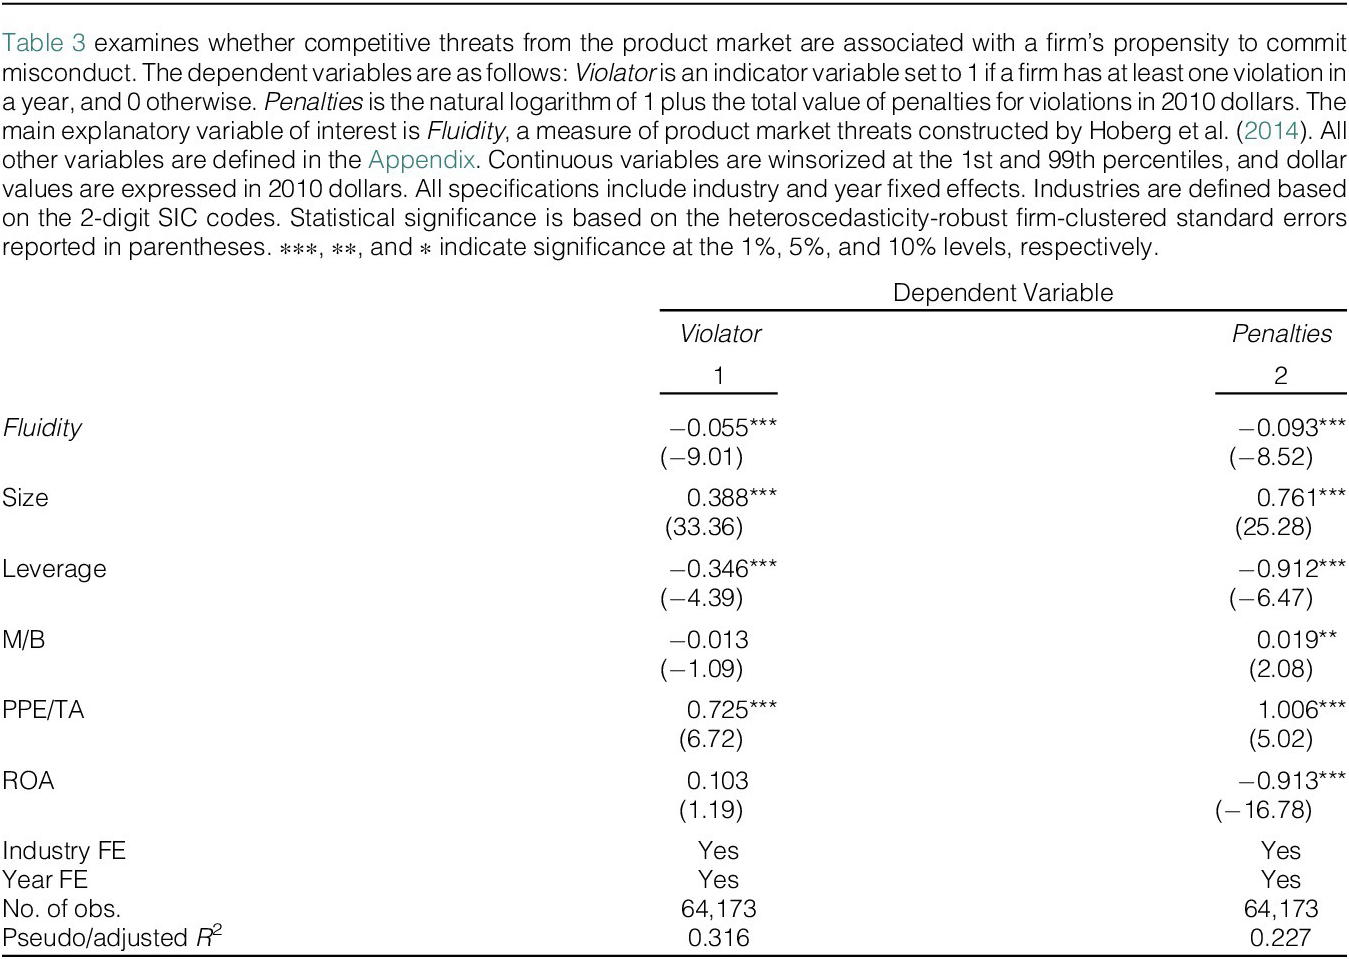
Table 3 presents our baseline results on the relation between product market competition and corporate misconduct. We begin our analysis by estimating a probit regression of Violator against our main variable of interest, Fluidity, controlling for other firm characteristics and fixed effects. Column 1 of Table 3 shows the results. The coefficient estimate on Fluidity is negative and statistically significant at the 1% level, suggesting that competitive threats reduce a firm’s propensity to commit violations. Column 2 of Table 3 presents the OLS regression results with Penalties as the dependent variable. Once again, the results indicate a significantly negative relation between competitive threats and corporate misconduct. The coefficient estimate of −0.093 for Fluidity suggests that a 1-standard-deviation increase in product market fluidity is associated with a 31.5% ((e–0.093 – 1) × 3.55) decrease in penalties. In dollar terms, this decrease translates to an annual penalty reduction of approximately $49,311, based on the average penalty of $156,544 per firm-year.

TABLE 3 Long description
This table examines whether competitive threats from the product market are associated with a firm’s propensity to commit misconduct. The dependent variables are as follows: Violator is an indicator variable set to 1 if a firm has at least one violation in a year, and 0 otherwise. Penalties is the natural logarithm of 1 plus the total value of penalties for violations in 2010 dollars. The main explanatory variable of interest is Fluidity, a measure of product market threats constructed by Hoberg et al. (2014). All other variables are defined in Appendix A. Continuous variables are winsorized at the 1st and 99th percentiles, and dollar values are expressed in 2010 dollars. All specifications include industry and year fixed effects. Industries are defined based on the 2-digit Standard Industrial Classification (SIC) codes. Statistical significance is based on the heteroscedasticity-robust firm-clustered standard errors reported in parentheses. ∗∗∗, ∗∗, and ∗ indicate significance at the 1%, 5%, and 10% levels, respectively.
Regarding control variables, Table 3 reveals that firm size is positively related to violations and penalties, consistent with the view that large, complex firms tend to have greater difficulties in preventing misconduct. In addition, the coefficient estimates on ROA are negative and frequently significant, suggesting that well-performing firms might be better positioned to combat misconduct. Leverage is negatively related to misconduct, pointing to a disciplinary role of debt (Titman and Wessels (Reference Titman and Wessels1988), Smith and Watts (Reference Smith and Watts1992)). Finally, consistent with Cohn and Wardlaw (Reference Cohn and Wardlaw2016), we find that violations and penalties increase with the tangibility of a firm’s assets.
B. Robustness Checks
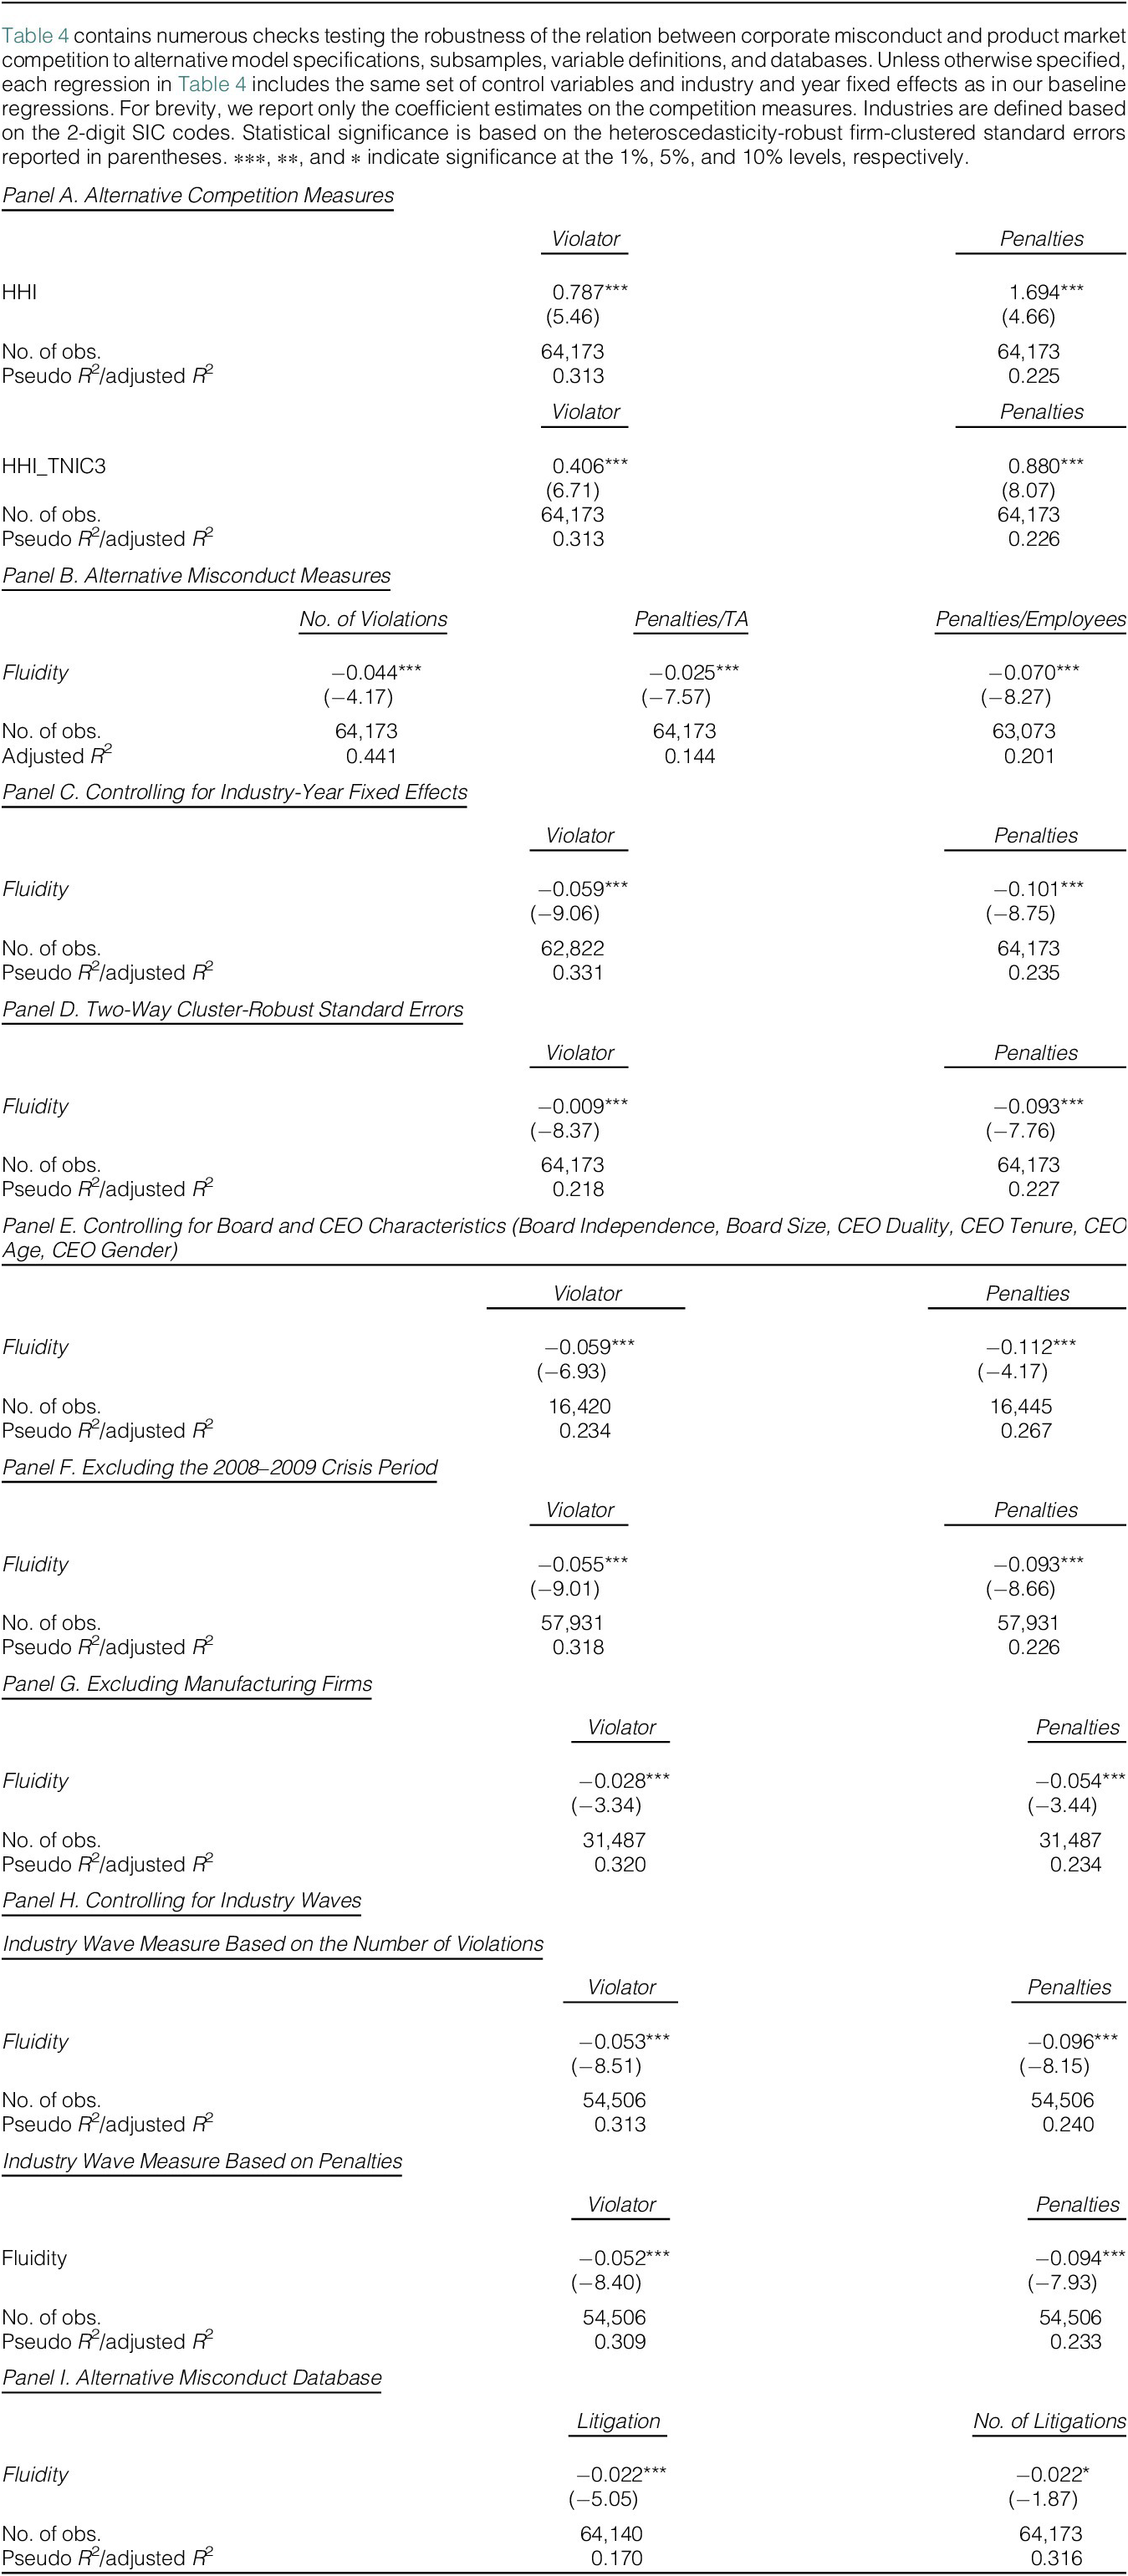
To enhance the reliability of our baseline findings, we conduct a wide array of robustness checks. We start by examining whether the findings survive when we use two alternative proxies for the intensity of product market competition. HHI is the Herfindahl–Hirschman Index of sales in a firm’s 3-digit SIC industry. HHI_TNIC3 is the Herfindahl–Hirschman Index of sales in a firm’s industry using the text-based network industry classification (TNIC) developed by Hoberg and Phillips (Reference Hoberg and Phillips2016). The TNIC industry classification takes advantage of product descriptions from annual firm 10-K filings and uses the observed tendency of product market vocabulary to cluster among firms operating in the same market. Panel A of Table 4 presents the regression results, showing that the findings are robust to alternative industry definitions and measures of competition.

TABLE 4 Long description
This table contains numerous checks testing the robustness of the relation between corporate misconduct and product market competition to alternative model specifications, subsamples, variable definitions, and database. Unless otherwise specified, each regression in this table includes the same set of control variables and industry and year fixed effects as in our baseline regressions. For brevity, we report only the coefficient estimates on the competition measures. Industries are defined based on the 2-digit Standard Industrial Classification (SIC) codes. Statistical significance is based on the heteroscedasticity-robust firm-clustered standard errors reported in parentheses. ∗∗∗, ∗∗, and ∗ indicate significance at the 1%, 5%, and 10% levels, respectively.
Second, we test whether the negative relation between product market competition and corporate misconduct remains when we employ alternative measures of misconduct. In the baseline specifications, we use two variables to capture the incidence and severity of violations. In column 1 of Panel B, Table 4, we consider an alternative misconduct measure based on the number of violations. No. of Violations is the total number of violations a firm commits in a year. To account for the discrete nature of violation counts, we run a Poisson regression with No. of Violations as the dependent variable (Cohn, Liu, and Wardlaw (Reference Cohn, Liu and Wardlaw2022)). In columns 2 and 3 of Panel B, Table 4, we scale penalty amounts by firm size to construct two additional measures: Penalties/TA, defined as the natural logarithm of 1 plus total penalties divided by total assets, and Penalties/Employees, defined as the natural logarithm of 1 plus total penalties divided by the number of employees. We then use product market fluidity to explain these alternative measures and verify that our main findings continue to hold.
Third, we replace industry and year fixed effects in the baseline regressions with industry-year interaction fixed effects to further account for potential heterogeneity within industries and years. Panel C of Table 4 shows that the results are not materially affected. Moreover, Gow, Ormazabal, and Taylor (Reference Gow, Ormazabal and Taylor2010) document that accounting variables are often both cross-sectionally and serially correlated and that correcting for both cross-sectional and time-series dependence substantially affects inferences reported in the literature. We therefore implement two-way cluster-robust standard errors in Panel D of Table 4 and find that the negative competition–misconduct relation remains significant.
Next, a potential concern is that board structure and CEO characteristics could influence our baseline results. To mitigate this concern, we retrieve director-level data from the RiskMetrics database and CEO-level data from ExecuComp and construct additional control variables. We add the following six controls to our baseline regressions and report the results in Panel E of Table 4. Board independence is the number of independent directors divided by board size. Board size is the total number of directors on the board. CEO age is the age of the CEO in years. Female CEO is a dummy variable that is equal to 1 if the CEO is a woman, and 0 otherwise. CEO tenure is the number of years the CEO has been in the position. CEO Chairman is a dummy variable that equals 1 if the CEO is also the chairman of the board, and 0 otherwise. While board and CEO data availability significantly reduces our sample size, the main results continue to hold in this reduced sample when we explicitly control for board and CEO characteristics.
Sixth, one might argue that our results are driven by the 2008 financial crisis, which could cause significant changes in both a firm’s industry structure and its misconduct propensity. In Panel F of Table 4, we repeat our baseline regressions in a sample that excludes the 2008–2009 crisis period and continue to observe negative and significant coefficient estimates on the fluidity variable. Similarly, to examine whether our results pertain only to manufacturing industries, in Panel G of Table 4, we corroborate the baseline results after excluding manufacturing firms. The results are quantitatively similar.
Seventh, to address the possibility that our findings could be driven by industry-related waves in misconduct, we construct two measures that capture industry waves. The first measure is based on the number of violations and is defined as the average number of Industry violations over the past 3 years, where Industry violations equal the total number of violations divided by the number of firms in a given industry-year. The second measure is based on penalties and is defined as the average Industry penalties over the past 3 years, where Industry penalties equal the total penalties divided by the number of firms in an industry-year. We then re-estimate our baseline models, controlling for either of these measures. As reported in Panel H of Table 4, the coefficient estimates on Fluidity remain negative and statistically significant, suggesting that our results are not driven by industry-related waves in misconduct.
Eighth, the observed relation between product market competition and corporate misconduct could potentially reflect underlying poor performance, as firms could resort to misconduct to boost earnings through cost-cutting. Although we control for ROA and M/B in all specifications, we conduct additional tests to ensure our findings are not simply a reflection of performance effects. Specifically, we split our sample into quartiles based on ROA and M/B, respectively, and re-estimate our baseline models within each performance quartile. The results, shown in Table IA2 in the Supplementary Material, indicate that the coefficient estimates on the fluidity variable remain negative and significant at the 5% level or better for both Violator and Penalties across all performance quartiles. This consistency across performance segments suggests that our findings are not driven by poor-performing firms. Rather, the negative competition–misconduct relation holds regardless of a firm’s performance. While it is difficult to completely rule out performance-related alternative explanations, the additional analysis suggests that our results are not merely an artifact of poor firm performance.
C. Alternative Data Source for Misconduct
Karpoff, Koester, Lee, and Martin (Reference Karpoff, Koester, Lee and Martin2017) demonstrate that empirical inferences can be sensitive to one’s choice of database in the misconduct research. Hence, it is likely that our estimated negative relation between market competition and misconduct is specific to the Violation Tracker data employed in our study. To rule out this possibility, we cross-validate the results using an alternative data source, the Civil Integrated Database of the Federal Judicial Center (FJC). The FJC database covers all civil cases filed in the U.S. federal district courts since 1970.Footnote 11 Using this litigation filing information, we create two litigation variables. Litigation is a dummy variable that equals 1 if a firm is mentioned as a defendant in one or more litigation filings in a year, and 0 otherwise. No. of Litigations is the number of times a firm is mentioned as a defendant in litigation filings in a year. We then estimate a probit regression using Litigation as the dependent variable, and a Poisson regression using No. of Litigations as the dependent variable. The results, reported in Panel I of Table 4, suggest that our key finding remains unaffected. The coefficient estimates on the fluidity variable are negative and significant at the 1% level, suggesting that product market threats reduce a firm’s likelihood of being sued. Importantly, given that Violation Tracker and the FJC compile their data from different sources, the two databases help cross-validate one another, further underscoring the validity of our findings.
D. Supplementary Evidence Using Tariff Reduction Events
We next present supplementary evidence on the relation between product market competition and corporate misconduct using large reductions in industry-level import tariffs. Tariff liberalizations, which reduce trade barriers, are often associated with increased competitive pressure in product markets (Frésard (Reference Frésard2010), Valta (Reference Valta2012)). This analysis provides a complementary setting to examine whether shifts in competition are related to changes in firm misconduct.
Our data on import tariffs for manufacturing industries come from Frésard and Valta (Reference Frésard and Valta2016) for the period up to 2005 and from Schott (Reference Schott2008) for the period between 2006 and 2018. For each 3-digit SIC industry-year, we compute the ad valorem tariff rate as the duties collected by U.S. customs divided by the free-on-board value of imports. To capture meaningful changes in product market conditions, we follow common practice in the economics literature by focusing on large tariff reductions that exceed a certain threshold.Footnote 12 Specifically, we follow Frésard (Reference Frésard2010) and Valta (Reference Valta2012) in classifying a tariff reduction in a given industry-year as large if it is at least three times greater than the median tariff reduction in the same industry over the sample period. A firm-year is then considered “treated” if the industry it operates in experiences a large tariff reduction in that year. We exclude events that occur within 3 years of each other to ensure clear treatment episodes. These selection criteria result in 36 large tariff reductions during our sample period.
We do not claim that these tariff reductions are exogenous in a strict econometric sense. However, prior research suggests that major tariff cuts often introduce substantial and lasting competitive pressure from foreign rivals (Tybout (Reference Tybout2003), Bernard, Jensen, Redding, and Schott (Reference Bernard, Jensen, Redding and Schott2007), and Krugman, Obstfeld, and Melitz (Reference Krugman, Obstfeld and Melitz2012)). These cuts are typically driven by multilateral trade agreements, such as the General Agreement on Tariffs and Trade (GATT) or World Trade Organization (WTO) rounds, and are generally outside the control of individual firms (Flammer (Reference Flammer2015), Li and Zhan (Reference Li and Zhan2019)). Flammer (Reference Flammer2015) documents that firms perceive such events as significant, often highlighting heightened competitive pressure in the Management’s Discussion and Analysis section of their 10-K filings following large import tariff reductions.
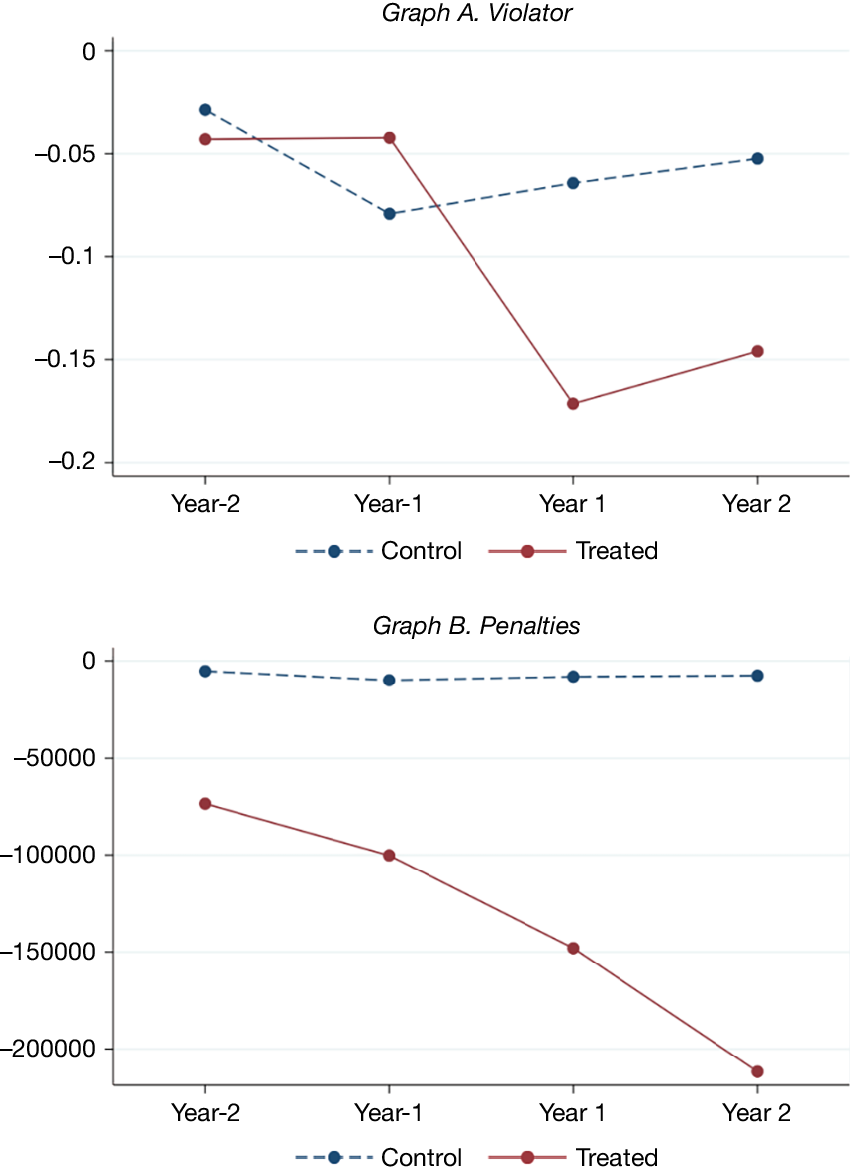
To assess pre-treatment comparability, we plot in Figure 1 the misconduct trends for treatment and control firms around the event. The trends are broadly parallel pre-treatment, suggesting no major divergence prior to the tariff reductions. After the event, however, treated firms exhibit a significant decline in both misconduct incidence and penalty amounts.
Figure 1 plots the coefficients on year indicators for treatment and control firms around tariff reduction events. We estimate a probit regression with the violator indicator as the dependent variable and an OLS regression with the penalty amount as the dependent variable. We use year t – 3 as the benchmark year and run the regression separately for treatment and control firms.

Following Dasgupta, Li, and Wang (Reference Dasgupta, Li and Wang2018), we assemble the sample for this analysis in 2 steps. First, we construct an event episode for each firm year in the treatment group, consisting of six consecutive firm-year observations from 3 years before (year t – 3) to 3 years after (year t + 3) the large tariff reduction (event year t). The event year is excluded to mitigate the effect of potential confounding factors. For each event episode, we construct a control group using six consecutive firm-year observations around the event year t for firms that do not experience a large tariff reduction. Second, we pool the firm-year observations across all event episodes and estimate the average treatment effect of tariff reduction shocks on firm misconduct using the following specification:

where the dependent variable is our measure of corporate misconduct. Treat is a dummy variable that takes the value of 1 for treated firms in industries that experience a large tariff reduction, and 0 otherwise. Post is a dummy variable that takes the value of 1 for the years in the post-event period (i.e., years t + 1, t + 2, and t + 3), and 0 for the years in the pre-event period (i.e., years t – 1, t – 2, and t – 3). We include the same set of control variables as in the baseline models. Industry and Year represent industry and year fixed effects, respectively. The variable of interest is the interaction term Treat × Post, and its coefficient
$ {\beta}_1 $
 captures the change in misconduct for the treated firms relative to the control firms from before to after the large tariff reduction events.
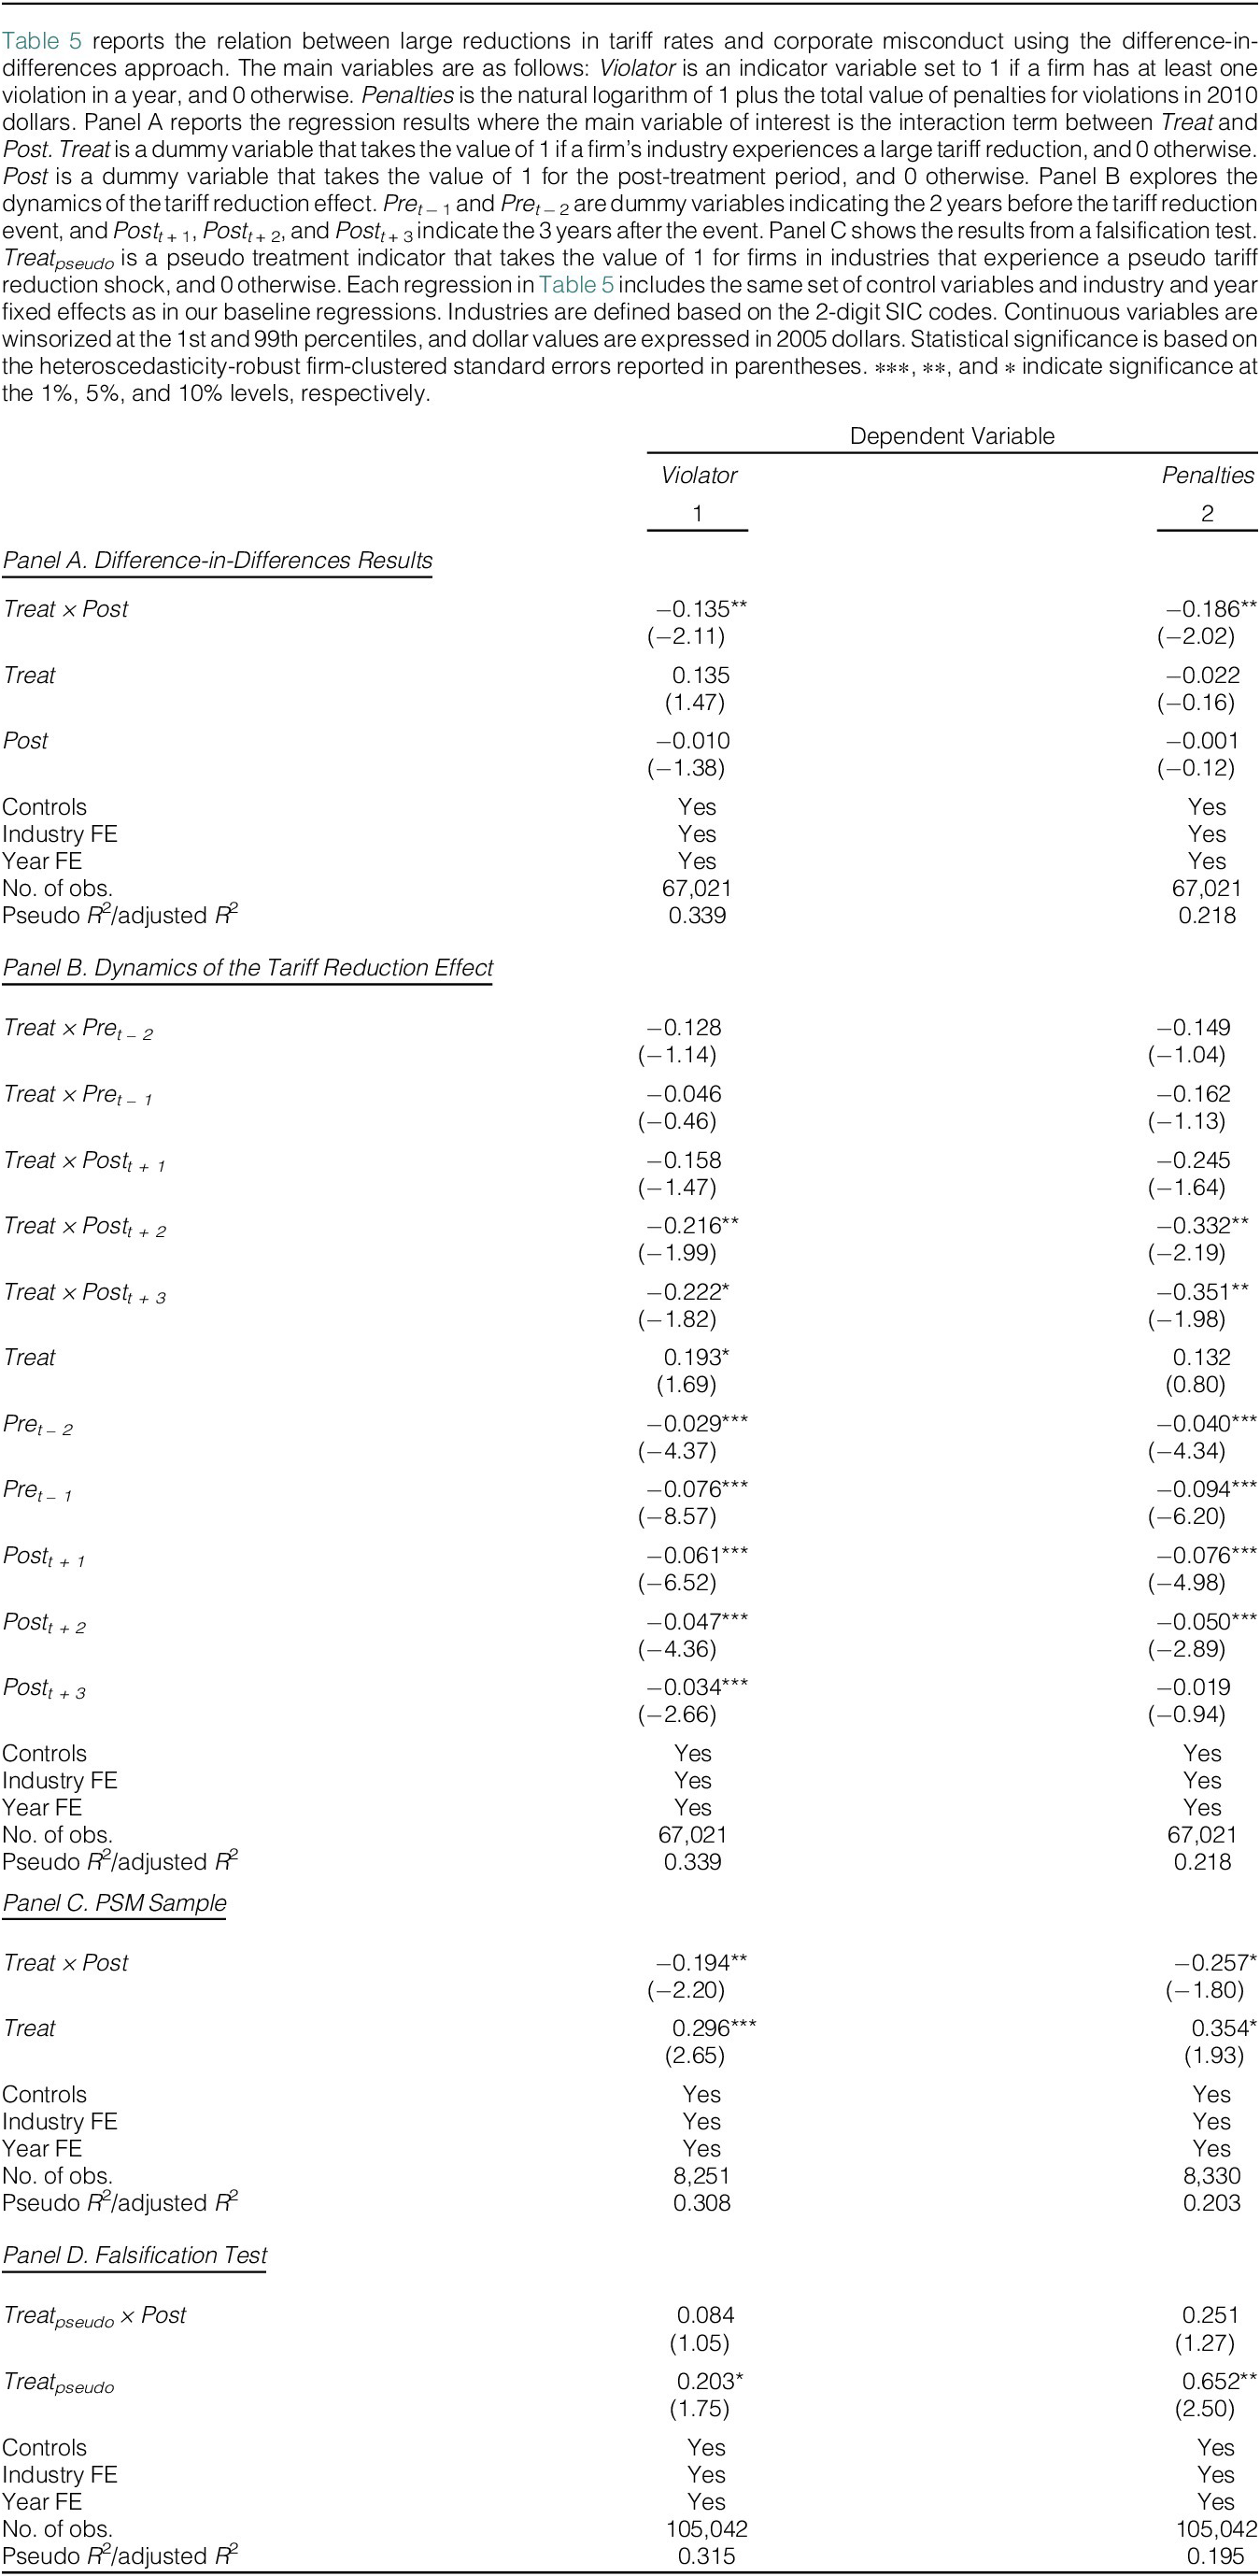
Panel A of Table 5 presents the regression results in which the dependent variables are Violator and Penalties, respectively. Across specifications, the coefficient estimate on Treat × Post remains negative and statistically significant at the 5% level. For example, the coefficient estimate on Treat × Post in column 2 is −0.186 with a t-statistic of −2.02, suggesting that penalties for treated firms decline by approximately 18.6% relative to control firms.Footnote 13

TABLE 5 Long description
This table reports the relation between large reductions in tariff rates and corporate misconduct using the difference-in-differences approach. The main variables are as follows: Violator is an indicator variable set to 1 if a firm has at least one violation in a year, and 0 otherwise. Penalties is the natural logarithm of 1 plus the total value of penalties for violations in 2010 dollars. Panel A reports the regression results where the main variable of interest is the interaction term between Treat and Post. Treat is a dummy variable that takes the value of 1 if a firm’s industry experiences a large tariff reduction, and 0 otherwise. Post is a dummy variable that takes the value of 1 for the post-treatment period, and 0 otherwise. Panel B explores the dynamics of the tariff reduction effect. Pret−1 and Pret−2 are dummy variables indicating the 2 years before the tariff reduction event, and Postt+1, Postt+2, and Postt+3 indicate the 3 years after the event. Panel C shows the results from a falsification test. Treatpseudo is a pseudo treatment indicator that takes the value of 1 for firms in industries that experience a pseudo tariff reduction shock, and 0 otherwise. Each regression in this table includes the same set of control variables and industry and year fixed effects as in our baseline regressions. Industries are defined based on the 2-digit Standard Industrial Classification (SIC) codes. Continuous variables are winsorized at the 1st and 99th percentiles, and dollar values are expressed in 2005 dollars. Statistical significance is based on the heteroscedasticity-robust firm-clustered standard errors reported in parentheses. ∗∗∗, ∗∗, and ∗ indicate significance at the 1%, 5%, and 10% levels, respectively.
To test the robustness of our findings, we conduct three additional analyses. First, in Panel B of Table 5, we examine whether the effect of competition varies over time by introducing year-specific dummy variables—Pre t − 1, Pre t − 2, Post t + 1, Post t + 2, and Post t + 3—which represent the 2 years before and the 3 years after the tariff reduction. We interact these dummies with the treatment indicator to test for pre-existing trends. If treated and control firms exhibit diverging misconduct trends prior to the tariff cut, we would expect negative and significant coefficient estimates on Treat × Pre t − 1 and/or Treat × Pre t − 2. However, the results show that only the post-treatment interactions are significant, suggesting that the observed reduction in misconduct occurs only after the increase in competition.
Second, in Panel C, we conduct a matched sample analysis following Frésard and Valta (Reference Frésard and Valta2016). Each treated firm is matched to its nearest untreated neighbor from a different 3-digit SIC industry based on pre-treatment characteristics, including the logarithm of total assets, Tobin’s q, cash flow to total assets, cash holding to total assets, and leverage. We retain observations from 3 years before to 3 years after the tariff cut, excluding the event year, and drop any matched firm that becomes treated during this window. We then repeat our DiD analysis using this matched sample. The results remain consistent with those in Panel A of Table 5.
Third, in Panel D, we perform a falsification test by assigning pseudo tariff reduction events at random to industries, following Dasgupta et al. (Reference Dasgupta, Li and Wang2018). Specifically, we replace the actual treatment indicator with a pseudo-treatment indicator, Treatpseudo, which equals 1 for firms in pseudo-treated industries and 0 otherwise. Repeating the baseline regressions with this pseudo-treatment indicator yields no significant effects, suggesting that our main findings are unlikely to be driven by random chance or unobserved shocks.
In summary, the evidence presented in this section reinforces the notion that stronger product market competition is associated with a lower incidence of corporate misconduct. Additional untabulated results using an instrumental variables approach, commonly employed in the competition literature, further support this finding.Footnote 14
V. Disciplinary Role of Product Market Competition and Stakeholder Responses
This section examines how different types of corporate misconduct affect firm outcomes and how these effects are shaped by product market competition. We focus on three categories of misconduct: customer-related (e.g., consumer protection and product safety), employee-related (e.g., workplace safety, labor practices, and discrimination), and environmental violations. Together, these categories account for 94.5% of observed violations and provide a basis for analyzing consequences in the product, labor, and capital markets.
Our analysis is guided by a framework that distinguishes three types of reputational consequences through which misconduct affects firm outcomes. First, misconduct can lead to direct reputational losses when affected stakeholders withdraw business or demand higher returns (Karpoff and Lott (Reference Karpoff and Lott1993), Murphy et al. (Reference Murphy, Shrieves and Tibbs2009)). Second, it can create indirect reputational losses if stakeholders outside the directly harmed group infer reduced reliability and scale back their engagement. Third, misconduct could provoke values-driven responses, whereby stakeholders avoid unethical firms even at personal cost (Starks (Reference Starks2023)). This framework helps explain why employee-related violations can depress sales or why environmental violations can raise the cost of capital, even when product quality or investor cash flows are not directly impaired.
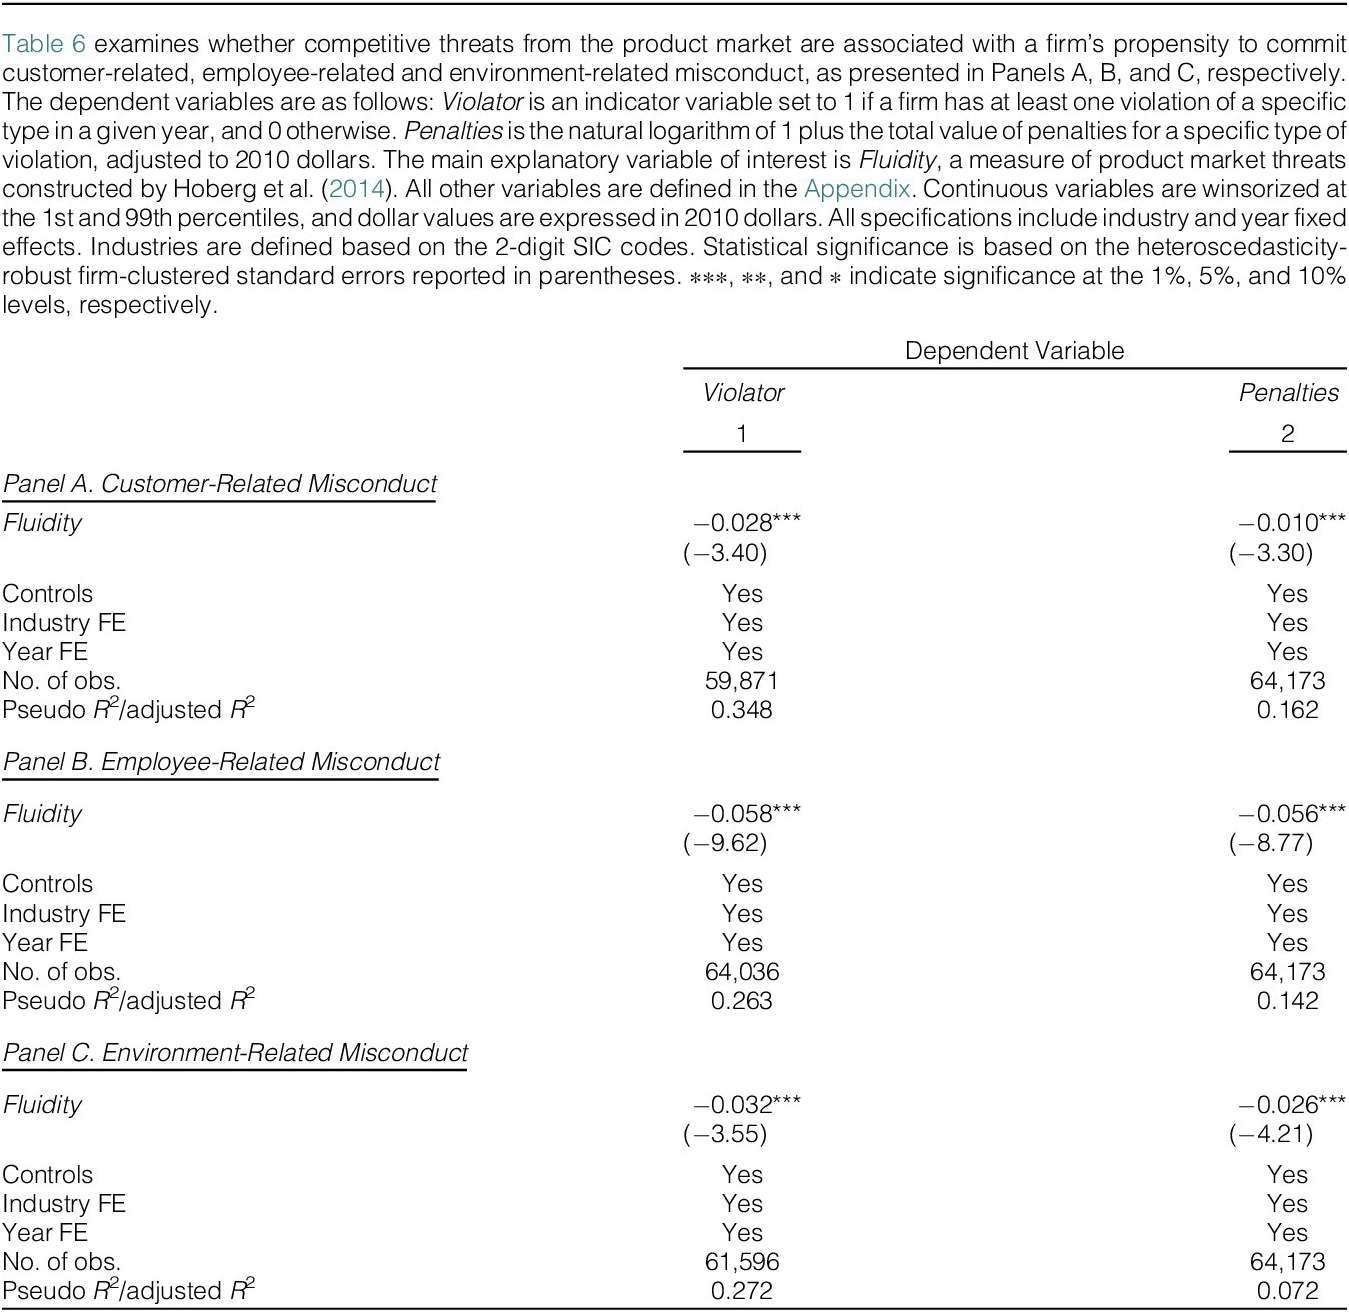
Our central argument is that product market competition amplifies these reputational consequences, thereby strengthening firms’ incentives to avoid misconduct. By linking misconduct types to the primary stakeholder groups they affect and examining firm outcomes across product, labor, and capital markets, we assess how competition shapes the magnitude of these reputational costs. We begin by testing whether product market competition is associated with lower levels of each misconduct type. Table 6 shows that Fluidity is negatively related to the incidence and severity of customer-related, employee-related, and environmental violations. These results suggest that competition deters not only customer-related violations, where the disciplining mechanism is direct, but also employee- and environment-related violations, where the effects may be indirect or values-driven.

TABLE 6 Long description
This table examines whether competitive threats from the product market are associated with a firm’s propensity to commit customer-related, employee-related and environmental-related misconduct, as presented in Panels A, B, and C, respectively. The dependent variables are as follows: Violator is an indicator variable set to 1 if a firm has at least one violation of a specific type in a given year, and 0 otherwise. Penalties is the natural logarithm of 1 plus the total value of penalties for a specific type of violation, adjusted to 2010 dollars. The main explanatory variable of interest is Fluidity, a measure of product market threats constructed by Hoberg et al. (2014). All other variables are defined in Appendix A. Continuous variables are winsorized at the 1st and 99th percentiles, and dollar values are expressed in 2010 dollars. All specifications include industry and year fixed effects. Industries are defined based on the 2-digit Standard Industrial Classification (SIC) codes. Statistical significance is based on the heteroscedasticity-robust firm-clustered standard errors reported in parentheses. ∗∗∗, ∗∗, and ∗ indicate significance at the 1%, 5%, and 10% levels, respectively.
For customer-related violations, product market competition heightens direct reputational consequences because lower switching costs make it easier for consumers to leave if they lose trust in the firm. For employee- and environment-related violations, competition intensifies both indirect reputational effects (e.g., customers or investors interpreting misconduct as a signal of unreliability) and values-driven effects (e.g., stakeholders withdrawing support for moral or ethical reasons). Moreover, competitive markets often coincide with intense labor competition (Guadalupe (Reference Guadalupe2007), Brogaard et al. (Reference Brogaard, Le, Nguyen and Sila2026)), so misconduct that damages trust can more easily lead to employee attrition and productivity loss.
In sum, our findings indicate that competition broadly deters misconduct, motivating our analysis of how violations affect outcomes across product, labor, and capital markets, and how these effects vary with competition. If competition intensifies reputational losses, firms in highly competitive markets should experience larger declines in product, labor, and capital market outcomes following violations. We test this conjecture by estimating regressions of firm outcomes on misconduct indicators, competition, and their interaction, as specified in the following model:

where the dependent variables represent firm outcomes in the product, labor, and capital markets. High fluidity is a dummy variable that equals 1 if a firm has an above-median Fluidity score, and 0 otherwise, where Fluidity is a measure of product market threats constructed by Hoberg et al. (Reference Hoberg, Phillips and Prabhala2014). Violator is a dummy variable that equals 1 if a firm has at least one violation (or a specific type of violation), and 0 otherwise. The variable of interest in this analysis is the interaction term between High fluidity and Violator. As in the baseline regressions, the model includes the same control variables as well as industry and year fixed effects.
A. Product Market Outcomes: Sales Growth
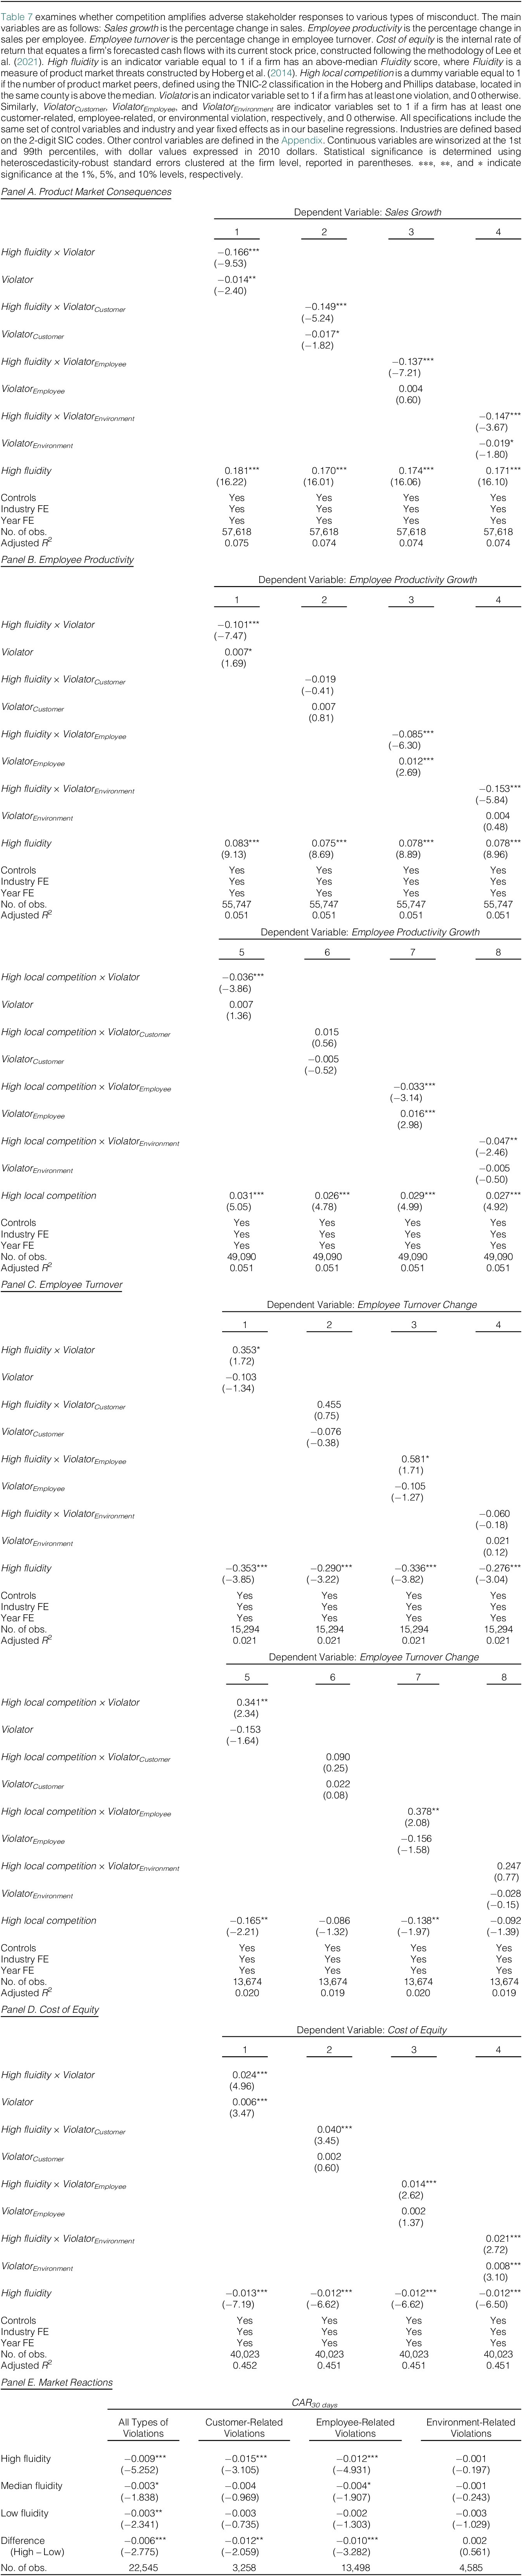
We first examine the product market consequences of misconduct in competitive and non-competitive markets in Panel A of Table 7. Sales growth, defined as the percentage change in sales during the year of the violation, serves as our measure of product market performance. In column 1, we use a broad definition of Violator that encompasses all types of violations. Columns 2 through 4 then disaggregate the results by three specific categories of misconduct. Across all categories, we find that violations are associated with significantly lower sales growth, with the negative relations being more pronounced in competitive markets.

TABLE 7 Long description
This table examines whether competition amplifies adverse stakeholder responses to various types of misconduct. The main variables are as follows: Sales growth is the percentage change in sales. Employee productivity is the percentage change in sales per employee. Employee turnover is the percentage change in employee turnover. Cost of equity is the internal rate of return that equates a firm’s forecasted cash flows with its current stock price, constructed following the methodology of Lee, So, and Wang (2021). High fluidity is an indicator variable equal to 1 if a firm has an above-median Fluidity score, where Fluidity is a measure of product market threats constructed by Hoberg et al. (2014). High local competition is a dummy variable equal to 1 if the number of product market peers, defined using the TNIC-2 classification in the Hoberg and Phillips database, located in the same county is above the median. Violator is an indicator variable set to 1 if a firm has at least one violation, and 0 otherwise. Similarly, ViolatorCustomer, ViolatorEmployee, and ViolatorEnvironment are indicator variables set to 1 if a firm has at least one customer-related, employee-related, or environmental violation, respectively, and 0 otherwise. All specifications include the same set of control variables and industry and year fixed effects as in our baseline regressions. Industries are defined based on the 2-digit Standard Industrial Classification (SIC) codes. Other control variables are defined in Appendix A. Continuous variables are winsorized at the 1st and 99th percentiles, with dollar values expressed in 2010 dollars. Statistical significance is determined using heteroscedasticity-robust standard errors clustered at the firm level, reported in parentheses. ∗∗∗, ∗∗, and ∗ indicate significance at the 1%, 5%, and 10% levels, respectively.
These results reflect all three types of reputational loss. Directly, customer-related violations erode product trust and induce switching. Indirectly, employee- or environment-related violations can signal unreliability and reduce demand (Duan et al. (Reference Duan, Li and Michaely2024)). Finally, consumers may disengage for ethical reasons when misconduct conflicts with widely held values (Houston et al. (Reference Houston, Lin, Shan and Shen2025), Meier et al. (Reference Meier, Servaes, Wei and Xiao2025)). Whether motivated by self-interest or ethical concerns, consumer withdrawal reduces revenue and thus disciplines firms. Our findings are consistent with recent micro-level evidence that customers respond adversely to ESG-related incidents, even when unrelated to product quality (Duan et al. (Reference Duan, Li and Michaely2024), Houston et al. (Reference Houston, Lin, Shan and Shen2025), Meier et al. (Reference Meier, Servaes, Wei and Xiao2025)). Competition amplifies this effect by lowering switching costs and increasing the salience of firm misbehavior (Cao et al. (Reference Cao, Fang and Lei2021), Von Meyerinck et al. (Reference Von Meyerinck, Pursiainen and Schmid2025)).
B. Labor Market Outcomes: Employee Productivity and Turnover
Next, we examine the impact of misconduct on labor market outcomes. In Panel B of Table 7, the dependent variable is Employee productivity growth, defined as the percentage change in sales per employee during the violation year. In Panel C, the dependent variable is Employee turnover change, measured as the percentage change in employee turnover during the violation year, where employee turnover is calculated as the number of forfeited employee stock options divided by the total number of outstanding stock options. As before, column 1 in both panels examines violations in general, while columns 2–4 analyze the three specific types of violations. We expect violations, particularly those involving employees, to be significantly associated with labor market outcomes, with these relations being more pronounced in highly competitive markets.
In such competitive markets, where cost efficiency is paramount, firms face intensified competition for skilled workers (Guadalupe (Reference Guadalupe2007)). Moreover, heightened competition increases labor mobility, enabling employees to more easily leave firms perceived as unethical or poorly managed (Brogaard et al. (Reference Brogaard, Le, Nguyen and Sila2026)). For those who remain, morale and motivation could decline, resulting in lower productivity. Consequently, misconduct raises the risk of talent attrition, especially in competitive markets in which reputational signals spread quickly and alternative job opportunities are readily available.
Our results confirm that employee-related misconduct is associated with lower employee productivity and increased turnover, with these relations being more pronounced in competitive markets. Environment-related violations also undermine employee productivity, primarily in competitive settings. We interpret these patterns through the lens of both economic incentives and value alignment. From an economic perspective, misconduct increases perceived risks to job stability and firm performance, prompting productivity losses and higher turnover. From a Values perspective, employees may experience dissonance when firms violate environmental norms, especially if those norms conflict with their own. This aligns with the value-alignment view of Rice and Schiller (Reference Rice and Schiller2025), which suggests that when employees’ moral values clash with the firm’s conduct, intrinsic motivation and organizational commitment decline. Such misalignment can reduce productivity and prompt employee exit.
To further strengthen our analysis, columns 5–8 in Panels B and C replicate the earlier tests (columns 1–4) but incorporate an important contextual factor: the tightness of the local labor market and the potential for labor movement facilitated by geographic clustering. When firms and their competitors are geographically concentrated in clusters or agglomerations, proximity enables easier labor mobility among firms. To test this conjecture, we define High local competition as a dummy variable that equals 1 if the number of product market peers, identified using the TNIC-2 classification from the Hoberg and Phillips database, located in the same county, exceeds the sample median, and 0 otherwise. This measure captures the intensity of local labor market competition, which can exacerbate the costs of misconduct by increasing the ease with which employees can switch jobs.
Our results show that the patterns observed in columns 1–4 hold consistently when accounting for local labor market conditions, reinforcing the conclusion that competition, both at the product market level and locally, acts as a powerful disciplinary force. Firms operating in regions with dense peer presence face heightened pressure to curb misconduct, as misconduct would accelerate talent loss and harm firm productivity.
C. Capital Market Outcomes: Cost of Equity and Market Reactions
Finally, we examine the capital market implications of misconduct, focusing on its relations with the cost of equity and stock market reactions to the revelation of violations. In Panel D of the table, the dependent variable Cost of equity is defined as the internal rate of return that equates a firm’s forecasted cash flows with its current stock price, constructed following the methodology of Lee, So, and Wang (Reference Lee, So and Wang2021). Our results indicate that all three types of misconduct—consumer-related, employee-related, and environmental—are associated with a higher cost of equity, particularly in highly competitive markets. These findings suggest that investors factor in the increased risks associated with customer loss, employee turnover, and reputational volatility, which are likely to be more severe in competitive markets.
In addition, Panel E of Table 7 examines stock market reactions to violation announcements and whether these reactions vary across firms with different levels of product market competition. We compute cumulative abnormal returns (CARs) over a 30-day window following each announcement, with expected returns estimated over the prior 100 days using the Fama–French three-factor model. We group firms into terciles based on product market fluidity. Across all fluidity groups, average CARs are negative and statistically significant, suggesting a general investor aversion to corporate misconduct. These CARs capture investors’ expectations of the value impact of violations, reflecting anticipated losses in sales, productivity, labor costs, and other operational outcomes. Notably, the negative CARs are significantly larger for firms in the high-fluidity group, suggesting that competitive pressures amplify market expectations of the adverse consequences of misconduct.
When disaggregating by violation type, we find that for customer-related and employee-related violations, CARs are significantly negative primarily within the high-fluidity group, and the differences in CARs between high- and low-fluidity groups are statistically significant. In contrast, for environmental violations, CARs are negative but statistically insignificant across all groups. These results suggest that investor reactions are especially severe when the misconduct directly affects stakeholders that are critical to firm operations, and when the firm operates in a competitive product market. This pattern is consistent with theoretical models of contract enforcement (e.g., Klein and Leffler (Reference Klein and Leffler1981)), which posit that firms in competitive markets have stronger incentives to build and maintain reputations. The more pronounced negative reactions for high-fluidity firms imply that investors anticipate greater losses in these firms, reflecting both the higher reputational capital at stake and the steeper penalties when trust is breached.
Collectively, the results in this section suggest that competition disciplines firms by amplifying both direct and indirect reputational losses of misconduct across product, labor, and capital markets. While different types of misconduct affect different stakeholder groups, all have more severe consequences in competitive markets. Firms in such environments experience larger sales losses, productivity declines, and turnover increases, which in turn are reflected in higher capital costs and stock price declines, capturing investors’ expectations of these amplified losses. Overall, the findings highlight that investors and managers should account for a firm’s competitive environment and misconduct profile, as violations are especially costly under intense product market competition.
VI. Further Analyses
A. Plausible Mechanisms
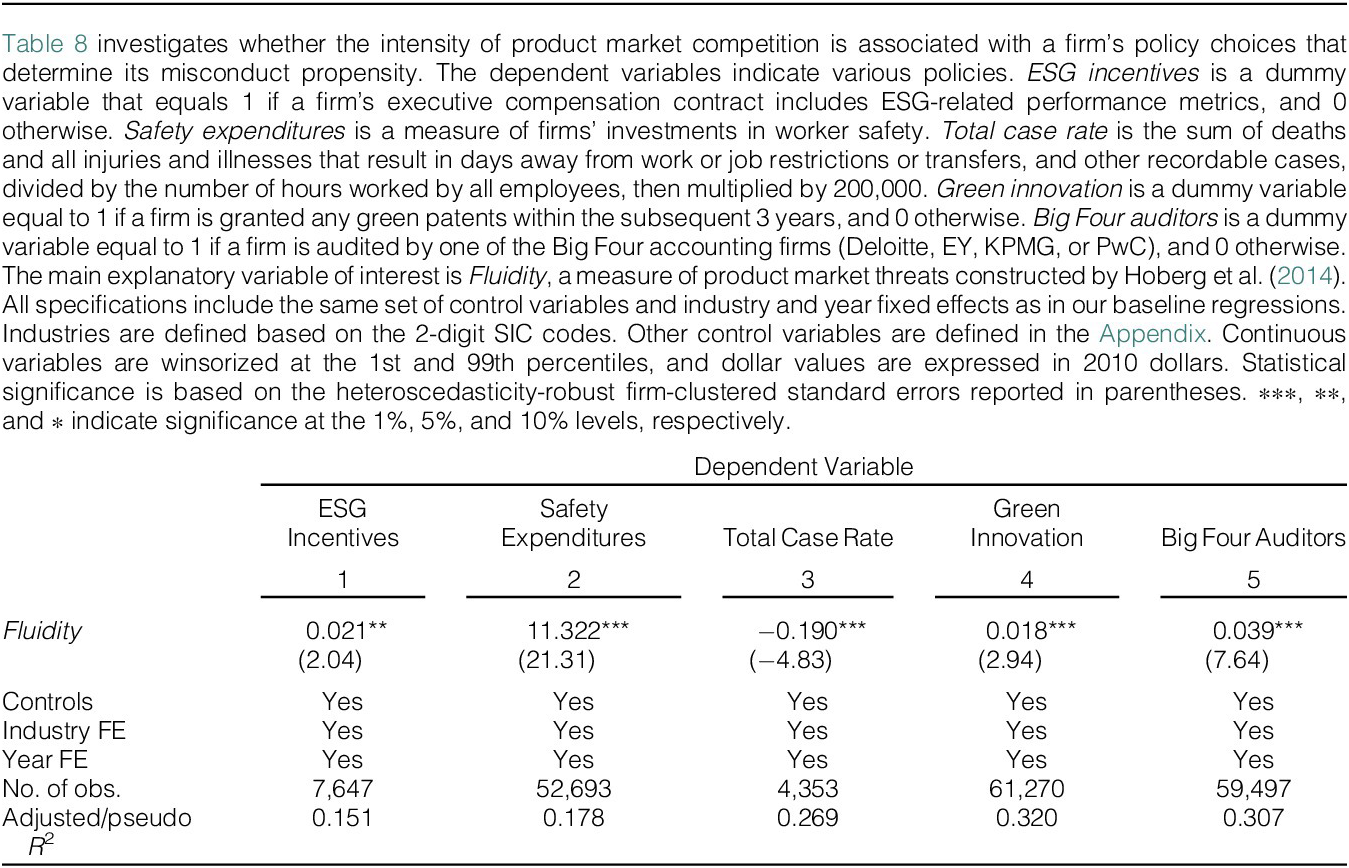
So far, we have shown that market competition plays a disciplinary role in reducing misconduct. We now turn to the potential mechanisms through which competition could exert this effect. Specifically, we examine whether firms facing greater competitive pressure are more likely to adopt compliance-enhancing practices, including ESG-linked executive compensation, worker safety policies, green innovation, and high-quality external auditing. Given our main finding that firms in more competitive markets engage in less misconduct, we expect competitive pressure to encourage the adoption of compliance-enhancing practices. Our data support this expectation.
To start, we examine whether firms under competitive pressure provide incentives in executive compensation contracts to align the interests of managers with those of other stakeholders. We use the ISS Incentive Labs database to identify ESG-related performance metrics in executive compensation contracts. We flag compensation contracts that include ESG-related performance metrics by searching a list of keywords and then construct an indicator variable, ESG incentives, that equals 1 if a firm’s executive compensation contract is flagged, and 0 otherwise.Footnote 15 In column 1 of Table 8, we regress ESG incentives on product market fluidity, controlling for other factors. The coefficient estimate on Fluidity is positive and significant at the 5% level, suggesting that competitive threats increase the likelihood of adopting ESG-related incentives in executive compensation contracts.

TABLE 8 Long description
This table investigates whether the intensity of product market competition is associated with a firm’s policy choices that determine its misconduct propensity. The dependent variables indicate various policies. ESG incentives is a dummy variable that equals 1 if a firm’s executive compensation contract includes ESG-related performance metrics, and 0 otherwise. Safety expenditures is a measure of firms’ investments in worker safety. Total case rate is the sum of deaths and all injuries and illnesses that result in days away from work or job restrictions or transfers, and other recordable cases divided by the number of hours worked by all employees, then multiplied by 200,000. Green innovation is a dummy variable equal to 1 if a firm is granted any green patents within the subsequent 3 years, and 0 otherwise. Big Four auditors is a dummy variable equal to 1 if a firm is audited by one of the Big Four accounting firms (Deloitte, EY, KPMG, or PwC), and 0 otherwise. The main explanatory variable of interest is Fluidity, a measure of product market threats constructed by Hoberg et al. (2014). All specifications include the same set of control variables and industry and year fixed effects as in our baseline regressions. Industries are defined based on the 2-digit Standard Industrial Classification (SIC) codes. Other control variables are defined in Appendix A. Continuous variables are winsorized at the 1st and 99th percentiles, and dollar values are expressed in 2010 dollars. Statistical significance is based on the heteroscedasticity-robust firm-clustered standard errors reported in parentheses. ∗∗∗, ∗∗, and ∗ indicate significance at the 1%, 5%, and 10% levels, respectively.
Columns 2 and 3 of Table 8 report the results for worker safety policies. We use two measures to capture the strength and effectiveness of safety policies. The first measure, Safety expenditures, estimates firms’ safety-related investments from abnormal discretionary expenses, following the approach of Caskey and Ozel (Reference Caskey and Ozel2017).Footnote 16 The second measure, Total case rate, captures work-related injuries per 200,000 hours worked and is obtained from the Occupational Safety and Health Administration (OSHA).Footnote 17 Our sample period for this analysis ends in 2011 due to the availability of the OSHA data. Using these two safety policy measures, we find that firms in more competitive markets have higher safety expenditures and lower injury rates.
Extending our analysis to broader investments in compliance, we next examine whether firms operating in more competitive product markets demonstrate stronger commitments to green innovation and higher-quality external auditing—two dimensions that plausibly reflect enhanced governance and compliance efforts. To capture these aspects, we construct two indicator variables. Green innovation is a dummy variable that equals 1 if a firm is granted any green patents within the subsequent 3 years, and 0 otherwise. We use patent data from Kogan, Papanikolaou, Seru, and Stoffman (Reference Kogan, Papanikolaou, Seru and Stoffman2017) and define green innovation as patents classified in environment-related categories, such as pollution prevention and control, following Cheng, Lin, and Yang (Reference Cheng, Lin and Yang2025). Big Four auditors is a dummy variable that equals 1 if a firm is audited by one of the Big Four accounting firms (Deloitte, EY, KPMG, or PwC), and 0 otherwise.
In column 4 of Table 8, we find a positive and significant relation between product market fluidity and Green innovation, consistent with the notion that firms facing competitive threats are more likely to invest in technologies that promote environmental compliance. In column 5, we examine the likelihood that a firm hires a Big Four auditor. We find that higher product market fluidity increases the probability of employing a Big Four auditor. Since these auditors are widely regarded as providing higher-quality assurance (DeFond and Zhang (Reference DeFond and Zhang2014), Che, Hope, and Langli (Reference Che, Hope and Langli2020)), this finding suggests a greater investment in external monitoring to support compliance.
Taken together, the evidence in Table 8 points to multiple plausible mechanisms, ranging from internal incentives and employee welfare to innovation and external oversight, through which firms respond to competitive threats by strengthening their governance and compliance infrastructure.
B. Alternative Explanations
This section addresses alternative explanations of our main findings. Examining these alternatives increases confidence in our interpretation of competition as a disciplinary force.
1. Competitive Strategy Explanation
An alternative explanation, drawing on Flammer (Reference Flammer2015), is that promoting responsible corporate behavior can function as a competitive strategy. Firms facing intense competition could expand their social and environmental initiatives to differentiate themselves and strengthen their market position. Both this competitive strategy view and the disciplining view predict that competition curbs misconduct, but they differ in how competition influences proactive efforts to promote responsible behavior. According to the competitive strategy view, firms adopt stakeholder-oriented initiatives as a differentiation tool to attract customers, implying a positive relation between competition and such initiatives. By contrast, the disciplining view suggests that firms focus primarily on avoiding violations, so competition reduces negative actions but does not necessarily increase efforts to actively promote responsible behavior.
To explore the asymmetrical effects of competition on the two levers, we collect firms’ ESG data from the MSCI Stats (KLD) database for 2000–2014.Footnote 18 The data cover six domains: community, diversity, employee relations, environment, human rights, and product quality, each with positive (strength) and negative (concern) indicators scored as 1 if criteria are met.Footnote 19 Following Deng, Kang, and Low (Reference Deng, Kang and Low2013) and Lins, Servaes, and Tamayo (Reference Lins, Servaes and Tamayo2017), we construct three ESG measures in 3 steps. First, we obtain modified scores by dividing the strength and concern scores for each domain by the number of strength and concern indicators in that domain. Second, we aggregate individual modified scores to form the overall strength and concern scores. ESG strength, the sum of modified strength scores across the six domains, captures a firm’s performance in promoting responsible corporate behavior. ESG concern, the sum of modified concern scores across the domains, captures the firm’s performance in avoiding harmful practices. Finally, the overall ESG score, ESG overall, is the difference between ESG strength and ESG concern. Footnote 20
Table 9 reports the results of the regressions examining how a firm’s competitive pressure is associated with its ESG measures. The results suggest that competition reduces ESG concern but has no significant impact on ESG strength, consistent with the disciplining explanation.

TABLE 9 Long description
This table examines the asymmetrical effects of product market competition on corporate misconduct versus responsible corporate behavior. The main variables are as follows: ESG strength is the sum of modified strength scores across the six domains, captures a firm’s performance in promoting responsible corporate behavior. ESG concern is the sum of modified concern scores across the domains, captures the firm’s performance in avoiding harmful practices. ESG overall is the difference between ESG strength and ESG concern. Fluidity is a measure of product market threats constructed by Hoberg et al. (2014). All specifications include the same set of control variables and industry and year fixed effects as in our baseline regressions. Industries are defined based on the 2-digit Standard Industrial Classification (SIC) codes. Other control variables are defined in Appendix A. Continuous variables are winsorized at the 1st and 99th percentiles, and dollar values are expressed in 2010 dollars. Statistical significance is based on the heteroscedasticity-robust firm-clustered standard errors reported in parentheses. ∗∗∗, ∗∗, and ∗ indicate significance at the 1%, 5%, and 10% levels, respectively.
2. Coordination Explanation
Another alternative explanation concerns our main variable of interest, Fluidity, which measures competition intensity by comparing a firm’s product description vocabulary with changes in rivals’ vocabularies. Greater overlap indicates higher competitive pressure. However, Fathollahi et al. (Reference Fathollahi, Harford and Klasa2022) note that in highly concentrated industries, this measure may reflect firms’ incentives to collude rather than competition, as fewer aspects require coordination to avoid price wars. To address this, we re-estimate our baseline regressions excluding firm-years in the top quintile of HHI, where HHI is the Herfindahl–Hirschman Index of sales in a firm’s 3-digit SIC industry. Panel A of Table 10 shows that results remain robust.

TABLE 10 Long description
This table presents further robustness checks on the fluidity measure. The main variables are as follows: Violator is an indicator variable set to 1 if a firm has at least one violation in a year, and 0 otherwise. Penalties is the natural logarithm of 1 plus the total value of penalties for violations in 2010 dollars. Fluidity is a measure of product market threats constructed by Hoberg et al. (2014). Competition index is an index-based measure of competition using principal component analysis. Panel A repeats the baseline regressions after excluding firms in highly concentrated industries. Panel B repeats the baseline regressions using the competition index variable. All specifications include the same set of control variables and industry and year fixed effects as in our baseline regressions. Industries are defined based on the 2-digit Standard Industrial Classification (SIC) codes. Other control variables are defined in Appendix A. Continuous variables are winsorized at the 1st and 99th percentiles, and dollar values are expressed in 2010 dollars. Statistical significance is based on the heteroscedasticity-robust firm-clustered standard errors reported in parentheses. ∗∗∗, ∗∗, and ∗ indicate significance at the 1%, 5%, and 10% levels, respectively.
As an extension, we construct a competition index that captures different aspects of market competition. We use three proxies: Fluidity, HHI, and IPS. The first two are as previously defined. IPS, an industry-level measure of product similarity, is the average similarity of a firm’s products to others in its industry, based on 10-K product descriptions. The sample period for this test ends in 2015 due to the availability of IPS data compiled by Fathollahi et al. (Reference Fathollahi, Harford and Klasa2022).Footnote 21 We combine the three proxies into a single competition index using principal component analysis.Footnote 22 Panel B of Table 10 replicates our main tests with this index, showing that our results are robust to aggregating multiple competition dimensions.
VII. Conclusion
We examine the role of product market discipline in deterring corporate misconduct. Using a firm-specific measure of competitive pressure, we find that firms facing more serious threats are less likely to commit violations and incur lower penalties. Further analyses show that stakeholders respond negatively to violations, causing adverse effects across product, labor, and capital markets, with competition amplifying these responses. Competitive firms also tend to adopt ESG-linked executive incentives, increase safety spending, report fewer injuries, invest in green innovation, and employ credible auditors. However, competition does not appear to promote proactive, responsible corporate behavior. Overall, our findings suggest that product market threats deter misconduct by increasing the expected costs of violations.
Supplementary Material
To view supplementary material for this article, please visit http://doi.org/10.1017/S0022109026102919.
Funding Statement
Tian acknowledges financial support from the National Natural Science Foundation of China (Grant No. 72425002).
Appendix. Variable Definitions
Main Variables
- Violator
-
A dummy variable that equals 1 if a firm has one or more violations in a year, and 0 otherwise. Source: Violation Tracker.
- Penalties
-
Natural logarithm of 1 plus the total value of penalties for violations in 2010 dollars (based on the U.S. GDP deflator from the World Bank Data). Source: Violation Tracker.
- Fluidity
-
Product market fluidity, a measure of product market threats constructed by Hoberg et al. (Reference Hoberg, Phillips and Prabhala2014). Source: Hoberg-Phillips Data Library.
Alternative Measures
- Litigation
-
A dummy variable that equals 1 if a firm is mentioned as a defendant in one or more litigation filings in a year, and 0 otherwise. Source: FJC.
- No. of Litigations
-
Number of times a firm is mentioned as a defendant in litigation filings in a year. Source: FJC.
- HHI
-
Herfindahl–Hirschman Index of sales in a firm’s 3-digit SIC industry. Source: Compustat.
- HHI_TNIC3
-
Herfindahl–Hirschman Index of sales in a firm’s industry using the text-based network industry classification developed by Hoberg and Phillips (Reference Hoberg and Phillips2016). Source: Hoberg-Phillips Data Library.
Control Variables
- Size
-
Natural logarithm of TA, where TA is total book assets in millions of 2010 dollars (based on the U.S. GDP deflator from the World Bank Data). Source: Compustat.
- Leverage
-
Sum of debt in current liabilities plus long-term debts divided by total assets. Source: Compustat.
- M/B
-
Sum of total assets plus the market value of equity minus the book value of equity divided by total assets. Source: Compustat.
- PPE/TA
-
Property, plant, and equipment (PPE) scaled by total assets. Source: Compustat.
- ROA
-
Net income to total assets. Source: Compustat.
Variables Used in Further Analyses
- Tariff
-
A measure of import tariff at the 3-digit SIC industry level. For each industry year, it is calculated as duties collected by the U.S. customs divided by the free-on-board value of imports. Source: Frésard and Valta (Reference Frésard and Valta2016) and Schott (Reference Schott2008).
- Exchange rate
-
A measure of foreign exchange rate at the 3-digit SIC industry level calculated as the source-weighted average of exchange rates across all countries exporting to the United States, where the weights are the share of each exporting country in total U.S. imports for that industry in 1996. Source: IMF.
- Sales growth
-
Percentage change in sales. Source: Compustat.
- Employee productivity growth
-
Percentage change in sales per employee. Source: Compustat.
- High local competition
-
A dummy variable equal to 1 if the number of product market peers, defined using the TNIC-2 classification in the Hoberg and Phillips database, located in the same county, is above the median. Source: Hoberg-Phillips Data Library.
- Employee turnover change
-
Percentage change in employee turnover, where employee turnover is the number of forfeited employee stock options divided by the total number of outstanding stock options. Source: Compustat and ExecuComp.
- Cost of equity
-
The implied cost of equity measure captures the internal rate of return that equates a firm’s forecasted cash flows to its current stock price. Following Lee et al. (Reference Lee, So and Wang2021), it is constructed as the equal-weighted average of estimates based on i) two variants of the residual income model developed by Gebhardt, Lee, and Swaminathan (Reference Gebhardt, Lee and Swaminathan2001) and Claus and Thomas (Reference Claus and Thomas2001) and ii) two variants of the abnormal earnings model developed by Easton (Reference Easton2004) and Ohlson and Juettner-Nauroth (Reference Ohlson and Juettner-Nauroth2005) (see Appendix B.2 in Lee et al. (Reference Lee, So and Wang2021) for the details of the construction of the implied cost of capital measures). Source: Lee et al. (Reference Lee, So and Wang2021).
- ESG strength
-
Sum of modified strength scores across six domains that captures a firm’s performance in promoting responsible corporate behavior. The six domains include community, diversity, employee relations, environment, human rights, and product quality. Source: KLD.
- ESG concern
-
Sum of modified concern scores across the domains that captures the firm’s performance in avoiding harmful practices. The six domains include community, diversity, employee relations, environment, human rights, and product quality. Source: KLD.
- ESG overall
-
Difference between ESG strength and ESG concern. Source: KLD.
- ESG incentives
-
A dummy variable that equals 1 if a firm’s executive compensation contract includes ESG-related performance metrics, and 0 otherwise. Source: ISS Incentive Lab.
- Safety expenditures
-
A measure of a firm’s investments in worker safety based on estimated abnormal discretionary expenses. Source: Compustat.
- Total case rate
-
Sum of deaths and all injuries and illnesses that result in days away from work or job restrictions or transfers, and other recordable cases, divided by the number of hours worked by all employees, then multiplied by 200,000. Source: OSHA.
- Competition index
-
An index-based measure of competition using principal component analysis. Source: Compustat, Hoberg-Phillips Data Library, and Fathollahi et al. (Reference Fathollahi, Harford and Klasa2022).
- Green innovation
-
A dummy variable equal to 1 if a firm is granted any green patents within the subsequent 3 years, and 0 otherwise. Source: Kogan et al. (Reference Kogan, Papanikolaou, Seru and Stoffman2017).
- Big Four auditors
-
A dummy variable equal to 1 if a firm is audited by one of the Big Four accounting firms (Deloitte, EY, KPMG, or PwC), and 0 otherwise. Source: Compustat.