


Introduction
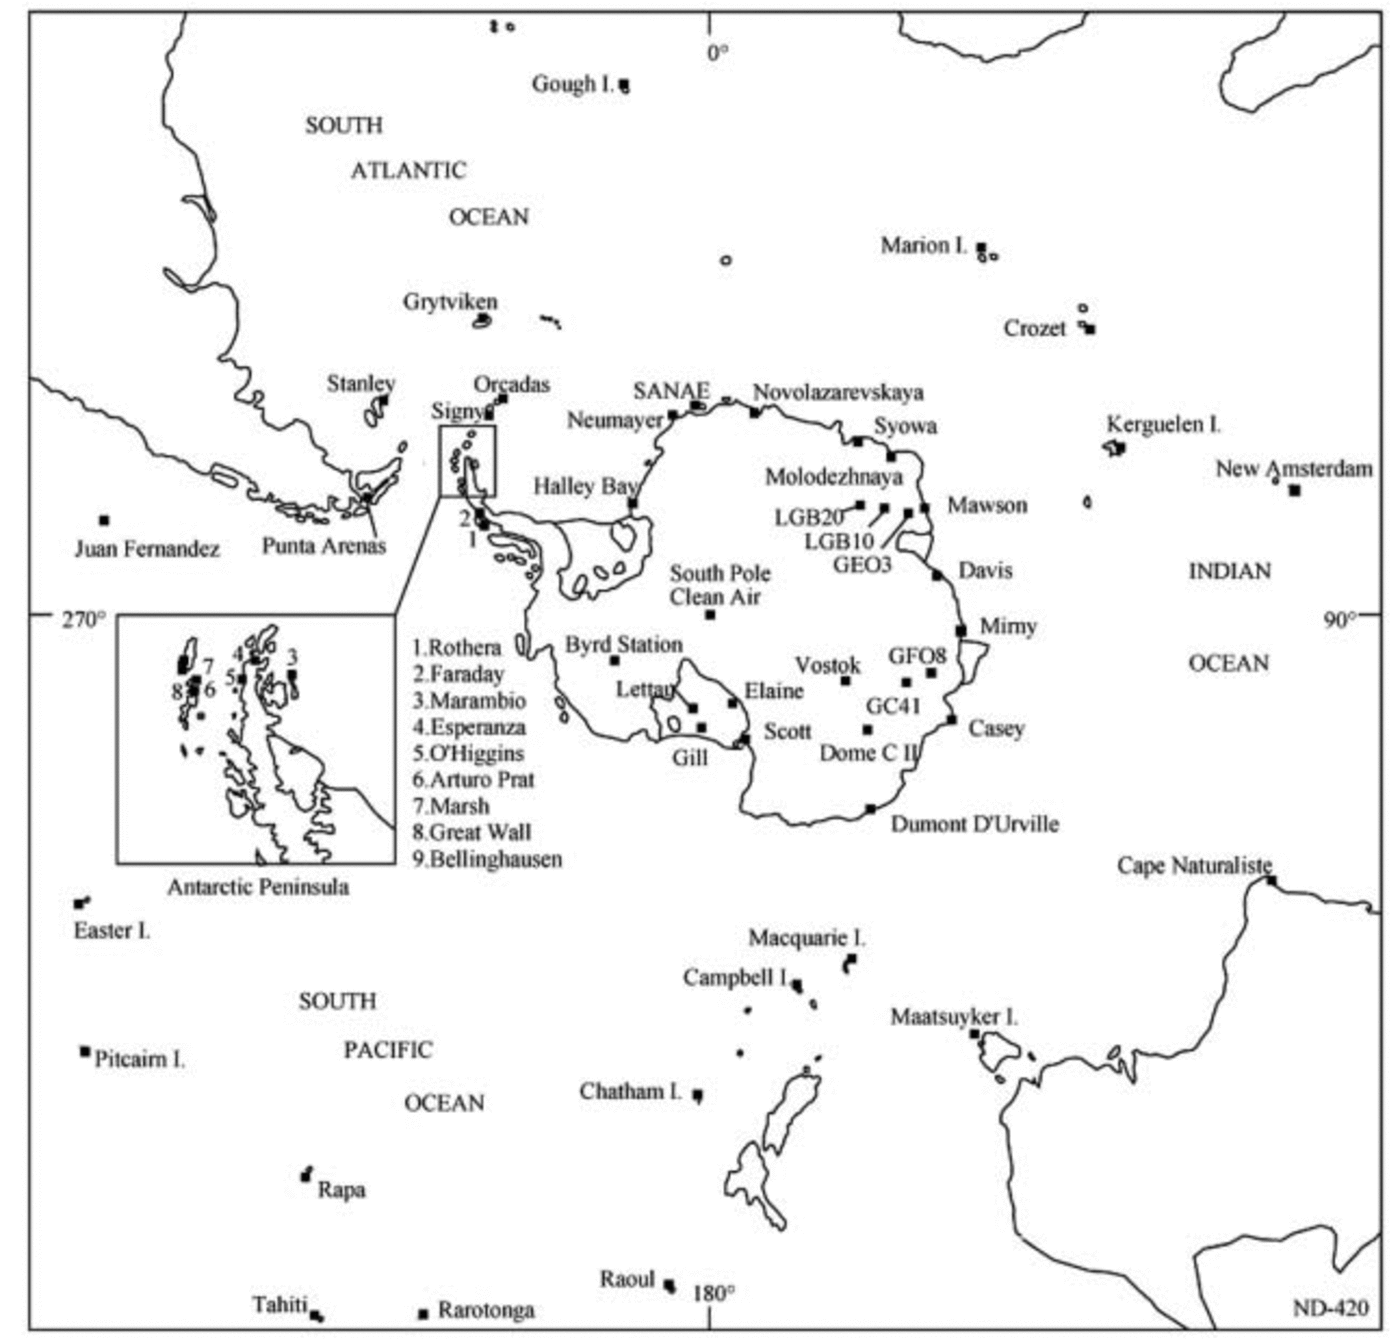
Six years have elapsed since our last assessment (Reference Jacka and BuddJacka and Budd, 1998) of the surface temperature changes at the occupied stations in Antarctica and the Southern Ocean. During those 6 years, we have seen the collapse of the Larsen Ice Shelf (Reference Rott, Skvarca and NaglerRott and others, 1996, Reference Rott, Rack, Nagler and Skvarca1998, Reference Rott, Rack, Skvarca and de Angelis2002), a realization that as much as 20–30% of the ice discharge from the Antarctic continent may be in the form of meltwater (e.g. Reference Jacobs and HellmerJacobs and others, 1996), new evidence of ice-sheet thinning in the Pine Island and Thwaites Glacier drainage basins (Reference Wingham, Ridout, Scharroo, Arthern and ShumWingham and others, 1998; Reference RignotRignot, 2001; Reference ZwallyZwally and others, 2002a), findings of a short-term increase in Antarctic sea-ice area (Reference Zwally, Comiso, Parkinson, Cavalieri and GloersenZwally and others, 2002 b) yet proxy evidence of a longer-term decrease (Reference Curran, van Ommen, Morgan, Phillips and PalmerCurran and others, 2003), and various findings of both atmospheric cooling (e.g. Reference DoranDoran and others, 2002; Reference Thompson and SolomonThompson and Solomon, 2002) and warming (e.g. Reference Vaughan, Marshall, Connolley and KingVaughan and others, 2001) over different Antarctic regions. In addition, a new Intergovernmental Panel on Climate Change (IPCC) assessment has been published (Reference HoughtonHoughton and others, 2001) including new consensus estimates of Earth’s climate. It seems appropriate and timely to reassess the data at this stage. We base this reassessment on annual mean surface temperature data from stations located at positions indicated in Figure 1, a map of the Antarctic, Southern Ocean and South Pacific Ocean region. These data are available at the Antarctic CRC (now the Antarctic Climate and Ecosystems CRC) website (http://www.antcrc.utas.edu.au/∼jacka/climate.html) and on a new website (http://www.antarctica.ac.uk/met/READER/) now available as a result of the Scientific Committee on Antarctic Research (SCAR) REference Antarctic Data for Environmental Research (READER) project (Reference TurnerTurner and others, in press). This comprehensive and up-to-date data collection includes climate data from occupied stations and automatic weather stations (AWSs) in Antarctica. It (so far) includes data from only a small number of Southern Ocean stations. In addition to the above, there have recently been comprehensive analyses of Antarctic sea-ice trends (Reference Zwally, Comiso, Parkinson, Cavalieri and GloersenZwally and others, 2002b) and changes in Antarctic temperatures from satellite as well as station data (Reference ComisoComiso, 2000).
Map of Antarctica, the Southern Ocean and South Pacific Ocean indicating positions of climate stations included in this study.
In our previous study (Reference Jacka and BuddJacka and Budd, 1998), we reported mean surface temperature warming trends (significant at the 99% level) of +1.0˚(100 a)–1 for the Southern Ocean station data over the period 1949–96, and +1.2˚C(100 a)–1 for the Antarctic station data (including coastal and inland stations with the Antarctic Peninsula grouped as one complete record) for the period 1959–96. With the addition of each new decade of temperature data, decreasing values of the standard deviation of the mean anomalies, and increasing values of the t statistic were used to demonstrate increasing confidence in the reliability of the trend estimates.
Jacka and Budd briefly examined changes in sea-ice extent. Although we found a wide distribution of trends, the mean trend over the whole Antarctic extent was near zero. The effect of the Pinatubo (Philippines) volcanic eruption on the climate record was considered. A decrease was evident in Antarctic station temperatures from 1991 to 1993, and some evidence of an increase in sea-ice extent during the 4 years immediately after the eruption was attributed to it. The importance of monitoring the ‘post-Pinatubo’ trends was emphasized. Seasonal temperature trends were also examined by Jacka and Budd. Antarctic warming trends were found to be largest in winter and smallest in autumn, while Southern Ocean trends were largest in autumn and smallest in spring and summer. Finally, the geographical distribution of the trends was examined. A warming trend was evident at every Antarctic coastal station included in the study (15 stations total), except Molodezhnaya, Mawson and Mirny. The cooling at these three stations has been attributed in earlier work (Reference Jacka, Budd, Weller, Wilson and SeverinJacka and Budd, 1991) to increased airflow from the cold interior, as indicated by the analysis of seasonal pressure anomalies (Reference Jones and LJones and Wigley, 1988). A warming trend was also exhibited at most Southern Ocean island stations while the Pacific Ocean stations (Pitcairn Island, Easter Island, Juan Fernandez and Punta Arenas) exhibited a cooling trend. For the inland Antarctic stations, Vostok showed a positive trend whereas South Pole showed a slightly negative trend.
Our task in this paper is to re-examine the updated dataset, aiming to shed further light on the above characteristics. In particular we are interested in (i) whether the same general trends to higher temperatures are continuing and, if so, at what rates and (ii) the ‘recovery’ of the effect due to the Pinatubo eruption. While we have concentrated our past studies on the coastal Antarctic stations because of the larger number available, our data have exhibited a cooling at South Pole, and others (Reference ComisoComiso, 2000; Reference DoranDoran and others, 2002; Reference Thompson and SolomonThompson and Solomon, 2002) have also reported an inland cooling trend. In this paper we examine this in further detail considering the few inland occupied stations and also data from a number of AWSs (available from the READER WWW site) with records in excess of 10 years.
Station Temperature Trends
Table 1–4 provide results of statistical calculations concerning mean annual surface temperature data for Antarctic coastal stations, inland Antarctic stations including AWSs, Antarctic Peninsula stations and Southern Ocean stations respectively. In the event that a datum for one and only one month in any particular year is missing, an annual mean temperature is estimated by assuming the long-term monthly mean temperature for the missing month. Results included in Table 1–4 are, for each station, (i) the mean,  of the individual annual temperatures, xi
, (ii) the standard deviation, s, (iii) the trend (i.e. the slope, b, of a linear regression fit through the annual mean data), (iv) the period covered by the data, and (v) the t statistic (n V 2 degrees of freedom)
Statistical calculations for East Antarctic coastal station annual surface temperature data

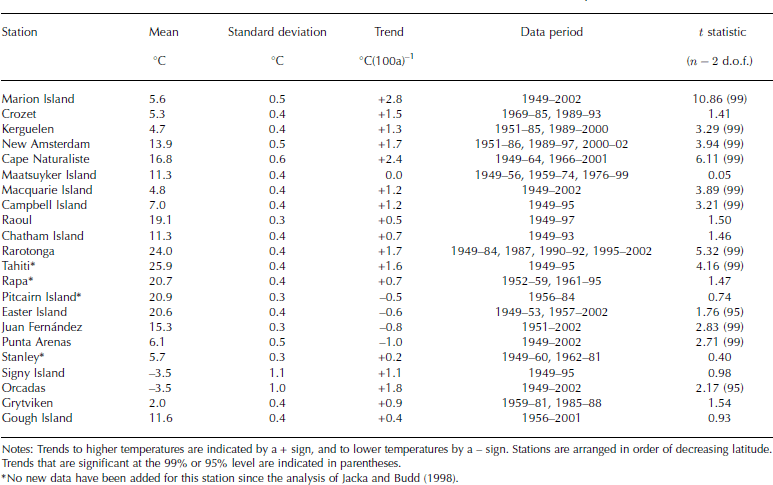
Statistical calculations for Southern Ocean and South Pacific Ocean station annual surface temperature data

where n is the number of years, yi , for which data are included. The t statistic provides an indicator of the significance of the difference of the trend from zero. Trends that are significant at the 99% or 95% level are indicated in parentheses. The data included for each station in the analyses are all the annual mean surface temperature data (up to and including 2002) available since (and including) 1959 for Antarctic stations and since 1949 for Southern Ocean stations.
Equation 1 provides an indicator of the significance for each station of the difference of the trend from zero. For the mean of the station trends we need to consider the significance of the difference from zero of the group mean, x (over all n stations), with sample standard deviation, s. For this, the t statistic required is

with (n – 1) degrees of freedom.
The results for Antarctic coastal and Southern Ocean stations are directly comparable (i.e. differences derive solely as a consequence of the addition of up to 6 years of data) with those from Reference Jacka and BuddJacka and Budd (1998).
Coastal Antarctic stations
Examination of the annual mean surface temperature data from 1959 to 2002 shows that 9 of the 12 Antarctic coastal stations examined exhibit a warming trend. Of these 9, the trends at only 2 (Novolazarevskaya and Scott Base) are significantly different from zero at the 95% confidence level. The highest warming rate indicated, at Novolazarevskaya, is 2.5˚C(100 a)–1. Three stations indicate a cooling over the study period. These are Mawson (–0.3˚C(100 a)–1), Neumayer (–0.2˚C(100 a)–1) and Halley Bay (–1.2˚C(100 a)–1). Overall, the group mean trend is 0.8˚C(100 a)–1, with standard deviation 1.1˚C(100 a)–1. This is significant at the 95% confidence limit.
The addition of up to 6 years of data for the coastal Antarctic stations has resulted in a reduction in the warming trend previously noted (Reference Jacka and BuddJacka and Budd, 1998) at many stations, and a reduction in confidence in the significance of the trends. While 6 years ago, Mawson and Molodezhnaya were the only Antarctic coastal stations to have exhibited a cooling trend, Molodezhnaya now exhibits a slight warming and Mawson is cooling to a slightly lesser degree. Neumayer exhibits a slight cooling trend, compared to a warming trend 6 years ago. The most dramatic change, however, is at Halley Bay where, in a period of 6 years, a 0.9˚C(100 a)–1 warming trend has turned to a 1.2˚C(100 a)–1 cooling. This is primarily a result of the high variability in the annual mean temperature records of the Antarctic coastal stations. The overall effect on the long-term consideration of the temperature trends brought about by the addition of 6 further years of data seems to be to reduce the spread of the trends. There is a tendency for the higher warming rates previously evident to have reduced. Thus while the mean of the warming trends has decreased, so has the standard deviation of the mean.
Inland Antarctic stations
Other than inclusion of the longer-term stations, Amundsen–Scott (South Pole) and Vostok, in data tables, our previous examinations of the temperature changes in the Antarctic region have not considered inland stations. Some recent publications, however, (e.g. Reference DoranDoran and others, 2002) have provided evidence for inland Antarctic cooling. In this analysis we therefore include the occupied stations, Amundsen–Scott and Vostok, as well as Byrd Station (no longer occupied) and a selection of AWSs. AWSs selected are all those for which there are at least 10 years of data on the READER website, and which are located at least 50km from the coast. We note that trends from AWS records need to be treated with caution since the integrity of the sites (e.g. height of sensors above the snow surface) cannot be guaranteed with the same reliability as for occupied stations. The AWS ‘Clean Air’ is located at the South Pole. For this station, direct comparison is possible with the occupied station data over the overlapping time period. Data from the AWS at Byrd Station should be compatible to extend the occupied Byrd Station data. We have not yet included this extension, but treat the two datasets separately. The average operating period for the 11 selected AWSs is just 13.3 years, and the climate information we can derive over this very short period must be treated very carefully. Over the longer period, we have Amundsen–Scott Station and Vostok. But with only two stations within the inland of the entire Antarctic continent, the spatial coverage is extremely limiting.
Notwithstanding these limitations, we note from Table 2 that 8 of the 14 inland stations selected exhibit a warming trend (2 of these significant at 95%). While the variability is high, generally the warming trends are higher than the cooling trends. At South Pole the longer-term occupied station temperature trend is a cooling of 1.0˚C(100 a)–1, yet the neighbouring Clean Air AWS, for the most recent 15 years, shows a warming of 8.4˚C(100 a)–1. If we consider only the past 15 years of Amundsen–Scott station data, we obtain no trend. It is difficult to reconcile this disparity between the results for the two South Pole stations, and we can account for it only in terms of the very large annual variability over the still relatively short period of operation. This also reinforces the note of caution needed for the interpretation of the AWS data.
Statistical calculations for inland Antarctic station annual surface temperature data

Trends that are significant at the 99% or 95% level are indicated in parentheses.
The Lambert Glacier basin (LGB) AWSs indicate a cooling of 1.5˚C(100 a)–1 at one station yet a warming of 8.9˚C(100 a)–1 at another. Other inland stations in Mac. Robertson Land and Wilkes Land (the GE, GF and GC AWSs) indicate a warming trend. At Dome C a cooling of 7.0˚C(100 a)–1 is indicated. The longer-term record at Vostok indicates a warming trend of 0.6˚C(100 a)–1. While these two stations are ∼700km apart, both stations are on the high cold Antarctic Plateau where consistency in climate variability might be expected, and if we consider only the most recent 15 years of the Vostok record, we do obtain a cooling of 5.7˚C(100 a)–1.
Our initial analysis included three Ross Ice Shelf AWSs, Elaine (14.4˚C(100 a)–1), Gill (–4.4˚C(100 a)–1) and Lettau (+2.6˚C(100 a)–1). The Elaine warming rate is very high and not compatible with the rates found at the nearby stations.
We have carried out an analysis of the inland station data including Amundsen–Scott Station for the most recent 15 years only but not the Clean Air AWS; including Vostok for the most recent 15 years only; excluding Elaine AWS; and including the Byrd AWS but not Byrd Station. All other station data remained as included in Table 2. This analysis yields a mean warming trend of 1.0˚C(100 a)–1 with a very large standard deviation, 4.6˚C(100 a)–1. In summary for the inland continental stations, the variability is still too high for any clear conclusion to be drawn regarding the direction of any trend in annual mean temperature. It is clear that more time is required, and many more AWSs are required, distributed across the entire Antarctic continent.
Nevertheless it is recommended that such a network of continuing AWS sites will prove valuable in the future to obtain more robust long-term trends over inland Antarctica.
Antarctic Peninsula stations
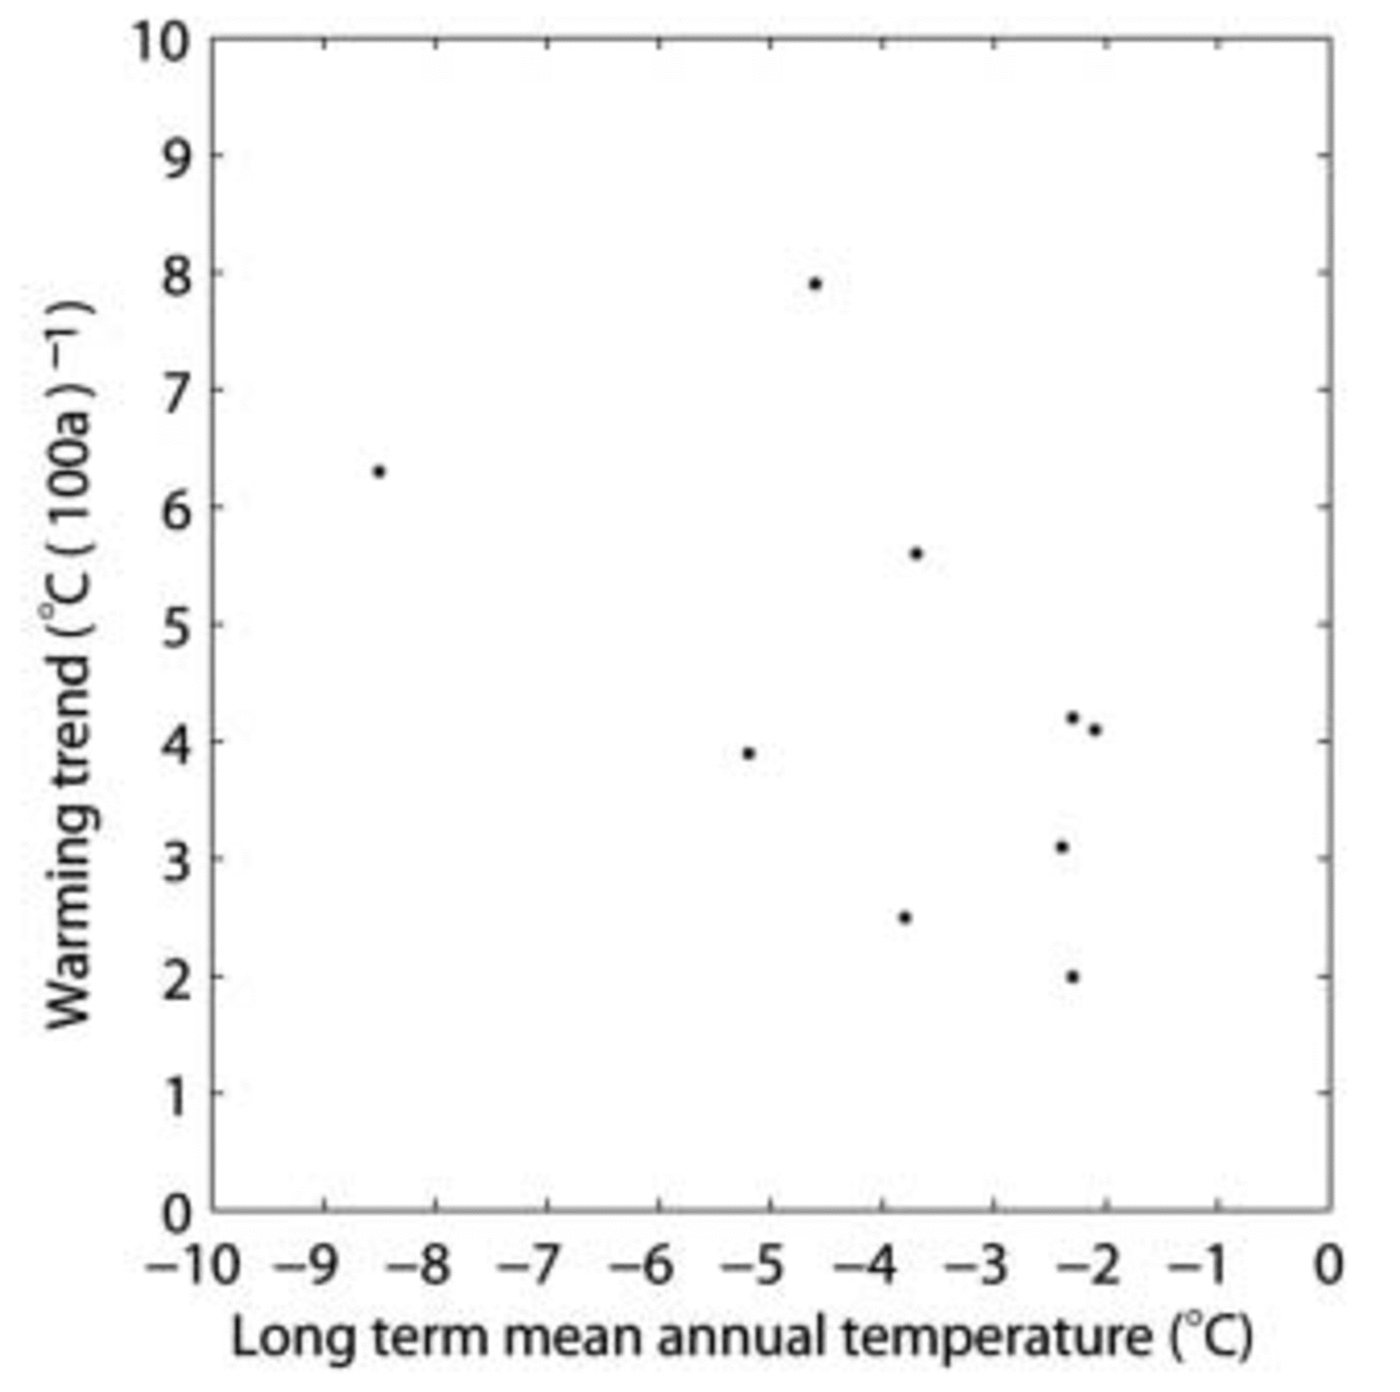
The strong warming trend reported by several researchers (e.g. Reference King and HarangozoKing and Harangozo, 1998; Reference Vaughan, Marshall, Connolley and KingVaughan and others, 2001) is evident in this analysis of the Antarctic Peninsula stations, with a group mean warming of 4.4˚C(100 a)–1, standard deviation of 1.9˚C(100 a)–1 and significant at 99%. Every station included in the analysis exhibits a warming trend, five of them significant at 99% and two significant at 95%. Notice also in Table 3 that the warming trend is greatest for the more southerly (i.e. colder) stations and that there is a clear trend to lower warming rates at the more northerly (i.e. warmer) stations. We show this in Figure 2, a plot of the warming trend as a function of the long-term mean annual temperature for each of the Peninsula stations.
Statistical calculations for Antarctic Peninsula station annual surface temperature data

Plot of the warming trend at stations on the Antarctic Peninsula, as a function of long-term mean annual temperature.
It is also notable that the regions showing the largest areas with downward trends in sea-ice cover were on the western side of the Antarctic Peninsula and in the Amundsen and Bellingshausen Seas (Reference ComisoComiso, 2000; Reference ZwallyZwally and others, 2002a, Reference Zwally, Comiso, Parkinson, Cavalieri and Gloersenb).
Southern Ocean stations
A warming trend is indicated at all Southern Ocean/South Pacific Ocean stations (significant at 99% at eight stations) except Pitcairn Island (no new data), Easter Island, Juan Fernández and Punta Arenas (i.e. the islands of the southeast Pacific). While the mean trend for the entire Southern Ocean/South Pacific Ocean dataset is a warming of 0.9˚C(100 a)–1, with standard deviation of 1.0˚C(100 a)–1 and significant at 99%, the mean cooling trend in the southeast Pacific, 0.7˚C(100 a)–1, is also significant at 99%. Compared with the data at Antarctic stations, the ocean island station data exhibit very little variability. Except for the two coldest (polar) stations, Signy Island and Orcadas, the standard deviation of the annual mean temperatures is 0.3–0.5˚C for every station.
While the trend calculations for the Southern Ocean island stations indicate a very similar pattern to those of Reference Jacka and BuddJacka and Budd (1998), the addition of up to 6 years of data has resulted in a slight reduction in the mean warming rate, from 1.0 to 0.9˚C(100 a)–1, along with a reduction in the standard deviation from 1.2 to 1.0˚C(100 a)–1.
Trends of the Mean Anomaly Data
Figure 3 shows the time series of the means across all stations within the different groupings, of the annual temperature anomalies. For each station, the annual temperature anomaly is calculated by subtracting the annual mean temperature from the mean over the total record available.Table 5 summarizes the statistics calculated from these anomaly data, along with the calculations discussed in the previous section. Following the concept developed by Reference Jacka, Budd, Weller, Wilson and SeverinJacka and Budd (1991, Reference Jacka and Budd1998), the data for the coastal Antarctic and Southern Ocean/South Pacific Ocean stations are presented for different time periods, increasing by 10 years with each step until 1988, then a step till 1996 and now, 2002. Thus, only the last column in each table is different from Table 3 of Reference Jacka and BuddJacka and Budd (1998).
Time series of the annual surface temperature anomaly from the long-term mean, averaged across stations in (a) the Antarctic coastal grouping, (b) the inland Antarctic, (c) the Antarctic Peninsula and (d) the Southern Ocean/Pacific Ocean. Note that prior to 1980 the inland Antarctic plot depends on data from, at best, three stations, Amundsen–Scott, Vostok and Byrd Station.

Changes in mean annual temperature trend (°C(100 a)–1) over time, as indicated by slopes of regression lines through annual mean anomaly data, and by means and standard deviations of the slopes through individual station data

For the Antarctic coastal and Peninsula stations and the ocean stations, the trends of the mean anomalies are similar to the means of the station trends. In addition, it seems that the trends may be asymptotic with time, to a value of ∼0.7–0.9˚C(100 a)–1 for both the Antarctic coastal stations and the Southern Ocean stations. Similarly the standard deviations of the annual mean temperatures for both sets of data have reduced with time to ∼1.0˚C(100 a)–1. This result for the Southern Ocean, however, is more robust than for the Antarctic coastal stations. The number of Antarctic coastal stations is smaller and the variability of the annual mean temperatures is greater. This contributes to the lower confidence limit applying to the Antarctic coastal result.
The plots of annual anomalies from the long-term means (Fig. 3) indicate some interesting patterns. Figure 3, the plot of Antarctic coastal temperature anomalies, seems to indicate an oscillation with period ∼3–4 years. This is also evident in Figure 3, and comparison of these two figures indicates the pattern of variability from the inland Antarctic stations is very similar to that for the coastal stations, at least since ∼1985, i.e. since the advent of any significant coverage by AWS.
While not the case for every year, there is strong evidence on a year-to-year basis of an anticorrelation between the Antarctic coastal temperature anomalies (noting that all coastal stations included in the study are from East Antarctica) and the Antarctic Peninsula anomalies (cf. Reference King and ComisoKing and Comiso, 2003). A notable exception to this rule is 1996, the year in which all curves indicate ‘recovery’ from the Pinatubo eruption. Variability in the Southern Ocean/South Pacific Ocean temperature anomalies (which is much smaller than for the polar anomalies) seems well correlated with the Antarctic Peninsula anomalies, and correspondingly is anticorrelated with the inland and coastal East Antarctic temperature anomalies.
Recovery of the Pinatubo Effect
Reference Jacka and BuddJacka and Budd (1998), along with several others (e.g. Reference Houghton, Meira Filho, Callander, Harris, Kattenberg and MaskellHoughton and others, 1996), attributed a decrease in the warming trend for the Antarctic station temperature data, beginning in 1991 and lasting for about 4 years, to the Pinatubo eruption. Jacka and Budd underlined the importance of monitoring the trends in climate parameters ‘post-Pinatubo’. The three warmest years indicated by the coastal and inland Antarctic temperature records are 1980, 1991 and 1996. The intervening year, 1993, was close to the coldest on record in East Antarctica. The data do indicate a period of lower temperatures in the post-Pinatubo period, 1991–96. They also seem to indicate that temperatures had recovered by 1996. However, since 1996, temperatures have reduced again to a period of three very cold years, and finally another warm year in 2002.
The Antarctic Peninsula and Southern Ocean temperature anomalies both indicate a longer period of lower temperatures between peaks in 1989 (the warmest year in the record, and prior to the eruption) and 1999 (both low-temperature years in the Antarctic). While 1992 and 1995 were cold, 1993, the coldest year in Antarctica, was warmer in the peninsula and islands.
Conclusions
For the Antarctic coastal stations, the trend of the mean anomalies indicates a warming of 0.9˚C(100 a)–1. This value is very similar to the mean of the station trends (0.8˚C(100 a)–1). The means and standard deviations of the station trends have consistently decreased as further years have been added to the series. These factors all add to the confidence we can place in the overall trend. Yet, the addition of the past 6 years of data has resulted in a reduction in the confidence level of the hypothesis that the trend is significantly different from zero.
For the Antarctic inland stations, the trend of the mean anomalies for the period 1985–2002, the longest period for which any measure of sufficient data exists, is 0.0˚C(100 a)–1. This compares with a mean of the station trends of 1.0˚C(100 a)–1. There is an urgent requirement for more data on spatial and temporal scales before realistic conclusions can be drawn concerning the trends within inland Antarctica.
The trend to a significant warming in the Antarctic Peninsula area has been well documented in past studies, and it is clearly evident again in this study. The trend of the mean anomalies is identical to the mean of the station trends (4.4˚C(100 a)–1), with standard deviation 1.9˚C(100 a)–1. This result is significant at 99%.
For the Southern Ocean stations, the trend of the mean anomalies is 0.7˚C(100 a)–1 (cf. 0.9˚C(100 a)–1 for the mean of the station trends). Annual variability for the Southern Ocean stations is small compared to the polar stations, and this warming trend (significant at 99%) has been consistent for more than two decades. It needs to be noted also that the temperature data from the four southeast Pacific stations show a cooling trend significant at 99%.
In the future it may be possible to obtain more complete coverage from the continuing satellite data, but it will nevertheless still be important to keep the monitoring at occupied and automatic weather stations going to confirm the long-term trends developing.
Acknowledgements
We thank J. Turner and colleagues at the British Antarctic Survey for excellent work in establishing and maintaining SCAR READER and for making it available through the website. We also thank all the climatologists who have provided station data directly to us for inclusion in our dataset. Special thanks are due to P. Pettre at Météo-France, C. de Villiers at the South African Weather Service, J. Carrasco Cerda at Dirección Meteórólógica de Chile, and A. Penney at the National Institute of Water and Atmospheric Research, New Zealand.



