1 Introduction
Shocks are a fundamental process of kinetic energy dissipation in space and astrophysical plasmas. Many astrophysical objects generate high Mach number flows which interact with ambient media or planetary obstacles to generate strongly radiating plasma shocks. Some examples include extragalactic and relativistic jets from radio galaxies (Miley Reference Miley1980; Smith & Norman Reference Smith and Norman1981; Duncan & Hughes Reference Duncan and Hughes1994; Choi, Wiita & Ryu Reference Choi, Wiita and Ryu2007), Herbig–Haro jets from young stellar objects (known as YSOs) (Hartigan, Raymond & Meaburn Reference Hartigan, Raymond and Meaburn1990; Smith, Khanzadyan & Davis Reference Smith, Khanzadyan and Davis2003; Smith Reference Smith2012) and shocks in core-collapse supernovae and supernova remnants (Chevalier Reference Chevalier1982; Kifonidis et al. Reference Kifonidis, Plewa, Janka and Müller2003). Many astrophysical environments also contain dynamically significant magnetic fields, that result in the formation of magnetized plasma shocks which exhibit physics not found in unmagnetized hydrodynamic shocks (De Sterck, Low & Poedts Reference De Sterck, Low and Poedts1998; Dursi & Pfrommer Reference Dursi and Pfrommer2008).
A large majority of astrophysical shocks, such as the ones described above, are examples of collisionless shocks. These are shocks in which dispersive two-fluid effects, as opposed to collisional dissipation, facilitate the transition at the shock front (Kennel et al. Reference Kennel, Edmiston and Hada1985). In some astrophysical shocks, however, collisional effects dominate. A well-known category of magnetized collisional shocks is the C-type shock in weakly ionized interstellar plasmas and molecular clouds (Mullan Reference Mullan1971; Draine Reference Draine1980; Draine, Roberge & Dalgarno Reference Draine, Roberge and Dalgarno1983); here, the shock transition at the collisional shock front is preceded by a magnetic precursor that modifies the conditions upstream of the shock (Draine Reference Draine1980). Furthermore, as argued by Lebedev, Frank & Ryutov (Reference Lebedev, Frank and Ryutov2019), even in collisionless astrophysical shocks, the properties of which ‘are somewhat different from the “canonical” collisional shocks […], the global structure of the flow will still be similar to that occurring in a collisional medium’ (Lebedev et al. Reference Lebedev, Frank and Ryutov2019). In some canonically collisionless plasmas, such as the solar wind, nonlinear relaxation processes can make the effective mean free path (MFP) ${\sim }1000 \times$ smaller that the collisional MFP, resulting in magnetized fluid-like behaviour at scales above the ion gyroradius (Coburn, Chen & Squire Reference Coburn, Chen and Squire2022). These examples underscore the astrophysical relevance of collisional shocks. Finally, collisional shocks are also of significant interest in the rapidly growing field of magneto-inertial confinement fusion, where shocks propagate in collision-dominated magnetized plasmas (Walsh et al. Reference Walsh, O'Neill, Chittenden, Crilly, Appelbe, Strozzi, Ho, Sio, Pollock and Divol2022).
Laboratory astrophysics experiments at high-energy-density-plasma (HEDP) facilities have provided key insight into the physics of plasma shocks (Remington, Drake & Ryutov Reference Remington, Drake and Ryutov2006; Lebedev et al. Reference Lebedev, Frank and Ryutov2019). Laser plasma experiments have been used extensively to study physics relevant to astrophysical shocks, such as the evolution of hydrodynamic shock instabilities (Remington et al. Reference Remington, Kane, Drake, Glendinning, Estabrook, London, Castor, Wallace, Arnett and Liang1997; Kane et al. Reference Kane, Arnett, Remington, Glendinning, Bazan, Drake, Fryxell, Teyssier and Moore1999), and the interaction of shocks and jets with low-density ambient media (Drake et al. Reference Drake, Glendinning, Estabrook, Remington, McCray, Wallace, Suter, Smith, Carroll and London1998; Robey et al. Reference Robey, Perry, Klein, Kane, Greenough and Boehly2002; Foster et al. Reference Foster, Wilde, Rosen, Williams, Blue, Coker, Drake, Frank, Keiter and Khokhlov2005). More recent experiments have investigated the formation of magnetized shocks generated from the interaction of laser-driven plasma pistons in the presence of externally applied magnetic fields (Schaeffer et al. Reference Schaeffer, Everson, Bondarenko, Clark, Constantin, Winske, Gekelman and Niemann2015, Reference Schaeffer, Fox, Haberberger, Fiksel, Bhattacharjee, Barnak, Hu and Germaschewski2017; Liao et al. Reference Liao, Hartigan, Fiksel, Blue, Graham, Foster and Kuranz2018; Levesque et al. Reference Levesque, Liao, Hartigan, Young, Trantham, Klein, Gray, Manuel, Fiksel and Katz2022; Schaeffer et al. Reference Schaeffer, Cruz, Dorst, Cruz, Heuer, Constantin, Pribyl, Niemann, Silva and Bhattacharjee2022).
Laser-driven magnetized shock experiments have typically focused on the study of collisionless shocks (Schaeffer et al. Reference Schaeffer, Everson, Bondarenko, Clark, Constantin, Winske, Gekelman and Niemann2015, Reference Schaeffer, Fox, Haberberger, Fiksel, Bhattacharjee, Barnak, Hu and Germaschewski2017, Reference Schaeffer, Cruz, Dorst, Cruz, Heuer, Constantin, Pribyl, Niemann, Silva and Bhattacharjee2022). In contrast, pulsed-power-driven plasmas can be used to generate magnetized shocks in the highly collisional regime. Pulsed-power machines generate plasma by applying a large current (${\sim }1\unicode{x2013}30$ MA) to a load, typically an array of thin wires, over a short time (${\sim }100\unicode{x2013}300\ {\rm ns}$
 ). The ablation of plasma from wire arrays generates highly collisional ($\lambda _{{\rm ii}}/L \ll 1$
 ), supersonic and super-Alfvénic upstream flows with frozen-in magnetic flux ($R_M \equiv VL/\bar {\eta } \gg 1$
 ) (Burdiak et al. Reference Burdiak, Lebedev, Bland, Clayson, Hare, Suttle, Suzuki-Vidal, Garcia, Chittenden and Bott-Suzuki2017; Hare et al. Reference Hare, Suttle, Lebedev, Loureiro, Ciardi, Chittenden, Clayson, Eardley, Garcia and Halliday2018; Suttle et al. Reference Suttle, Burdiak, Cheung, Clayson, Halliday, Hare, Rusli, Russell, Tubman and Ciardi2019). Here, $\lambda _{{\rm ii}}$
 is the ion–ion MFP, $L$
 is the characteristic size of the plasma, $V$
 is the characteristic bulk flow velocity and $\bar {\eta }$
 is the magnetic diffusivity. Pulsed-power has been used extensively to study physics relevant to supersonic astrophysical jets, such as the interaction of plasma jets with neutral gases (Suzuki-Vidal et al. Reference Suzuki-Vidal, Lebedev, Krishnan, Bocchi, Skidmore, Swadling, Harvey-Thompson, Burdiak, de Grouchy and Pickworth2012, Reference Suzuki-Vidal, Lebedev, Krishnan, Skidmore, Swadling, Bocchi, Harvey-Thompson, Patankar, Burdiak and de Grouchy2013), the fragmentation of radiatively cooled bow shocks in counter-propagating jets (Suzuki-Vidal et al. Reference Suzuki-Vidal, Lebedev, Ciardi, Pickworth, Rodriguez, Gil, Espinosa, Hartigan, Swadling and Skidmore2015), and the structure of magnetized oblique shocks (Swadling et al. Reference Swadling, Lebedev, Niasse, Chittenden, Hall, Suzuki-Vidal, Burdiak, Harvey-Thompson, Bland and De Grouchy2013), planar shocks (Lebedev et al. Reference Lebedev, Suttle, Swadling, Bennett, Bland, Burdiak, Burgess, Chittenden, Ciardi and Clemens2014) and quasi-two-dimensional (quasi-2-D) bow shocks (Ampleford et al. Reference Ampleford, Jennings, Hall, Lebedev, Bland, Bott, Suzuki-Vidal, Palmer, Chittenden and Cuneo2010; Bott-Suzuki et al. Reference Bott-Suzuki, Caballero Bendixsen, Cordaro, Blesener, Hoyt, Cahill, Kusse, Hammer, Gourdain and Seyler2015; Burdiak et al. Reference Burdiak, Lebedev, Bland, Clayson, Hare, Suttle, Suzuki-Vidal, Garcia, Chittenden and Bott-Suzuki2017).
Previous experimental work on collisional shocks has shown that magnetic fields can modify the structure of collisional plasma shocks in two primary ways – either via the generation of magnetohydrodynamic (MHD) shocks, (Lebedev et al. Reference Lebedev, Suttle, Swadling, Bennett, Bland, Burdiak, Burgess, Chittenden, Ciardi and Clemens2014; Russell et al. Reference Russell, Burdiak, Carroll-Nellenback, Halliday, Hare, Merlini, Suttle, Valenzuela-Villaseca, Eardley and Fullalove2022) or via magnetic flux pile-up (Burdiak et al. Reference Burdiak, Lebedev, Bland, Clayson, Hare, Suttle, Suzuki-Vidal, Garcia, Chittenden and Bott-Suzuki2017; Suttle et al. Reference Suttle, Burdiak, Cheung, Clayson, Halliday, Hare, Rusli, Russell, Tubman and Ciardi2019). In MHD shocks, the magnetic field can change discontinuously across the shock front, resulting in complicated anisotropic shock structures, whose morphology depends not only on the velocity of the upstream flow relative to the three MHD wave speeds (fast, slow and Alfvén waves), but also on the orientation of the upstream magnetic field relative to the shock front (De Sterck et al. Reference De Sterck, Low and Poedts1998; De Sterck & Poedts Reference De Sterck and Poedts2000; Verigin et al. Reference Verigin, Kotova, Szabo, Slavin, Gombosi, Kabin, Shugaev and Kalinchenko2001; Goedbloed, Keppens & Poedts Reference Goedbloed, Keppens and Poedts2010). Recent experiments have also investigated the role of resistive dissipation in MHD shock transitions through the formation of subcritical collisional shocks (Russell et al. Reference Russell, Burdiak, Carroll-Nellenback, Halliday, Hare, Merlini, Suttle, Valenzuela-Villaseca, Eardley and Fullalove2022).
A second effect that can modify the structure of shocks in magnetized plasmas is magnetic flux pile-up (Dursi & Pfrommer Reference Dursi and Pfrommer2008). Magnetic field lines advected by the plasma accumulate and drape around conducting obstacles. The draping of field lines around cylindrical obstacles has been shown to modify the structure of quasi-2-D bow shocks, resulting in wider shocks with a larger stand-off distance when the obstacle axis is oriented perpendicular to the field, than when it is parallel to the field (Burdiak et al. Reference Burdiak, Lebedev, Bland, Clayson, Hare, Suttle, Suzuki-Vidal, Garcia, Chittenden and Bott-Suzuki2017). Although quasi-one-dimensional (quasi-1-D) and quasi-2-D shocks in magnetized plasmas (where the transition occurs in one or two dimensions only) have been examined extensively, full three-dimensional (3-D) shocks in magnetized pulsed-power-driven plasmas have received less attention. The 3-D shocks are interesting because most naturally occurring obstacles (e.g. planets) are 3-D. Moreover, in magnetized systems, the orientation of the shock front relative to the field will change along the shock, which can lead to interesting physics not found in 1-D or 2-D shocks.
In this paper, we show that bow shocks around small 3-D obstacles in a supersonic ($M_S = V_{\text {flow}}/C_S \sim 7$ ) and superfast magnetosonic ($M_{{\rm FMS}} = V_{\text {flow}}/V_{{\rm FMS}} > 1$
 ) plasma exhibit a fully 3-D structure, with a larger shock opening angle in the plane parallel to magnetic field, than in the plane normal to the field. At large length scales, comparable to the size of the plasma, magnetic flux is frozen into the flow ($R_M \gg 1$
 ); however, at length scales comparable to the resistive diffusion length $l_\eta$
 ($R_M \sim 1$
 ), the magnetic field decouples from the plasma. For obstacles of size comparable to the resistive diffusion length, the breaking of frozen-in flux due to resistive diffusion results in hydrodynamic bow shocks, where the magnetic field remains continuous across the shock front. Therefore, even in collisional magnetized plasmas, the shock transition can be purely hydrodynamic, with no discontinuity in the magnetic field. The implications of this effect are important for the partition of dissipated kinetic energy at shock fronts. Whereas both the magnetic field and the plasma can be compressed in MHD shocks, only the plasma is compressed in hydrodynamic shocks, leading to high postshock thermal pressure, and no change in the magnetic field vector. Furthermore, the shock shape and the magnitude of the jumps across the shock front in hydrodynamic shocks are governed solely by the sonic Mach number, while in MHD shocks, this depends on both the sonic and Alfvén Mach numbers, as well as on the orientation of the magnetic field.
An inductive probe is used as the obstacle in this paper. The probe not only serves as the obstacle which generates the 3-D bow shock (the target of our study), it also provides localized measurements of the magnetic field and flow velocity. Thus, the probe provides more information about the plasma than a passive obstacle. Although inductive probes are widely used in HEDP experiments, (Everson et al. Reference Everson, Pribyl, Constantin, Zylstra, Schaeffer, Kugland and Niemann2009; Suttle et al. Reference Suttle, Burdiak, Cheung, Clayson, Halliday, Hare, Rusli, Russell, Tubman and Ciardi2019; Pilgram et al. Reference Pilgram, Adams, Constantin, Heuer, Ghazaryan, Kaloyan, Dorst, Schaeffer, Tzeferacos and Niemann2022) their perturbative nature leads to questions about how reliably they can reconstruct the magnetic field in plasma flows. These experiments additionally tackle this question by careful comparison between numerical simulations and experimental data. A simple way to quantify the perturbative effect of a probe is to calculate $L_\text {probe}/L_\text {plasma}$ , where $L_\text {probe}$
 is the probe size, and $L_\text {plasma}$
 is the characteristic plasma size. In previous HEDP experiments, values of $L_\text {probe}/L_\text {plasma}$
 range from ${\sim }0.1$
 (Suttle et al. Reference Suttle, Burdiak, Cheung, Clayson, Halliday, Hare, Rusli, Russell, Tubman and Ciardi2019; Pilgram et al. Reference Pilgram, Adams, Constantin, Heuer, Ghazaryan, Kaloyan, Dorst, Schaeffer, Tzeferacos and Niemann2022), to $\sim 0.05$
 (Everson et al. Reference Everson, Pribyl, Constantin, Zylstra, Schaeffer, Kugland and Niemann2009). In this paper, we use an inductive probe with a $L_\text {probe}/L_\text {plasma} \sim 1\ {\rm mm}/5\ {\rm mm} \sim 0.2$
 .
2 Experimental and diagnostic set-up
2.1 Load hardware
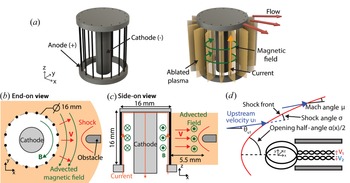
Figure 1 illustrates the load and the experimental set-up. The load consists of a cylindrical array of 16 equally spaced, ${30}\ {\mathrm {\mu }}{\rm m}$ diameter aluminium wires (California Wire Company) positioned around a central 5 mm diameter stainless steel cathode. The array diameter and the array height are both 16 mm. The current pulse (1.4 MA peak current, 240 ns rise time) is generated using the MAGPIE machine at Imperial College London (Mitchell et al. Reference Mitchell, Bayley, Chittenden, Worley, Dangor, Haines and Choi1996).
(a) Three-dimensional representation of an exploding wire array. (b) End-on ($x$ –$y$
 plane) view of the experimental geometry, showing a cylindrical array of 16 equally spaced ${30}\ {\mathrm {\mu }}{\rm m}$
 Al wires around a central cathode. An inductive probe serves as the obstacle and is placed ${\sim }5.5$
 mm from the array surface. (c) Side-on ($xz$
 -plane) view of the experimental geometry. (d) Schematic showing bow shock geometry observed ahead of the inductive probe in the end-on view. The shock front is represented by the red solid line.

When current flows through the wires, the wires heat up resistively, and the wire material vaporizes and ionizes to create low-density coronal plasma surrounding the dense wire cores. The current, which travels along the wires, is mostly concentrated within a thin skin region containing the coronal plasma immediately around the stationary wire cores. The global magnetic field points azimuthally inside the array, and rapidly drops to zero outside the array (Velikovich, Sokolov & Esaulov Reference Velikovich, Sokolov and Esaulov2002). The global ${\boldsymbol {j} \times \boldsymbol {B}}$ force, therefore, accelerates the coronal plasma radially outwards, and the ablated plasma streams supersonically into the vacuum region outside the array.
The magnetic Reynolds number, calculated with the characteristic experimental length scale $L \sim {1}\ {\rm cm}$ , is large, $R_M \sim 10-100$
 (Suttle et al. Reference Suttle, Burdiak, Cheung, Clayson, Halliday, Hare, Rusli, Russell, Tubman and Ciardi2019), so magnetic flux is frozen into the flow, and the ablating plasma advects part of the global field with it. The ion–ion MFP of the ablating plasma is also small ($\lambda _{{\rm ii}} \sim 10^{-3}\ {\rm mm}$
 ), so the plasma is highly collisional (Suttle et al. Reference Suttle, Burdiak, Cheung, Clayson, Halliday, Hare, Rusli, Russell, Tubman and Ciardi2019). The flow velocity in similar set-ups is typically supersonic ($M_S \sim 3 -5$
 ), super-Alfvénic ($M_A \sim 2$
 ) and superfast magnetosonic ($M_{{\rm FMS}} \sim 2$
 ) (Burdiak et al. Reference Burdiak, Lebedev, Bland, Clayson, Hare, Suttle, Suzuki-Vidal, Garcia, Chittenden and Bott-Suzuki2017; Russell et al. Reference Russell, Burdiak, Carroll-Nellenback, Halliday, Hare, Merlini, Suttle, Valenzuela-Villaseca, Eardley and Fullalove2022). The collision of these supersonic outflows with the obstacle generates a detached bow shock. The adiabatic index of the plasma (ratio of specific heats) is an important quantity that affects the shock physics. In HEDPs, contributions to internal energy and pressure due to Coulomb interactions, ionization and excitation processes can make the effective adiabatic index lower than that of an ideal gas ($\gamma _{\text {ideal}} = 5/3$
 ). In HEDPs with characteristic electron density $n_e \sim 1 \times 10^{18}\ {\rm cm}^{-3}$
 and electron temperature $T_e \sim 10$
 eV, the typical value of $\gamma _\text {eff} \sim 1.1-1.2$
 (Drake Reference Drake2013; Swadling et al. Reference Swadling, Lebedev, Niasse, Chittenden, Hall, Suzuki-Vidal, Burdiak, Harvey-Thompson, Bland and De Grouchy2013).
2.2 Diagnostic set-up
In contrast to previous experimental work (Lebedev et al. Reference Lebedev, Suttle, Swadling, Bennett, Bland, Burdiak, Burgess, Chittenden, Ciardi and Clemens2014; Burdiak et al. Reference Burdiak, Lebedev, Bland, Clayson, Hare, Suttle, Suzuki-Vidal, Garcia, Chittenden and Bott-Suzuki2017; Suttle et al. Reference Suttle, Burdiak, Cheung, Clayson, Halliday, Hare, Rusli, Russell, Tubman and Ciardi2019; Russell et al. Reference Russell, Burdiak, Carroll-Nellenback, Halliday, Hare, Merlini, Suttle, Valenzuela-Villaseca, Eardley and Fullalove2022), an inductive (‘b-dot’) probe serves as the obstacle, and is positioned $5.6 \pm {0.3}\ {\rm mm}$ from the wires. In addition to generating the bow shock, the probe also measures the advected magnetic field. The probe consists of two ${\sim } {0.5}\ {\rm mm}$
 diameter loops of oppositely wound single-turn enamel-coated copper wire, threaded through a $\sim 1$
 mm diameter thin-walled steel tube. The voltage response of the probe can have two contributions – one due to the time-varying magnetic flux through the loop, and another electrostatic component due to the coupling of stray voltages from the pulsed-power generator. Having two oppositely wound loops provides a differential measurement, allowing us to combine the raw, unintegrated signals from both loops, and isolate the contribution of the time-varying magnetic flux (Suttle et al. Reference Suttle, Burdiak, Cheung, Clayson, Halliday, Hare, Rusli, Russell, Tubman and Ciardi2019; Datta et al. Reference Datta, Russell, Tang, Clayson, Suttle, Chittenden, Lebedev and Hare2022). We position the inductive probe to measure the azimuthal magnetic field – the normals to the surfaces of the loops lie along the magnetic field. The voltage signal from the probe is proportional to the rate of change of the magnetic field $V = \dot {B}A_\text {eff}$
 . To determine the magnetic field strength at the probe, we numerically integrate the voltage signal in time. The inductive probe was calibrated before use in the experiment to determine its effective area $A_{\text {eff}} = 0.30 \pm {0.01}\ {\rm mm}^{2}$
 . This was done by placing the probe within the known magnetic field generated by a Helmholtz coil driven by $\sim$
 1 kA time-varying current. The current was measured using a calibrated Pearson coil, and a Biot–Savart solver was used to calculate the magnetic field from the known coil geometry and the measured current.
In some cases, the inductance and capacitance of the wire loops can modify the response of the probe. These effects are negligible if $\tau _s = (L+M)/R_S$ and $rC$
 are small compared with the characteristic time of the experiment (Everson et al. Reference Everson, Pribyl, Constantin, Zylstra, Schaeffer, Kugland and Niemann2009). Here, $L$
 is the self-inductance of each loop, $M$
 is the mutual-inductance of the loops, $C$
 is the loop capacitance, $r$
 is the internal resistance of the wire and $R_S$
 is the load resistance across which the voltage is measured. For our case, $\tau _s \sim {20}\ {\rm ps}$
 , and $rC \sim {0.01}\ {\rm ps}$
 , which are both much smaller than the characteristic experimental time of $\tau \sim {250}\ {\rm ns}$
 . This allows us to safely ignore these effects.
A second inductive probe ($A_{\text {eff}} = 0.28 \pm {0.01}\ {\rm mm}^{2}$ ), identical to the one described above, was also positioned at the same radial distance from the array, but at a different azimuthal location. This probe lies outside the field-of-view of our imaging diagnostic, but provides a second measurement of the magnetic field at the same radial position. In addition to the two probes placed in the flow, a single-loop b-dot probe is positioned in a recess near the current feed for the load. This probe is uncalibrated, and monitors the the current delivered to the load.
We use a Mach–Zehnder interferometer to visualize the plasma flow and the bow shock around the first inductive probe. The interferometry set-up simultaneously provides both end-on (figure 1b) and side-on views (figure 1c) of the experimental set-up. The end-on interferometer, which provides an axially integrated view of the experimental set-up in the $x$ –$y$
 plane, is illuminated using a ${532}\ {\rm nm}$
 pulsed Nd-YAG laser (EKSPLA SL321P, 500 ps, 100 mJ). The side-on interferometer provides a line-integrated (along the $y$
 -direction) view of the $x$
 –$z$
 plane, and is illuminated using a 1053 nm Nd:Glass laser (1 ns, 1 J). Both laser beams are expanded to provide a ${\sim }{20}\ {\rm mm}$
 field-of-view. We combine the probe and reference beams at the CCD of a Canon EOS 500D DSLR camera. When the probe beam propagates through the plasma, the resulting phase accumulated by the beam distorts the fringe pattern, and introduces a spatially varying fringe shift (Hutchinson Reference Hutchinson2002; Swadling et al. Reference Swadling, Lebedev, Niasse, Chittenden, Hall, Suzuki-Vidal, Burdiak, Harvey-Thompson, Bland and De Grouchy2013), which we use to reconstruct the phase difference between the probe and reference beams, and to determine the spatially resolved line-integrated electron density (Hare et al. Reference Hare, MacDonald, Bland, Dranczewski, Halliday, Lebedev, Suttle, Tubman and Rozmus2019). The field-of-view of our interferometer includes volume devoid of plasma, where the fringe spacing and orientation remain the same between the background and shot interferograms. This region of zero fringe shift is chosen as region of zero density.
3 Results
3.1 Bow shock morphology
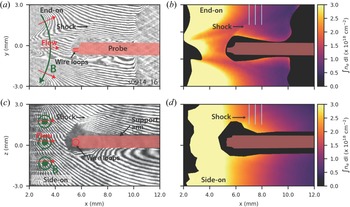
Figure 2 shows the end-on ($x$ –$y$
 ) and side-on ($x$
 –$z$
 ) raw interferograms, together with the line-integrated electron density maps at $t = {300}\ {\rm ns}$
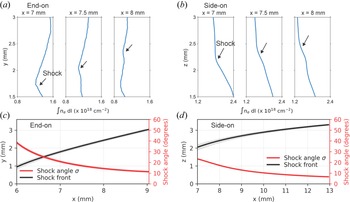
 after current start. We use a coordinate system centred at the intersection of the obstacle axis and the array surface throughout this paper. Note that the magnetic field lines lie tangential to the end-on plane, and normal to the side-on plane. A bow shock, characterized by a curved discontinuity in electron density, is visible in both end-on and side-on images. The bow shock appears more distinct on the top of the probe in both views, because the shock front is almost parallel to the fringes under the probe, so the fringes appear relatively undisturbed. On the other side of the probe, where the fringes are at an angle to the shock, the shock front appears more prominent. Nevertheless, we expect the shock front to be axisymmetric about the obstacle axis, due to the symmetry of the upstream flow. Lineouts of the line-integrated electron density at 7, 7.5 and 8 mm from the wires are shown in figures 3(a) and 3(b) for the end-on and side-on lines-of-sight, respectively. We can determine the position of the bow shock from the discontinuity in the electron density, as shown in figures 3(a) and 3(b).
(a) End-on raw interferogram at 300 ns after current start using a Mach–Zehnder interferometer with a 532 nm laser. The red shaded region represents the silhouette of the obstacle from the background interferogram recorded before start of the experiment. (b) End-on line-integrated electron density map determined from interferometry. (c) Side-on raw interferogram at 300 ns after current start using a 1053 nm laser. (d) Side-on line-integrated electron density map determined from interferometry. Regions in black near the obstacle and the wire array surface represent locations where the probing beam is lost.

(a) Lineouts of the end-on line-integrated electron density along the $y$ -axis at 7, 7.5 and 8 mm from the wires (cyan lines in figure 2b). The shock appears as a discontinuity in the electron density. (b) Lineouts of the side-on line-integrated electron density along the $z$
 -axis at 7, 7.5 and 8 mm from the wires (cyan lines in figure 2d). (c) Position of the shock front, and variation of the shock angle with distance from wires in the end-on plane. (d) Position of the shock front, and variation of the shock angle with distance from wires in the side-on plane.

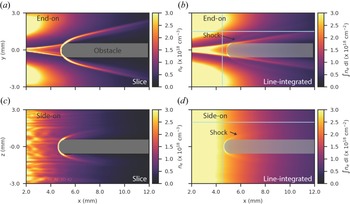
Figures 2(b) and 2(d) show that the electron density is high near the surface of the wire array and decreases with distance from the array, as expected due to the radially diverging nature of the outflows. In the end-on plane, the upstream flow exhibits significant modulation in the azimuthal direction. This modulation results from the supersonic collision of adjacent azimuthally expanding jets ablating from the wire cores, which forms standing oblique shocks periodically distributed between the wires (Swadling et al. Reference Swadling, Lebedev, Niasse, Chittenden, Hall, Suzuki-Vidal, Burdiak, Harvey-Thompson, Bland and De Grouchy2013). Due to the oblique shocks, we expect the Mach number of the upstream flow in the end-on plane to also exhibit periodic modulation. In comparison, the upstream flow exhibits little modulation in the $z$ -direction (figure 2d).
We define the shock opening half-angle $\alpha /2$ to be the angle between the obstacle axis and the shock front (see figure 1d). Figure 2 clearly shows the anisotropy in the shock structure – the shock is wider in the end-on plane (i.e. it has a larger opening angle) than in the side-on plane. The shock angle $\sigma$
 is the angle between the upstream velocity vector and the shock front (see figure 1d). If the upstream velocity vector ${\boldsymbol {u}_{\boldsymbol {1}}}$
 makes an angle $\theta _{u1}$
 with respect to the horizontal, the shock angle then becomes $\sigma = \alpha /2 - \theta _{u1}$
 .
To determine the opening half-angle from the observed bow shock geometry, we trace the shock front and fit a curve $s(x_s,y_s)$ to it. The opening half-angle is then simply $\alpha (x_s)/2 = \tan ^{-1}({\rm d}y_s/{\rm d}x_s)$
 . To calculate the shock angle $\sigma$
 , we must account for the direction of the upstream velocity. In the side-on plane, the projection of the upstream velocity only has a component along the $x$
 -direction, i.e. $\theta _{u1} = 0$
 (see figure 2), so the opening half-angle and the shock angle are equal in this plane. In the end-on view, however, the velocity vector makes a non-zero angle with the horizontal due to the radially diverging nature of the flow. We assume that the upstream velocity propagates radially outwards with respect to the array centre, i.e. $\boldsymbol {u}_{\boldsymbol {1}} = u_1 \hat {\boldsymbol {e}}_{\boldsymbol {r}}$
 . The velocity vector then makes an angle $\theta _{u1} = \tan ^{-1}(y_s/x_s)$
 to the horizontal.
We plot the position of the shock front, and the variation of the shock angle with distance from the wires in figures 3(c) and 3(d). In bow shocks, the shock angle varies continuously from ${90}^{\circ }$ at the nose of the obstacle to the Mach angle $\mu$
 asymptotically far away from the obstacle, where the bow shock constitutes an infinitesimally weak Mach wave (Anderson Reference Anderson2001). From our interferometry images (figure 2), we observe that the shock opening half-angle asymptotically approaches $\alpha /2 \rightarrow 30^{\circ }$
 and $\alpha /2 \rightarrow {7}^{\circ }$
 far away from the obstacle in the end-on and side-on views, respectively. Accounting for the direction of the upstream velocity, as described in the previous paragraph, the Mach angles are $\mu \approx 11 \pm 0.5^{\circ }$
 (end-on) and $\mu \approx 7 \pm {0.5}^{\circ }$
 (side-on). This is shown in figures 3(c) and 3(d), where the shock angle asymptotically approaches these values. The Mach angle is ${\sim }{4}^{\circ }$
 higher in the end-on plane. We discuss this difference between the end-on and side-on Mach angles in § 5.
3.2 Magnetic field measurements
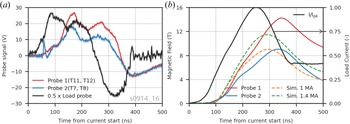
Figure 4(a) shows the voltage signals from the two inductive probes placed in the flow, as well as from the probe monitoring the current in the load. The signal from the load probe is proportional to the time rate of change of the current in the wire array, and exhibits a characteristic ‘double-bumped’ structure with a larger peak at ${\sim }85$ ns followed by a smaller peak at ${\sim }180$
 ns. These peaks are caused by voltage reflections from impedance mismatches within the transmission lines of the pulsed-power machine (Mitchell et al. Reference Mitchell, Bayley, Chittenden, Worley, Dangor, Haines and Choi1996). The rise time of the load current is ${\sim }{250}\ {\rm ns}$
 . Due to a lack of calibration information, we only show the shape of the current waveform rather than its magnitude. Rogowski coil measurements around return posts in experiments with similar loads show that MAGPIE consistently delivers a 1.4 MA peak current (Lebedev et al. Reference Lebedev, Suttle, Swadling, Bennett, Bland, Burdiak, Burgess, Chittenden, Ciardi and Clemens2014; Burdiak et al. Reference Burdiak, Lebedev, Bland, Clayson, Hare, Suttle, Suzuki-Vidal, Garcia, Chittenden and Bott-Suzuki2017; Hare et al. Reference Hare, Suttle, Lebedev, Loureiro, Ciardi, Chittenden, Clayson, Eardley, Garcia and Halliday2018). The probes in the flow reproduce the shape and characteristic features of the signal at the load, showing that the magnetic field is frozen into the flow, and that the magnetic field from the inside of the array is advected to the outside by the ablating plasma (Burdiak et al. Reference Burdiak, Lebedev, Bland, Clayson, Hare, Suttle, Suzuki-Vidal, Garcia, Chittenden and Bott-Suzuki2017).
(a) Signal from load probe and inductive probes placed in the flow. The probe signals are displaced in time relative to the signal from the load probe, showing that the magnetic field is advected by the flow. (b) Time-resolved load current and magnetic field. Peak field value is ${\sim }9\unicode{x2013}14$ T and occurs at ${\sim }340$
 ns after current start.

Figure 4(b) shows the load current and the advected postshock magnetic field. The current signal has been normalized using its peak value. The load current and the advected magnetic field are determined by numerically integrating the load probe signal and the flow probe signals, respectively. The load current and the advected magnetic field have similar shapes, again confirming frozen-in flux. The two probes, although placed at the same radial location and calibrated before use, measure peak magnetic field strengths of $14$ T and $9$
 T, respectively. A possible source of this discrepancy is misalignment of the probe normal with respect to the magnetic field vector. However, a large misalignment (${\sim }{50}^{\circ }$
 ) would be necessary to account for the observed difference. Since the rotational position of the probes was adjusted to return the maximum signal during calibration, a large misalignment of this scale is unlikely.
4 Three-dimensional resistive MHD simulations in Gorgon
To better understand these experiments, we use Gorgon, a 3-D (cartesian, cylindrical or polar coordinate) Eulerian resistive MHD code with van Leer advection, and separate energy equations for ions and electrons (Chittenden et al. Reference Chittenden, Lebedev, Oliver, Yu and Cuneo2004; Ciardi et al. Reference Ciardi, Lebedev, Frank, Blackman, Chittenden, Jennings, Ampleford, Bland, Bott and Rapley2007). Many radiation loss and ionization models can be implemented in Gorgon. Here, we use a simple volumetric recombination-bremsstrahlung model (Richardson Reference Richardson2019) modified with a constant multiplier to account for line radiation, and a local thermodynamic equilibrium Thomas–Fermi equation-of-state to determine the ionization level. For the simulated plasma and bow shock, the cooling time due to radiative recombination and bremsstrahlung losses $\tau _{\text {cool}} \sim p / P_{\text {rad}}$ is small compared with the hydrodynamic time scale $\tau _H \sim L/C_S$
 of the plasma, and the simulation results remain largely unchanged when the radiation multiplier is set to unity. Here, $p$
 is the thermal pressure, $P_{\text {rad}}$
 is the radiative power loss and $C_S$
 is the sound speed. We simulate an exploding wire array with the same geometric dimensions, wire material, and wire thickness, as in the experimental set-up. The current pulse applied to the load was determined from a sum-of-sines fit to the integrated signal of a Rogowski coil around a return post from a different MAGPIE shot with a similar load. We use a peak current of $I_{\text {pk}} = 1$
 MA, instead of $I_{\text {pk}} = 1.4$
 MA, because the simulated density better matches the experimentally observed electron density for the former case. For $I_{\text {pk}} = 1.4$
 MA, both the simulation and the rocket model (Lebedev et al. Reference Lebedev, Beg, Bland, Chittenden, Dangor, Haines, Kwek, Pikuz and Shelkovenko2001) predict that the wires explode before 300 ns after current start. Since the wires appear to still be in the ablation stage at 300 ns from the experimental images, we believe that the current delivered to the load is lower than what is measured by the Rogowski. The simulation domain is a cuboid with dimensions $51.2 \times 50.4 \times 38\ {\rm mm}^3$
 . The initial mass in the wires is distributed over $3 \times 3$
 grid cells pre-expanded wire cores. We place a resistive ($\eta = 0.1\ \Omega {\rm m}$
 ) cylindrical obstacle of diameter 1 mm at 5.5 mm from the array edge. The cylindrical obstacle mimics the inductive b-dot probe in the experiment, and is aligned parallel to the $x$
 -axis. The leading edge of the cylinder is a non-conducting sphere of diameter 1 mm. The simulations are performed with a grid size of ${50}\ {\mathrm {\mu }}{\rm m}$
 . Our convergence study shows that this resolution is adequate to achieve convergence.
Figures 5(a) and 5(c) show the end-on and side-on slices of the simulated electron density through the obstacle midplane at $t = {300}~{\rm ns}$ after current start, and figures 5(b) and 5(d) show the end-on and side-on line-integrated electron density at the same time. A detached bow shock is visible ahead of the obstacle in the electron density slices and the line-integrated maps. In the line-integrated electron density maps, the shock front appears ‘muted’, similar to what we observe in the experimental image, because line-integrating obfuscates the density jump at the 3-D shock front.
(a) End-on slice of electron density at 300 ns from 3-D resistive MHD Gorgon simulation of the experimental geometry. (b) End-on line-integrated electron density at 300 ns from 3-D resistive MHD Gorgon simulation of the experimental geometry. (c) Side-on slice of simulated electron density at 300 ns. (d) Side-on line-integrated electron density at 300 ns from simulation. In each image, the plasma flow is from the left to the right.

5 Discussion of results
5.1 Bow shock structure
The structure of shocks is closely related to the propagation velocity of linear perturbations in a given medium (Goedbloed et al. Reference Goedbloed, Keppens and Poedts2010; Kundu, Cohen & Dowling Reference Kundu, Cohen and Dowling2012). For isotropic waves, we can use the simple relation $\sin \mu = 1/M_1$ to obtain the upstream Mach number $M_1$
 from the measured Mach angle $\mu$
 (Kundu et al. Reference Kundu, Cohen and Dowling2012). Using this relation, we estimate the upstream Mach number to be $M_1 = 5.2 \pm 0.3$
 from the Mach angle measured in the experimental end-on image, and $M_1 = 8.2 \pm 0.6$
 from the Mach angle in the experimental side-on image.
In a hydrodynamic shock, the sound wave, which propagates isotropically at the ion sound speed $C_S$ , sets the Mach number (Goedbloed et al. Reference Goedbloed, Keppens and Poedts2010). However, in a fast MHD shock, the fast magnetosonic wave determines the shock dynamics, and this wave has an anisotropic phase velocity – the wave speed is largest in the direction perpendicular to the magnetic field and smallest in the direction parallel to it. Anisotropy in the fast wave phase velocity leads to anisotropy in the Mach angle, however, this anisotropy is small in the high $\beta$
 $(V_{{\rm FMS}} \approx C_S)$
 and low $\beta$
 $(V_{{\rm FMS}} \approx V_A)$
 regimes (Spreiter & Stahara Reference Spreiter and Stahara1985; Verigin et al. Reference Verigin, Kotova, Szabo, Slavin, Gombosi, Kabin, Shugaev and Kalinchenko2001).
We can estimate the Alfvén speed $V_A$ and the Alfvén Mach number $M_A$
 upstream of the probe from the electron density and magnetic field measurements. At 300 ns after current start, the line-averaged electron density just upstream of the probe (5 mm from the wires) is $n_e \sim 1.2 \times 10^{18}\ {\rm cm}^{-3}$
 . Assuming an average ionization $\bar {Z} \sim 3.5$
 (Suttle et al. Reference Suttle, Burdiak, Cheung, Clayson, Halliday, Hare, Rusli, Russell, Tubman and Ciardi2019), we find the that upstream mass density is $\rho \sim 1.6 \times 10^{-5}\ {\rm g}\ {\rm cm}^{-3}$
 . Combining this with the measured magnetic field $B = 10.6 \pm 2$
 T at $t = 300\ {\rm ns}$
 (and assuming that the magnetic field is unperturbed by the shock), we estimate the upstream Aflvén speed to be $V_A = 67 \pm 13\ {\rm km} {\rm s}^{-1}$
 . Furthermore, we infer the flow velocity $V = 74 \pm {14} {\rm km}\ {\rm s}^{-1}$
 from the time delay in the probe signals (Datta et al. Reference Datta, Russell, Tang, Clayson, Suttle, Chittenden, Lebedev and Hare2022), giving us an estimated upstream Alfvén Mach number of $M_A \sim 1.1 \pm 0.3$
 . Similarly, for a $T_e \sim T_i \sim 10$
 eV aluminium plasma (Suttle et al. Reference Suttle, Burdiak, Cheung, Clayson, Halliday, Hare, Rusli, Russell, Tubman and Ciardi2019), the sound speed is approximately $C_S \sim \sqrt {\gamma _\text {{eff}}(T_i + Z T_e) / m_i} \sim {12}\ {\rm km} {\rm s}^{ -1}$
 , and the sonic Mach number is, therefore, $M_S \sim 6$
 . These values are consistent with experimental results from aluminium plasmas in similar exploding wire arrays which show that the fast and Alfvén Mach numbers are expected to be approximately ${\sim }2$
 , while the sonic Mach number is $M_S > 5$
 (Burdiak et al. Reference Burdiak, Lebedev, Bland, Clayson, Hare, Suttle, Suzuki-Vidal, Garcia, Chittenden and Bott-Suzuki2017). These values of the sonic and Alfvén Mach numbers indicate that the fast magnetosonic speed $V_{{\rm FMS}}$
 is approximately equal the Alfvén speed $V_A$
 (and $\beta$
 is small), so the anisotropy in the fast wave speed is small. The expected value of the upstream Mach number determined from the shock geometry ($M_S \sim 5-8$
 ) is in close agreement with the sonic Mach number, which suggests that the bow shock is hydrodynamic, as opposed to being MHD.
The ideal MHD Rankine–Hugoniot shock jump conditions reduce to those of a hydrodynamic shock when the magnetic field is small, or when the upstream magnetic field is parallel to the shock normal (Goedbloed et al. Reference Goedbloed, Keppens and Poedts2010). Neither of these conditions are satisfied by our plasma – the magnetic field is dynamically significant $\beta \sim 0.1\unicode{x2013}1$ (Burdiak et al. Reference Burdiak, Lebedev, Bland, Clayson, Hare, Suttle, Suzuki-Vidal, Garcia, Chittenden and Bott-Suzuki2017; Suttle et al. Reference Suttle, Burdiak, Cheung, Clayson, Halliday, Hare, Rusli, Russell, Tubman and Ciardi2019), and the upstream magnetic field is perpendicular to the shock front at the apex of the obstacle. In resistive MHD, however, finite resistivity breaks the frozen-in condition of ideal MHD, and the magnetic field may diffuse independently of the plasma velocity. The decoupling of the plasma and magnetic field occurs at the resistive diffusion length $l_\eta$
 which makes the magnetic Reynolds number of order unity, i.e. $R_M = Ul_\eta /\bar {\eta } \sim 1$
 . Diffusion dominates at length scales smaller than the resistive diffusion length scale $l_\eta$
 , which may explain the hydrodynamic nature of the observed bow shock. Using characteristic values of $n_e \sim 1 \times 10^{18}\ {\rm cm}^{-3}$
 , $V \sim {75}\ {\rm km} {\rm s}^{-1}$
 and $T_e \sim 10-15\ \text {eV}$
 , and using Spitzer resistivity, we estimate a resistive diffusion length of $l_\eta \sim 0.4\unicode{x2013}0.7\ {\rm mm}$
 , which is comparable to the size of the obstacle. Therefore, under these plasma conditions, the magnetic field can decouple from the plasma flow at the shock, which is consistent with the observed shock structure matching the sonic, rather than magnetosonic, Mach number (Russell et al. Reference Russell, Burdiak, Carroll-Nellenback, Halliday, Hare, Merlini, Suttle, Valenzuela-Villaseca, Eardley and Fullalove2022).
The bow shock has a larger opening angle in the end-on plane, which is tangential to the magnetic field, than in the side-on plane, which is orthogonal to the field, which indicates that the magnetic field may introduce anisotropy into the shock structure. One possible cause of the observed anisotropy could be magnetic draping. When magnetic field lines frozen into the flow approach an obstacle, they may pile-up ahead of the obstacle, slip past it, or diffuse through the obstacle (including the thin layer of stagnated plasma on the obstacle surface). The rate of pile-up depends on the relative rates of advection and resistive diffusion. If the rates of advective slipping and diffusion are small, then the magnetic field will drape around the obstacle, and the magnetic tension of the bent field lines will provide an additional force opposing the ram pressure of the incoming upstream flow. This will result in a larger opening angle and stand-off distance of the shock (Burdiak et al. Reference Burdiak, Lebedev, Bland, Clayson, Hare, Suttle, Suzuki-Vidal, Garcia, Chittenden and Bott-Suzuki2017). In the end-on plane, the curvature of bent fields lines is expected to increase the shock's opening angle. However, the radius of curvature of the field lines does not lie in the side-on plane, so the bending of field lines does not affect the side-on shock angle. Therefore, we expect magnetic draping to modify the shock geometry only in the end-on plane and not on the side-on plane. We further investigate the effect of flux pile-up and field line draping on the shock structure in the following section.
5.2 Comparison with simulations
5.2.1 Shock structure and flow properties
Figure 5 shows that the simulated upstream flow is qualitatively similar to the experimentally observed flow. In the end-on plane, the upstream flow in both the simulated and experimentally observed electron density maps is modulated in the azimuthal direction due to the formation of oblique shocks. In the side-on plane, the upstream flow is relatively more uniform, and the electron density decreases with distance from the wires. In figure 6, we compare lineouts of the line-integrated electron density taken along the vertical and horizontal directions between the simulation and the experiment. Despite some differences, such as a narrower and more pronounced oblique shock in the simulation, and slightly higher densities closer to the wires, the simulations effectively capture the variation in the electron density observed in the experiment. In particular, there is good agreement in the electron density at the probe location ($x > {5}\ {\rm mm}$ ).
Lineouts of the line-integrated electron density in the end-on plane along (a) $x = 4.5$ mm, and (b) $y = 1.5$
 mm (along cyan lines in figure 5b). Lineouts of the line-integrated electron density in the side-on plane along (c) $x = 4.5$
 mm, and (d) $z = 2$
 mm (along cyan lines in figure 5d).

Table 1 provides a summary of the experimentally measured and simulated values relevant to the shock physics. The simulated upstream sonic and Alfvén Mach numbers are in good agreement with the experimental values. Here, we calculate the sonic and Alfvén speeds using $C_S = \sqrt {\gamma _\text {eff} p / \rho }$ and $V_A = B / \sqrt {\mu _0 \rho }$
 , respectively, where $p$
 is the thermal pressure, $\rho$
 is the mass density, $\gamma _\text {eff}$
 is the effective adiabatic index, and $B$
 is the magnetic field strength just upstream of the shock. Here, we use a $\gamma _\text {eff} = 1.13$
 for the calculation (Drake Reference Drake2013). Finally, the opening angle of the shock in the side-on plane also agrees well with the that in the experiment. The Mach number obtained from the shape of the simulated bow shock agrees with the upstream sonic Mach number, showing that the shock is hydrodynamic, just like in the experiment.
Summary of measured values and comparison with simulation.

The simulated bow shock, however, exhibits a smaller opening angle in the end-on plane than in the experiment. When we account for the direction of the upstream velocity vector, the shock angles of the simulated shock approach similar values in the end-on and side-on planes. This shows that the simulated shock under-predicts the anisotropy observed in the experiment.
In the simulation, the shock shape remains roughly stationary during the majority of the current pulse. This is because although the upstream density, temperature, flow velocity and magnetic field evolve in time, the upstream Mach number, which governs the structure of the shock, shows little temporal variation. The Mach number remains roughly constant at $M_S \sim 7$ from the time of shock formation ($\sim$
 150 ns) until the time of observation (300 ns), after which it drops to $\sim$
 5.5 late in time ($\sim$
 400 ns). This is also reflected in the simulated shock opening angle, which remains static initially, then increases, consistent with the fall in the upstream Mach number. Since we image the shock only once during the experiment, we cannot comment on the temporal evolution of the shock. However, in similar experiments with 2-D cylindrical obstacles, the shock shape has been observed to remain roughly stationary during the course of the experiment (Burdiak et al. Reference Burdiak, Lebedev, Bland, Clayson, Hare, Suttle, Suzuki-Vidal, Garcia, Chittenden and Bott-Suzuki2017; Suttle et al. Reference Suttle, Burdiak, Cheung, Clayson, Halliday, Hare, Rusli, Russell, Tubman and Ciardi2019).
The resistive diffusion length $l_\eta$ also remains roughly constant at $l_\eta \sim 0.5$
 mm initially ($t < 300$
 ns), but increases rapidly later in time. However, it still remains comparable to the obstacle size, which means that the plasma in the vicinity of the obstacle is expected to remain diffusion-dominated for the course of the experiment.
5.2.2 Effect of magnetic draping and shock anisotropy
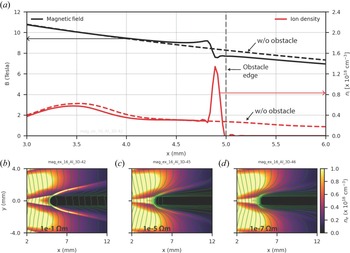
A line-out of the magnetic field along the obstacle axis shows that the magnetic field increases by $\sim$ 1.5 T at the shock front (figure 7a). Note that the jump in the magnetic field is much smaller than that in ion density (${\sim }4\times$
 ), suggesting that the rise in field strength is due to flux pile-up at the obstacle, rather than due to shock compression, which would result in comparable jumps in the magnetic field and ion density. The pile-up occurs because the obstacle and the layer of stagnant plasma ahead of it have some finite conductivity, which limits the rate of resistive diffusion. Figure 7(b) shows magnetic field lines overlaid on the simulated electron density. The field lines drape around the probe, but are able to diffuse through the resistive obstacle, which limits the amount of flux pile-up. Note that in the experiment, the leading edge of the probe consists of loops of copper wire coated in insulating enamel.
(a) Line-outs of the simulated magnetic field and electron density along the obstacle-axis. (b–d) End-on electron density with overlaid magnetic field lines for obstacle resistivities $10^{-1}\ {\Omega }{\rm m}$ , $10^{-5}\ {\Omega }{\rm m}$
 and $10^{-7}\ {\Omega }{\rm m}$
 , respectively.

To investigate the importance of magnetic draping, we repeat the simulations with obstacles of increasing conductivity, as shown in figures 7(c) ($10^{-5}\ {\Omega }{\rm m}$ ) and 7(d) ($10^{-7}\ {\Omega }{\rm m}$
 ). Increasing the obstacle conductivity leads to increased flux pile-up and magnetic draping; however, it does not generate a wider bow shock. This suggests that some mechanism, other that magnetic draping, may contribute to the experimentally observed anisotropy in the shock shape.
One possible mechanism that can create anisotropic hydrodynamic shock structures is pressure anisotropy, which will generate ion acoustic waves that travel at different speeds along and across magnetic field lines (Hau & Sonnerup Reference Hau and Sonnerup1993; Chou & Hau Reference Chou and Hau2004). Allowing for an anisotropic pressure tensor ${\boldsymbol{\mathsf{P}}} = p_\perp {\boldsymbol{\mathsf{I}}} + (p_\parallel - p_\perp ) {\boldsymbol {bb}}$ , we estimate that in order to obtain the observed anisotropy in the bow shock shape, we require $p_\parallel \sim 2.5 p_\perp$
 . Significant pressure anisotropy, however, is unlikely in our plasma, given that it is highly collisional, and has a pressure-anisotropy relaxation time ${\sim }{0.1}\ {\rm ns}$
 (Richardson Reference Richardson2019), which is small compared with the hydrodynamic time scale of the experiment.
Note that the ion skin depth $d_i \sim {0.5}\ {\rm mm}$ is also comparable to the resistive diffusion length in this plasma. When ions and electrons decouple at the ion skin depth, the magnetic field is no longer frozen into the ion fluid, and two-fluid effects, in particular the Hall term in Ohm's law, may become important (Eastwood et al. Reference Eastwood, Bale, Mozer and Hull2007; Shaikhislamov et al. Reference Shaikhislamov, Antonov, Zakharov, Boyarintsev, Melekhov, Posukh and Ponomarenko2013). Extended-MHD simulations have previously demonstrated widening of MHD bow shocks around obstacles with size comparable to the ion inertial length, and this modification of the shock shape is associated with a suppression of the current in the postshock low density region by the Hall term ${\boldsymbol {j} \times \boldsymbol {B}}/en$
 (Zhao & Seyler Reference Zhao and Seyler2015). However, it remains unclear if Hall effects can account for the observed shock anisotropy in the experimental bow shock, and future work will aim to investigate this with extended-MHD simulations.
In the analysis above, we have assumed a constant $\gamma _\text {eff}$ of the plasma. However, since the magnetic field remains frozen into the electrons, which have different degrees of freedom $n$
 along ($n = 1$
 ) and across ($n = 2$
 ) the magnetic field, the value of $\gamma$
 can also exhibit anisotropy relative to the field direction. Using the relation $\gamma = (n+2)/n$
 for adiabatic compression (Chen Reference Chen1974), we estimate the parallel and perpendicular Mach numbers to be $M_\parallel (\gamma _\parallel = 3) \sim 4$
 and $M_\perp (\gamma _\perp = 2) \sim 5$
 , respectively. The Mach number is larger in the $B_\perp$
 plane, and this would lead to a smaller Mach angle in the side-on $B_\perp$
 plane ($\mu _\perp \sim {12}^{\circ }$
 ) compared with that in the end-on $B_\parallel$
 plane ($\mu _\parallel \sim {15}^{\circ }$
 ). This qualitatively reproduces the anisotropy in the experimental result. A quantitative comparison would require a measurement of the ion and electron temperatures, which can be accomplished in future experiments via optical Thompson scattering (OTS) (Suttle et al. Reference Suttle, Hare, Halliday, Merlini, Russell, Tubman, Valenzuela-Villaseca, Rozmus, Bruulsema and Lebedev2021).
Finally, in calculating the Mach angle from the experimental shock opening angle, we assumed a radial velocity field. In reality, the flow may also exhibit an azimuthal component of velocity due to the thermal expansion of the plasma ablating from the wire cores (Swadling et al. Reference Swadling, Lebedev, Niasse, Chittenden, Hall, Suzuki-Vidal, Burdiak, Harvey-Thompson, Bland and De Grouchy2013). This may cause the calculated value of the Mach angle in the end-on plane to be an underestimate of the true value. The OTS along two lines of sight can be employed to better estimate the angle of the upstream velocity vector (Suttle et al. Reference Suttle, Hare, Halliday, Merlini, Russell, Tubman, Valenzuela-Villaseca, Rozmus, Bruulsema and Lebedev2021).
5.2.3 Magnetic field measurements
Figure 4(b) shows that the simulated magnetic field at the probe location 300 ns after current start is 8 T, which is ${\sim }8\,\%-30\,\%$ lower than the experimentally measured field of $10.6 \pm 2$
 T at the same time. The peak simulated field at the probe occurs at $t \sim {300}\ {\rm ns}$
 , and is weaker than the experimentally observed peak field ($11.5 \pm 2.5$
 T), which occurs later at $t \sim {340}\ {\rm ns}$
 . However, when the simulation is repeated with a peak current of $I_{{\rm pk}} = 1.4$
 MA, which is the upper bound on the current delivered to the load, the simulated magnetic field at $t = {300} {\rm ns}$
 is 11 T, which is in better agreement with the experimentally measured field. We reiterate, however, that the actual current delivered to the load is likely to be smaller than 1.4 MA, given that the wire array does not explode in the experiment.
The experiments and simulations independently show that under the given plasma conditions, the shock around the b-dot probe is hydrodynamic. The simulations additionally show that the effect of magnetic flux pile-up on the measured field is expected to be small, which suggests that the b-dot probe does not significantly perturb the magnetic field. However, the measured magnetic field is larger than the simulated field, and further investigation, with an array of probes fielded over repeated shots to better determine the uncertainty in the measured magnetic field, is required to resolve this discrepancy. We also note that since the probes were calibrated using a slower ${\sim }{1}\ {\mathrm {\mu }}{\rm s}$ current pulse compared with MAGPIE's 250 ns rise time current response, there may be additional unaccounted systematic error in the probe calibration. To ascertain the systematic error in the b-dot probe measurement, simultaneous magnetic field measurements alongside other magnetic diagnostics, such as Zeeman splitting of spectral lines (Rochau, Bailey & Maron Reference Rochau, Bailey and Maron2010), or Faraday rotation polarimetry (Swadling et al. Reference Swadling, Lebedev, Hall, Patankar, Stewart, Smith, Harvey-Thompson, Burdiak, de Grouchy and Skidmore2014), can be performed in future work.
6 Conclusions and future work
We have presented experimental results and numerical studies of 3-D bow shocks generated in a collisional magnetized plasma from the interaction of a pulsed-power-driven supersonic ($M_S \sim 7$ ) superfast magnetosonic ($M_{{\rm FMS}} > 1$
 ) flow with a small inductive probe. Line-integrated electron density obtained from imaging interferometry 300 ns after current start shows a well-defined detached bow shock ahead of the probe. The bow shock exhibits a fully 3-D anisotropic structure, with a larger opening angle in the end-on plane (parallel to the magnetic field) than in the side-on plane (perpendicular to the magnetic field). Since the resistive diffusion length in the plasma is comparable to the size of the probe, the magnetic field decouples from the ion fluid, and we expect the bow shock to be hydrodynamic, rather than MHD. From the shock geometry, we estimate the upstream Mach number ($5 < M_1 < 8$
 ) of the flow, and find the calculated Mach number to be in good agreement with the sonic Mach number of the plasma, showing that the shock is hydrodynamic.
We compare our experimental results with fully 3-D resistive MHD simulations of the experimental set-up using the code Gorgon, which confirms the hydrodynamic nature of the shock. The simulation successfully reproduces several features of the experiment, including upstream density modulation, the magnitudes of the sonic and Alfvénic Mach numbers, as well as the shock opening angle in the plane perpendicular to the magnetic field. The simulation, however, under-predicts the anisotropy observed in the shape of the experimental shock. We explore multiple possible mechanisms that can introduce anisotropy in the bow shock shape. The simulations show that the shock shape in this diffusion-dominated regime remains largely independent of magnetic flux pile-up and magnetic draping. Next, we also find that the pressure anisotropy required to generate the observed anisotropy in the shock shape is large, and unlikely to occur in our plasma since the pressure anisotropy relaxation time is small compared with the hydrodynamic time scale of the plasma. Anisotropic $\gamma$ due to different degrees of freedom of the electron fluid along and across the magnetic field qualitatively describes the experimentally observed shock anisotropy, but a quantitative comparison requires a measurement of the temperature. Finally, since the resistive diffusion length scale is comparable to the ion inertial length, the Hall term may become important. Future work will focus on the importance of the Hall term, via extended-MHD simulations of the bow shock.
Future experimental work will also attempt to quantify the change in the direction and magnitude of the velocity vector, as well as in density and pressure across the shock front. This can be implemented using the ion feature of optical Thomson scattering, which can provide independent measurements of the flow velocity, ion and electron temperatures and the ion sound speed.
Acknowledgements
Editor T. Carter thanks the referees for their advice in evaluating this article.
Funding
This work was funded in part by NSF and NNSA under grant no. PHY2108050, and supported by the United States Department of Energy (DOE) under award nos. DE-SC0020434, DE-NA0003764, DE-F03-02NA00057, DE-SC-0001063 and DE-NA0003868, and the Engineering and Physical Sciences Research Council (EPSRC) under grant no. EP/N013379/1. The simulations presented in this paper were performed on the MIT-PSFC partition of the Engaging cluster at the MGHPCC facility (www.mghpcc.org) which was funded by DOE grant no. DE-FG02-91-ER54109.
Declaration of interests
The authors have no conflicts of interest to disclose.