





1. Introduction
The wake dynamics of heated bluff bodies have long been a subject of considerable interest due to their fundamental scientific importance and wide-ranging engineering applications, including heat exchangers, electronic cooling, urban aerodynamics and energy systems. In such flows, the relative orientation of buoyancy with respect to the free stream direction plays a critical role in governing wake structure, stability and the onset of three-dimensional (3-D) transition. Depending on whether buoyancy acts in aiding, opposing or cross-directions, it can significantly modify vortex shedding behaviour, wake symmetry and flow instability. Over the past decades, numerous numerical and experimental studies have systematically examined these effects in canonical configurations such as heated circular and square cylinders (Ren et al. Reference Ren, Rindt and van Steenhoven2004, Reference Ren, Rindt and van Steenhoven2006a , Reference Ren, Rindt and Van Steenhovenb ; Noto & Fujimoto 2006, 2007; Tanweer et al. 2020, 2021; Ali et al. Reference Ali, Hasan and Sanghi2024), providing detailed insights into the coupling between thermal buoyancy and shear-driven wake dynamics.
Importantly, findings from these studies have been directly leveraged in engineering applications. For instance, buoyancy-induced suppression or enhancement of vortex shedding has been used to regulate unsteady fluid forces and improve structural reliability in heat exchanger tube bundles and electronic cooling systems (Žukauskas Reference Žukauskas1972; Bergman Reference Bergman2011). Similarly, buoyancy-driven modifications in wake asymmetry and vortex interactions under mixed convection conditions have been shown to significantly influence heat transfer rates and thermal mixing efficiency, which are critical for the optimal design of compact heat exchangers and thermal management systems (Kakaç et al. Reference Kakaç, Liu and Pramuanjaroenkij2002). In environmental and urban flow scenarios, buoyancy-modified wakes play a key role in governing pollutant dispersion and thermal plume evolution around heated structures (Fernando Reference Fernando2010). These studies highlight the importance of accurately accounting for buoyancy orientation in predictive models, as even moderate changes in wake behaviour can lead to significant variations in system performance.
The existing literature on 3-D wake transition has predominantly focused on unheated circular and square cylinders, wherein the flow behaviour is governed by a single control parameter, namely the Reynolds number, defined as
 $\textit{Re} = \mathcal{O}{}(\text{inertial forces}) / \mathcal{O}(\text{viscous forces})$
. Within this framework, three distinct instability modes – Mode-A, Mode-B and Mode-C (also referred to as Mode-QP) – have been identified in the wake of an unheated cylinder using a variety of experimental, Floquet and numerical techniques. These modes occur over specific Reynolds number ranges and are classified based on the spanwise wavelength
 $\lambda _z/L$
, where
 $L$
denotes the cylinder side length (or diameter in the case of a circular cylinder). For a square cylinder, the first two modes, Mode-A and Mode-B, are characterised by longer
 $(\lambda _z/L\approx 5{-}6)$
and shorter
 $(\lambda _z/L\approx 1.2{-}1.5)$
wavelengths, respectively, and have been observed for
 $\textit{Re}=150{-}200$
and
 $\textit{Re}=200{-}250$
through experimental, DNS and Floquet analyses (Robichaux et al. Reference Robichaux, Balachandar and Vanka1999; Sohankar et al. Reference Sohankar, Norberg and Davidson1999; Saha et al. Reference Saha, Biswas and Muralidhar2003; Luo et al. 2003, 2007; Sheard et al. Reference Sheard, Fitzgerald and Ryan2009; Agbaglah & Mavriplis Reference Agbaglah and Mavriplis2017; Jiang & Cheng Reference Jiang and Cheng2018; Jiang et al. Reference Jiang, Cheng and An2018). The third mode, Mode-C, with an intermediate wavelength
 $(\lambda _z/L\approx 2.6{-}2.8)$
, has been identified exclusively via Floquet analysis for
 $\textit{Re}=200{-}219$
(Robichaux et al. Reference Robichaux, Balachandar and Vanka1999; Sheard et al. Reference Sheard, Fitzgerald and Ryan2009). Beyond investigations of wake instability, previous studies on unheated cylinders have also examined vortex shedding behaviour, vortex dislocation phenomena and the associated hydrodynamic characteristics.
With the introduction of heating, buoyancy effects intensify the complexity of wake dynamics by generating thermally induced baroclinic vorticity, which plays a crucial role in modifying vortex shedding behaviour and the three-dimensionality of the wake. Previous studies have investigated the role of baroclinic vorticity generation in wake transition for a uniformly heated cylinder under two distinct thermal regimes: the small-scale heating regime and the large-scale heating regime. These regimes are distinguished based on the magnitude of
 $\beta \Delta T$
, where
 $\beta$
is the thermal expansion coefficient and
 $\Delta T=T_w-T_\infty$
denotes the temperature difference between the heated surface (
 $T_w$
) and the free stream (
 $T_\infty$
). For air,
 $\beta$
is typically approximated as
 $\beta = 1/T_\infty$
, yielding
 $\beta \Delta T = (T_w-T_\infty )/T_\infty$
, which corresponds to the overheat ratio
 $\varepsilon$
used in the present computations.
The small-scale heating regime is characterised by the condition
 $\beta \Delta T \ll 1$
. This regime is accurately modelled using the incompressible Boussinesq approximation, in which density variations influence only the buoyancy term, while variations in transport properties and specific heats are neglected. In this framework, thermal effects are governed by the Richardson number,
 $Ri = \mathcal{O}(\text{buoyant forces}) / \mathcal{O}(\text{inertial forces})$
(Kieft et al. 2002, 2003; Van Steenhoven & Rindt Reference Van Steenhoven and Rindt2003; Ren et al. Reference Ren, Rindt and van Steenhoven2004, Reference Ren, Rindt and van Steenhoven2006a
,
Reference Ren, Rindt and Van Steenhovenb
, Reference Ren, Rindt and van Steenhoven2007; Hasan & Ali Reference Hasan and Ali2013; Tanweer et al. 2020, 2021). In contrast, the large-scale heating regime,
 $\beta \Delta T = \mathcal{O}(1)$
, involves significant variations in thermophysical and transport properties. This regime is modelled using the non-Oberbeck–Boussinesq (NOB) approach, which necessitates solving the full compressible Navier–Stokes equations to accurately capture baroclinic effects and the influence of transport property variations on wake dynamics (Arif & Hasan 2019, 2021; Ali et al. Reference Ali, Hasan and Sanghi2022, Reference Ali, Hasan and Sanghi2023a
,
Reference Ali, Hasan and Sanghib
, Reference Ali, Hasan and Sanghi2024).
The orientation of the free stream relative to gravity gives rise to two buoyancy configurations: aiding buoyancy, where the flow is aligned opposite to gravity, and cross-buoyancy, where the flow is perpendicular to gravity. In the cross-buoyancy configuration, the influence of buoyancy-induced baroclinic vorticity on two-dimensional (2-D) wake dynamics behind a heated circular cylinder has been studied numerically and experimentally for
 $\textit{Re}=\mathcal{O}(100)$
and
 $Ri=0$
–
 $2$
, using water (
 $\textit{Pr}=7$
) as the working fluid (Kieft et al. 2002, 2003; Van Steenhoven & Rindt Reference Van Steenhoven and Rindt2003). These investigations revealed that temperature gradients generate unequal vortex strengths in the upper and lower wake rows, with the disparity increasing with
 $Ri$
, thereby introducing asymmetry in the wake. At low
 $Ri$
, this strength difference further causes a pronounced downward deflection of shed vortices and a drift of wake structures. Consistent observations in cross-buoyancy were also reported by Bhattacharyya & Singh (Reference Bhattacharyya and Singh2010) for
 $\textit{Re}=200$
and
 $Ri=2.5$
using air (
 $\textit{Pr}=0.72$
). Extending this analysis, Sarkar et al. (Reference Sarkar, Dalal and Biswas2011) showed numerically that increasing
 $Ri$
enhances positive vorticity while reducing negative vorticity in the near wake across
 $80\lt \textit{Re}\lt 180$
and
 $0.7\lt \textit{Pr}\lt 100$
.
For 3-D wake transitions in cross-buoyancy, combined experimental and numerical investigations behind a heated circular cylinder at
 $\textit{Re}=85$
and
 $Ri=1.0$
(Ren et al. Reference Ren, Rindt and van Steenhoven2006a
,
Reference Ren, Rindt and Van Steenhovenb
, Reference Ren, Rindt and van Steenhoven2007) demonstrated that baroclinic torque in the near wake induces the onset of three-dimensionality at significantly lower Reynolds numbers (as low as
 $\textit{Re}=85$
). This instability, identified as Mode-E with a characteristic spanwise wavelength of
 $\lambda _z/L=2$
, initiates through the development of
 $\varLambda$
-shaped vortical structures in the near wake and subsequently evolves into mushroom-type vortices in the far wake. These studies further established that the generation of streamwise vorticity originates from baroclinic vorticity production along the streamwise direction. In a related numerical study, Tanweer et al. (Reference Tanweer, Dewan and Sanghi2021) analysed 3-D transitions for a square cylinder placed near a moving wall at
 $\textit{Re}=150$
under cross-buoyancy conditions (
 $-0.5\leqslant Ri\leqslant 0.5$
). Their findings confirmed that baroclinic vorticity production plays a decisive role in the onset of three-dimensionality: for
 $Ri\gt 0$
, an increase in the near-wall flow rate promotes transition, whereas for
 $Ri\lt 0$
, reduced flow tends to suppress it. More recently, Ali et al. (Reference Ali, Hasan and Sanghi2024) investigated numerically the 3-D wake transition behind a heated square cylinder at
 $\textit{Re}=180$
for
 $\varepsilon =0$
–
 $1$
, with air as the working fluid, using the NOB model. The study reported that baroclinic vorticity in the streamwise direction intensifies wake three-dimensionality, leading to Mode-E-type structures similar to those observed by Ren et al. (Reference Ren, Rindt and van Steenhoven2006a
,
Reference Ren, Rindt and Van Steenhovenb
), while spanwise baroclinic vorticity contributes to asymmetries in the strengths of the upper and lower vortices in the near wake.
In the case of aiding buoyancy, experimental investigations at
 $\textit{Re} \approx 1000$
revealed that vortex dislocations in the wake of a heated circular cylinder are significantly more pronounced compared with those behind a heated triangular cylinder (Noto & Matsushita Reference Noto and Matsushita2001; Noto & Fujimoto Reference Noto and Fujimoto2001). Complementary numerical studies by Noto & Fujimoto (2006, 2007) on 3-D wake transition behind a heated circular cylinder under aiding buoyancy at
 $\textit{Re}=300$
and
 $Ri=0.3$
showed that buoyancy enhances the upward streamwise velocity while reducing the spanwise velocity in the heated wake, thereby weakening wake three-dimensionality and suppressing vortex dislocations. Despite these contributions, detailed investigations of 3-D wake transitions under aiding buoyancy remain limited, and the role of baroclinic vorticity has largely been overlooked. However, two-dimensional investigations at
 $\textit{Re} = 100$
and
 $\textit{Pr} = 0.71$
with distinct heating levels have revealed that, under aiding-buoyancy conditions, baroclinic vorticity production acts as a symmetry-preserving mechanism and plays a central role in suppressing vortex shedding (Hasan & Ali Reference Hasan and Ali2013; Arif & Hasan Reference Arif and Hasan2019).
Based on existing studies, it can be concluded that research on 3-D wake transition has predominantly focused on unheated cylinders, where buoyancy-induced baroclinic vorticity production is absent. In contrast, for heated cylinders, investigations into the critical role of baroclinic vorticity generation in 3-D wake transitions have largely been confined to small-scale heating regimes in cross-flow orientations, while studies in aiding-flow configurations have primarily addressed its influence on 2-D wake behaviour rather than fully exploring 3-D effects. Furthermore, previous studies under small-scale heating conditions have demonstrated that cross-buoyancy orientations produce markedly different impacts on vortex shedding, wake symmetry and the onset of 3-D instabilities; however, the specific contribution of baroclinic vorticity generation to these 3-D phenomena remains insufficiently explored. In addition, a significant portion of the existing literature relies on the classical Oberbeck–Boussinesq approximation, which neglects substantial variations in thermophysical and transport properties, thereby failing to fully capture the influence of large-scale heating on wake dynamics.
In the large-scale heating regime, the influence of thermal buoyancy on 3-D wake dynamics has been examined over the heating range
 $0 \leqslant \varepsilon \leqslant 1$
(Ali et al. Reference Ali, Hasan and Sanghi2023b
, Reference Ali, Hasan and Sanghi2024). However, these studies are limited to cross-buoyancy configurations (
 $\alpha = 90^\circ$
), and the role of baroclinic effects on wake dynamics has been investigated only by Ali et al. (Reference Ali, Hasan and Sanghi2024). Despite these contributions, several fundamental physical questions remain unresolved in this class of flows. First, the role of baroclinic effects on 3-D wake structures, vortex shedding, vortex dislocations and hydrodynamic characteristics in aiding-buoyancy configurations (
 $\alpha = 0^\circ$
), where the flow is aligned opposite to gravity, is not yet understood. Second, while it has been reported that, in cross-buoyancy conditions, the streamwise baroclinic term plays a crucial role in enhancing wake three-dimensionality, it remains unclear whether, in aiding-buoyancy cases, the strength of wake three-dimensionality increases or decreases and what mechanisms govern this behaviour. Third, Ali et al. (Reference Ali, Hasan and Sanghi2024) examined the role of baroclinic torque at
 $\textit{Re} = 180$
, corresponding to the Mode-A instability observed in unheated wakes, and reported the excitation of only Mode-E instability for
 $0.4 \leqslant \varepsilon \leqslant 1$
; however, the nature of 3-D wake transitions in heated wakes at higher Reynolds numbers, such as
 $\textit{Re} = 300$
, associated with Mode-B instability, remains unexplored. Fourth, it is not known whether the generation of baroclinic vorticity in the vicinity of the cylinder is similar in both flow orientations
 $(\alpha = 0^\circ$
and
 $\alpha = 90^\circ )$
, whether its sign is aligned or opposed to the corresponding local vorticity and how this generation influences wake symmetry. Finally, the interaction between baroclinic vorticity generation and key flow features, such as shear layer instability, vortex roll-up and near-wake circulation, under both aiding and cross-buoyancy conditions has yet to be systematically investigated.
To address these limitations, the present study employs a NOB compressible model to investigate baroclinic vorticity production in the 3-D wake transitions of a heated square cylinder subjected to both aiding and cross-buoyancy. Direct numerical simulation (DNS) studies are conducted at
 $\textit{Re}=300$
using air (
 $\textit{Pr}=0.71$
) as the working fluid, with a low Mach number (
 $M=0.1$
) applied to suppress pressure compressibility effects. The analysis emphasises the role of baroclinic vorticity on vortex shedding strength, wake symmetry and the development of three-dimensionality, together with the emergence of distinct wake structures over a range of heating levels (
 $\varepsilon = 0$
–1). By systematically examining the competing roles of streamwise and spanwise baroclinic production terms, this work offers new insights into the mechanisms governing 3-D instabilities and flow organisation in thermally influenced wakes.
2. Numerical model
In the large-scale heating regime, Ali et al. (Reference Ali, Hasan and Sanghi2024) investigated the 3-D wake transition using a NOB model and showed that the wake dynamics are strongly influenced by variations in thermophysical and molecular transport properties near the heated cylinder. These effects cannot be captured by the classical Oberbeck–Boussinesq approximation, which assumes constant fluid properties. Accordingly, the present study employs a NOB framework based on the full compressible governing equations to accurately represent the underlying flow physics.
2.1. Governing equations
The dimensionless governing equations for compressible gas flow, written in a strong-conservative form in 3-D Cartesian coordinates, can be expressed as
 \begin{equation} \frac {\partial \boldsymbol{U}}{\partial t}+ \frac {\partial \boldsymbol{F}}{\partial x}+ \frac {\partial \boldsymbol{G}}{\partial y}+ \frac {\partial \boldsymbol{H}}{\partial z}=\boldsymbol{J}, \end{equation}
where
 $\boldsymbol{U}$
represents the solution vector,
 $\boldsymbol{F}$
,
 $\boldsymbol{G}$
and
 $\boldsymbol{H}$
denote the flux vectors in the
 $x$
-,
 $y$
- and
 $z$
-directions, respectively, while
 $\boldsymbol{J}$
corresponds to the source vector. These vectors are defined as follows:
 \begin{align} \boldsymbol{U}=\begin{bmatrix} \rho \\[3pt] \rho u\\[3pt] \rho v\\[3pt] \rho w\\[3pt] \rho E \end{bmatrix}\!, & \quad \quad \boldsymbol{F}=\begin{bmatrix} \rho u\\[11pt] \rho u u+p-\frac {2\mu }{\textit{Re}}\left \{\frac {\partial u}{\partial x}-\frac {1}{3}(\boldsymbol{\nabla }\boldsymbol{\cdot }\boldsymbol{V})\right \}\\[11pt] \rho u v-\frac {\mu }{\textit{Re}}\left (\frac {\partial v}{\partial x}+\frac {\partial u}{\partial y}\right )\\[11pt] \rho u w-\frac {\mu }{\textit{Re}}\left (\frac {\partial u}{\partial z}+\frac {\partial w}{\partial x}\right )\\[11pt] \rho u E-\frac {\gamma \kappa }{\textit{Re} \textit{Pr}}\frac {\partial T}{\partial x}+\gamma (\gamma -1){M}^2 p u +\frac {\gamma (\gamma -1){M}^2\mu }{\textit{Re}}D_F \end{bmatrix}\!, \end{align}
 \begin{equation} \boldsymbol{G}=\begin{bmatrix} \rho v\\[11pt] \rho v u-\frac {\mu }{\textit{Re}}\left (\frac {\partial v}{\partial x}+\frac {\partial u}{\partial y}\right )\\[11pt] \rho v v+p-\frac {2\mu }{\textit{Re}}\left \{\frac {\partial v}{\partial y}-\frac {1}{3}(\boldsymbol{\nabla }\boldsymbol{\cdot }\boldsymbol{V})\right \}\\[11pt] \rho v w-\frac {\mu }{\textit{Re}}\left (\frac {\partial v}{\partial z}+\frac {\partial w}{\partial y}\right )\\[11pt] \rho v E-\frac {\gamma \kappa }{\textit{Re} \textit{Pr}}\frac {\partial T}{\partial y}+\gamma (\gamma -1){M}^2 p v +\frac {\gamma (\gamma -1){M}^2\mu }{\textit{Re}}D_G \end{bmatrix}\!, \end{equation}
 \begin{equation} \boldsymbol{H}=\begin{bmatrix} \rho w\\[11pt] \rho w u-\frac {\mu }{\textit{Re}}\left (\frac {\partial w}{\partial x}+\frac {\partial u}{\partial z}\right )\\[11pt] \rho w v-\frac {\mu }{\textit{Re}}\left (\frac {\partial w}{\partial y}+\frac {\partial v}{\partial z}\right )\\[11pt] \rho w w+p-\frac {2\mu }{\textit{Re}}\left \{\frac {\partial w}{\partial z}-\frac {1}{3}(\boldsymbol{\nabla }\boldsymbol{\cdot }\boldsymbol{V})\right \}\\[11pt] \rho w E-\frac {\gamma \kappa }{\textit{Re} \textit{Pr}}\frac {\partial T}{\partial z}+\gamma (\gamma -1){M}^2 p w +\frac {\gamma (\gamma -1){M}^2\mu }{\textit{Re}}D_H \end{bmatrix}\!, \end{equation}
 \begin{equation} \boldsymbol{J}=\begin{bmatrix} 0\\[7pt] 0\\[7pt] (1-\rho )/{\textit{Fr}}^2\\[7pt] 0\\[7pt] \gamma (\gamma -1)(1-\rho )\left (\frac {M}{\textit{Fr}}\right )^2 v-(\gamma -1)(\boldsymbol{\nabla }\boldsymbol{\cdot }\boldsymbol{V}) \end{bmatrix}\!. \end{equation}
Here,
 $D_F$
,
 $D_G$
and
 $D_H$
represent the energy components associated with the flux vectors
 $\boldsymbol{F}$
,
 $\boldsymbol{G}$
and
 $\boldsymbol{H}$
, respectively, and are given as
 \begin{equation} D_F=\left [\frac {2}{3}u\left (-2\frac {\partial u}{\partial x}+\frac {\partial v}{\partial y}+\frac {\partial w}{\partial z}\right )-v\left (\frac {\partial v}{\partial x}+\frac {\partial u}{\partial y}\right )-w\left (\frac {\partial w}{\partial x}+\frac {\partial u}{\partial z}\right )\right ]\!, \end{equation}
 \begin{equation} D_G=\left [\frac {2}{3}v\left (\frac {\partial u}{\partial x}-2\frac {\partial v}{\partial y}+\frac {\partial w}{\partial z}\right )-u\left (\frac {\partial v}{\partial x}+\frac {\partial u}{\partial y}\right )-w\left (\frac {\partial w}{\partial y}+\frac {\partial v}{\partial z}\right )\right ]\!, \end{equation}
 \begin{equation} D_H=\left [\frac {2}{3}w\left (\frac {\partial u}{\partial x}+\frac {\partial v}{\partial y}-2\frac {\partial w}{\partial z}\right )-u\left (\frac {\partial w}{\partial x}+\frac {\partial u}{\partial z}\right )-v\left (\frac {\partial w}{\partial y}+\frac {\partial v}{\partial z}\right )\right ]\!. \end{equation}
The dimensionless velocity components
 $u$
,
 $v$
and
 $w$
, which together constitute the velocity vector
 $\boldsymbol{V}$
, are aligned with the Cartesian axes
 $x$
,
 $y$
and
 $z$
, respectively. The velocities are normalised by the free stream velocity
 $U_\infty$
, while the spatial coordinates are non-dimensionalised using the cylinder side length
 $L$
. The variables
 $\rho$
,
 $T$
,
 $\mu$
and
 $\kappa$
represent the non-dimensional density, temperature, dynamic viscosity and thermal conductivity, respectively, obtained by scaling with their corresponding free stream values. The time
 $t$
is non-dimensionalised using the residence time scale
 $L/U_\infty$
, and the thermodynamic (gauge) pressure,
 $p - p_\infty$
, is scaled by
 $\rho _\infty U_\infty ^2$
. Free stream quantities are denoted by the subscript ‘
 $\infty$
’.
In the NOB model, non-dimensionalisation of the governing equations introduces the dimensionless parameters: the Reynolds number
 $\textit{Re} = \rho _\infty U_\infty D / \mu _\infty$
, the Prandtl number
 $\textit{Pr} = \mu _\infty {C_p}_\infty / \kappa _\infty$
, the Froude number
 $\textit{Fr} = U_\infty / \sqrt {\textit{gD}}$
and the Mach number
 $M = U_\infty / a_\infty$
, where
 $a_\infty$
denotes the free stream speed of sound and
 ${C_p}_\infty$
is the free stream specific heat at constant pressure.
To close the set of governing equations, the thermodynamic state relations are employed and expressed in non-dimensional form as follows:
 \begin{equation} \rho =\frac {1+\gamma M^{2}p}{T}, \end{equation}
 \begin{equation} E=e+\frac {\gamma (\gamma -1)}{2}{M}^2(u^2+v^2+w^2). \end{equation}
Here, the symbol
 $E$
represents the total specific energy in non-dimensional form. The dimensionless specific internal energy is defined as
 \begin{equation} e = \int _{1}^{T} C_v(T)\, \text{d}T + e_{\infty }, \end{equation}
where
 $C_v$
is the dimensionless specific heat at constant volume and the reference value
 $e_{\infty }$
is set to unity. To minimise compressibility effects, a low Mach number (
 $M = 0.1$
) is employed. The Froude number is fixed at
 $\textit{Fr} = 1$
and the specific heat ratio is set to
 $\gamma = 1.4$
. The molecular transport properties (
 $\mu$
,
 $\kappa$
and
 $C_v$
) are considered temperature-dependent, with air modelled as a thermally perfect gas. The values of
 $\kappa$
and
 $C_v$
are determined using least-squares curve fitting of property data (Ghoshdastidar Reference Ghoshdastidar2012; Ali et al. Reference Ali, Hasan and Sanghi2024), while
 $\mu$
is evaluated using Sutherland’s law.
In the present DNS study, the governing equations, originally formulated in Cartesian coordinates (2.1), are transformed into body-fitted curvilinear coordinates (see Appendix A). The system of (2.1) is solved using a modified version of the PVU-M+ scheme, details of which are provided in Appendix B. As demonstrated by Hasan et al. (Reference Hasan, Khan and Shameem2015), the PVU-M+ scheme is a flux-based method that provides robustness, accuracy and computational efficiency for solving the Navier–Stokes equations across a broad range of Mach numbers. To establish reliability and accuracy, the present NOB model has been validated against previous studies on 3-D wake transition conducted using experimental, DNS and Floquet analyses (Ali et al. Reference Ali, Hasan and Sanghi2024). For these validation studies, a refined O-type body-fitted mesh (see § 2.2) was employed together with appropriate initial and boundary conditions (see § 2.3).
2.2. Computational domain formulation and mesh generation
Figure 1(a) presents the computational configuration employed in the present study. It consists of an infinite-span square cylinder of side length
 $L$
, placed within a truncated spanwise-periodic domain of length
 $H_z$
. The cylinder surface is maintained at a constant temperature
 $T_w$
and exposed to a uniform cross-flow. The incoming fluid, with a free stream velocity
 $U_\infty$
and temperature
 $T_\infty$
, is characterised by a Prandtl number of
 $\textit{Pr} = 0.71$
. The flow field is described using a Cartesian coordinate system
 $(x, y, z)$
, where gravity acts in the negative
 $y$
-direction, the incoming flow makes an inclination angle
 $\alpha$
relative to gravity and the spanwise direction is aligned with the
 $z$
-axis. To ensure computational efficiency while preserving solution accuracy, the cylinder is enclosed within a cylindrical outer boundary of radius 60
 $L$
, determined from the domain-independence test (Ali et al. Reference Ali, Hasan and Sanghi2024). The axis of this cylindrical boundary coincides with that of the square cylinder.
(a) Computational set-up showing a periodic span of length
 $H_z$
for an infinitely long, uniformly heated square cylinder subjected to a cross-flow
 $(U_\infty , T_\infty )$
inclined at an angle
 $\alpha$
to gravity
 $\boldsymbol{g}$
. (b) Close-up view of the O-type body-fitted mesh near one corner of the cylinder in the
 $x$
–
 $y$
plane.

Since the spanwise direction is theoretically infinite, periodic boundary conditions are imposed to capture 3-D instability modes while eliminating end effects. Previous studies on unheated square cylinders (Sohankar et al. Reference Sohankar, Norberg and Davidson1999; Saha et al. Reference Saha, Biswas and Muralidhar2003; Agbaglah & Mavriplis Reference Agbaglah and Mavriplis2017) established that a spanwise domain length of
 $H_z = 6L$
is sufficient to resolve the longest wavelength of Mode-A instability. For heated cylinders, Ren et al. (Reference Ren, Rindt and Van Steenhoven2006b
) demonstrated that
 $H_z = 4L$
, corresponding to twice the Mode-E wavelength (
 $\lambda _z/L = 2$
), is adequate for capturing all relevant instability modes. Therefore, for both heated and unheated cases, a spanwise extent of
 $H_z = 6L$
is generally sufficient to achieve reliable results with both qualitative and quantitative accuracy. In the present simulations, this domain length is adopted to ensure accuracy while maintaining computational efficiency.
In this study, the 3-D wake transition under buoyancy effects is examined for two distinct flow orientations:
 $\alpha = 0^\circ$
and
 $\alpha =90^\circ$
. The configuration with
 $\alpha = 0^\circ$
is defined as the aiding-buoyancy case, where the free stream flow aligns opposite with gravity, thereby enhancing buoyancy effects. In contrast, the configuration with
 $\alpha = 90^\circ$
represents the cross-buoyancy case, where the free stream flow is oriented perpendicular to gravity, resulting in a fundamentally different interaction between inertial and buoyancy forces.
As the analysis involves different free stream orientations relative to gravity, generating separate meshes for each configuration would be both impractical and computationally expensive. To overcome this, a body-fitted coordinate system is adopted, which enables accurate resolution of the flow field for all orientations without the need for re-meshing, thereby enhancing consistency, accuracy and efficiency. The computational domain is therefore constructed using an O-type body-fitted mesh, which is first generated in the
 $x$
–
 $y$
plane following the procedure outlined by Thompson et al. (Reference Thompson, Warsi and Mastin1985), and then extruded uniformly in the spanwise direction to a length of
 $H_z = 6L$
. A grid independence study (Ali et al. Reference Ali, Hasan and Sanghi2024) determined that a mesh with 281, 355 and 61 points in the
 $\xi$
,
 $\eta$
and
 $z$
directions, respectively, provides a suitable balance of accuracy and efficiency.
Figure 1(b) presents a magnified view of the O-type body-fitted mesh near one of the cylinder corners in the
 $x$
–
 $y$
plane, highlighting the local grid refinement in the vicinity of the body. Although the minimum grid spacing is
 $1.7 \times 10^{-3}$
, the mesh is carefully designed to maintain moderate local aspect ratios in regions of strong gradients, with values in the vicinity of the square cylinder lying within the range
 $1.2 \leqslant \textit{AR} \leqslant 5.5$
. Grid stretching is applied smoothly to avoid abrupt variations in cell size and to minimise numerical errors associated with grid anisotropy. The adopted grid resolution is sufficient to accurately capture the 3-D wake structures and provides reliable qualitative and quantitative results. Additional details regarding grid distribution, sensitivity analysis and validation of DNS accuracy are provided by Ali et al. (Reference Ali, Hasan and Sanghi2024). For this grid, time steps of
 $\Delta t = 10^{-4}$
and
 $\Delta t = 5 \times 10^{-5}$
are employed in the simulations of unheated and heated cylinders, respectively, ensuring numerical stability and reliable results.
2.3. Initial and boundary conditions
The initial conditions are specified using undisturbed free stream values corresponding to a location far from the cylinder. In non-dimensional form, they are given as
 $\boldsymbol{V} = \sin {\alpha } \hat {i} + \cos {\alpha } \hat {j} + 0 \hat {k}$
,
 $\rho = 1$
,
 $T = 1$
and
 $p = 0$
. Here
 $\hat {i}$
,
 $\hat {j}$
and
 $\hat {k}$
represent the Cartesian unit vectors along the
 $x$
-,
 $y$
- and
 $z$
-axes, respectively. The streamwise direction varies with the flow orientation, aligning with the
 $y$
-axis for aiding buoyancy (
 $\alpha = 0^\circ$
) and with the
 $x$
-axis for cross-buoyancy (
 $\alpha = 90^\circ$
).
At the cylinder surface, a constant wall temperature
 $T_w$
is imposed to model uniform heating, while the no-slip and no-penetration conditions are enforced for velocity to satisfy the physical constraints of viscous flow at a solid boundary. The pressure at the solid boundary is obtained from the normal component of the momentum equation for compressible gas flow (2.1). Once the pressure and temperature at the solid boundary are updated, the density at the solid boundary is evaluated using the equation of state to ensure thermodynamic consistency. A similar boundary treatment for compressible flows has been adopted in previous studies (Arif & Hasan 2019, 2020, 2021; Ali et al. Reference Ali, Hasan and Sanghi2023b
, Reference Ali, Hasan and Sanghi2024).
At the inflow and outflow, characteristic numerical boundary conditions based on wave propagation speeds (Hirsch Reference Hirsch2007) are imposed along the local normal to the artificial boundary. Among the four wave families, the two acoustic waves determine the non-dimensional Riemann invariants, while the entropy wave controls pressure, and the shear wave dictates the tangential and spanwise velocity components. This formulation ensures compatibility with the local one-dimensional inviscid approximation at the artificial boundaries. After the Riemann invariants are determined at the boundary points, the normal velocity component and temperature are determined, and the computed normal and tangential velocity components are subsequently transformed to obtain the Cartesian velocity components
 $(u, v)$
in the spanwise
 $x$
–
 $y$
plane.
For incoming waves, the corresponding characteristic variables are prescribed using free stream values, whereas for outgoing waves, they are extrapolated from the interior solution. At the outflow, however, the pressure is specifically treated using the linearised characteristic boundary condition, proposed by Bayliss & Turkel (Reference Bayliss and Turkel1982), expressed in dimensionless form as
 \begin{equation} \frac {\partial p}{\partial t}-\left (\frac {1}{M}\right )\frac {\partial V_N}{\partial t}=0, \end{equation}
where
 $M$
is the free stream Mach number and
 $V_N$
is the normal velocity component. Once the pressure is obtained from (2.12) and the temperature is evaluated from interior values, the density is subsequently computed using the equation of state, ensuring consistency between the thermodynamic variables.
In the present computations employing the NOB model, the 2-D von Kármán instability, which is responsible for the onset of periodic vortex shedding, arises naturally without the need for externally imposed disturbances. This instability develops due to the presence of small perturbations introduced into the flow through truncation and round-off errors. Nevertheless, while such numerical disturbances are sufficient to sustain 2-D shedding, they are not strong enough to promote the growth of 3-D structures in the cylinder wake. As a result, an external perturbation becomes necessary to initiate 3-D instabilities. To achieve this, a random spanwise perturbation with a very small amplitude, of the order of
 $10^{-7}$
, is superimposed on the density field at the initial condition in the near-wake region. It is worth noting that perturbations of a similar order have been successfully employed by Agbaglah & Mavriplis (Reference Agbaglah and Mavriplis2017) and Ali et al. (Reference Ali, Hasan and Sanghi2023b
, Reference Ali, Hasan and Sanghi2024) to capture three-dimensionality in cylinder wakes, thereby providing confidence in the chosen approach. Furthermore, the decision to apply a spatially random perturbation, rather than enforcing a disturbance with a prescribed wavelength, is motivated by the need to eliminate any preferential bias towards a specific mode of instability. In this manner, the random disturbance introduces a broad spectrum of wavelengths, ensuring that the wake transition to three-dimensionality is consistently triggered by at least one wavelength contained within the perturbation spectrum.
2.4. Vorticity dynamics
The dimensionless vorticity transport equation, derived by taking the curl of the momentum equation (2.1), is written in vector form as
 \begin{equation} \frac {\text{D}\boldsymbol{\varOmega }}{\text{D}t}=(\boldsymbol{\varOmega }\boldsymbol{\cdot }{\boldsymbol{\nabla }})\boldsymbol{V}-(\boldsymbol{\nabla }\boldsymbol{\cdot }\boldsymbol{V})\boldsymbol{\varOmega } + \frac {1}{\rho ^2}\boldsymbol{\nabla }\rho \times \boldsymbol{\nabla }p - \frac {1}{\rho ^2}\boldsymbol{\nabla }\rho \times \boldsymbol{f_v} + (\varGamma _x\hat {i}+\varGamma _y\hat {j}+\varGamma _z\hat {k}) + \frac {1}{\rho }(\boldsymbol{\nabla }\times \boldsymbol{f_v}), \end{equation}
where
 $\boldsymbol{f_v}=\boldsymbol{\nabla }\boldsymbol{\cdot }\bar {\bar {\sigma }}$
denotes the viscous force per unit mass, with
 $\bar {\bar {\sigma }}$
representing the viscous stress tensor. The stress tensor components
 $\sigma _{ij}$
are expressed as
 \begin{equation} \sigma _{ij}=\frac {2\mu }{\textit{Re}}\left [S_{ij}-\frac {1}{3}\frac {\partial u_k}{\partial x_k} \delta _{ij} \right ]\!, \end{equation}
with
 $S_{ij}$
representing the strain-rate tensor and
 $\delta _{ij}$
the Kronecker delta.
In this formulation,
 $({\rm D}/{\text{D}t})$
denotes the material derivative and
 $\boldsymbol{\varOmega }$
represents the vorticity vector. The term
 $(\boldsymbol{\varOmega }\boldsymbol{\cdot }\boldsymbol{\nabla })\boldsymbol{V}$
corresponds to vortex stretching, while
 $(\boldsymbol{\nabla }\boldsymbol{\cdot }\boldsymbol{V})\boldsymbol{\varOmega }$
accounts for vorticity production due to volumetric straining. The baroclinic generation of vorticity, caused by the misalignment of density and pressure gradients, is represented by
 $(\boldsymbol{\nabla }\rho \times \boldsymbol{\nabla }p)/\rho ^2$
. The additional term
 $(\boldsymbol{\nabla }\rho \times \boldsymbol{f_v})/{\rho }^2$
accounts for vorticity production induced by stratification effects coupled with viscous forces, while
 $(\boldsymbol{\nabla }\times \boldsymbol{f_v})/\rho$
corresponds to vorticity diffusion caused by molecular viscous stresses.
In the near wake, pronounced density gradients
 $ (({\partial \rho }/{\partial x}), ({\partial \rho }/{\partial z} ))$
give rise to the buoyancy-induced baroclinic terms
 $\varGamma _x=({1}/{\textit{Fr}^2}) (({1}/{\rho ^2})({\partial \rho }/{\partial z}) )$
and
 $\varGamma _z=-( {1}/{\textit{Fr}^2}){} (({1}/{\rho ^2})({\partial \rho }/{\partial x} ))$
. It is important to note that there is no baroclinic production term for vorticity along the
 $y$
-direction (
 $\varGamma _y = 0$
). This arises because the source vector in (2.5) has no components in the
 $x$
- and
 $z$
-directions, and therefore its curl yields no contribution to the
 $y$
-component of vorticity. Furthermore, the baroclinic effects exert a strong influence on the evolution of the wake structures by modulating the onset, strength and spatial organisation of vortex shedding. They also play a crucial role in controlling the transition between 2-D and 3-D wake states, thereby altering the overall stability and dynamics of the flow. For this reason, the present study focuses on elucidating the key influence of buoyancy-induced baroclinic contributions on wake dynamics and their role in governing vortex-induced instabilities.
For the aiding configuration,
 $\partial /\partial x$
corresponds to the cross-stream gradient in the wake, whereas in the cross-flow configuration, it represents the streamwise gradient. These terms constitute additional sources of vorticity, supplementing the conventional mechanisms of vortex stretching and viscous diffusion. To clarify the wake dynamics near the cylinder under aiding- and cross-buoyancy configurations, table 1 summarises the coordinate directions corresponding to the streamwise, cross-stream and spanwise axes, along with their associated velocity components, vorticity components and baroclinic vorticity production rate components.
Mapping of coordinate directions, velocity components, vorticity components and baroclinic vorticity production terms under aiding- and cross-buoyancy configurations.

Table 1. Long description
A table with four rows and four columns. The columns are labeled ‘Buoyancy configurations’, ‘Streamwise’, ‘Cross-stream’, and ‘Spanwise’. The rows are labeled ‘Aiding buoyancy (alpha = 0 degree)’, ‘Cross-buoyancy (alpha = 90 degree)’, and two additional rows for the corresponding terms. Row 1: Aiding buoyancy (alpha = 0 degree), y, v, Omega_y, Gamma_y = 0, x, u, Omega_x, Gamma_x, z, w, Omega_z, Gamma_z. Row 2: Cross-buoyancy (alpha = 90 degree), x, u, Omega_x, Gamma_x, y, v, Omega_y, Gamma_y = 0, z, w, Omega_z, Gamma_z.
3. Buoyancy-modulated wake structure and dynamics
3.1. Three-dimensional vortical structures
In the presence of aiding buoyancy, distinct shapes of streamwise vorticity structures (
 $\varOmega _y$
) in the wake of a square cylinder at
 $\textit{Re} = 300$
are revealed with increasing heating levels, as shown in figure 2. At
 $\varepsilon = 0$
, a disordered rib-like structure containing four
 $\varOmega _y$
pairs (across the full span of 6
 $L$
) is observed in the isothermal wake of an unheated cylinder (figure 2
a). When the cylinder surface is heated to
 $\varepsilon = 0.3$
, the rib-like structure bifurcates into a braid-like pattern with two
 $\varOmega _y$
pairs (figure 2
b). With further increase in heating, tube-like structures emerge, featuring two
 $\varOmega _y$
pairs at
 $\varepsilon = 0.5$
(figure 2
c), and three pairs for
 $\varepsilon = 0.6$
to 1 (figure 2
d,e) in the heated cylinder wake. These wake structures corresponding to each
 $\varepsilon$
value persist throughout the time integration. However, except for the moderate heating case at
 $\varepsilon = 0.4$
, both braid-like and tube-like structures are observed throughout the simulated time period (see details in § 3.5). Table 2 presents an overview of the distinct 3-D wake structures, including rib-like, braid-like and tube-like shapes characterised by varying numbers of
 $\varOmega _y$
pairs as the heating level (overheat ratio
 $\varepsilon$
) increases. The findings reveal that, under aiding buoyancy, the initial rib-like vortical structure bifurcates into a braid-like pattern, which subsequently evolves into tube-like shapes with different vortex pair counts. Similar bifurcations of wake structures have been reported in previous studies (Williamson Reference Williamson1996; Robichaux et al. Reference Robichaux, Balachandar and Vanka1999; Sheard et al. Reference Sheard, Fitzgerald and Ryan2009; Agbaglah & Mavriplis Reference Agbaglah and Mavriplis2017), where the tongue-shaped vortical pattern associated with Mode-A instability transitions to the rib-like structure of Mode-B instability with increasing Reynolds number. However, in those cases, the cylinder surface is unheated.
Distinct vortical structures associated with varying
 $\varOmega _y$
pairs at
 $\textit{Re} = 300$
for
 $\varepsilon = 0$
-1 under aiding-buoyancy conditions (
 $\alpha = 0^\circ$
). The spanwise wavelength (
 $\lambda _z/L$
) is estimated from both flow visualisation and fast Fourier transform (FFT) analysis. At
 $\varepsilon = 0.4$
, braid-like (
 $\lambda _z/L = 3$
) and tube-like (
 $\lambda _z/L = 2$
) structures are observed at distinct temporal instances.

Table 2. Long description
A table with five rows and five columns. The columns are labeled Overheat ratio (ε), Shape(s), Ωy pairs, Wavelength (visualisation), and Wavelength (FFT). The rows present data as follows: Row 1: Overheat ratio (ε), 0-0.2; Shape(s), Rib-like; Ωy pairs, 4-5; Wavelength (visualisation), 1.2-1.5; Wavelength (FFT), 1.48. Row 2: Overheat ratio (ε), 0.3; Shape(s), Braid-like; Ωy pairs, 2; Wavelength (visualisation), 3; Wavelength (FFT), 3.05. Row 3: Overheat ratio (ε), 0.4; Shape(s), Braid and tube-like; Ωy pairs, 2 and 3; Wavelength (visualisation), 3 and 2; Wavelength (FFT), 3 and 2. Row 4: Overheat ratio (ε), 0.5; Shape(s), Tube-like; Ωy pairs, 2; Wavelength (visualisation), 3; Wavelength (FFT), 3. Row 5: Overheat ratio (ε), 0.6-1.0; Shape(s), Tube-like; Ωy pairs, 3; Wavelength (visualisation), 2; Wavelength (FFT), 2.
Isosurfaces of streamwise vorticity (
 $\varOmega _y$
) at
 $\textit{Re}=300$
and
 $t=1500$
showing (a) rib-like, (b) braid-like and (c–e) tube-like vortical structures with distinct vortex pairs across varying heating levels under aiding buoyancy (
 $\alpha =0^\circ$
). The magnitude of these vortex structures diminishes as heating levels rise, with yellow indicating positive values and blue indicating negative values.

Figure 2. Long description
Panel A: An isosurface plot shows rib-like vortical structures with distinct vortex pairs at epsilon equals 0.0 and omega y equals plus or minus 0.5. The x-axis ranges from 0 to 6, and the y-axis ranges from 0 to 15. Yellow indicates positive values, and blue indicates negative values. Panel B: An isosurface plot shows braid-like vortical structures at epsilon equals 0.3 and omega y equals plus or minus 0.3. The x-axis ranges from 0 to 6, and the y-axis ranges from 0 to 15. Yellow indicates positive values, and blue indicates negative values. Panel C: An isosurface plot shows tube-like vortical structures at epsilon equals 0.5 and omega y equals plus or minus 0.1. The x-axis ranges from 0 to 6, and the y-axis ranges from 0 to 15. Yellow indicates positive values, and blue indicates negative values. Panel D: An isosurface plot shows tube-like vortical structures at epsilon equals 0.6 and omega y equals plus or minus 0.05. The x-axis ranges from 0 to 6, and the y-axis ranges from 0 to 15. Yellow indicates positive values, and blue indicates negative values. Panel E: An isosurface plot shows tube-like vortical structures at epsilon equals 1.0 and omega y equals plus or minus 0.01. The x-axis ranges from 0 to 6, and the y-axis ranges from 0 to 15. Yellow indicates positive values, and blue indicates negative values.
Although distinct 3-D wake structures emerge with increasing heating, the magnitude of
 $\varOmega _y$
is observed to decline steadily, indicating that aiding buoyancy weakens the 3-D characteristics of the wake as
 $\varepsilon$
increases (see figure 2). At sufficiently large heating levels (e.g.
 $\varepsilon = 1$
), the
 $\varOmega _y$
structures are nearly extinguished, with magnitudes reduced to
 $\varOmega _y = \pm 0.01$
(figure 2
e), rendering them effectively negligible. This trend is quantitatively substantiated by the energy norms of
 $\varOmega _x$
and
 $\varOmega _y$
(see § 4.1), which show that, for
 $\varepsilon = 0.8$
–
 $1.0$
, the norm of
 $\varOmega _y$
collapses to the order of
 $10^{-2}$
. Taken together, these results provide compelling evidence that, at sufficiently high heating levels (
 $\varepsilon \gt 1$
), the streamwise vortical structures would vanish, leading to a transition towards an effectively two-dimensional wake.
Isosurfaces of streamwise vorticity (
 $\varOmega _x$
) at
 $t=1900$
showing disordered rib-like vortical structures with distinct vortex pairs in the presence of cross-buoyancy (
 $\alpha =90^\circ$
) for (a)
 $\varepsilon =0$
, (b)
 $\varepsilon =0.3$
, (c)
 $\varepsilon =0.6$
and (d)
 $\varepsilon =1.0$
. The growing magnitude of these vortical structures with increasing
 $\varepsilon$
values suggests a strengthening of wake three-dimensionality. Yellow and blue colours represent positive and negative values, respectively.

In contrast to the aiding-buoyancy case, cross-buoyancy at
 $\textit{Re} = 300$
(as illustrated in figure 3) produces only disordered rib-like streamwise vortical structures (
 $\varOmega _x$
) featuring distinct numbers of vortex pairs as the heating level
 $\varepsilon$
increases from 0 to 1. It is observed that, with increasing cylinder surface heating, the rib-like structures initially containing four
 $\varOmega _x$
pairs at
 $\varepsilon = 0$
(figure 3
a) reduce to three pairs for
 $\varepsilon = 0.3{-}0.6$
(figure 3
b,c), before ultimately stabilising at two pairs for the higher heating level
 $\varepsilon = 1.0$
(figure 3
d). This trend is further confirmed by the contours of
 $\varOmega _x$
in the
 $y$
–
 $z$
plane of the cylinder wake at various heating levels, as illustrated in figure 4. Table 3 summarises these variations in
 $\varOmega _x$
pairs across increasing heating levels. Notably, the number of vortex pairs corresponding to each
 $\varepsilon$
value in the cylinder wake remains consistent throughout the time integration, except for
 $\varepsilon = 0{-}0.2$
and
 $\varepsilon = 0.7$
, where the vortical structure intermittently alternates between configurations of 4–5 and 2–3 vortex pairs, respectively, at different time intervals (table 3).
Disordered rib-like vortical structures exhibiting variable
 $\varOmega _x$
vortex-pair counts at
 $\textit{Re} = 300$
with increasing
 $\varepsilon$
under cross-buoyancy conditions (
 $\alpha = 90^\circ$
). The spanwise wavelength (
 $\lambda _z/L$
) is evaluated using both flow visualisations and FFT algorithm.

Table 3. Long description
The table has five rows and five columns. The columns are labeled Overheat ratio, Shape(s), Ωx pairs, Wavelength (visualisation), and Wavelength (FFT). The rows present data as follows: Row 1: Overheat ratio, 0-0.2; Shape(s), Rib-like; Ωx pairs, 4-5; Wavelength (visualisation), 1.2-1.5; Wavelength (FFT), 1.53. Row 2: Overheat ratio, 0.3-0.6; Shape(s), Rib-like; Ωx pairs, 3; Wavelength (visualisation), 2; Wavelength (FFT), approximately 2. Row 3: Overheat ratio, 0.7; Shape(s), Rib-like; Ωx pairs, 2-3; Wavelength (visualisation), 2-3; Wavelength (FFT), 2.84. Row 4: Overheat ratio, 0.8-1.0; Shape(s), Rib-like; Ωx pairs, 2; Wavelength (visualisation), 3; Wavelength (FFT), 3.11.
Contours of streamwise vorticity (
 $\varOmega _x$
) in the
 $y$
–
 $z$
plane of the cylinder wake, showing distinct vortex pairs under cross-buoyancy (
 $\alpha = 90^\circ$
), for (a)
 $\varepsilon = 0$
, (b)
 $\varepsilon = 0.3$
, (c)
 $\varepsilon = 0.6$
and (d)
 $\varepsilon = 1$
.

Furthermore, in the presence of cross-buoyancy, it is observed that the magnitude of
 $\varOmega _x$
increases with rising
 $\varepsilon$
values (figure 3), indicating that the strength of wake three-dimensionality grows with higher heating levels. In contrast, with aiding buoyancy, the 3-D wake strength decreases (figure 2). This opposing behaviour in wake strength under aiding and cross-buoyancy is attributed to the baroclinic vorticity production terms
 $\varGamma _x$
and
 $\varGamma _z$
(2.13). A detailed analysis of the 3-D wake strength, quantified using the energy norms of vorticities, is presented in § 4.1.
In both buoyancy configurations, the spanwise wavelength (
 $\lambda _z/L$
) is first inferred qualitatively from flow visualisations by counting the number of vortex pairs across the full cylinder span (tables 2 and 3). This estimate is subsequently quantified via a fast Fourier transform (FFT) of the streamwise vorticity signal along the spanwise (
 $z$
) direction, evaluated at
 $(x,y) = (0,7)$
for the aiding-buoyancy case and
 $(7,0)$
for the cross-buoyancy case. The dominant mode is identified from the spectral peak, yielding
 $\lambda _z/L = 1/f_{\textit{peak}}$
, where
 $f_{\textit{peak}}$
denotes the spanwise spatial frequency (tables 2 and 3). The wake is subsequently classified based on both spanwise wavelength and structural characteristics. This constitutes a clear departure from earlier studies (Ali et al. Reference Ali, Hasan and Sanghi2023b
, Reference Ali, Hasan and Sanghi2024; Ren et al. Reference Ren, Rindt and van Steenhoven2006a
,
Reference Ren, Rindt and Van Steenhovenb
, Reference Ren, Rindt and van Steenhoven2007), where classification relied exclusively on wavelength. The present results demonstrate that distinct wake structures can emerge at comparable wavelengths, as observed for
 $\varepsilon = 0.3$
and
 $\varepsilon = 0.5$
in the aiding-buoyancy case (table 2).
The 3-D wake dynamics organise into three discrete wavelength regimes: long (
 $\lambda _z/L \approx 3$
), intermediate (
 $\lambda _z/L \approx 2$
) and short (
 $\lambda _z/L \approx 1.5$
). In canonical unheated-cylinder wakes (
 $\varepsilon = 0$
), the short-wavelength rib-like structures are well established as signatures of Mode-B instability (Robichaux et al. Reference Robichaux, Balachandar and Vanka1999; Luo et al. Reference Luo, Tong and Khoo2007; Sheard et al. Reference Sheard, Fitzgerald and Ryan2009; Choi et al. Reference Choi, Jang and Yang2012; Agbaglah & Mavriplis Reference Agbaglah and Mavriplis2017; Jiang & Cheng Reference Jiang and Cheng2018; Jiang et al. Reference Jiang, Cheng and An2018). Strikingly, the present results show that these rib-like structures persist at finite heating levels (
 $\varepsilon = 0.2$
) in both buoyancy configurations (tables 2 and 3). This persistence indicates that weak thermal forcing does not fundamentally alter the underlying instability mechanism governing the unheated wake.
More notably, the present study reveals the coexistence of fundamentally distinct 3-D wake structures at nearly identical intermediate wavelengths (
 $\lambda _z/L \approx 2$
), namely tube-like structures in aiding buoyancy and rib-like structures in cross-buoyancy (tables 2 and 3). This observation challenges the conventional wavelength-based classification paradigm and highlights the critical role of buoyancy orientation in determining the resulting wake structure. While Ren et al. (Reference Ren, Rindt and van Steenhoven2006a
,
Reference Ren, Rindt and Van Steenhovenb
) reported a similar rib-like structure at comparable wavelengths, classified as Mode-E instability, their study was limited to heated circular cylinders in cross-buoyancy conditions at lower Reynolds numbers (
 $\textit{Re} = 75$
–117), Richardson numbers (
 $Ri = 0.35$
–2.5) and
 $\textit{Pr} = 7$
, within the framework of the incompressible Boussinesq approximation. The present results therefore extend these findings to a broader dynamical regime and demonstrate that spanwise wavelength alone is insufficient to uniquely characterise 3-D wake states in thermally driven flows.
3.2. Time histories of drag and lift coefficients
The drag and lift coefficients,
 $C_D$
and
 $C_L$
, at a given free stream inclination angle
 $\alpha$
(measured relative to gravity, which acts opposite to the
 $y$
-axis; see figure 1
a), are defined as
 \begin{equation} C_D = C_x \sin \alpha + C_y \cos \alpha , \end{equation}
 \begin{equation} C_L = C_y \sin \alpha - C_x \cos \alpha . \end{equation}
Here,
 $C_x$
and
 $C_y$
denote the force coefficients in the
 $x$
- and
 $y$
-directions, respectively, given by
 \begin{equation} C_x = \frac {2F_x}{\rho _\infty U_\infty ^2 L H_z}, \end{equation}
 \begin{equation} C_y = \frac {2F_y}{\rho _\infty U_\infty ^2 L H_z}, \end{equation}
where
 $F_x$
and
 $F_y$
represent the total integrated force components in the
 $x$
- and
 $y$
-directions, respectively.
The force coefficients in the
 $x$
- and
 $y$
-directions, defined in (3.3) and (3.4), can be expressed in curvilinear coordinates based on the surface stress distribution as
 \begin{equation} C_x=\frac {1}{H_z}\int ^{H_z}_0\left \{\oint \frac {2}{|\tilde {J}|}\left (-p+\frac {4}{3\textit{Re}}\mu \boldsymbol{\nabla }.\boldsymbol{V}\right )\eta _x \,\text{d}\xi -\frac {2}{\textit{Re}}\oint \frac {1}{|\tilde {J}|} \mu \varOmega _z \eta _y \,\text{d}\xi \right \}\,\text{d}z, \end{equation}
 \begin{equation} C_y=\frac {1}{H_z}\int ^{H_z}_0\left \{\oint \frac {2}{|\tilde {J}|}\left (-p+\frac {4}{3\textit{Re}}\mu \boldsymbol{\nabla }.\boldsymbol{V}\right )\eta _y \,\text{d}\xi +\frac {2}{\textit{Re}}\oint \frac {1}{|\tilde {J}|} \mu \varOmega _z \eta _x \,\text{d}\xi \right \}\,\text{d}z. \end{equation}
The quantity
 $\tilde {J}$
is the determinant of the Jacobian of the transformation from computational coordinates to physical Cartesian coordinates, defined as
 \begin{equation} \tilde {J}=\xi _x \eta _y-\xi _y \eta _x. \end{equation}
The shear contributions are present in the form of integrals involving the surface vorticity
 $\varOmega _z$
along the
 $z$
-direction.
Time histories of
 $C_D$
and
 $C_L$
presented at
 $\textit{Re} = 300$
under aiding buoyancy (
 $\alpha = 0^\circ$
) for increasing heating levels (ai,aii)
 $\varepsilon =0$
, (bi,bii)
 $\varepsilon =0.2$
, (ci,cii)
 $\varepsilon =0.4$
and (di,dii)
 $\varepsilon =0.6$
. The progressive decrease in the amplitudes of
 $C_D$
and
 $C_L$
with increasing
 $\varepsilon$
indicates a weakening and eventual suppression of vortex shedding. The highlighted temporal signal at
 $\varepsilon = 0.2$
reveals the presence of large-scale vortex dislocations in the flow field.

Figure 5. Long description
Panel A1: A line graph shows the drag coefficient (C_D) over time (t) with values ranging from 1.4 to 1.6. Panel A2: A line graph shows the lift coefficient (C_L) over time (t) with values ranging from -1 to 1. Panel B1: A line graph shows the drag coefficient (C_D) over time (t) with values ranging from 1.3 to 1.5. Panel B2: A line graph shows the lift coefficient (C_L) over time (t) with values ranging from -0.5 to 0.5. Panel C1: A line graph shows the drag coefficient (C_D) over time (t) with values ranging from 1.49 to 1.51. Panel C2: A line graph shows the lift coefficient (C_L) over time (t) with values ranging from -0.03 to 0.03. Panel D1: A line graph shows the drag coefficient (C_D) over time (t) with values ranging from 1.8 to 2.0. Panel D2: A line graph shows the lift coefficient (C_L) over time (t) with values ranging from -0.03 to 0.03.
Time histories of
 $C_D$
and
 $C_L$
at
 $\textit{Re} = 300$
with cross-buoyancy (
 $\alpha = 90^\circ$
) shown for various heating levels (ai,aii)
 $\varepsilon =0$
, (bi,bii)
 $\varepsilon =0.2$
, (ci,cii)
 $\varepsilon =0.6$
and (di,dii)
 $\varepsilon =1$
. The reduction in the mean
 $C_L$
with increasing thermal input is attributed to the development of an asymmetric flow pattern.

The temporal variations of the
 $C_D$
and
 $C_L$
at
 $\textit{Re}=300$
for various heating levels under aiding- and cross-buoyancy conditions are presented in figures 5 and 6, respectively. Under aiding buoyancy, it is observed that with increasing
 $\varepsilon$
, the amplitudes of
 $C_D$
and
 $C_L$
gradually decrease, and eventually become zero at
 $\varepsilon = 0.6$
(figure 5). This indicates that vortex shedding is progressively weakened and ultimately suppressed as heat is added to the cylinder surface. Notably, this suppression does not occur abruptly; rather, it proceeds through a phase of intermittent shedding, evidenced by low-amplitude fluctuations at
 $\varepsilon = 0.4$
(figure 5
ci,cii). This intermittent shedding leads to the emergence of braid-like and tube-like structures in the heated cylinder wake at different time instances (see figure 14 in § 3.5). In cross-buoyancy conditions, the reduction in
 $C_L$
amplitude with increasing heating is more gradual (figure 6) compared with the aiding case (figure 5). Owing to the weakening of vortex shedding, this trend may suggest a further reduction at higher heating levels (
 $\varepsilon \gt 1$
). In both buoyancy scenarios, baroclinic vorticity production in the spanwise direction plays a critical role in the weakening or complete suppression of vortex shedding in the cylinder wake (see details in § 3.4).
It is observed that the mean
 $C_L$
under cross-buoyancy is negative and its magnitude increases with increasing
 $\varepsilon$
(figure 6). This is attributed to the development of an asymmetric flow pattern around the heated cylinder. Conversely, under aiding buoyancy, the flow remains symmetric, resulting in negligible variation in the mean
 $C_L$
(figure 5). These symmetric and asymmetric flow patterns, corresponding to aiding- and cross-buoyancy conditions, respectively, arise due to baroclinic vorticity production in the spanwise direction (see detailed discussion in § 4.2). It is also noteworthy that, compared with the symmetric flow (observed in both the aiding-buoyancy case and the isothermal wake at
 $\varepsilon = 0$
), the asymmetric flow pattern in the heated wake under cross-buoyancy leads to an earlier onset of vortex shedding, as evidenced by larger initial-time oscillations in the temporal profiles of the force coefficients (figure 6).
Furthermore, the intermittent irregularities observed in the
 $C_D$
and
 $C_L$
signals under both buoyancy scenarios (as depicted in figures 5 and 6) indicate the presence of chaotic wake dynamics. These irregularities are further influenced by small- and large-scale vortex dislocations in the flow field, which introduce additional unsteadiness in the wake. In aiding buoyancy, a significant drop in
 $C_D$
and
 $C_L$
amplitudes observed at
 $\varepsilon = 0.2$
during the time interval
 $t = 700$
–840 (figure 5
bi,bii) highlight the occurrence of large-scale vortex dislocations, as explained in detail in § 3.3.
3.3. Vortex dislocations
In previous studies on 3-D wake transition, the presence of vortex dislocations has been primarily examined in the wake of an unheated cylinder (Williamson Reference Williamson1992, Reference Williamson1996; Henderson Reference Henderson1997; Braza et al. Reference Braza, Faghani and Persillon2001; Behara & Mittal Reference Behara and Mittal2010; Jiang et al. 2016, 2018). These studies demonstrated that vortex dislocations significantly alter the wake structures and hydrodynamic characteristics. Early observations by Roshko (Reference Roshko1954) and later Bloor (Reference Bloor1964) linked these dislocations to intermittent velocity fluctuations in the wake of circular cylinders. In the present study, under aiding buoyancy, vortex dislocations are observed only at lower heating levels, as indicated by intermittent irregularities in the force coefficients data for
 $\varepsilon = 0{-}0.2$
, as shown in figure 5(ai,aii,bi,bii). In contrast, under cross-buoyancy conditions, both small- and large-scale dislocations persist across all heating levels (
 $0 \leqslant \varepsilon \leqslant 1$
), as reflected in the irregularities of the
 $C_L$
and
 $C_D$
data illustrated in figure 6.
Vortex dislocations in the flow field for the aiding configuration (
 $\alpha = 0^\circ$
) at
 $\textit{Re} = 300$
and
 $\varepsilon = 0.2$
, indicated by irregularities in the temporal data of (a) cross-stream velocity
 $u$
in the near wake at (
 $x = 2$
,
 $y = 0$
,
 $z = 3$
) and (b) lift coefficient
 $C_L$
. The black dots in the
 $C_L$
time series correspond to the vortical structures shown in figure 8.

Figure 7. Long description
Panel A: A line graph shows the cross-stream velocity (u) over time (t) in the near wake. The x-axis represents time (t) ranging from 700 to 840, and the y-axis represents the cross-stream velocity (u) ranging from -0.7 to 0.7. The graph highlights vortex dislocations indicated by irregularities in the data. Panel B: Another line graph displays the lift coefficient (C_L) over time (t). The x-axis represents time (t) ranging from 700 to 840, and the y-axis represents the lift coefficient (C_L) ranging from -0.3 to 0.3. Black dots on the graph correspond to specific vortical structures.
A significant reduction in the amplitudes of the force coefficients at
 $\varepsilon = 0.2$
with aiding buoyancy (highlighted by the rectangular box in figure 5
bi,bii) indicates the presence of large-scale dislocations in the flow field. The temporal variation of the cross-stream velocity component (
 $u$
) and lift coefficient (
 $C_L$
) within this highlighted zone, over a short time interval (
 $\Delta t = 140$
), is depicted in figure 7. Intermittent irregularities observed in these time series confirm the presence of large-scale dislocations. These irregularities are key indicators of the initial breakdown of the wake, which may lead to transition towards turbulence downstream. The occurrence of such intermittent dislocations at
 $\varepsilon = 0.2$
is further validated by the appearance of both ordered and disordered spanwise vorticity (
 $\varOmega _z$
) structures at different time instants (figure 8). As time progresses, disordered vortical structures emerge at
 $t = 750$
(figure 8
a), indicating the onset of large-scale dislocations propagating downstream in the cylinder wake. Subsequently, an ordered vortical structure reappears at
 $t = 765$
(figure 8
b), suggesting a temporary absence of dislocations. With further time progression, disordered structures re-emerge at
 $t = 783$
(figure 8
c), followed by a return to an ordered state at
 $t = 830$
(figure 8
d) as the dislocations exit the wake. These observations are consistent with the wake transition studies behind an unheated cylinder reported by Behara & Mittal (Reference Behara and Mittal2010) and Jiang et al. (Reference Jiang, Cheng and An2018), which demonstrated that vortex dislocations appear and disappear intermittently, spontaneously disrupting the wake structure over time. Therefore, it can be concluded that in the present wake transition study behind a heated cylinder, vortex dislocations play a significant role in the 3-D wake dynamics, particularly in altering both the wake structure and the associated hydrodynamic characteristics.
Isosurfaces of
 $\varOmega _z$
at distinct time instants illustrating (b,d) ordered and (a,c) disordered vortical structures for
 $\textit{Re} = 300$
,
 $\varepsilon = 0.2$
and
 $\alpha = 0$
. Positive and negative values of
 $\varOmega _z$
are represented by red and blue, respectively. The disruption of coherent structures by vortex dislocations leads to the emergence of disordered flow patterns.

The irregularities observed at
 $\varepsilon = 0.2$
under aiding buoyancy are progressively suppressed with increasing surface heating, as depicted in figure 5(ci,cii,di,dii), ultimately eliminating dislocations in the flow field. This suppression, evident for
 $\varepsilon \gt 0.2$
, is primarily attributed to the buoyancy-induced baroclinic vorticity production term
 $\varGamma _z$
, which indirectly weakens wake three-dimensionality by reducing and suppressing vortex shedding (see § 4.1 for details). A comparable mechanism was reported by Noto & Fujimoto (Reference Noto and Fujimoto2007) at
 $\textit{Re} = 300$
, where buoyancy reduced the amplitude of the spanwise velocity component (
 $w$
), thereby diminishing its influence, suppressing 3-D motion and eliminating vortex dislocations. However, their study was restricted to the small-scale heating regime (with a fixed
 $Ri = 0.3$
) for a circular cylinder, where wake structures are less chaotic than those of a square cylinder. Moreover, their analysis largely overlooked the role of baroclinic vorticity generation, which is shown in the present study to be a key mechanism governing dislocation suppression.
A consistent comparison between the non-Oberbeck–Boussinesq (NOB) parameter
 $\varepsilon$
and the Richardson number
 $Ri$
of Boussinesq flows is justified for small values of
 $\varepsilon$
, as demonstrated by Arif & Hasan (Reference Arif and Hasan2019). In the small-scale heating limit, they established the relation
 $\varepsilon /\textit{Fr}^2 = Ri$
. In the present study, the Froude number is taken as
 $\textit{Fr} = 1$
, which simplifies this relation to
 $\varepsilon \approx Ri$
. Accordingly,
 $\varepsilon = 0.3$
corresponds approximately to
 $Ri = 0.3$
, thereby enabling a consistent and physically meaningful comparison between the present NOB framework and the Boussinesq results reported by Noto & Fujimoto (Reference Noto and Fujimoto2007).
3.4. Vortex shedding
In the present wake transition flow study, the presence of buoyancy directly influences the spanwise vorticity patterns, thereby altering the shedding behaviour, as shown by the spatial distribution of
 $\varOmega _z$
in the cylinder wake at different
 $\varepsilon$
values under aiding buoyancy in figure 9(aii,bii,cii,dii,eii). At low heating levels (
 $\varepsilon = 0.2$
), strong vortex roll-up of
 $\varOmega _z$
is observed (figure 9
aii), enhancing circulation and thereby strengthening vortex shedding. As the heating level increases to
 $\varepsilon = 0.3$
, the vortex roll-up becomes weaker (figure 9
bii), reducing circulation and consequently weakening the shedding. With further increase in heating level (
 $\varepsilon \geqslant 0.5$
), vortex shedding is completely suppressed due to the absence of vortex roll-up. This is indicated by the formation of twin vortices attached near the wake and the appearance of a thermal plume-like structure downstream, as illustrated in figure 9(cii,dii,eii). The complete suppression of vortex shedding is also reflected by the zero amplitude of
 $C_L$
(as shown at
 $\varepsilon =0.6$
in figure 5). Notably, this suppression does not occur abruptly but rather through an intermediate stage of intermittent vortex shedding. A detailed analysis of this intermittent shedding at
 $\varepsilon = 0.4$
with aiding buoyancy is presented in § 3.5.
Spatial distributions of (ai,bi,ci,di,ei)
 $\varGamma _z$
and (aii,bii,cii,dii,eii)
 $\varOmega _z$
at
 $\textit{Re} = 300$
shown for different values of
 $\varepsilon$
under aiding buoyancy conditions (
 $\alpha = 0^\circ$
). The generation of plume-like
 $\varGamma _z$
structures with a sign opposite to that of
 $\varOmega _z$
plays a significant role in weakening and suppressing vortex shedding in the cylinder wake.

Figure 9. Long description
Panel A1: A contour plot showing spatial distribution of a variable at epsilon equals 0.2. The x-axis ranges from -2 to 2, and the y-axis ranges from 0 to 10. The color scale ranges from -0.2 to 0.2. Panel A2: A contour plot showing spatial distribution of another variable at epsilon equals 0.2. The x-axis ranges from -2 to 2, and the y-axis ranges from 0 to 10. The color scale ranges from -1.5 to 1.5. Panel B1: A contour plot showing spatial distribution of a variable at epsilon equals 0.3. The x-axis ranges from -2 to 2, and the y-axis ranges from 0 to 10. The color scale ranges from -0.2 to 0.2. Panel B2: A contour plot showing spatial distribution of another variable at epsilon equals 0.3. The x-axis ranges from -2 to 2, and the y-axis ranges from 0 to 10. The color scale ranges from -1.5 to 1.5. Panel C1: A contour plot showing spatial distribution of a variable at epsilon equals 0.5. The x-axis ranges from -2 to 2, and the y-axis ranges from 0 to 10. The color scale ranges from -0.2 to 0.2. Panel C2: A contour plot showing spatial distribution of another variable at epsilon equals 0.5. The x-axis ranges from -2 to 2, and the y-axis ranges from 0 to 10. The color scale ranges from -1.5 to 1.5. Panel D1: A contour plot showing spatial distribution of a variable at epsilon equals 0.8. The x-axis ranges from -2 to 2, and the y-axis ranges from 0 to 10. The color scale ranges from -0.2 to 0.2. Panel D2: A contour plot showing spatial distribution of another variable at epsilon equals 0.8. The x-axis ranges from -2 to 2, and the y-axis ranges from 0 to 10. The color scale ranges from -1.5 to 1.5. Panel E1: A contour plot showing spatial distribution of a variable at epsilon equals 1.0. The x-axis ranges from -2 to 2, and the y-axis ranges from 0 to 10. The color scale ranges from -0.2 to 0.2. Panel E2: A contour plot showing spatial distribution of another variable at epsilon equals 1.0. The x-axis ranges from -2 to 2, and the y-axis ranges from 0 to 10. The color scale ranges from -1.5 to 1.5.
Spatial distributions of spanwise vorticity transport terms at
 $\textit{Re} = 300$
and
 $\varepsilon = 1$
under aiding-buoyancy conditions (
 $\alpha = 0^\circ$
): (a) baroclinic torque
 $(\boldsymbol{\nabla }\rho \times \boldsymbol{\nabla }p)/\rho ^2$
; (b) vortex stretching
 $(\boldsymbol{\varOmega } \boldsymbol{\cdot }\boldsymbol{\nabla })\boldsymbol{V}$
; (c) dilatation
 $-(\boldsymbol{\nabla }\boldsymbol{\cdot }\boldsymbol{V})\boldsymbol{\varOmega }$
; (d) density-viscous coupling
 $-(\boldsymbol{\nabla }\rho \times \boldsymbol{f_v})/\rho ^2$
and (e) viscous diffusion
 $(\boldsymbol{\nabla }\times \boldsymbol{f_v})/\rho$
.

The weakening and eventual suppression of vortex shedding, as evidenced by diminished vortex roll-up of
 $\varOmega _z$
, is primarily governed by the spanwise baroclinic vorticity production term
 $\varGamma _z$
. The spatial distribution of
 $\varGamma _z$
under aiding buoyancy for various
 $\varepsilon$
values are illustrated in figure 9(ai,bi,ci,di,ei). As
 $\varepsilon$
increases,
 $\varGamma _z$
vortices initially occupy a small downstream region at
 $\varepsilon = 0.2$
–0.3 (figure 9
ai,bi), then elongate into a larger, plume-like structure for
 $\varepsilon \geqslant 0.5$
(figure 9
ci,di,ei). This evolution indicates that
 $\varGamma _z$
strengthens with higher heating levels. Notably, these plume-like
 $\varGamma _z$
vortices possess a sign opposite to that of the
 $\varOmega _z$
vortices, which weakens shear-layer instability, inhibits vortex roll-up and reduces near-wake circulation for
 $\varepsilon \geqslant 0.5$
. As a result, vortex shedding is completely suppressed, as evidenced by the continuous, downstream-advecting vorticity without roll-up. At lower heating levels (
 $\varepsilon = 0.2$
–0.3), however,
 $\varGamma _z$
remains too weak to fully suppress shedding.
These observations indicate that vortex-shedding suppression is governed by the generation of plume-like
 $\varGamma _z$
structures that oppose the local
 $\varOmega _z$
vorticity. To provide evidence in support of this mechanism, the spatial distributions of the remaining spanwise terms in the vorticity transport equation (2.13) (see § 2.4) are examined for the strongly heated case (
 $\varepsilon = 1$
), as shown in figure 10. The spanwise baroclinic pressure torque
 $(\boldsymbol{\nabla }\rho \times \boldsymbol{\nabla }p)/\rho ^2$
is significantly amplified and exhibits the same sign (figure 10
a) as the corresponding local
 $\varOmega _z$
(figure 9
eii). This alignment can only strengthen the shear layers, thereby promoting vortex roll-up and sustained shedding, and therefore cannot lead to vortex shedding suppression. The viscous diffusion term
 $(\boldsymbol{\nabla }\times \boldsymbol{f_v})/\rho$
is also significant within the wake; however, as it produces both positive and negative contributions (figure 10
e) in regions of positive and negative
 $\varOmega _z$
, its net effect remains essentially neutral and does not have a decisive impact on the shedding process.
The remaining terms such as vortex stretching
 $(\boldsymbol{\varOmega } \boldsymbol{\cdot }\boldsymbol{\nabla })\boldsymbol{V}$
(figure 10
b), dilatation
 $-(\boldsymbol{\nabla }\boldsymbol{\cdot }\boldsymbol{V})\boldsymbol{\varOmega }$
(figure 10
c) and density–viscous coupling
 $-(\boldsymbol{\nabla }\rho \times \boldsymbol{f_v})/\rho ^2$
(figure 10
d) exhibit spatial distributions similar to that of viscous diffusion, but are substantially weaker in magnitude. Moreover, these terms are confined to a small region in the immediate vicinity of the cylinder surface, rendering their overall contribution to vortex-shedding suppression negligible. It therefore follows that
 $\varGamma _z$
dominates the spanwise vorticity budget and that the suppression is governed primarily by its sign relative to
 $\varOmega _z$
.
Spatial distributions of (ai,bi,ci)
 $\varGamma _z$
and (aii,bii,cii)
 $\varOmega _z$
at
 $\textit{Re} = 300$
shown for
 $\varepsilon = 0.2$
, 0.6, and 1 under cross-buoyancy conditions (
 $\alpha = 90^\circ$
). The production of exclusively positive
 $\varGamma _z$
vortices on the upstream side (
 $-1 \lt x \lt 0.5$
) within the boundary layers strengthens the positive
 $\varOmega _z$
while weakening the negative
 $\varOmega _z$
, leading to irregular and weakened vortex shedding in the cylinder wake.

In the case of cross-buoyancy, the vortex shedding behaviour becomes more complex compared with aiding buoyancy. This complexity arises due to the generation of only positive
 $\varGamma _z$
vortices in the upstream region (
 $-1 \lt x \lt 0.5$
) within the boundary layers, as shown in figure 11(ai,bi,ci). In this configuration, positive
 $\varGamma _z$
is generated in the upper region of the cylinder (figure 11
ai,bi,ci), which is opposite in sign to the corresponding
 $\varOmega _z$
vortices (figure 11
aii,bii,cii). Conversely, in the lower region,
 $\varGamma _z$
shares the same sign as
 $\varOmega _z$
. As a result, the shear layer instability in the upper region is reduced, leading to weakened vortex roll-up and weaker
 $\varOmega _z$
vortices (of negative sign), whereas in the lower region, the instability is enhanced, resulting in stronger vortex roll-up and intensified
 $\varOmega _z$
vortices (of positive sign). This asymmetry between the positive and negative
 $\varOmega _z$
components becomes increasingly evident with increasing heating, as illustrated in figure 11(aii,bii,cii). In particular, the lower-region
 $\varOmega _z$
vortices of positive sign clearly dominate in both size and structural coherence, with these vortical patches originating from the cylinder walls. Furthermore, the variation in their relative strength with increasing
 $\varepsilon$
is quantitatively confirmed through the energy norms of the positive and negative
 $\varOmega _z$
components (see figure 18
b of § 4.2).
These findings differ from those reported by Ren et al. (Reference Ren, Rindt and Van Steenhoven2006b
). Their study showed that the negative
 $\varGamma _z$
generated in the vicinity of the cylinder dominates over the positive
 $\varGamma _z$
. Based on this observation, they concluded that the negative
 $\varGamma _z$
weakens the lower primary (positive
 $\varOmega _z$
) vortices while strengthening the upper primary (negative
 $\varOmega _z$
) vortices. In contrast, the present study demonstrates that the positive
 $\varGamma _z$
vorticity production generated in the upstream boundary-layer region is stronger than the negative ones. This finding is further supported by the quantitative analysis of the energy norms of both the positive and negative
 $\varGamma _z$
contributions (see figure 18
d in § 4.2).
This discrepancy can be attributed to differences in the modelling framework and heating regime. The study of Ren et al. (Reference Ren, Rindt and Van Steenhoven2006b
) was restricted to the small-scale heating regime and employed the Boussinesq approximation (
 $Ri=1$
), under which density variations are assumed to be small and fluid transport properties remain nearly constant. In contrast, the present study considers a large-scale heating regime using the NOB framework, in which the cylinder is subjected to substantially stronger heating. The resulting large temperature gradients induce significant variations in the fluid properties, leading to the generation of stronger positive
 $\varGamma _z$
in the upstream boundary layers. Consequently, the positive
 $\varGamma _z$
becomes dominant, suppressing the upper (negative)
 $\varOmega _z$
vortices while strengthening the lower (positive)
 $\varOmega _z$
vortices. As the heating parameter
 $\varepsilon$
increases, the asymmetry between the strengths of the upper and lower
 $\varOmega _z$
vortices becomes more pronounced, which progressively weakens the overall vortex shedding in the cylinder wake under cross-buoyancy.
It is worth noting that, under the Oberbeck–Boussinesq approximation, thermal and buoyancy effects are inherently inseparable, whereas the NOB framework enables these effects to be distinguished explicitly. Using the NOB model, Ali et al. (Reference Ali, Hasan and Sanghi2024) revealed the competing roles of thermal and buoyancy effects in governing wake three-dimensionality. Consequently, in the large-scale heating regime, the additional physical effects retained in the NOB framework can lead to both quantitative and potentially qualitative differences relative to the classical Oberbeck–Boussinesq model.
In addition to the weakening of vortex shedding under cross-buoyancy, the
 $\varGamma _z$
vortices, which exhibit significant difference in the strength of positive and negative components, also contribute to the asymmetric wake pattern behind the heated cylinder. In contrast, under aiding buoyancy, the difference in the strength of
 $\varGamma _z$
vortices of both signs with varying
 $\varepsilon$
is negligible, resulting in a symmetric wake pattern. The contrasting wake behaviours, namely symmetric and asymmetric, under aiding- and cross-buoyancy conditions are discussed in detail in § 4.2. Moreover, it is worth noting that the vortex shedding under cross-buoyancy is relatively stronger than that observed with aiding buoyancy. This is evident from the more rapid decline in
 $C_L$
amplitude with increasing heating in the aiding buoyancy case compared to cross-buoyancy (see figures 5 and 6).
3.5. Intermittent shedding at
 $\varepsilon = 0.4$
under aiding buoyancy

As discussed in § 3.4, under aiding buoyancy conditions, the introduction of surface heating causes the initially strong vortex shedding to progressively weaken and ultimately become suppressed. This suppression does not occur abruptly; rather, it proceeds through an intermediate regime characterised by intermittent vortex shedding. The occurrence of intermittent shedding is evidenced by low-amplitude fluctuations in the temporal evolution of lift coefficient (
 $C_L$
) at an intermediate heating level of
 $\varepsilon = 0.4$
, as illustrated in figure 12.
It is noteworthy that the low-amplitude fluctuations in the
 $C_L$
time histories at
 $\varepsilon = 0.4$
(figure 12) exhibit a noticeable asymmetry between their positive and negative excursions, suggesting the persistence of biased vortex shedding. To quantitatively characterise this asymmetry, the skewness of the
 $C_L$
signal is evaluated, defined as
 \begin{equation} \mathrm{Skewness} =\frac {\Big \langle \left (C_L-\overline {C_L}\right )^3 \Big \rangle }{\sigma _{C_L}^3}, \end{equation}
where
 $\overline {C_L}$
and
 $\sigma _{C_L}$
denote the mean and standard deviation of the lift coefficient, respectively.
The computed skewness is
 $0.53$
, indicating a slight bias towards positive excursions in the lift-coefficient fluctuations, although the overall asymmetry remains weak. Nevertheless, this observation confirms the persistence of asymmetry in the intermediate heating regime and supports the interpretation of biased weak vortex shedding.
Time history of
 $C_L$
at
 $\varepsilon = 0.4$
exhibiting low-amplitude fluctuations, indicative of intermittent vortex shedding. The instantaneous points marked as (a), (b), (c), and (d) in the
 $C_L$
signal correspond to the vortical structures at the respective time instants presented in figures 13 and 14.

Isosurfaces of
 $\varGamma _x = \pm 0.03$
for
 $\varepsilon = 0.4$
,
 $\textit{Re} = 300$
, and
 $\alpha = 0^\circ$
, shown at different time instants: (a)
 $t = 1140$
; (b)
 $t = 1340$
; (c)
 $t = 1540$
and (d)
 $t = 1740$
. Positive and negative values are represented by yellow and brown colours, respectively.

(ai,bi,ci,di) Isosurfaces of
 $\varOmega _y=\pm 0.2$
and (aii,bii,cii,dii) contours of
 $\varOmega _z$
shown at different time instants for
 $\varepsilon =0.4$
,
 $\textit{Re}=300$
and
 $\alpha =0^\circ$
. The braid-like structures are associated with weak vortex shedding, while the tube-like structures correspond to near-suppressed shedding.

Figure 14. Long description
Panel A1: A 3D plot showing isosurfaces of two parameters at time t = 1140. The axes are labeled z (0 to 6) and y (0 to 15). The plot features yellow and blue structures indicating different values of the parameters. Panel A2: A contour plot showing the distribution of another parameter at the same time instant. The axes are labeled x (-2 to 2) and y (0 to 10), with a color scale ranging from -1.5 to 1.5. Panel B1: A 3D plot showing isosurfaces of the same two parameters at time t = 1340. The axes are labeled z (0 to 6) and y (0 to 15). The plot features yellow and blue structures indicating different values of the parameters. Panel B2: A contour plot showing the distribution of another parameter at the same time instant. The axes are labeled x (-2 to 2) and y (0 to 10), with a color scale ranging from -1.5 to 1.5. Panel C1: A 3D plot showing isosurfaces of the same two parameters at time t = 1540. The axes are labeled z (0 to 6) and y (0 to 15). The plot features yellow and blue structures indicating different values of the parameters. Panel C2: A contour plot showing the distribution of another parameter at the same time instant. The axes are labeled x (-2 to 2) and y (0 to 10), with a color scale ranging from -1.5 to 1.5. Panel D1: A 3D plot showing isosurfaces of the same two parameters at time t = 1740. The axes are labeled z (0 to 6) and y (0 to 15). The plot features yellow and blue structures indicating different values of the parameters. Panel D2: A contour plot showing the distribution of another parameter at the same time instant. The axes are labeled x (-2 to 2) and y (0 to 10), with a color scale ranging from -1.5 to 1.5.
The baroclinic torque
 $\varGamma _x$
at
 $\varepsilon =0.4$
under aiding buoyancy exhibits distinct spatial structures at different time instants, as shown in figure 13. These structures are qualitatively similar to braid-like and tube-like vortical configurations. The braid-like
 $\varGamma _x$
structures observed at
 $t=1140$
(figure 13
a) and
 $t=1540$
(figure 13
c) are associated with positive excursions of
 $C_L$
, whereas the tube-like structures at
 $t=1340$
(figure 13
b) and
 $t=1740$
(figure 13
d) correspond to negative excursions of
 $C_L$
. These observations suggest that the persistence of asymmetry at
 $\varepsilon =0.4$
under aiding buoyancy is primarily governed by 3-D effects induced by the baroclinic torque
 $\varGamma _x$
. Moreover, baroclinic vorticity generation significantly influences the wake morphology, resulting in the emergence of braid-like and tube-like structures in the wake of the heated cylinder (see table 2). It can therefore be concluded that
 $\varGamma _x$
under aiding buoyancy plays a crucial role in the modulation and bifurcation of the wake dynamics.
Furthermore, at
 $\varepsilon = 0.4$
, the intermittent regime is characterised by alternating phases of weak and highly attenuated shedding, as evidenced by the spatial distribution of
 $\varOmega _z$
at different time instants, shown in figure 14(aii,bii,cii,dii). In the intermittent shedding regime, braid-like vortical structures, comprising two
 $\varOmega _y$
pairs spanning the entire cylinder length (figure 14
ai,ci), are observed at
 $t = 1140$
and
 $t = 1540$
during the weak shedding phases (figure 14
aii,cii). In contrast, tube-like structures, consisting of three
 $\varOmega _y$
pairs (figure 14
bi,di), appear at
 $t = 1340$
and
 $t = 1740$
, corresponding to phases of near-suppressed shedding (figure 14
bii,dii), indicative of very weak residual oscillations rather than complete cessation.
These results indicate that under aiding buoyancy, the emergence of distinct vortical structures is strongly linked to the vortex shedding strength. This correlation is also evident in figures 2 and 9, where rib-like and braid-like streamwise vorticity structures are associated with strong and weak shedding, respectively, while tube-like structures correspond to suppressed shedding or near-suppressed shedding. In the case of cross-buoyancy, rib-like structures are observed during both strong and weak vortex shedding (as shown in figures 3 and 11), unlike in aiding buoyancy, where such structures occur only during strong shedding. This distinction arises because the vortex shedding under cross-buoyancy is comparatively stronger than that in aiding buoyancy. This is supported by the rapid decline in
 $C_L$
amplitude with increasing heating in the aiding buoyancy scenario relative to cross-buoyancy (see figures 5 and 6).
4. Vorticity energy norms
4.1. Quantification of wake three-dimensionality
A qualitative assessment of wake three-dimensionality indicates that increasing heating suppresses the strength of 3-D structures under aiding buoyancy, while it enhances them under cross-buoyancy, as discussed in § 3.1. This opposing behaviour highlights the fundamentally different roles of buoyancy orientation in modulating wake dynamics and suggests that baroclinic vorticity generation in the near wake acts as the primary mechanism governing this transition. To substantiate this interpretation, a quantitative analysis based on vorticity energy norms is performed.
The time-averaged energy norms (per unit span) are evaluated for each contribution in the vorticity transport equation to quantify the relative importance of the underlying physical mechanisms. For a generic quantity
 $\phi$
, the corresponding time-averaged energy norm is defined as
 \begin{equation} \left \langle E(\phi )\right \rangle =\frac {1}{\tau H_z}\int _{\tau }\int _{\mathbb{V}} \phi ^2 \text{d}\mathbb{V}\, \text{d}t, \end{equation}
where
 $\tau$
denotes the averaging window spanning
 $t=1500$
to
 $t=2000$
, over which 101 instantaneous flow fields are sampled at uniform intervals of
 $\Delta t=5$
. Here,
 $\mathbb{V}$
denotes the 3-D computational domain over which the wake statistics are evaluated, defined as
 $y \geqslant -1,\ -5 \leqslant x \leqslant 5$
for aiding buoyancy (
 $\alpha = 0^\circ$
) and
 $x \geqslant -1,\ -5 \leqslant y \leqslant 5$
for cross-buoyancy (
 $\alpha = 90^\circ$
), extending over the full span of the cylinder in each case.
In (4.1),
 $\phi$
denotes the
 $x$
- or
 $y$
-component of a specific term on the right-hand side of vorticity transport equation (2.13). In addition, the norms of the vorticity components
 $\varOmega _x$
and
 $\varOmega _y$
are evaluated to directly quantify the strength of 3-D wake structures. Accordingly, the time-averaged energy norms are obtained for
 $\varOmega _x$
,
 $\varOmega _y$
and for each contribution in (2.13), namely vortex stretching/tilting
 $(\boldsymbol{\varOmega } \boldsymbol{\cdot }\boldsymbol{\nabla }) \boldsymbol{V}$
, dilatation
 $-(\boldsymbol{\nabla }\boldsymbol{\cdot }\boldsymbol{V}) \boldsymbol{\varOmega }$
, baroclinic pressure torque
 $({\boldsymbol{\nabla }} \rho \times {\boldsymbol{\nabla }} p)/\rho ^2$
, density–viscous coupling
 $-({\boldsymbol{\nabla }} \rho \times \boldsymbol{f_v})/\rho ^2$
, buoyancy-induced baroclinic vorticity production
 $(\varGamma _x\hat {i}+\varGamma _y\hat {j})$
and viscous diffusion
 $(\boldsymbol{\nabla }\times \boldsymbol{f_v})/\rho$
, based on their respective
 $x$
- and
 $y$
-components. Crucially, this framework demonstrates that the transition in wake three-dimensionality is governed by a redistribution of vorticity energy mediated by buoyancy-induced baroclinic torque, thereby identifying it as the primary control mechanism in thermally stratified wakes.
Time-averaged energy norms
 $\langle E(\varOmega _x) \rangle$
and
 $\langle E(\varOmega _y) \rangle$
with increasing
 $\varepsilon$
at
 $\textit{Re} = 300$
: (a) aiding buoyancy (
 $\alpha = 0^\circ$
); (b) cross-buoyancy (
 $\alpha = 90^\circ$
). The streamwise direction depends on the flow orientation, aligning with the
 $y$
-axis for
 $\alpha = 0^\circ$
and with the
 $x$
-axis for
 $\alpha = 90^\circ$
.

Time-averaged energy norms
 $\langle E(\phi )\rangle$
of the
 $x$
- and
 $y$
-components of vorticity transport terms as functions of heating level
 $\varepsilon$
at
 $\textit{Re}=300$
for aiding buoyancy (
 $\alpha =0^\circ$
): (a)
 $({\boldsymbol{\nabla }} \rho \times {\boldsymbol{\nabla }} p)/\rho ^2$
; (b)
 $\varGamma$
(c)
 $(\boldsymbol{\varOmega } \boldsymbol{\cdot }\boldsymbol{\nabla }) \boldsymbol{V}$
; (d)
 $-(\boldsymbol{\nabla }\boldsymbol{\cdot }\boldsymbol{V}) \boldsymbol{\varOmega }$
; (e)
 $-({\boldsymbol{\nabla }} \rho \times \boldsymbol{f_v})/\rho ^2$
; (f)
 $(\boldsymbol{\nabla }\times \boldsymbol{f_v})/\rho$
.

Figure 16. Long description
The image contains six line graphs labeled (a) through (f), each showing the time-averaged energy norms of the x- and y-components of vorticity transport terms as functions of heating level at aiding buoyancy. Panel A: The line graph shows the x-component and y-component of the term E((∇ρ × ∇p)/ρ^2) against the heating level. The x-component is represented by red squares and the y-component by blue triangles, both increasing with the heating level. Panel B: The line graph shows the x-component and y-component of the term E(Γ) against the heating level. The x-component, represented by red squares, increases and then stabilizes, while the y-component, represented by blue triangles, remains near zero. Panel C: The line graph shows the x-component and y-component of the term E((Ω · ∇V)) against the heating level. Both components, represented by red squares and blue triangles respectively, decrease with the heating level. Panel D: The line graph shows the x-component and y-component of the term E(−(∇ · V)Ω) against the heating level. Both components, represented by red squares and blue triangles respectively, decrease and then stabilize. Panel E: The line graph shows the x-component and y-component of the term E((∇ρ × f_v)/ρ^2) against the heating level. The x-component, represented by red squares, increases, while the y-component, represented by blue triangles, remains near zero. Panel F: The line graph shows the x-component and y-component of the term E((∇ × f_v)/ρ) against the heating level. Both components, represented by red squares and blue triangles respectively, decrease with the heating level.
Time-averaged energy norms
 $\langle E(\phi )\rangle$
of the
 $x$
- and
 $y$
-components of vorticity transport terms versus
 $\varepsilon$
at
 $\textit{Re}=300$
for cross-buoyancy (
 $\alpha =90^\circ$
): (a)
 $({\boldsymbol{\nabla }} \rho \times {\boldsymbol{\nabla }} p)/\rho ^2$
; (b)
 $\varGamma$
; (c)
 $(\boldsymbol{\varOmega } \boldsymbol{\cdot }\boldsymbol{\nabla }) \boldsymbol{V}$
; (d)
 $-(\boldsymbol{\nabla }\boldsymbol{\cdot }\boldsymbol{V}) \boldsymbol{\varOmega }$
; (e)
 $-({\boldsymbol{\nabla }} \rho \times \boldsymbol{f_v})/\rho ^2$
; (f)
 $(\boldsymbol{\nabla }\times \boldsymbol{f_v})/\rho$
.

Figure 15 illustrates the 3-D wake behaviour through the time-averaged vorticity energy norms of
 $\varOmega _x$
and
 $\varOmega _y$
under heating of the cylinder surface for both aiding- and cross-buoyancy conditions. In the presence of aiding buoyancy, the time-averaged energy norms
 $\langle E(\varOmega _x)\rangle$
and
 $\langle E(\varOmega _y)\rangle$
are of comparable magnitude and decrease systematically with increasing
 $\varepsilon$
(figure 15
a). This trend indicates a progressive transfer of energy from 3-D to 2-D wake structures and, consequently, a suppression of wake three-dimensionality associated with the attenuation of
 $\varOmega _x$
and
 $\varOmega _y$
. The underlying mechanism for this behaviour is elucidated by the time-averaged energy norms of the individual terms in the vorticity transport equation (2.13), shown in figure 16 as a function of the heating parameter
 $\varepsilon$
.
The
 $x$
- and
 $y$
-components of the energy norms associated with the primary vorticity production terms – namely the baroclinic pressure term
 $({\boldsymbol{\nabla }} \rho \times {\boldsymbol{\nabla }} p)/\rho ^2$
(figure 16
a), buoyancy-induced baroclinic term
 $\varGamma$
(figure 16
b) and the density–viscous coupling term
 $-({\boldsymbol{\nabla }} \rho \times \boldsymbol{f_v})/\rho ^2$
(figure 16
e) – as well as the dilatation term
 $-(\boldsymbol{\nabla }\boldsymbol{\cdot }\boldsymbol{V})$
(figure 16
d), remain negligibly small and exhibit no significant variation with increasing
 $\varepsilon$
. In contrast, the energy norms of the vortex stretching/tilting term
 $(\boldsymbol{\varOmega } \boldsymbol{\cdot }\boldsymbol{\nabla }) \boldsymbol{V}$
(figure 16
c) and the viscous diffusion term
 $(\boldsymbol{\nabla }\times \boldsymbol{f_v})/\rho$
(figure 16
f) decrease markedly with heating.
The viscous diffusion term primarily redistributes vorticity and does not directly contribute to the generation of 3-D structures. By contrast, vortex tilting is central to the formation of three-dimensionality through reorientation of the vorticity vector. Consequently, the attenuation of wake three-dimensionality is governed predominantly by a reduction in the vortex stretching/tilting term, particularly its tilting component, which arises from the suppression of shear-layer instability. As discussed in § 3.4, this suppression is driven by the spanwise baroclinic torque,
 $\varGamma _z$
, which generates vorticity opposite in sign to the local
 $\varOmega _z$
in the near wake (see figure 9). This opposing interaction weakens the shear layers, inhibits vortex roll-up and promotes the formation of a vertically convected, plume-like wake, thereby reducing vortex tilting. Therefore, in the aiding buoyancy configuration, the baroclinic term
 $\varGamma _z$
plays a primary role in suppressing wake three-dimensionality by counteracting spanwise vorticity, weakening vortex tilting and driving the flow towards a quasi-two-dimensional state.
In the cross-buoyancy configuration, the wake three-dimensionality is significantly enhanced rather than suppressed, as evidenced by the increase in the energy norms
 $\langle E(\varOmega _x) \rangle$
and
 $\langle E(\varOmega _y) \rangle$
with increasing
 $\varepsilon$
in figure 15(b). The mechanism underlying this contrasting behaviour, relative to the aiding-buoyancy case, is examined through the
 $x$
- and
 $y$
-components of the time-averaged energy norms of the individual terms in the vorticity transport equation (2.13), shown in figure 17 as functions of
 $\varepsilon$
. Although the contributions from the baroclinic pressure term
 $(\boldsymbol{\nabla }\rho \times \boldsymbol{\nabla }p)/\rho ^2$
(figure 17
a), dilatation term
 $-(\boldsymbol{\nabla }\boldsymbol{\cdot }\boldsymbol{V})\boldsymbol{\varOmega }$
(figure 17
d) and the density–viscous coupling term
 $-(\boldsymbol{\nabla }\rho \times \boldsymbol{f_v})/\rho ^2$
(figure 17
e) all increase with
 $\varepsilon$
, their magnitudes remain relatively small. Consequently, these terms play only a minor role in the amplification of 3-D wake structures.
In contrast, the energy norms of the buoyancy-induced baroclinic torque
 $\varGamma _x$
(figure 17
b), vortex stretching/tilting
 $(\boldsymbol{\varOmega } \boldsymbol{\cdot }\boldsymbol{\nabla })\boldsymbol{V}$
(figure 17
c) and viscous diffusion
 $(\boldsymbol{\nabla }\times \boldsymbol{f_v})/\rho$
(figure 17
f) increase with heating. The viscous diffusion term, however, primarily redistributes existing vorticity and does not directly contribute to the generation of 3-D structures. Consequently, the baroclinic torque
 $\varGamma _x$
and the vortex stretching/tilting term emerge as the primary contributors to the strengthening of wake three-dimensionality. As discussed in § 3.4, the upstream region is characterised by the preferential generation of strong positive
 $\varGamma _z$
, which aligns with
 $\varOmega _z$
, particularly near the lower side of the cylinder (figure 11), thereby enhancing shear-layer instability. This leads to stronger vortex roll-up and increased vortex tilting, indicating that
 $\varGamma _z$
is a key driver of 3-D wake formation. These results collectively indicate that the baroclinic torque components
 $\varGamma _x$
and
 $\varGamma _z$
govern the amplification of wake three-dimensionality under cross-buoyancy conditions.
4.2. Symmetric and asymmetric flow pattern
In the vicinity of the heated cylinder, the flow pattern largely depends on the strength of positive and negative spanwise vortices. In both aiding- and cross-buoyancy conditions, the strengths of
 $\varOmega _z$
vortices of positive and negative sign are quantified by their energy norms (per unit span) using (4.1), as shown in figure 18(a,b). For the present analysis, it is important to note that the generic vorticity component
 $\phi$
in (4.1) is taken as
 $\phi \in \{\pm \varOmega _z, \pm \varGamma _z\}$
, and the 3-D rectangular domain (denoted as
 $\mathbb{V}$
) is defined as
 $-1 \leqslant y \leqslant 5$
,
 $-5 \leqslant x \leqslant 5$
for aiding buoyancy and
 $-1 \leqslant x \leqslant 5$
,
 $-5 \leqslant y \leqslant 5$
for cross-buoyancy, spanning the entire length of the cylinder in each case.
In the case of aiding buoyancy, figure 18(a) shows that the time-averaged energy norms
 $\langle {E}(+\varOmega _z)\rangle$
and
 $\langle {E}(-\varOmega _z)\rangle$
, corresponding to the positive and negative
 $\varOmega _z$
vortices, are nearly equal at each
 $\varepsilon$
value. These similar values indicate that the vortices have comparable strength, leading to a symmetric flow pattern in the cylinder wake. However, under cross-buoyancy, as
 $\varepsilon$
increases,
 $\langle {E}(+\varOmega _z)\rangle$
increases while
 $\langle {E}(-\varOmega _z)\rangle$
decreases (figure 18
b). This result indicates that, with increasing heating, the positive
 $\varOmega _z$
vortices are strengthened, while the negative
 $\varOmega _z$
vortices are weakened. The imbalance in the strength of oppositely signed vortices results in an asymmetric wake pattern. This contrast in vortex strength distribution is also elaborated in § 3.4, where the symmetry in aiding buoyancy and the asymmetry in cross-buoyancy are qualitatively illustrated.
Strength of positive and negative vortices of
 $\varOmega _z$
and
 $\varGamma _z$
compared using their energy norms with increasing heating levels for (a,c) aiding buoyancy at
 $\alpha =0^\circ$
and (b,d) cross-buoyancy at
 $\alpha =90^\circ$
.

Figure 18. Long description
Panel A: A line graph shows the comparison of energy norms for positive and negative vortices with increasing heating levels for aiding buoyancy at alpha equals 0 degrees. The x-axis represents the heating level (epsilon) ranging from 0 to 1.0, and the y-axis represents the energy norms (E with omega subscript z) ranging from 34 to 38. Two data series are plotted: one with red squares representing positive vortices and another with blue triangles representing negative vortices. Panel B: A line graph shows the comparison of energy norms for positive and negative vortices with increasing heating levels for cross-buoyancy at alpha equals 90 degrees. The x-axis represents the heating level (epsilon) ranging from 0 to 1.0, and the y-axis represents the energy norms (E with omega subscript z) ranging from 24 to 40. Two data series are plotted: one with red squares representing positive vortices and another with blue triangles representing negative vortices. Panel C: A line graph shows the comparison of energy norms for positive and negative vortices with increasing heating levels for aiding buoyancy at alpha equals 0 degrees. The x-axis represents the heating level (epsilon) ranging from 0 to 1.0, and the y-axis represents the energy norms (E with gamma subscript z) ranging from 0 to 6. Two data series are plotted: one with red squares representing positive vortices and another with blue triangles representing negative vortices. Panel D: A line graph shows the comparison of energy norms for positive and negative vortices with increasing heating levels for cross-buoyancy at alpha equals 90 degrees. The x-axis represents the heating level (epsilon) ranging from 0 to 1.0, and the y-axis represents the energy norms (E with gamma subscript z) ranging from 0 to 8. Two data series are plotted: one with red squares representing positive vortices and another with blue triangles representing negative vortices.
The generation of baroclinic vorticity along the spanwise direction significantly impacts the wake pattern by influencing the strength of oppositely signed
 $\varOmega _z$
vortices behind the heated cylinder in both buoyancy scenarios. For aiding buoyancy, the magnitudes of positive and negative
 $\varGamma _z$
are nearly equal and exhibit an increasing trend with
 $\varepsilon$
, as reflected by the almost identical energy norm values
 $\langle {E}(+\varGamma _z)\rangle$
and
 $\langle {E}(-\varGamma _z)\rangle$
at each
 $\varepsilon$
level (figure 18
c). The equal strength of oppositely signed
 $\varGamma _z$
vortices plays an important role in maintaining wake symmetry under aiding buoyancy. It is worth noting that, despite the generation of
 $\varGamma _z$
vorticity with a sign opposite to that of
 $\varOmega _z$
(as shown in figure 9 of § 3.4), the magnitudes of both positive and negative
 $\varOmega _z$
vortices are significantly enhanced for
 $\varepsilon \geqslant 0.4$
(figure 18
a). This enhancement is attributed to the strong buoyant forces accelerating fluid particles around the heated cylinder, thereby intensifying
 $\varOmega _z$
of both signs. However, as discussed in § 3.4, the production of oppositely signed
 $\varGamma _z$
vortices stabilises the wake by suppressing shear layer instabilities. This suppression replaces vortex roll-up with a vertically convected, plume-like wake structure, leading to a steady or quasi-steady flow. Therefore, these findings suggest that under aiding buoyancy, the role of
 $\varGamma _z$
is primarily to preserve wake symmetry rather than to amplify
 $\varOmega _z$
strength. Notably, at
 $\varepsilon = 0.3$
in figure 18(a), the observed decrease in
 $\langle {E}(\pm \varOmega _z)\rangle$
is attributed to the indirect influence of
 $\varGamma _x$
production at this heating level (figure 16
b).
In cross-buoyancy conditions, the stronger positively signed
 $\varGamma _z$
enhances the strength of
 $\varOmega _z$
vortices of the same sign, as indicated by the increase in both
 $\langle E(+\varOmega _z)\rangle$
(figure 18
b) and
 $\langle {E}(+\varGamma _z)\rangle$
(figure 18
d) with rising heating levels. However, for negatively signed vortices, an opposite behaviour is observed. This complexity arises because, in the upper half of the wake region (where
 $\varOmega _z$
is negative), the generation of
 $\varGamma _z$
is predominantly of positive sign, which is opposite in sense to the local
 $\varOmega _z$
(figure 11). This counteracting effect overrides the influence of the negative
 $\varGamma _z$
(which is weaker than positive
 $\varGamma _z$
) and leads to the weakening of negatively signed
 $\varOmega _z$
vortices. As discussed in § 3.4, this dominance of positively signed
 $\varGamma _z$
in both upper and lower regions of the wake contributes to the weakening of the upper (negative
 $\varOmega _z$
) vortices and the strengthening of the lower (positive
 $\varOmega _z$
) vortices. As a result, the disparity in strength between the positive and negative
 $\varOmega _z$
vortices increases with rising
 $\varepsilon$
, leading to an increasingly asymmetric wake structure. Therefore, the relative strengths of the positive and negative
 $\varGamma _z$
components are key factors governing wake dynamics and flow symmetry behind the cylinder.
5. Conclusion
This work presents a detailed numerical investigation of the 3-D wake transition behind a heated square cylinder at
 $\textit{Re} = 300$
, using air (
 $\textit{Pr} = 0.71$
) as the working fluid, for heating levels ranging from
 $\varepsilon = 0$
to 1. A non-Oberbeck–Boussinesq (NOB) model, incorporating the full compressible Navier–Stokes equations, is employed to elucidate the role of baroclinic vorticity production in influencing wake three-dimensionality and vortex shedding under aiding and cross-buoyancy configurations. A low Mach number (
 $M = 0.1$
) is used to minimise compressibility effects, while the Froude number is maintained at
 $\textit{Fr} = 1$
.
In the present study, it is demonstrated that the orientation of the free stream flow relative to gravity strongly influences the 3-D wake structures behind a heated cylinder. Under aiding-buoyancy conditions, where the free stream is aligned opposite to gravity, the addition of heat leads to the emergence of a variety of 3-D wake structures, including rib-like, braid-like and tube-like formations, each characterised by distinct numbers of vortex pairs along the spanwise direction. In contrast, under cross-buoyancy conditions, where the free stream is perpendicular to gravity, the wake is dominated by disordered rib-like structures exhibiting variable vortex pair counts. Based on their structural characteristics and spanwise wavelengths, the wake is systematically classified, thereby establishing a robust framework for buoyancy-driven wake transitions.
In marked contrast to the present findings, earlier cross-buoyancy studies (Ren et al. Reference Ren, Rindt and van Steenhoven2006a
,
Reference Ren, Rindt and Van Steenhovenb
, Reference Ren, Rindt and van Steenhoven2007) reported that buoyancy-induced baroclinic torque gives rise exclusively to ordered rib-like structures with a fixed spanwise wavelength of 2 (Mode-E instability) for
 $\textit{Re} = 75$
–117 and
 $Ri = 0.35$
–2.5. However, these conclusions were derived from configurations restricted to water as the working fluid (
 $\textit{Pr} = 7$
) and the small-scale heating regime. More recent numerical studies at
 $\textit{Re} = 180$
, employing a non-Oberbeck–Boussinesq formulation (Ali et al. Reference Ali, Hasan and Sanghi2024), similarly reported only persistent Mode-E-type structures for
 $0.4 \leqslant \varepsilon \leqslant 1$
, attributing their occurrence to baroclinic torque. The present results at
 $\textit{Re} = 300$
, however, extend these conclusions by demonstrating that, under cross-buoyancy conditions, the number of vortex pairs varies systematically with heating, thereby revealing fundamentally different and substantially richer 3-D wake dynamics. This clearly indicates that prior interpretations of the role of baroclinic torque, derived from low-Reynolds-number regimes, do not fully capture the complexity of buoyancy-modulated wake transition.
In the wake of a heated square cylinder, the spanwise baroclinic vorticity production term
 $\varGamma _z$
, plays a central role in shaping the vortex shedding behaviour by influencing the spanwise vorticity patterns. Under aiding buoyancy,
 $\varGamma _z$
forms plume-like structures with a sign opposite to that of
 $\varOmega _z$
, which suppresses shear-layer instabilities, inhibits vortex roll-up and decreases near-wake circulation when
 $\varepsilon \geqslant 0.5$
. This suppression leads to a transition from vortex shedding to a vertically convected, plume-like wake that is steady or quasi-steady. The transition is gradual, passing through a stage of intermittent vortex shedding observed at
 $\varepsilon = 0.4$
. At lower heating levels (
 $\varepsilon = 0.2$
–0.3), the relatively weaker
 $\varGamma _z$
reduces vortex shedding strength but does not suppress it.
Hasan & Ali (Reference Hasan and Ali2013) performed numerical investigations at
 $\textit{Re} = 100$
,
 $\textit{Pr} = 0.71$
and
 $Ri = 0$
–
 $1.6$
, demonstrating that baroclinic vorticity production suppresses vortex shedding in 2-D heated bluff-body wakes. Furthermore, the influence of baroclinic vorticity was found to be highly sensitive to the alignment of the flow relative to gravity. However, these findings are restricted to 2-D configurations within the small-scale heating (Boussinesq) regime. The present results extend these observations to 3-D wake transitions under aiding buoyancy conditions, thereby providing a more comprehensive understanding of the role of baroclinic vorticity in wake three-dimensionality and vortex shedding dynamics.
The gradual weakening of vortex shedding in the aiding-buoyancy regime is also reflected in the decreasing amplitudes of the force coefficients with increasing surface heating, accompanied by the emergence of distinct vortical structures. Consequently, strong and weak shedding are associated with rib-like and braid-like streamwise vorticity structures, respectively, whereas tube-like structures correspond to suppressed shedding, characterised by a vertically convected, plume-like wake. In contrast, under cross-buoyancy, the shedding behaviour is more intricate due to the dominance of positively signed
 $\varGamma _z$
, which opposes the local
 $\varOmega _z$
in the upper wake and reinforces it in the lower wake. This results in a weakening of negative (upper)
 $\varOmega _z$
vortices and strengthening of positive (lower) ones, thereby introducing asymmetry and reducing the overall vortex shedding intensity. Nonetheless, the vortex shedding remains more pronounced than in the aiding buoyancy case.
Beyond influencing shedding strength,
 $\varGamma _z$
significantly affects wake symmetry by altering the strength of oppositely signed
 $\varOmega _z$
vortices. Under aiding buoyancy, the nearly equal magnitude of positive and negative
 $\varGamma _z$
promotes a symmetric wake, whereas under cross-buoyancy, the dominance of positive
 $\varGamma _z$
at the upstream side induces increasing asymmetry. This asymmetric flow field around the heated cylinder ultimately results in the generation of negative lift and an earlier onset of vortex shedding in the cross-buoyancy configuration.
Furthermore, the addition of heat to the cylinder surface leads to a reduction in 3-D wake strength under aiding buoyancy, whereas an enhancement is observed under cross-buoyancy. This contrasting behaviour is quantified using the
 $x$
- and
 $y$
-components of the time-averaged energy norms of the individual terms in the vorticity transport equation (2.13). Under aiding buoyancy, the generation of spanwise baroclinic torque
 $\varGamma _z$
with sign opposite to
 $\varOmega _z$
acts indirectly to suppress three-dimensionality by weakening shear-layer instability, thereby attenuating vortex shedding, reducing vortex tilting and driving the flow towards a quasi-two-dimensional state. In contrast, under cross-buoyancy, the combined action of the streamwise and spanwise baroclinic torques,
 $\varGamma _x$
and
 $\varGamma _z$
, enhances shear-layer instability, promotes vortex roll-up and intensifies vortex tilting, leading to amplification of wake three-dimensionality. Therefore, this work reveals that the baroclinic vorticity production terms,
 $\varGamma _x$
and
 $\varGamma _z$
, play a key role in controlling wake three-dimensionality. This finding advances the current understanding by demonstrating that wake transition in thermally stratified flows cannot be interpreted solely in terms of classical instability mechanisms (e.g. shear-layer or elliptic instabilities), but must also account for the relative balance between streamwise and spanwise baroclinic vorticity production.
Additionally, the present study establishes the critical role of vortex dislocations in shaping 3-D wake behaviour. Under aiding-buoyancy conditions, these irregularities, observed at
 $\varepsilon = 0.2$
, appear intermittently in the
 $C_L$
time series, and are accompanied by alternating ordered and disordered spanwise vortical structures. These observations are consistent with prior wake transition studies on unheated cylinders (Behara & Mittal Reference Behara and Mittal2010; Jiang et al. Reference Jiang, Cheng and An2018), which demonstrated the intermittent emergence and disappearance of vortex dislocations leading to wake disruption. Extending these findings to thermally driven flows, the present results demonstrate that vortex dislocations act as important events during wake transition, directly modulating both the 3-D structure and the associated hydrodynamic response.
Crucially, under aiding-buoyancy conditions, vortex dislocations are confined to lower heating levels (
 $\varepsilon = 0$
–0.2) and are progressively suppressed at higher heating levels (
 $\varepsilon \geqslant 0.4$
). In contrast, under cross-buoyancy conditions, both small- and large-scale dislocations persist across the entire heating range (
 $0 \leqslant \varepsilon \leqslant 1$
). The suppression observed under aiding buoyancy arises from the weakening of wake three-dimensionality and vortex shedding induced by the spanwise baroclinic torque
 $\varGamma _z$
, indicating a clear transition towards wake stabilisation. Similar suppression of vortex dislocations has been reported in numerical studies by Noto & Fujimoto (2006, 2007) for the 3-D wake transition behind a heated circular cylinder at
 $\textit{Re}=300$
and
 $Ri = 0.3$
under the aiding-buoyancy condition, where buoyancy enhances the streamwise velocity while reducing the spanwise velocity in the wake, thereby attenuating three-dimensionality. However, these studies did not identify the governing role of the spanwise baroclinic torque
 $\varGamma _z$
, which the present results demonstrate to be the key mechanism underlying this stabilisation process.
These findings have important implications for predictive modelling and control of mixed convection flows around heated bluff bodies. In particular, the results suggest that thermal forcing can be used as an effective mechanism to modulate vortex shedding, wake symmetry and three-dimensionality, which is relevant to applications such as heat exchangers, electronic cooling and environmental flows involving heated bluff bodies. More broadly, the present work provides a mechanistic framework for incorporating baroclinic effects into reduced-order and stability models of thermally driven wakes.
Several open questions remain for future investigation. The generality of the observed mechanisms across a wider range of Reynolds and Prandtl numbers, as well as for different bluff-body geometries, needs to be established. The interaction between baroclinic torque and turbulence in higher-Reynolds-number regimes, and its influence on transition to turbulence, also warrants further study. In addition, the potential of thermal forcing as a flow control strategy for suppressing or enhancing vortex shedding and 3-D wake transitions remains an unexplored but promising direction. Addressing these aspects will be essential for developing a unified and predictive understanding of thermally coupled wake flows.
Acknowledgements
The authors express their gratitude for the computational support provided by the High Performance Computing (HPC) facility at the Indian Institute of Technology-Delhi, India.
Funding
This research received no specific grant from any funding agency, commercial or not-for-profit sectors.
Declaration of interests
The authors report no conflict of interest.
Appendix A. Governing equations in body-fitted curvilinear coordinates
In the present DNS study, the governing equations originally expressed in Cartesian coordinates (2.1) are reformulated in body-fitted curvilinear coordinates
 $\xi (x,y)$
,
 $\eta (x,y)$
within the
 $x{-}y$
plane, while the
 $z$
(spanwise) direction is retained in its original form. This transformation facilitates an accurate representation of the computational domain around the cylinder surface, ensuring that the boundary conditions are imposed more naturally. The body-fitted governing equations are expressed as
 \begin{equation} \frac {\partial \boldsymbol{U}}{\partial t}+\frac {\partial \boldsymbol{\tilde {F}}}{\partial \xi }+\frac {\partial \boldsymbol{\tilde {G}}}{\partial \eta }+\frac {\partial \boldsymbol{ H}}{\partial z}=\boldsymbol{\tilde {J}}, \end{equation}
where
 \begin{equation} \boldsymbol{\tilde {F}}=\xi _x \boldsymbol{F}+\xi _y \boldsymbol{G},\qquad \boldsymbol{\tilde {G}}=\eta _x \boldsymbol{F}+\eta _y \boldsymbol{G} \end{equation}
and
 \begin{equation} \boldsymbol{\tilde {J}}=\boldsymbol{J}+\left (\frac {\partial \xi _x}{\partial \xi }+\frac {\partial \eta _x}{\partial \eta }\right )\boldsymbol{F}+\left (\frac {\partial \xi _y}{\partial \xi }+\frac {\partial \eta _y}{\partial \eta }\right )\boldsymbol{G}. \end{equation}
Appendix B. Numerical scheme
The present numerical simulations employ the PVU-M+ (Particle Velocity Upwind-Modified+) scheme with specific modifications to enhance stability at low Mach numbers. The PVU-M+ scheme is a high-resolution, Total Variation Diminishing (TVD), flux-based method designed for solving the Euler and Navier–Stokes equations of compressible flow (Hasan et al. Reference Hasan, Khan and Shameem2015). It operates within a predictor–corrector framework and employs a second-order accurate time integration procedure. Its inherent robustness and efficiency enable accurate computations over a broad range of Mach numbers. The essential feature of the PVU-M+ scheme is the decomposition of total fluxes into convective and non-convective components, which are then discretised separately to enhance accuracy and stability.
In the original formulation of PVU-M+, the convective flux derivatives are discretized using a central-difference approximation with inter-cell values, while the non-convective flux derivatives are discretised differently in the two steps of the scheme: forward differencing in the predictor step and backward differencing in the corrector step, both using nodal values. Although effective in many compressible flow problems, this approach leads to significant non-physical oscillations when applied to low-Mach-number regimes (
 $M = 0.05$
–0.1) in the vicinity of bluff bodies, such as the square cylinder considered in the present study.
To remove these spurious oscillations, a modification is introduced in which the discretisation of the non-convective flux derivatives is made consistent with that of the convective flux derivatives. Specifically, instead of using forward–backward differencing at nodal points, the non-convective fluxes are discretised using a central-difference formulation with inter-cell values (see (B1) and (B2)). This modification eliminates spurious oscillations and ensures smooth, physically realistic solutions in the low-Mach-number regime without compromising the accuracy of scheme at higher Mach numbers (Ahmad et al. Reference Ahmad, Hasan and Sanghi2020).
The solution vector of (A1) is advanced from the current time level (n) to the next time level (n + 1) using a two-step predictor–corrector scheme. In this procedure, the predictor step provides an intermediate estimate of the solution at the ith grid point by incorporating both convective and non-convective fluxes along with source terms. This estimate is then refined in the corrector step through a time-centred evaluation of the fluxes and source contributions, thereby improving accuracy and stability. The governing relations in the one-dimensional framework are expressed as follows.
 $\mathrm{Predictor\ step:}$
 \begin{equation} \boldsymbol{U}^{*}=\boldsymbol{U}^n-\Delta t\left \{\frac {\boldsymbol{\tilde {F}}^c_{i+1/2}(\boldsymbol{U}^n)-\boldsymbol{\tilde {F}}^c_{i-1/2}(\boldsymbol{U}^n)}{\xi _{i+1/2}-\xi _{i-1/2}}+\frac {\boldsymbol{\tilde {F}}^{nc}_{i+1/2}(\boldsymbol{U}^n)-\boldsymbol{\tilde {F}}^{nc}_{i-1/2}(\boldsymbol{U}^n)}{\xi _{i+1/2}-\xi _{i-1/2}}-\boldsymbol{\tilde {J}}^n_i\right \}\!, \end{equation}
 $\mathrm{Corrector\ step:}$
 \begin{equation} \boldsymbol{U}^{n+1}=\frac {(\boldsymbol{U}^*+\boldsymbol{U}^n)}{2}-\frac {\Delta t}{2} \left\{\frac {\boldsymbol{\tilde {F}}^c_{i+1/2}(\boldsymbol{U}^*)-\boldsymbol{\tilde {F}}^c_{i-1/2}(\boldsymbol{U}^*)}{\xi _{i+1/2}-\xi _{i-1/2}}+\frac {\boldsymbol{\tilde {F}}^{nc}_{i+1/2}(\boldsymbol{U}^*)-\boldsymbol{\tilde {F}}^{nc}_{i-1/2}(\boldsymbol{U}^*)}{\xi _{i+1/2}-\xi _{i-1/2}}-\boldsymbol{\tilde {J}}^*_i \right\}\!. \end{equation}
Here,
 $\boldsymbol{\tilde {F}}^c$
and
 $\boldsymbol{\tilde {F}}^{nc}$
denote the convective and non-convective flux vectors, respectively, while
 $\boldsymbol{\tilde {J}}$
represents the source vector.
The inter-cell convective flux is defined as
 \begin{equation} \boldsymbol{\tilde {F}}^c_{i+1/2}=u_{i+1/2}\phi _{i+1/2}, \end{equation}
where
 $u_{i+1/2}$
is the numerical velocity at the cell interface, and
 $\phi _{i+1/2}=[\rho \ \rho u\ \rho v\ \rho w\ \rho E]_{i+1/2}^T$
is the corresponding convective property vector. These quantities are evaluated using a hybrid interpolation strategy that blends fourth-order central and second-/first-order upwind-biased interpolations with suitable weights. The weight functions balance accuracy in smooth regions with stability near discontinuities, enabling the scheme to capture both gradual variations and sharp changes in the flow field. A detailed description of the PVU-M+ scheme and its flux discretization is provided by Hasan et al. (Reference Hasan, Khan and Shameem2015).
The inter-cell non-convective flux,
 $\boldsymbol{\tilde {F}}^{nc}_{i+1/2}$
, is estimated using the values of the relevant flow variables at adjacent node points. For a given variable
 $f$
associated with the non-convective flux, the midpoint values and their derivatives at
 $(i+1/2, j, k)$
are approximated as follows:
 \begin{align} f_{i+1/2}=\frac {f_{i+1}+f_{i}}{2}, \end{align}
 \begin{align} \frac {\partial f}{\partial \xi } \Bigg |_{i+1/2}=\frac {f_{i+1}-f_{i}}{\xi _{i+1}-\xi _{i}}=\frac {f_{i+1}-f_{i}}{\Delta \xi }, \end{align}
 \begin{align} \frac {\partial f}{\partial \eta } \Bigg |_{i+1/2} \quad or \quad \frac {\partial f}{\partial z} \Bigg |_{i+1/2} = \frac {\partial f}{\partial (\eta ,z)} \Bigg |_{i+1/2}= \frac { \frac {\partial f}{\partial (\eta ,z)}\Bigg |_{i+1}+\frac {\partial f}{\partial (\eta ,z)}\Bigg |_{i}}{2}. \end{align}
Here,
 $({\partial f}/{\partial \eta })$
is evaluated using second-order central differencing scheme at the interior grid points, while one-sided differencing is applied at the boundary nodes to maintain accuracy and stability near the domain limits. The above-mentioned procedure can be extended analogously to obtain the variables and their derivatives at other midway locations, such as
 $(i,j+1/2,k)$
and
 $(i,j,k+1/2)$
.


 Hz
 (U∞,T∞)
 α
 g
 x
 y

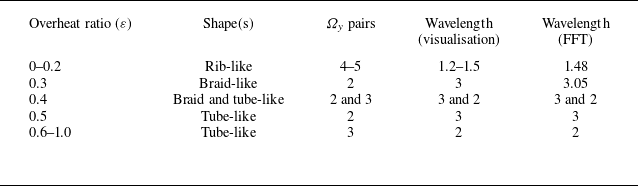
 Ωy
 Re=300
 ε=0
 α=0∘
 λz/L
 ε=0.4
 λz/L=3
 λz/L=2

 Ωy
 Re=300
 t=1500
 α=0∘

 Ωx
 t=1900
 α=90∘
 ε=0
 ε=0.3
 ε=0.6
 ε=1.0
 ε
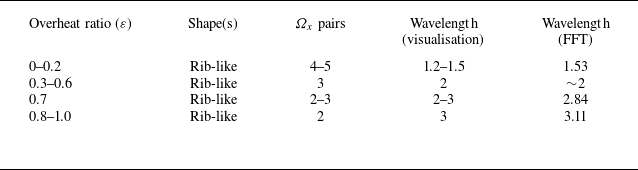
 Ωx
 Re=300
 ε
 α=90∘
 λz/L

 Ωx
 y
 z
 α=90∘
 ε=0
 ε=0.3
 ε=0.6
 ε=1

 CD
 CL
 Re=300
 α=0∘
 ε=0
 ε=0.2
 ε=0.4
 ε=0.6
 CD
 CL
 ε
 ε=0.2

 CD
 CL
 Re=300
 α=90∘
 ε=0
 ε=0.2
 ε=0.6
 ε=1
 CL
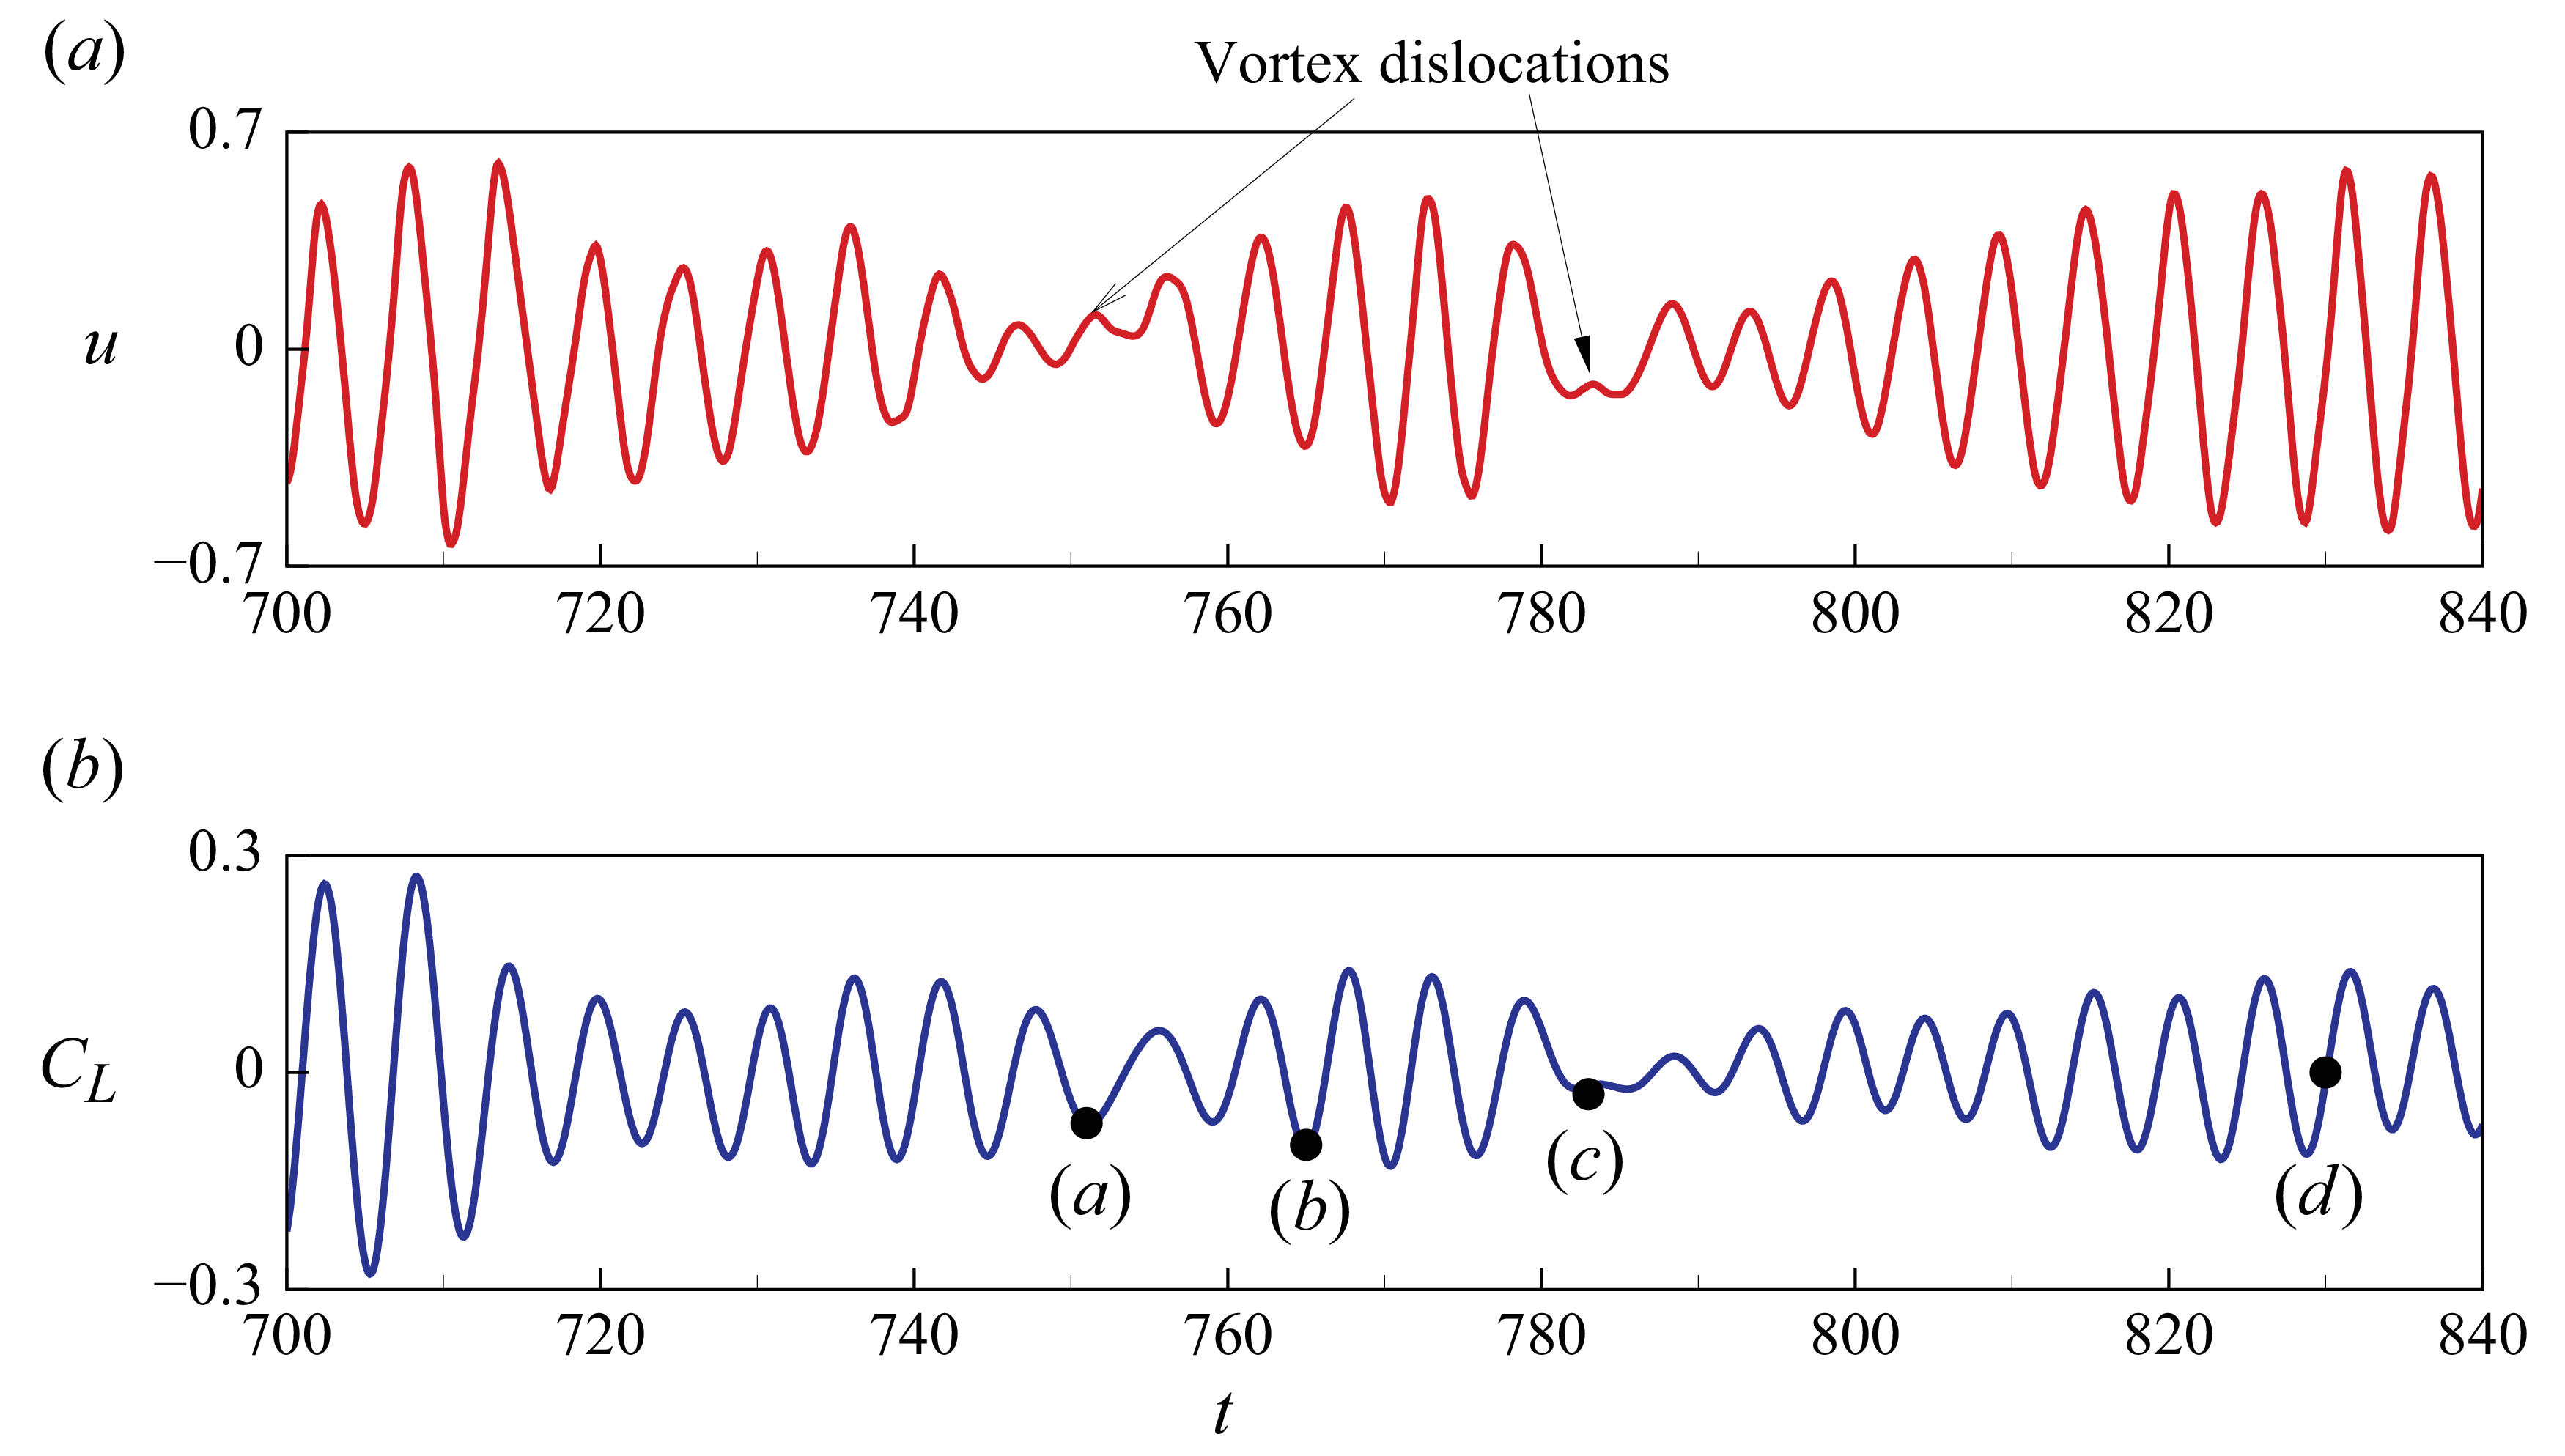
 α=0∘
 Re=300
 ε=0.2
 u
 x=2
 y=0
 z=3
 CL
 CL

 Ωz
 Re=300
 ε=0.2
 α=0
 Ωz
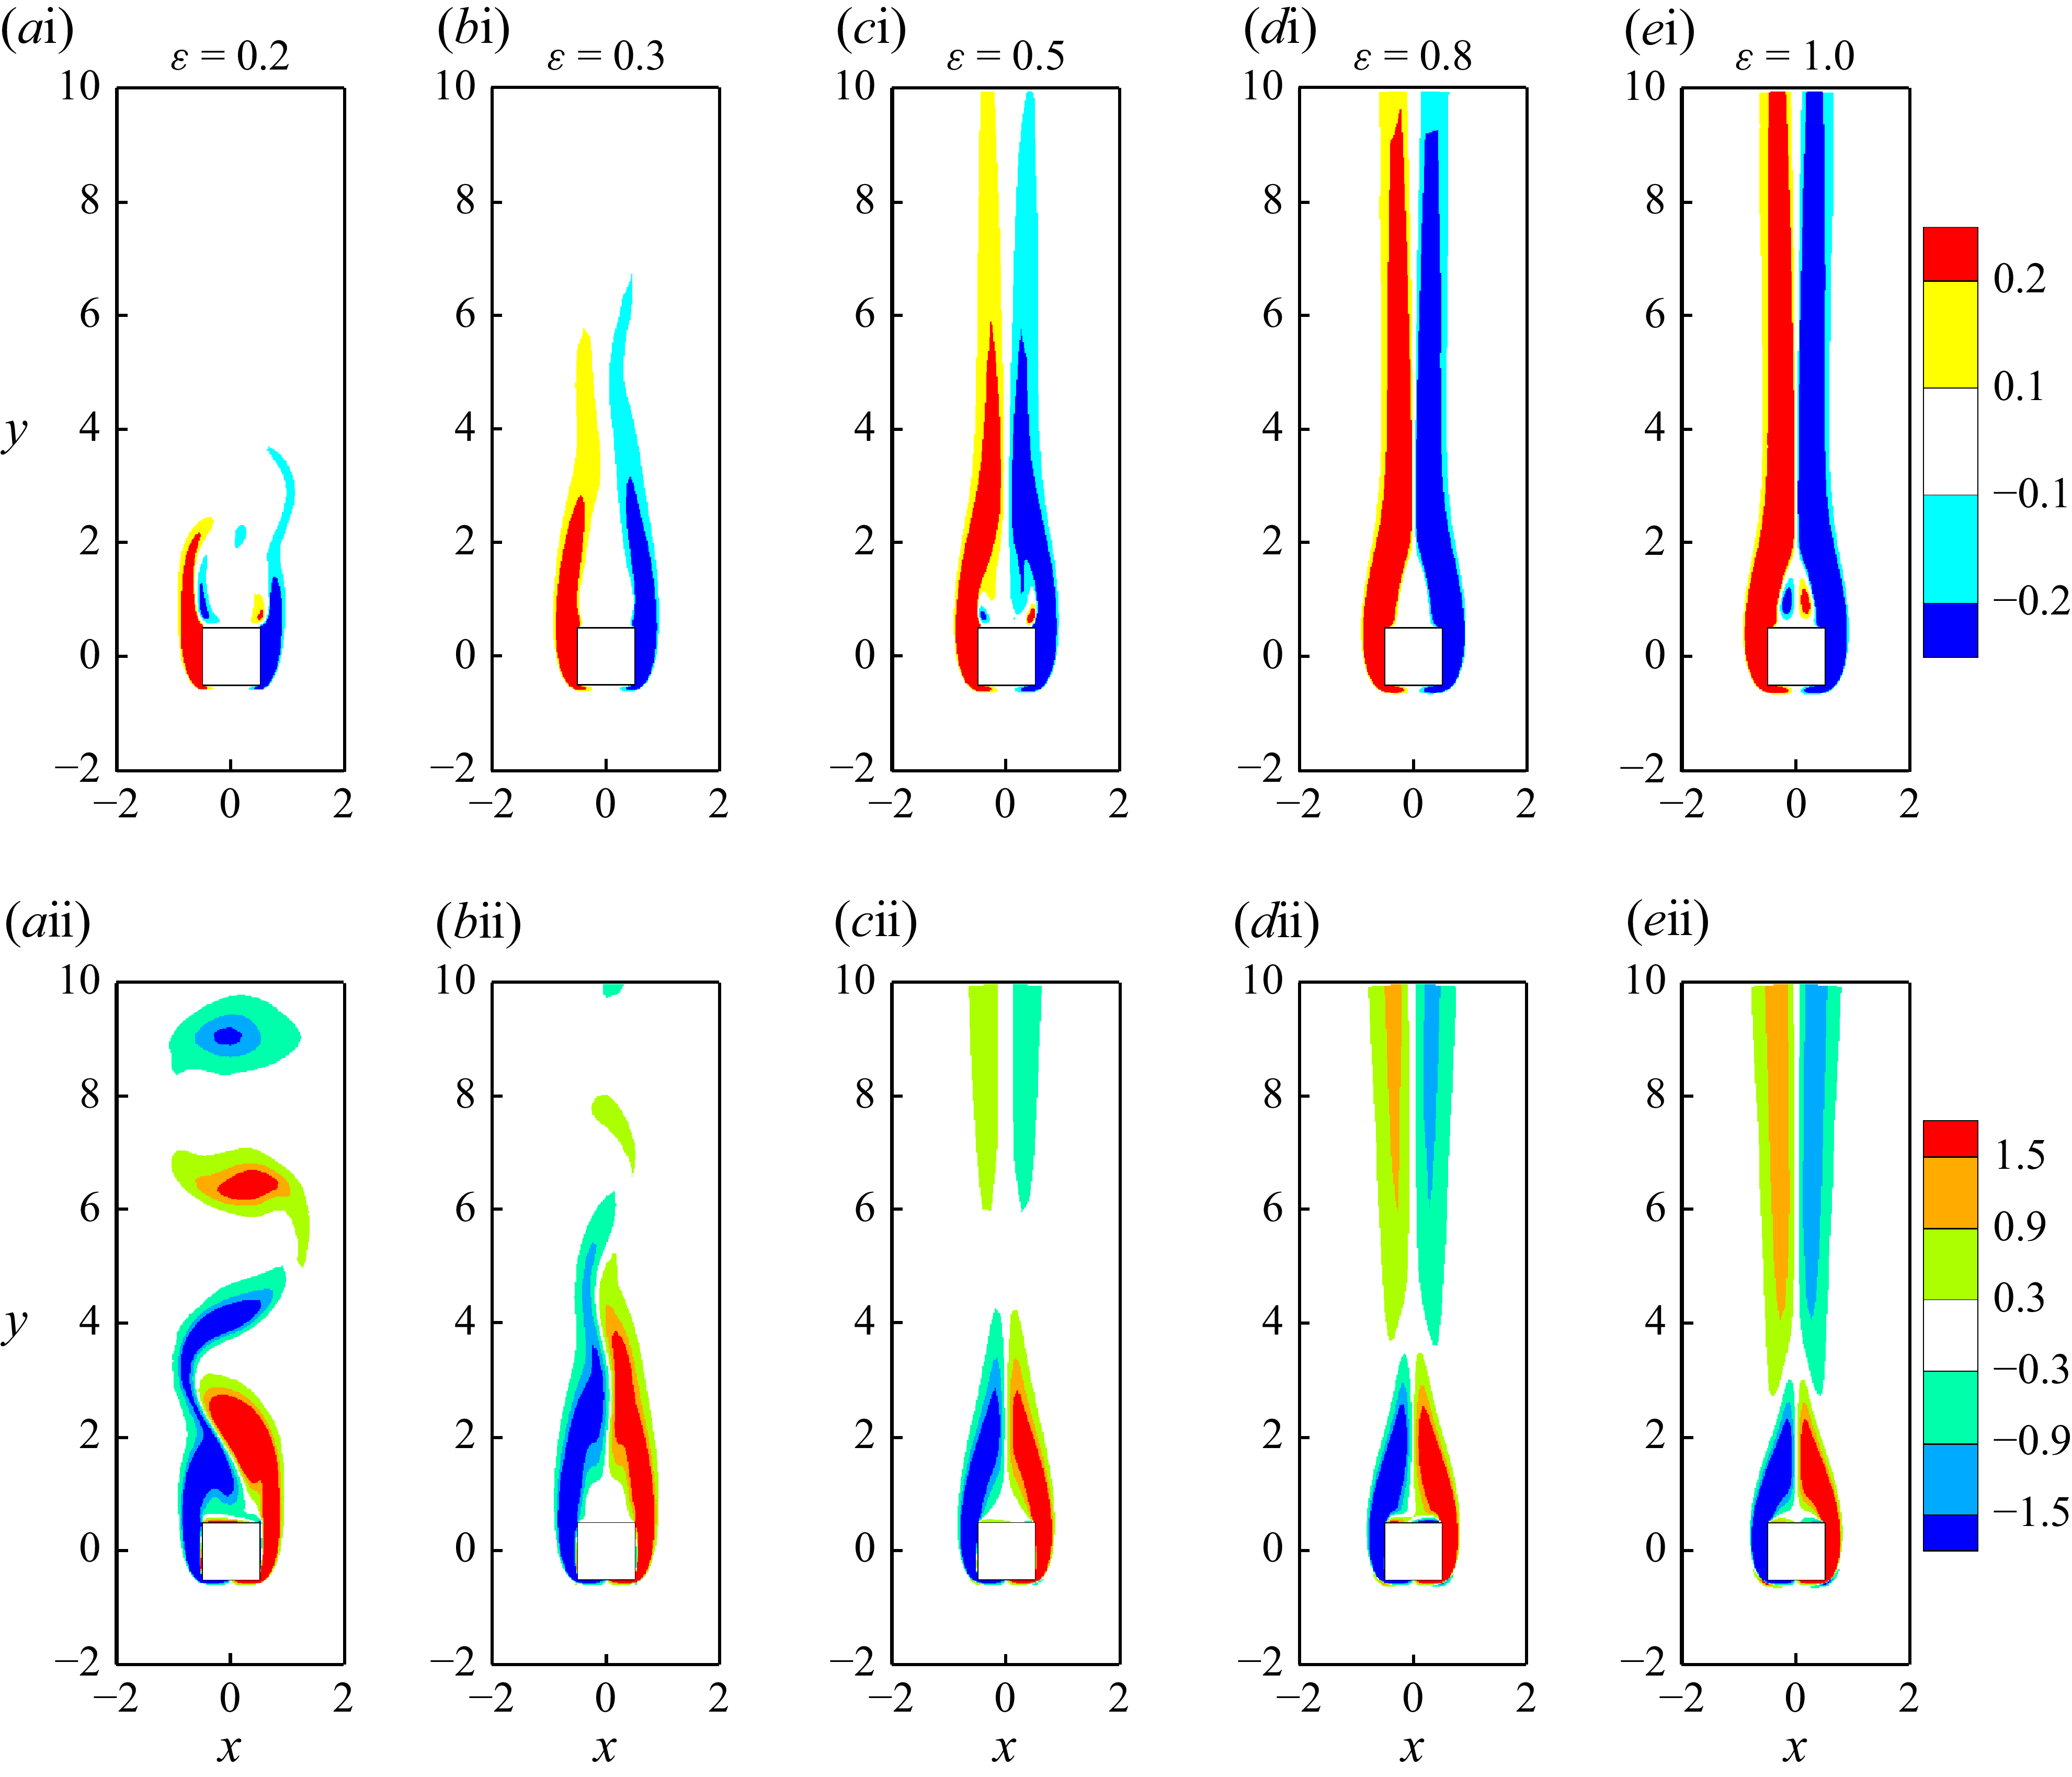
 Γz
 Ωz
 Re=300
 ε
 α=0∘
 Γz
 Ωz
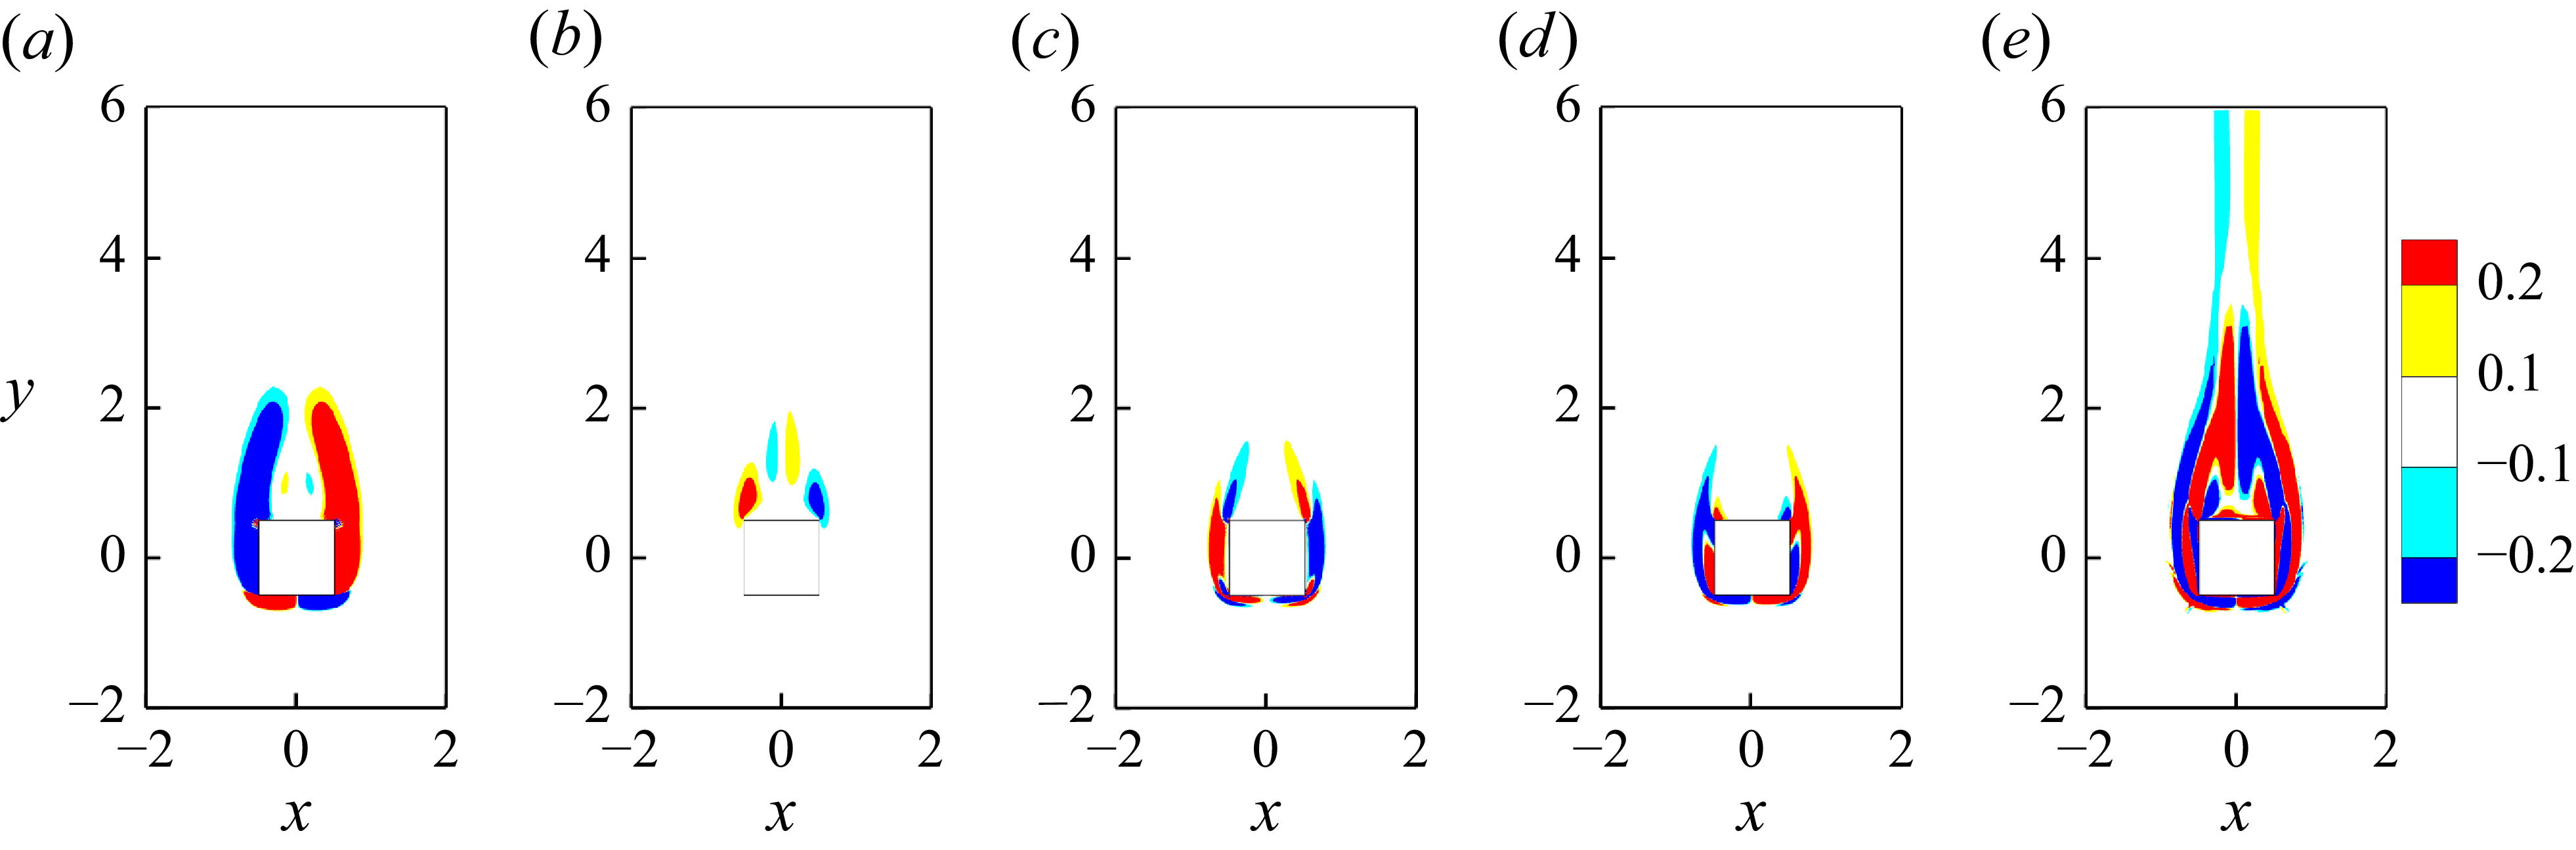
 Re=300
 ε=1
 α=0∘
 (∇ρ×∇p)/ρ2
 (Ω⋅∇)V
 −(∇⋅V)Ω
 −(∇ρ×fv)/ρ2
 (∇×fv)/ρ
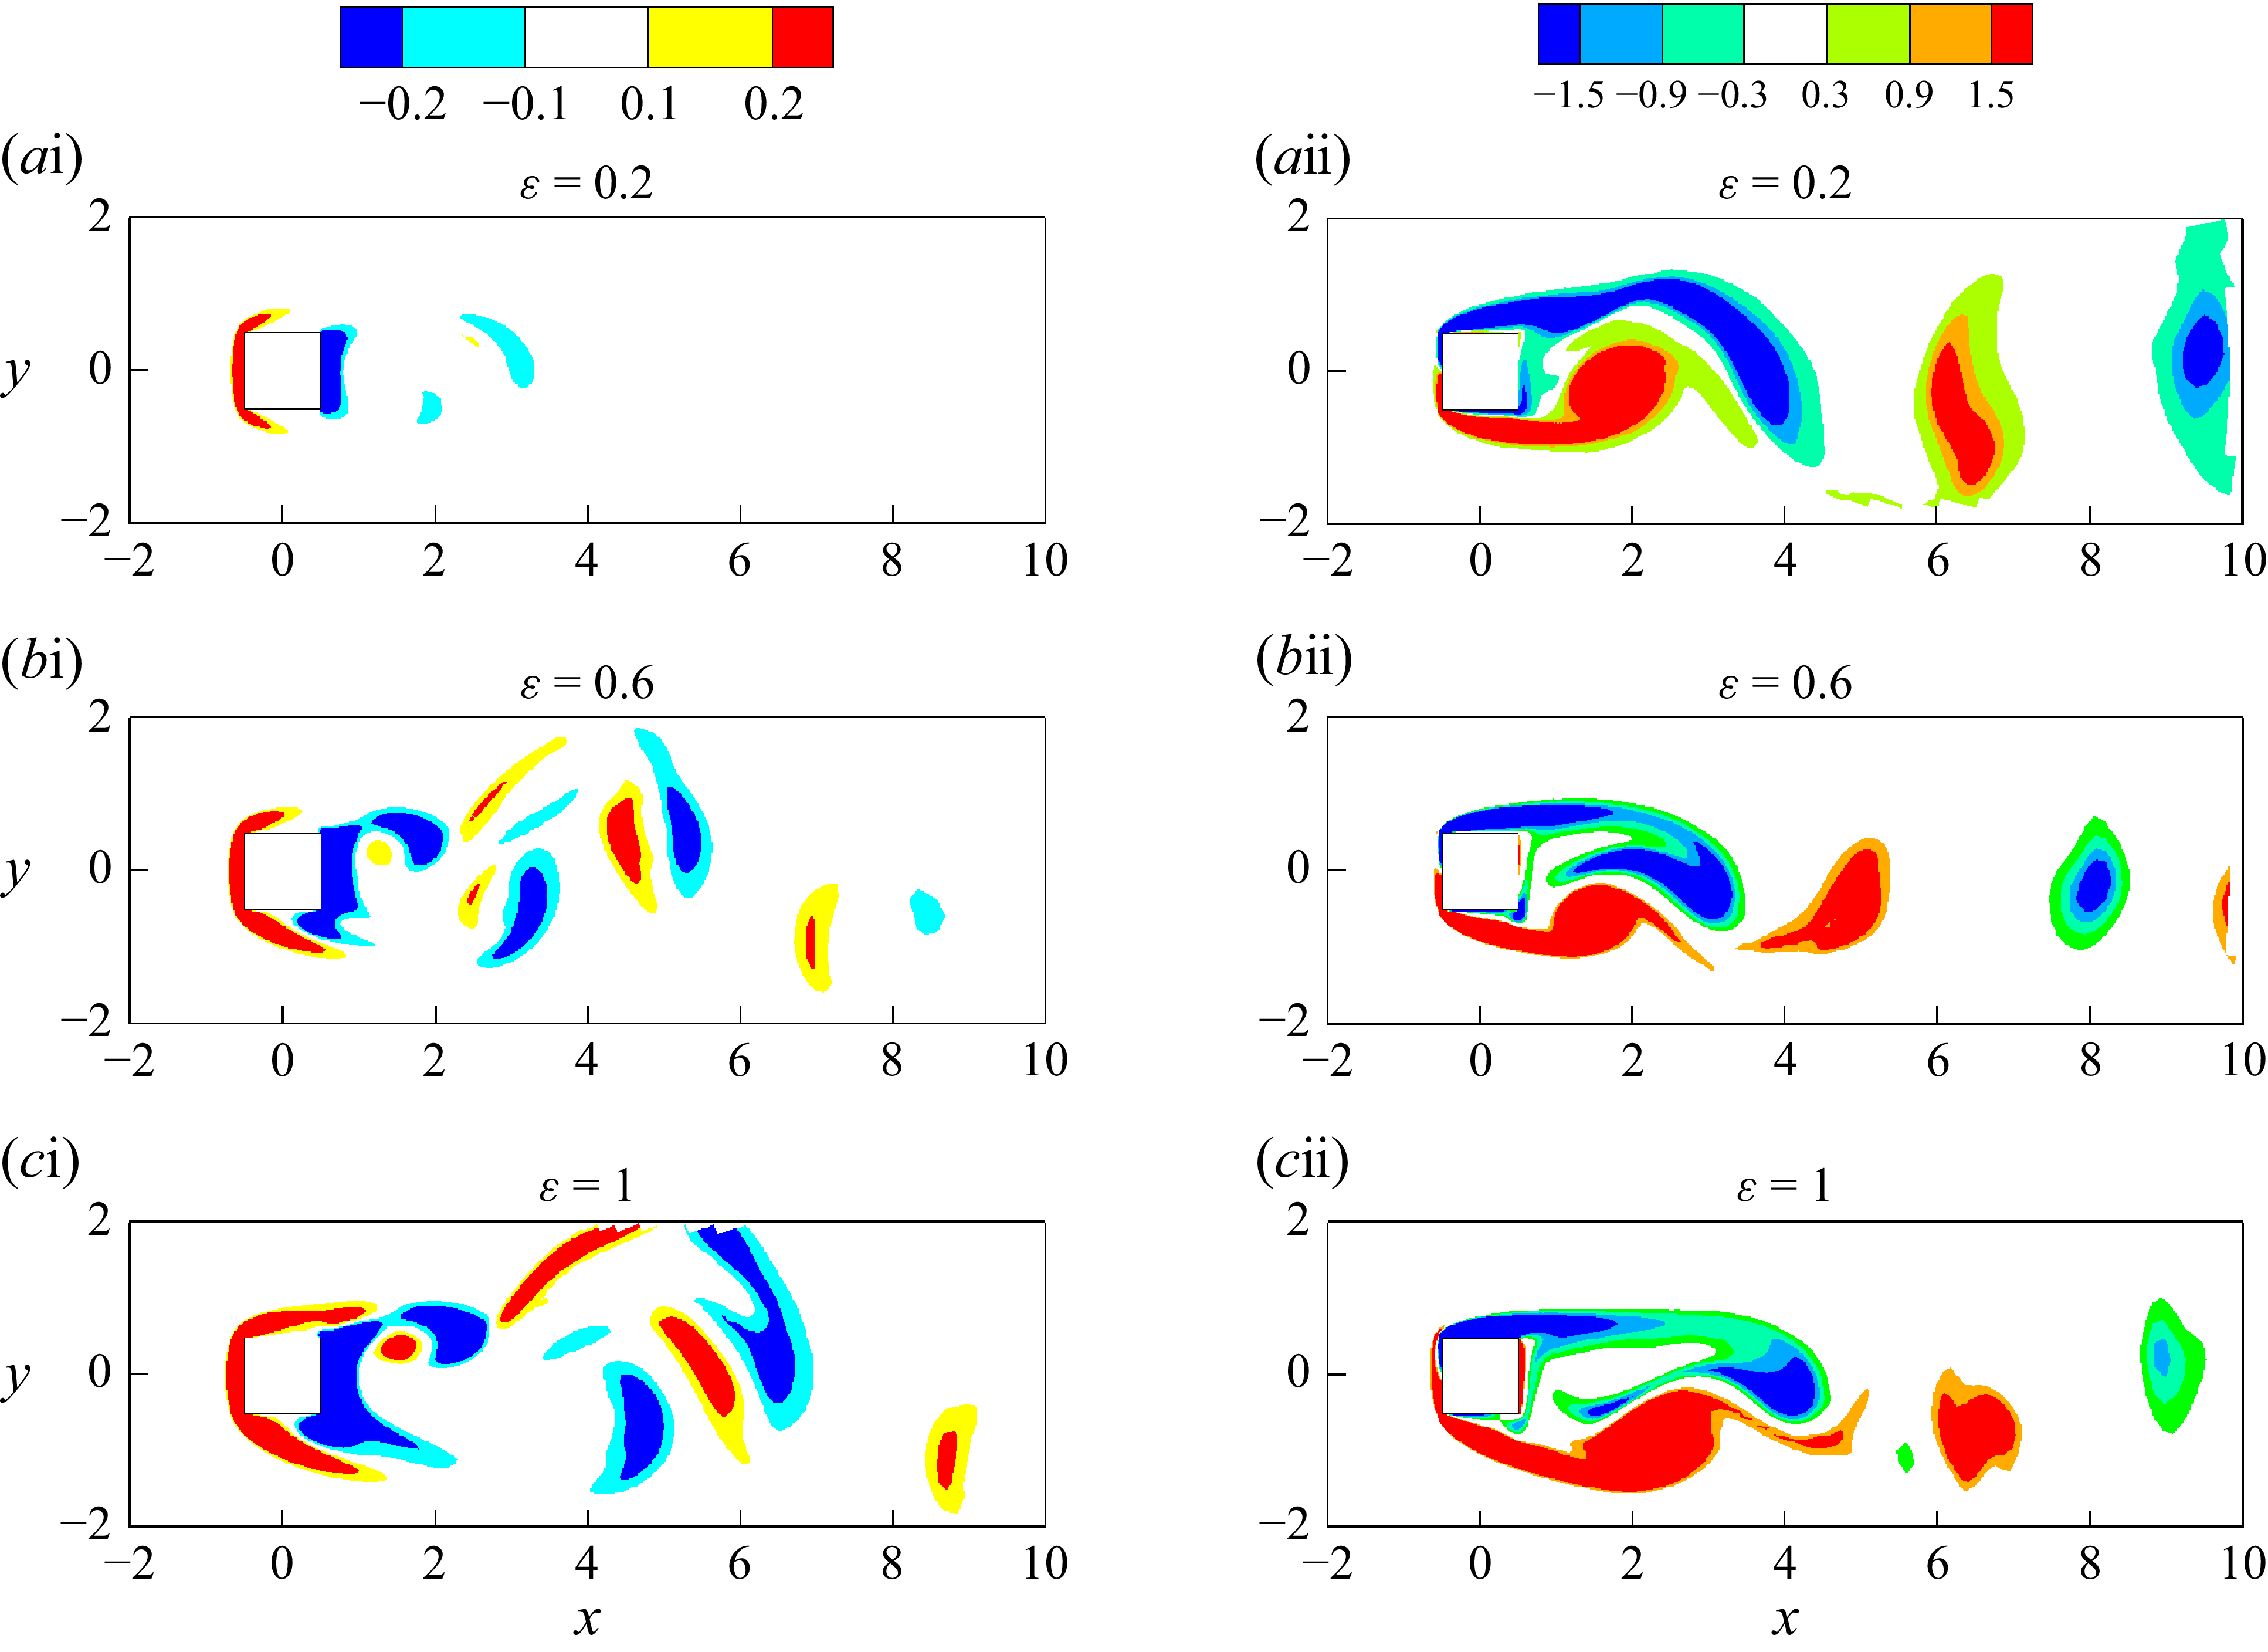
 Γz
 Ωz
 Re=300
 ε=0.2
 α=90∘
 Γz
 −1
 Ωz
 Ωz
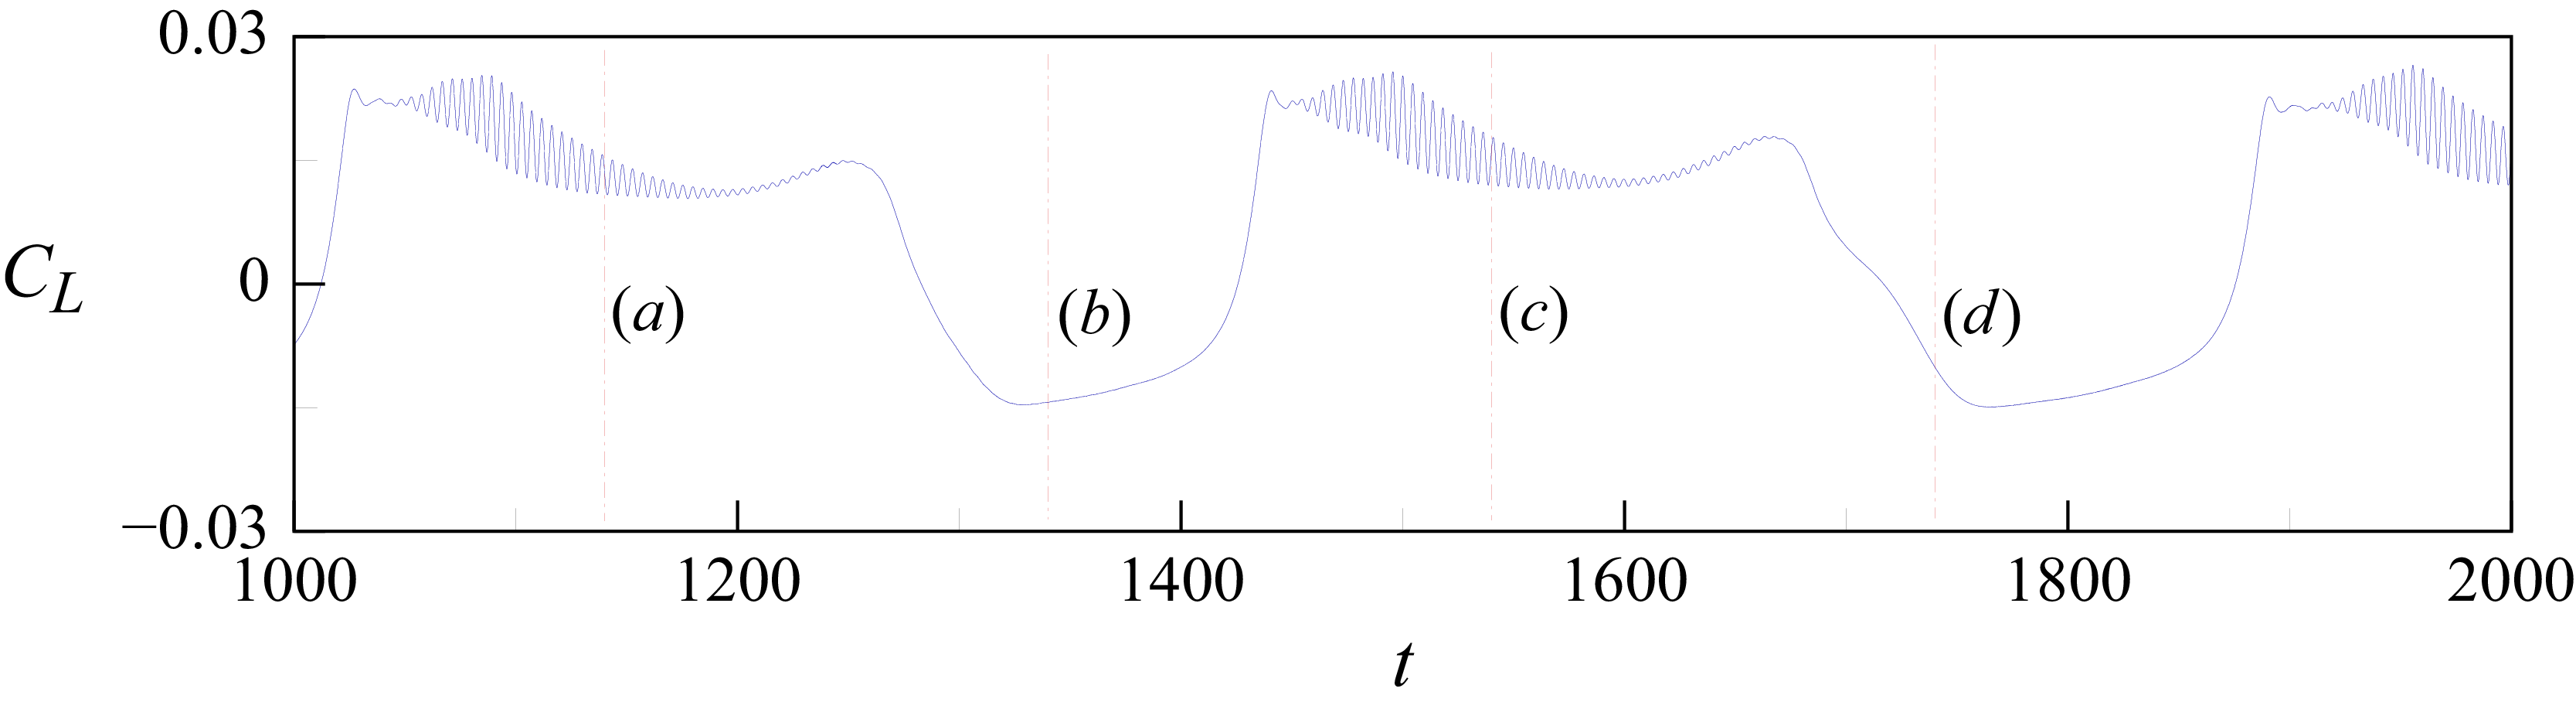
 CL
 ε=0.4
 CL

 Γx=±0.03
 ε=0.4
 Re=300
 α=0∘
 t=1140
 t=1340
 t=1540
 t=1740

 Ωy=±0.2
 Ωz
 ε=0.4
 Re=300
 α=0∘
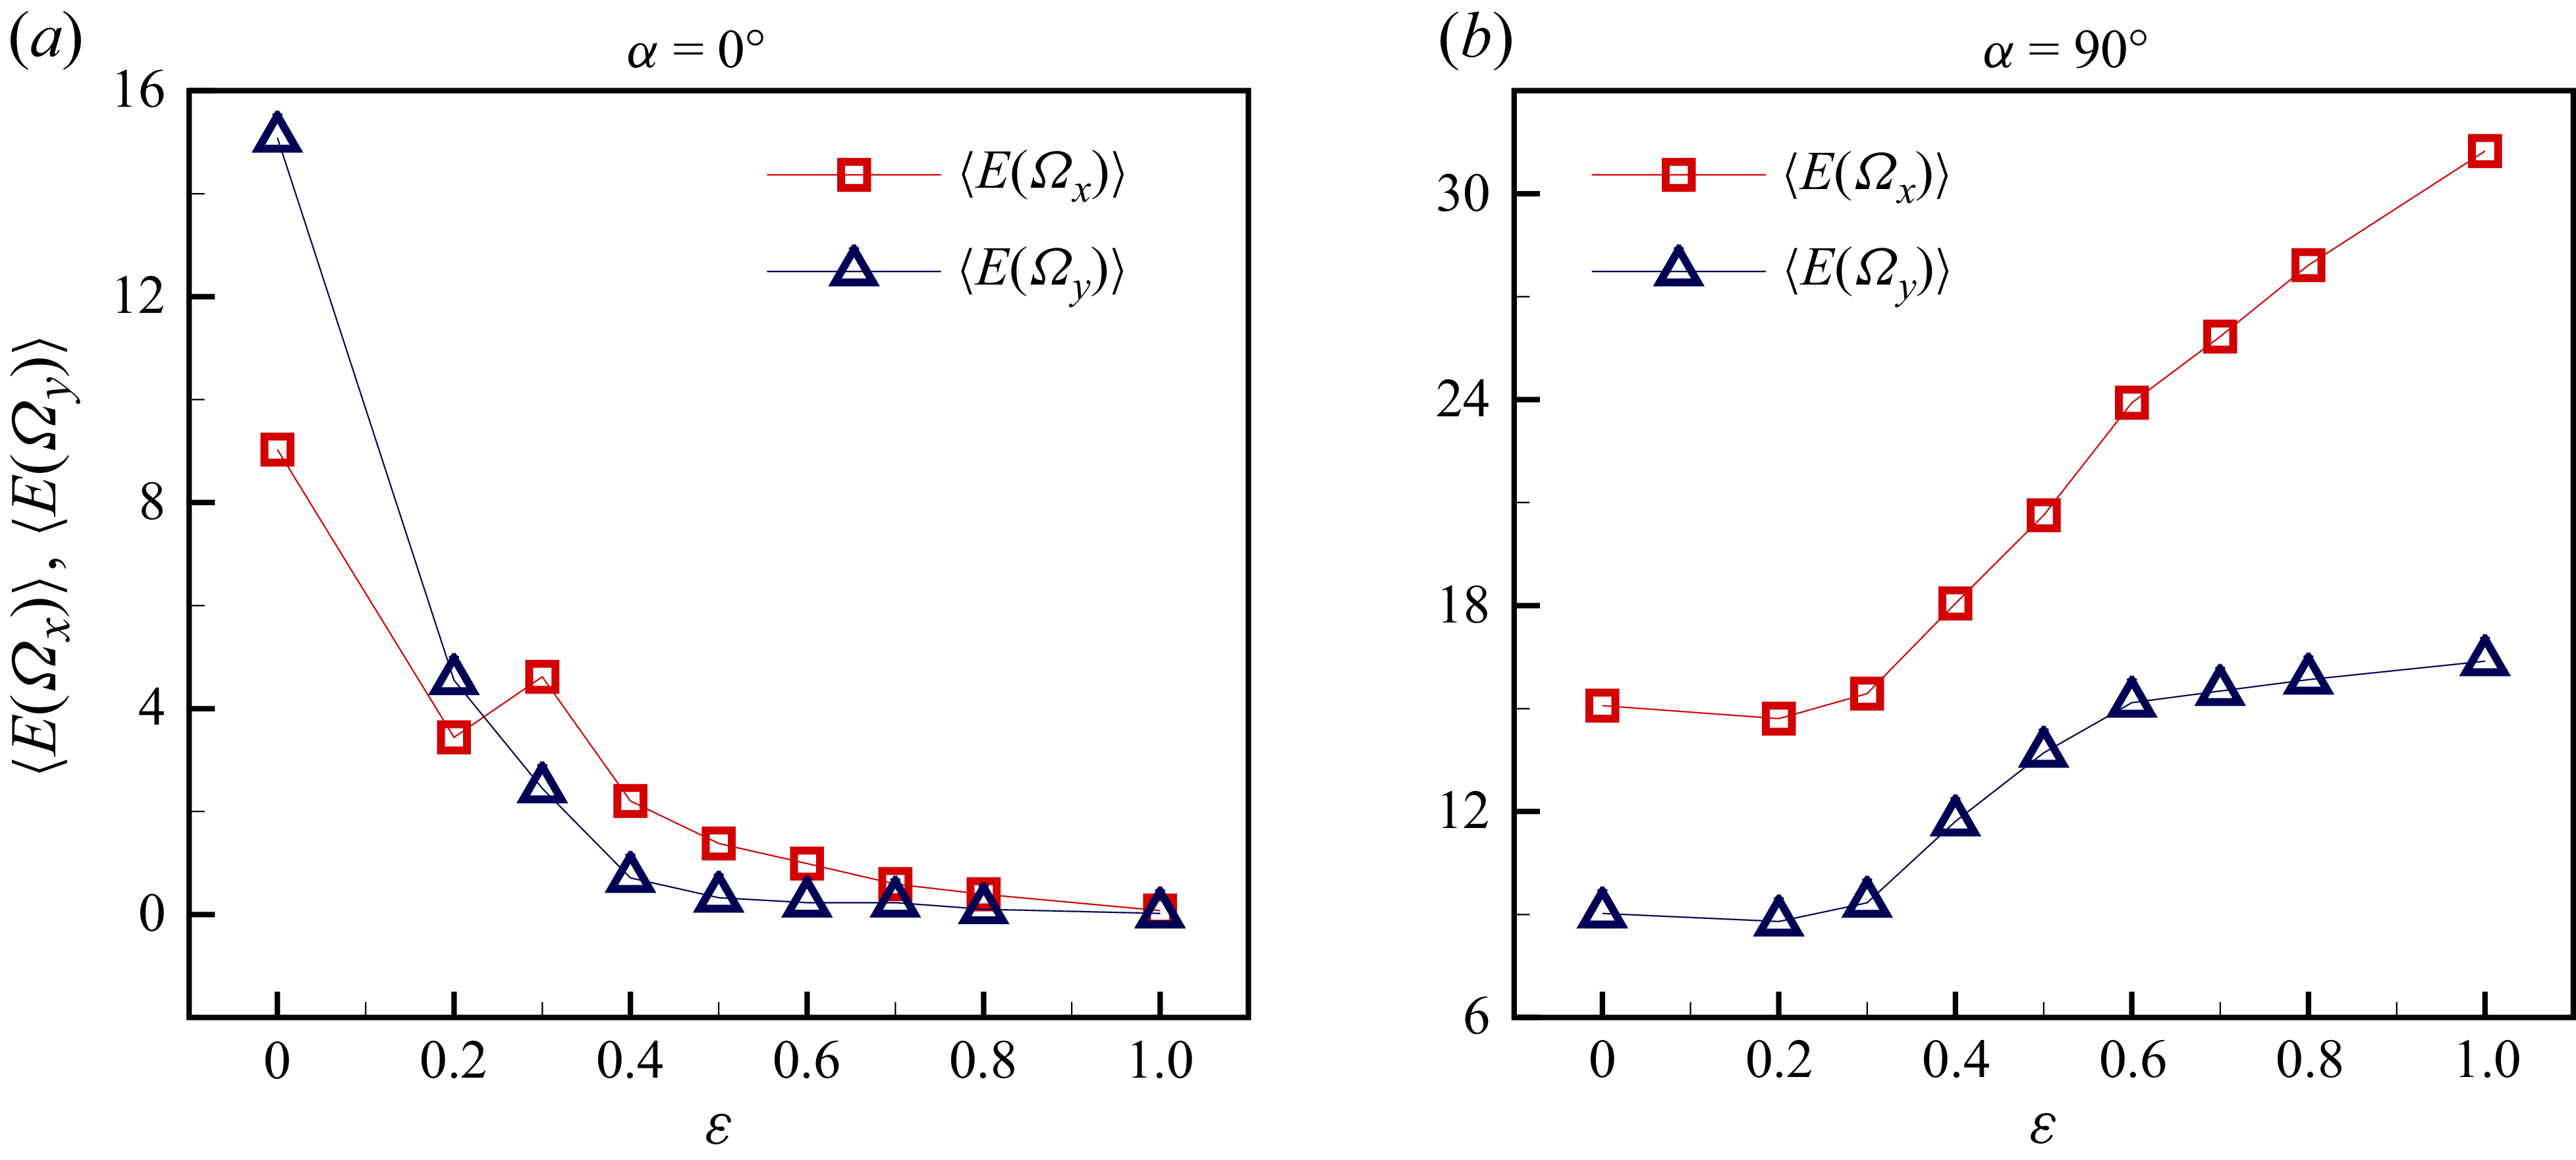
 ⟨E(Ωx)⟩
 ⟨E(Ωy)⟩
 ε
 Re=300
 α=0∘
 α=90∘
 y
 α=0∘
 x
 α=90∘

 ⟨E(ϕ)⟩
 x
 y
 ε
 Re=300
 α=0∘
 (∇ρ×∇p)/ρ2
 Γ
 (Ω⋅∇)V
 −(∇⋅V)Ω
 −(∇ρ×fv)/ρ2
 (∇×fv)/ρ

 ⟨E(ϕ)⟩
 x
 y
 ε
 Re=300
 α=90∘
 (∇ρ×∇p)/ρ2
 Γ
 (Ω⋅∇)V
 −(∇⋅V)Ω
 −(∇ρ×fv)/ρ2
 (∇×fv)/ρ

 Ωz
 Γz
 α=0∘
 α=90∘

 Open access

