In terms of their methodology, sociolinguistic studies tend to follow either the large survey approach, which was pioneered by Labov (Reference Labov1966), or the examination of more compact groups of speakers, as in the social networks approach (L. Milroy, Reference Milroy1987) or the ethnographic approach as showcased in the work of Eckert (Reference Eckert1989, Reference Eckert2000 among others). In a recent article, Dubois and Horvath (Reference Dubois and Horvath1999:288) raise the issue of whether the former approach should be “compromised in the pursuit of a deeper understanding of the social correlates of change.” Their question, to which they give a negative answer, reveals a dilemma that any researcher of a large (urban) speech community must face: should one work with as large a sample as possible to capture the full range of speakers in the community, and in that process risk disguising informative patterns of variation that are caused by small group dynamics? Or should one focus on as “tight” a community as possible and risk missing the more general pattern of variation?
Thankfully, not every sociolinguist has to face this quandary. Studies of variation and change in rural communities, where the overall population is smaller and tends to be less heterogeneous than that of urban centers, have been able to integrate the two approaches. This is true not only in recent publications (e.g., Hazen, Reference Hazen2004; Labov, Reference Labov2001; Weldon, Reference Weldon2003) but is also the case in Labov (Reference Labov1963), one of the inaugural publications of sociolinguistics, as Eckert (Reference Eckert2000) pointed out. Such studies have been able to present both the general pattern of variation in the community and the way in which more compact groups (e.g., social networks or communities of practice), or even individuals participate in the overall pattern. In so doing, they provide important information about the role of individual speakers in the process of change, a desideratum that has been expressed by several researchers in the field (see Joseph, Reference Joseph, Herring, van Reenen and Schøsler2000; Joseph & Janda, Reference Joseph, Janda, Joseph and Janda2003; Maclagan, Gordon, & Lewis, Reference Maclagan, Gordon and Lewis1999).
The present study follows such an integrated approach in investigating the change of [ʎi] and [ɲi] in a rural variety of Modern Greek. The results of the variationist analysis show that there is a change in progress as younger speakers are adopting an alveolar pronunciation of the sonorants in this phonetic environment because the palatal variants are stigmatized. The information that participants provided during the interviews reveals the nature of the stereotype against palatals and helps us understand some of the surprising aspects of the variation. Finally, by relating the linguistic behavior of outliers to their profile, as this emerges from the sociolinguistic interviews, we gain insight into the intricate relationship that exists between factors such as group reference, personal identity, gender, and age and how this relationship affects the speech pattern of individual speakers.
BACKGROUND
Newton (Reference Newton1972:137) observed that the (alveolar) lateral (/l/) and the alveolar nasal (/n/) are palatalized in Zakinthian and Northern Greek when followed by /i/, and in Thesalian Greek when followed by /i/ or /e/. For example, in all three of these dialects /ˈðini/ “s/he gives” and /ˈðili/ “evening” would be pronounced [ˈðiɲi] and [ˈðiʎi], as opposed to Standard Modern Greek (SMG) [ˈðini] and [ˈðili]. In Thesalian, one would also expect [ˈʎes] for SMG [ˈles] “you say.”Footnote 1 In the past decade, the pattern involving either /l/ or /n/ and the vowel /i/ (but not /e/) has steadily been noticed by linguists. Thus, even though this phenomenon is not mentioned in Kontosopoulos' (Reference Kontosopoulos1994) survey of Greek dialectal features, a study that figures prominently in the bibliography of Greek dialectology, it is briefly mentioned in the grammar of Holton, Mackridge, and Philippaki-Warburton (Reference Holton, Mackridge and Philippaki-Warburton1997:6). More recently, Papazachariou (Reference Papazachariou, Katsimali, Kalokerinos, Anagnostopoulou and Kappa2004, Reference Papazachariou, Janse, Joseph and Ralli2006) reported on the results of a variationist study on the pronunciation of /li/ in Patra, where he found evidence of three variants for the lateral sound; in addition to the alveolar variant there are two distinct postalveolar variants, one that is laminal and one that is apical, in the relevant environment. Furthermore, he shows that gender, education, and age affect the usage of each variant, and that in the youngest generation (17–30), males split their usage between the alveolar and apical postalveolar variants, whereas for females the usage of the alveolar variant is almost categorical.
Pappas (Reference Pappas and Hinskens2006b) examines the variation with respect to /n/ in the same community (Patra) and reports the existence of two types of postalveolar /n/ as well. Due to the fact that the formants of nasals are much weaker than those of laterals (Ladefoged, Reference Peter2003), this study did not attempt a precise description of the variants of /n/, limiting itself to the more general terms of palatal and palatalized, which presumably correspond to Papazachariou's laminal and apical postalveolar. Regarding the distribution of these variants of /n/ here too it is shown that age, gender, and education are significant factors, and that, as in Papazachariou (Reference Papazachariou, Janse, Joseph and Ralli2006), in the youngest group (25–35), male speakers are either alveolar users or palatal users, but female speakersFootnote 2 are all users of the alveolar variant. The study also shows that young male palatal users tend to have a positive view of provincial life, but alveolar users favor an urban life style.
If the emergence of postalveolar /l/ and /n/ as a topic in Greek linguistics has been gradual, its rise in the consciousness of the Greek-speaking population as a stigmatized regional variant has been meteoric. Papazachariou (Reference Papazachariou, Katsimali, Kalokerinos, Anagnostopoulou and Kappa2004) remarked that around the turn of the century this pronunciation was used as an important part of a mocking representation of people from Patra in a counterculture late-night comedy show called A.M.A.N.Footnote 3 Since then, references to the stigmatized palatals in the media have been increasing, so much so that a major character in the most popular show of the last year (Sto Para Pente) is cast as a user of palatal /l/ and /n/. In the episode broadcast on January 22, 2007 (#2.11), the character Amalia shows her friends the much-awaited video clip for her song /fiˈli fiˈli me liˈtronis/ “kiss by kiss you redeem me.” The song, intended as a spoof, is a showcase of palatal pronunciation as the lyrics include 16 instances of li syllables and 14 instances of ni. Equally successful have been two television (TV) commercials for the satellite TV provider NOVA, in which the star is a village policeman, who, as the ads imply, has seen one too many U.S. police dramas and as a result behaves as a U.S. police officer, and even speaks to his fellow villagers in “Greenglish.” The character uses palatal /l/ and /n/ even in English words, for example, please is pronounced [pʎiz]. All of the above videos can be found on the YouTube Web site. As will be discussed, these uses of the stereotype in popular culture reflect attitudes that are common in the younger generation. Let us now turn to the description of the speech community where the study was conducted.
FIELDWORK
The fieldwork was conducted during two separate periods, in the early summer of 2005 and then again in the early summer of 2006 while the author was directing a field school in the community under investigation. Each visit lasted roughly six weeks, during which time I had the opportunity to form friendly relations with members of the community and this allowed increasing degrees of access to community and family events, especially during the second visit.
The community
The sociolinguistic interviews that form the basis of this study took place in and around the village of Poros, which is located on the southeastern side of Kefalonia, approximately a 3-hour journey away from Patra (see map in Figure 1). The community was chosen for three reasons: First, Newton (Reference Newton1972) mentioned that palatalization is prevalent in the Ionian islands. Second, I had personally observed both alveolar and palatal pronunciation during an earlier visit. Third, Poros is a rural community that maintains strong ties with both Athens and Patra: the former is the focus of alveolar pronunciation, and the latter is the most salient urban center in terms of palatal usage. It appeared likely then that this community would showcase the effects of the stereotype on language variation.
Map of Southern Greece (Perry-Castañeda Library Map Collection, University of Texas).

Poros came into existence after the devastating earthquake that struck Kefalonia in 1953, which leveled most of the island's villages and forced tens of thousands of its inhabitants to leave and seek a new beginning either elsewhere in Greece or abroad. Previously the area of Poros was mainly used for agriculture and especially the cultivation of raisins. After the earthquake, however, it was determined that most of the surrounding mountain villages were not built on stable enough ground so families were given allotments in this location. As a result, the present population of the village is a conglomerate of families with roots in surrounding villages such as Asprogerakas, Monastiraki, Kapandriti, and others. Several families nowadays run their businesses in Poros but live in the surrounding villages.
Poros was a successful summer resort during the 1980s and early 1990s, attracting tourists from both Greece and abroad, especially England. Since the mid 1990s, however, the tourism industry began to decline mainly through competition with the neighboring resort of Skala. Thus, nowadays Poros is characterized by a very subdued tourist presence, especially in the early summer months, when most of the hotels and pensions remain empty. It is only in late July and August that, through the return of expatriates, the village population increases significantly and the tourist period is in full swing. On the other hand, the presence of the harbor that connects southern Kefalonia with the port of Kilini and the Peloponnesus has helped the village develop commercial activities connected to large-scale trade. Despite its decline in terms of being a summer resort, Poros remains the most populous community of the Elios-Pronnoi municipality as well as the most significant commercial center of the southern part of Kefalonia.
Poros is an active community throughout the year. The local elementary school has six grades and attracts students from other villages. There is a club for learning traditional dancing and attendance is very good, as the club has three different age groups (children, young adults, and adults). There is a soccer club (in cooperation with surrounding communities) in which at least 50 young men participate at various levels. The community is not moribund by any stretch of the imagination. In fact, there is evidence that young people choose to return home after their studies or their military obligations. They become involved in the family business or engage in ventures of their own.
The participants
Overall, 53 participants were recruited for this study. Five of these, however, had to be excluded from the quantitative analysis, either because they had just arrived in Kefalonia from some other area of Greece or abroad (2) or because they were part of a group interview but did not contribute sufficiently to the conversation (3). The participants were recruited through the personal connections that the researcher established during his stay in the community or through the mediation of other participants. Several of the participants are members of the same family. All of the participants have “open networks” (J. Milroy, Reference Milroy1992). Almost every family has relatives or friends that live in Athens or Patra, whom they see during the summer vacation season for an extended period. Most participants, except those over 70, have some connection to the tourist industry, which has brought them in contact with speakers from all over Greece and abroad, and they continue to maintain several of these contacts. Those over 70, especially the males, were forced to seek work or engage in trading on the mainland or in Athens after the earthquake, so they too have forged connections with speakers outside their own community. For teenagers, their exposure to speakers of the standard comes not only at school and through the media, but also by spending summer vacations in the company of cousins and friends who return to the island from urban areas, such as Athens or Patra.
The interviews
The challenge that the “observer's paradox” brings to the collection of data for variationist studies has been recognized from the inception of the field and several solutions have been proposed to mitigate its effect. However, as has already been noted by Wolfson (Reference Wolfson1976), it is perhaps overly optimistic to assume that the data obtained during a sociolinguistic interview could ever be truly representative of the vernacular, or, to be more specific, of that variety that participants use when they are talking with their closest childhood friend without a microphone and a recorder present. The degree to which the data depart from this ideal depends on many factors, key among them being how both the interviewer and the interview process are perceived by the participants (especially as it relates to the power relationship between interviewer and interviewee), the topic of discussion, the presence of others (active or passive) during the interviews, as well as the identity and worldview of the participants themselves. The normalizing effect that the sociolinguistic interview has on speakers seems to be especially significant in the case of stigmatized variants as observed by Weldon (Reference Weldon2003) and Hazen (Reference Hazen2004).
In what follows, my intention is to provide an accurate picture of the interview process that was employed in the majority of cases (in a few cases some topics were not discussed because the participants were not interested) and to indicate how each different part of the interviews was used in this project. At the end of this section, I will offer an evaluation of the language of the interviews as a whole, in terms of the distinction between casual and formal style of speech.
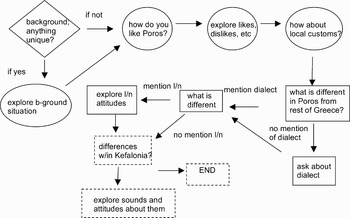
Most of the interviews were conducted in a one-to-one setting, but a few of them took place in groups of two or, rarely, three participants. The interviews were conducted in the homes or workplaces of participants or in a quiet public location in the researcher's hotel. The public location was deemed important especially for interviews with young female participants so as to not offend the communal sensibilities with respect to intergender interaction. The structure of the interviews is presented schematically in Figure 2. Each interview began with the usual questions about age, place of birth, education, profession, and such that help us create a participant's biographical profile. If there was anything extraordinary mentioned here, the topic would be further explored. For example, when a participant mentioned that she had spent several years in Canada, we explored that topic for a while before returning to the main line of questions. The first question of substance asked participants whether they liked or disliked life in the village, and depending on their answers, the next few questions explored specific interests or points of contention. Speakers were encouraged to talk at length about hobbies or other personal interests. This part of each interview lasted the longest and was used to construct the database for linguistic analysis. In the next segment of the interview, the participants were asked what they knew about local customs and in which ways Poros or Kefalonia differed from other places in Greece. If the answer included the local dialect, then the questions would become more focused, asking participants what is different about Kefalonian Greek. If there were no mention of the variety, I would ask directly, “Is Kefalonian the same as Athenian Greek?” Once on the subject of Kefalonian, speakers typically mentioned the existence of words of Italian origin, or the use of [tsi] in various forms of the definite article (genitive singular, accusative plural) where SMG has [tis]. In these cases, I would ask if there were any differences in pronunciation, and if the participant mentioned the palatalization of /li/ or /ni/, then the subject would be explored in depth: I would ask questions about how the two sounds (palatal and alveolar) differed, which one they used, what the palatal sounded like to them, or what was its meaning. This segment was used to assess participants' attitudes toward the variation. After this, or if the participant had not mentioned the palatalization of /li/ and /ni/, I would conclude the interview by asking a few questions about speech differences among the various villages. Most interviews lasted between 40 min and 1 hour.
Structure of sociolinguistic interview. Note: Diamond: biographical profile; oval: linguistic analysis; square (solid line): attitude toward variation; square (dotted line): not used thus far.

In general, it could be said that the majority of interviews were casual in style, especially once the conversation moved along and participants got over any anxiety they might have had about the questions that they would be asked. At the same time, it cannot be said that the distance between interviewer and participants was completely erased. A few younger speakers, all of them aware of the palatalized variants, commented that they were “careful” during the interview, that they tried to not speak as they would have with their grandmother. When I asked them in what respect they were trying to be careful, they responded that they tried to avoid [tsi] but they did not mention /li/ or /ni/.
A fair assessment of the data, then, would be that the language of the interviews may not truly represent the vernacular of young speakers. In more intimate settings, their speech may include more palatalized tokens of /li/ and /ni/ than what is reported in this study, as is the case with the stigmatized variants in the studies of Weldon (Reference Weldon2003:41) on Gullah and Hazen (Reference Hazen2004:251) on the Warren county variety. One has to wonder, however, which of the two patterns is more representative of a participant's linguistic behavior, especially when we take into consideration that he or she may have aspirations that transcend their locally defined identity and may be searching for roles and identities (Le Page & Tabouret-Keller, Reference Le Page and Tabouret-Keller1985) that are more in step with supralocal standards. It is also important to keep in mind that this variable is a stereotype, both in the local community and in the broader Greek-speaking community, so the speech pattern of speakers, who are aware of the stereotype, in semiformal situations can be quite informative about the social meaning of the variable and about the interaction among stereotypes, attitudes, and linguistic behavior.
SETUP OF THE STUDY
The envelope of variation
Regarding the construction of the database for the quantitative analysis, the goal was to extract at least 30 tokens of /li/ and 30 tokens of /ni/ for each of the 48 participants from the interview segment described in Figure 2. This was possible for all but three speakers for whom only 26, 28, and 29 tokens of /ni/ could be extracted. Another complication in the collection of data was that /li/ tokens are more frequent than tokens of /ni/; I elected to continue collecting tokens of /li/ until the set of /ni/ tokens was complete. Thus, the total number of tokens analyzed is 2919, 1484 of which are tokens of /li/.Footnote 4
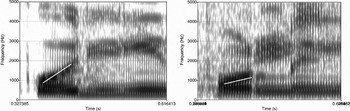
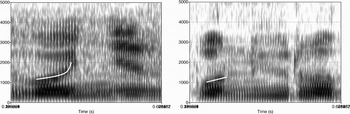
As has been already mentioned, the sociolinguistic variable under investigation is the coronal sonorant (/l/ or /n/, represented here by L) in /(C)Li(C)/ syllables.Footnote 5 The variants are either an alveolar realization or a palatal one ([l] or [ʎ] and [n] or [ɲ]). Unlike Patra, there does not seem to be a third variant in Kefalonia, that is, what Papazachariou (Reference Papazachariou, Katsimali, Kalokerinos, Anagnostopoulou and Kappa2004, Reference Papazachariou, Janse, Joseph and Ralli2006) labeled an apical postalveolar lateral. Of course, as is common in cases of dialect contact, there are several tokens that one can label as “fudges” in the sense of Chambers and Trudgill (Reference Chambers and Trudgill1998:110), that is, tokens that appear to have less of a palatal quality, as speakers, especially those who are aware of the stereotype, attempt to produce a more alveolar-sounding coronal sonorant. In similar fashion to Kochetov (Reference Kochetov2006:102), who treated the variants of unstressed /o/ in the Pokcha variety of Russian only in terms of rounding and not in terms of height, the coronal sonorants in this study are treated in terms of raising of tongue body and not in terms of place of occlusion. Thus, all tokens were coded either as palatal or alveolar. In general, tokens were coded impressionistically, but for a few (less than 10) tokens per speaker, a spectrographic examination (using Praat 4.2.19) was also conducted to verify the researcher's impressions. Figures 3A and 3B show the contrast between alveolar and palatal realizations of each sonorant. As in Pappas (Reference Pappas and Hinskens2006b), the major indicator for the quality of the sonorant is found in the F2 of the preceding vowel (indicated by the white line). In the alveolar realization, the second formant of the previous vowel stays steady, but in the palatal realization it glides upward.
Palatal versus alveolar lateral in the word /poˈli/ “much.”

Palatal versus alveolar lateral in the words /ɣoˈnis/ “parents” and /poniˈro/ “wicked.”

Factor groups
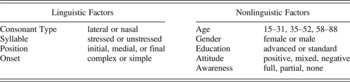
In this study, four linguistic and five nonlinguistic factor groups are considered. The linguistic factor groups are type of coronal sonorant, whether the syllable was stressed or not, position of the syllable in the word, and whether the sonorant is part of a complex onset or not. The nonlinguistic factor groups are age, gender,Footnote 6 education, attitude toward the community, and awareness of the variation. The makeup of each factor group is presented in Table 1, and the nonlinguistic factors are discussed in more detail in the following sections.
Setup of factor groups

Age
As shown in Table 1, participants have been classified as belonging to one of three age groups, each one roughly representing a different generation. It is useful to point out that the groups are also separated from one another by major events in the local or broader community. For example, the two older age groups are separated by the great earthquake that destroyed the island in 1953. Participants between 58 and 88 years old were at least in elementary school at that time, and so as teenagers or young adults, they had to deal with the effects of that catastrophe, one of which was the move to the new village of Poros. Participants in the middle-age group were either unborn or infants at this time; during their formative years, Poros had already been established and was beginning to prosper. The youngest group includes those participants who were born after the fall of the junta (1974) and came of age in an era in which the language teaching programs had stabilized and, after more than a century of language education reforms that had vacillated between weaker and stronger versions of the ancient attic dialect, public schools began to teach what is more or less SMG (cf. Arvaniti & Joseph, Reference Arvaniti and Joseph2000; Browning, Reference Browning1983; Horrocks, Reference Horrocks1997).
Education
Papazachariou (Reference Papazachariou, Janse, Joseph and Ralli2006) correctly noted that due to the many changes that have occurred in the Greek educational system over the past half century it is difficult to compare the levels of education between different age groups by simply looking at the grade of school that a participant has completed. A better standard is to judge whether the education a speaker has received was considered standard or advanced for its period, based both on government policy (how much schooling was considered mandatory?) and other criteria, such as what kind of profession was the speaker able to enter after completing his or her schooling. For example, a 60-year-old with six years of schooling and a 20-year-old with nine years of schooling are both considered to have received a standard education in this study. As for younger speakers, who are still in high school, they were classified according to their (self-reported) performance in school, and their aspirations for an advanced education.
Attitude
The fact that an individual's personal relationship with his or her speech community plays an important role in language variation and change was established early on in the study of variationist sociolinguistics; in Labov (Reference Labov1963), it was interpreted in terms of a speaker's attitude toward the community of Martha's Vineyard. In more recent studies, this relationship has been explored in terms of a speaker's identity or orientation, as in, for example, Ito and Preston (Reference Ito and Preston1998) with respect to the Northern Cities Shift in nonurban Northern Michigan, Dubois and Horvath (Reference Dubois and Horvath1999) in terms of Cajun identity, or Hazen (Reference Hazen2004) in terms of a local or expanded cultural identity in Warren county. For this study, attitude toward the local community is the less fluid and thus more appropriate factor group (for fluidity in personal identity, see Hazen, Reference Hazen2004; Mendoza-Denton, Reference Mendoza-Denton, Chambers, Trudgill and Schilling-Estes2002).
During the interviews, participants displayed three types of attitude toward their home community, which, it should be noted, they perceive as the island of Kefalonia in general, and not just the village of Poros or the surrounding area necessarily. A positive attitude means that the speaker has already decided to live in the village or on the island and is satisfied with the lifestyle that this decision entails. In addition, participants with a positive attitude are proud to be Kefalonians and identified their ideal mate as another Kefalonian. Participants were classified as having a mixed attitude if they are not satisfied with the lifestyle that they think Poros can provide, but also believe that it is a compromise they have to make to enjoy a better standard of living: no rent or mortgage, guaranteed employment in the family business, and almost no commuting. Finally, a negative attitude means that participants are actively planning to leave the island or, if they are forced by life circumstances to live there, they see very few advantages to doing so. Not every participant fits neatly into one of these three categories. The significantly complex cases are dealt with in the discussion of the results.Footnote 7
Awareness
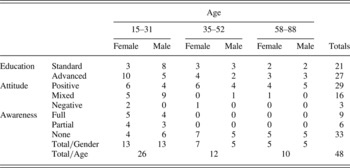
Another interesting as well as surprising fact that was uncovered during the sociolinguistic interviews concerns the types of awareness of the stigmatization of the palatal variant. Instead of the expected dichotomy between participants who are aware of the stereotype (mostly younger) and participants who are not aware of it (mostly older), as was the case in Patra (Pappas, Reference Pappas and Hinskens2006b), there are actually three types of awareness in the community of Poros. The third type comprises participants who are aware that palatal coronal sonorants are stigmatized in general but do not recognize that these variants are part of the local dialect. These speakers are classified as partially aware of the stereotype. Table 2 provides the number of participants in each cell.
Distribution of participants per nonlinguistic factor

RESULTS
I begin the presentation of the results of the variationist analysis by looking at the percentage of use of the alveolar variant across time for individual speakers, as seen in Figure 4 (due to some overlap between age and percentage of alveolar usage, not all individuals appear in the chart). The figure clearly shows that the standard pronunciation is used predominantly by the youngest group of speakers (15–31), although there are some outliers (speakers whose behavior is different from that of their age group) in the other two groups, who exhibit significant use of the alveolar. In both groups, the outliers are female speakers: in the oldest group, Magda uses the alveolar 47% of the time (28 tokens out of 60), and in the middle group there are Athena (42%, 25 out of 59), Lena (61%, 38 out of 62), and Eli (100%, 56 out of 56).
Percentage of alveolar usage across time.

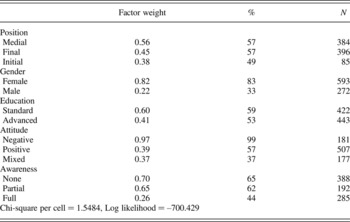
Due to the absence of variation in the two older groups, only the data for the youngest group (15–31) were statistically analyzed, using the program Goldvarb (2.0 for Macintosh, Rand & Sankoff 1990). In the discussion section of this article, however, we will return to the four outliers mentioned previously. The results of the analysis are given in Table 3 for significant factor groups only. The only linguistic factor group that is significant is the position of the syllable in the word, with initial position being the significant factor disfavoring the use of the alveolar (weight = .38). All nonlinguistic factor groups are significant, and they are the ones that this discussion will focus on. Not surprisingly, women favor the use of the nonstigmatized, alveolar variant (weight = .82) but men do not (weight = .22). It is unexpected, however, that speakers with an advanced education do not favor the alveolar variant (weight = .41), whereas speakers with a standard education do (weight = .60). Within the factor groups with more than two factors (attitude and awareness) the most salient parameters are negative attitude, which favors the alveolar (weight = .97), and full awareness of the stereotype, which, surprisingly, does not (weight = .26). The significance of these individual factors was determined using the method described in Bayley (Reference Bayley, Chambers, Trudgill and Schilling-Estes2002:129). The chi-square per cell value is slightly greater than 1.5, which signifies, again according to Bayley (Reference Bayley, Chambers, Trudgill and Schilling-Estes2002:128), that there is interaction between the factor groups.
goldvarb results for age group (15–31)

Note: Nonsignificant factor groups: consonant type, onset, syllable.
Testing for interaction effects was carried out by the statistical software JMP, using likelihood-ratio tests (6.0 for Macintosh). Table 4 lists the effects that could be tested and were determined to be significant.Footnote 8
Significant interaction effects

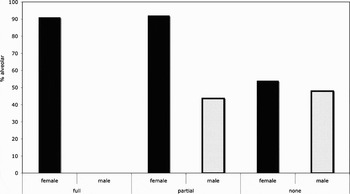
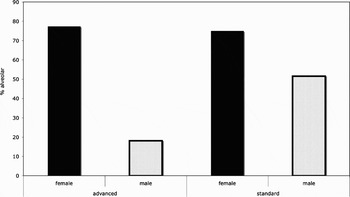
Let us now turn to the causes of each crossing effect. The interaction between gender and awareness is based primarily on the fact that women who are aware of the stereotype have the highest percentage of alveolar usage, but fully aware men have the lowest, and the difference between them is 91 percentage points (Figure 5). Similarly, the interaction between gender and education (Figure 6) appears to be rooted in the fact that the level of education is not a factor for women but it is a factor for men; those with an advanced education use the alveolar variant less than those with a standard education (18% vs. 51%). In other words, Figures 5 and 6 point out that the source of both unexpected results discussed is the linguistic behavior of young male speakers. I will return to this issue in the discussion section.
Crossing effects: gender within awareness.

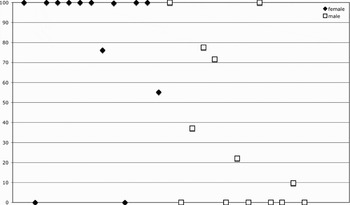
It is also informative to look at the pattern of alveolar usage in the youngest age group according to the gender of each speaker (Figure 7). As can be seen in this figure, females are predominantly categorical users of the alveolar variant, but most males use the palatal. Nevertheless, there are noteworthy outliers for each group. Female outliers are those who use the alveolar the least (Yuli = 0%, 60 out of 60, Chrysa = 0%, 60 out of 60, Roxane = 56%, 32 out of 60), and male outliers are those who use the alveolar variant the most (Aris = 100%, 60 out of 60, Solon = 100%, 60 out of 60, Mikis = 78%, 45 out of 58, Tolis = 72%, 49 out of 67). The circumstances surrounding each of these individuals provide us with important information about the interaction between stereotypes and change, as will be shown in the next section. Overall, the most significant aspect of the pattern seen in Figure 7 is the lack of variability, as only 7 of the 26 speakers in this age group show a distribution other than 0% or 100%, whereas the overwhelming majority of variationist studies (especially those involving vowels) show that change is gradual. This result is especially striking if we take into account that the parents' generation (35–52) uses the palatal variants (see Figure 4), which means that the first language acquisition input for younger speakers was the palatal, and they must have adopted the innovative pattern of pronunciation by early adolescence. This lack of variability is rare but not unprecedented, as it has been reported in a few other studies as well. Most recently, Sankoff and Blondeau (Reference Sankoff and Blondeau2007:580–581) found that in the change from [r] to [R] in Montreal French most speakers use one or the other variant, while Labov, Ash, and Boberg (Reference Labov, Ash and Boberg2006:47, 262) report that the replacement of r-less pronunciation by r-full pronunciation in the U.S. South has been so swift that “young white speakers are consistently r-full.”Footnote 9
Gender within education.

Finally, even though the factor group consonant type was not selected as statistically significant in the Goldvarb analysis, the data show that for some participants there is a difference between the pronunciation of laterals and nasals. Figure 8 presents those individuals with significant differences. There does not appear to be any particular pattern to the variation.
Percentage of alveolar usage by gender in age group (15–31).

Alveolar use by consonant for selected speakers in youngest age group. Note: Females: Tania, Roxane.

DISCUSSION
As has become evident from the previous discussion and can be seen in Figure 9, the pattern of variation indicates that this is a case of change in progress, in which the alveolar pronunciation of /l/ and /n/ in (C)Li(C) syllables is replacing the palatal one. In this section, I will discuss the results of the statistical analysis in terms of participants' awareness of the variation, the social connotations of the stereotype, and the behavior of outliers.
Mean (percent) of alveolar usage by age group.

Three types of awareness
One of the major insights that the study of variation and change has produced over the past four decades has been that certain changes take place above the level of sociolinguistic awareness while other changes take place below this level (Dubois & Horvath, Reference Dubois and Horvath1999; Labov, Reference Labov2001; Trudgill, Reference Trudgill1974). The distinction plays an important part in the variationist paradigm of language change, as it figures prominently in Labov's (2001:274, 292) Principles 3 and 4.
Principle 3: In linguistic change from above, women adopt prestige forms at a higher rate than men do.
Principle 4: In linguistic change from below, women use higher frequencies of innovative forms than men do.
But what do we mean when we use the concept of awareness? Do we mean the community as a whole or do we mean individual speakers? Labov (Reference Labov2001:272–273) spoke of social and not individual consciousness, but the former must be constructed on the basis of the latter. It is reasonable then to wonder what happens when the social and the individual aspects do not coincide, as the ethnographic interviews conducted in this study show for several of the participants. As seen in Table 2, of the 48 participants who were interviewed, there are 15 participants who are aware (fully or partially) that there is variation in the pronunciation of the lateral and nasal, all of them members of the youngest age group. Notice however, that there are also speakers (all female) who use the alveolar variant to some extent in the other age groups, but they do not appear to be aware of the variation. The evidence indicates then that for some speakers this is a change from above, but for others it is a change from below.
Another concern about the term awareness is that its usage implies a binary opposition (aware vs. unaware). However, as was discussed previously, some speakers who took part in this study, though aware that /l/ and /n/ are pronounced as palatals by speakers of other regional varieties, are not aware that this feature is part of the local variety. Thus of the 15 speakers mentioned, six are unaware of the variation within their own community. The following excerpt is an exchange between the interviewer and Nitsa, a female participant, and is typical of most conversations with participants who are partially aware of the variation:
(1)
PP: Is there anything that is characteristic about the Kefalonian way of speaking?
NITSA: Yes there are a lot of words, different kinds of words. No relationship to vlachika.
PP: Can you give me some examples?
NITSA: Examples, hmm … funny, my brain is stuck (laughter, nervous).
PP: That is what usually happens.
NITSA: Yes (laughter), uh … what can I tell you, isn't this funny, uh …
PP: For example, I have heard the word kurlos …
NITSA: Kurlos, yes, it means “crazy,” what else? uh … from palavos [fool] palavokakomiris [miserable fool] (laughter).
PP: Palavokakomiris? I haven't heard that one before.
NITSA: (laughing) yes. What else? uh … what else, what else?
PP: I have also heard the word psimenos.
NITSA: Psimenos, like we say “pitiful,” psimene mu, there are many of them [words], many.
PP: And do you use them?
NITSA: Yes, I use them too.
PP: When do you use them? When you are talking to your family, when …
NITSA: I have no problem, whenever.
PP: Besides words, is there anything in the pronunciation?
NITSA: Pronunciation … I will tell you about Liksuri [a village] where they speak as if they sing …
PP: I have heard that, but no one can give me an example …
NITSA: I won't be able to help you either with that one, what else? I think it is mostly words.
PP: Did you notice any differences between Patra and Poros?
NITSA: Yes, you are talking about pronunciation, right? In Patra they stress the li and the ni, they say [ʎi] and [ɲi], I think it is li more, and they too have words, their words are more vlachikes, for example instead of eki [there], they say ekithe, they have some weird words.
PP: How do you say eki, in Poros?
NITSA: (silence, 2 sec) edeki (laughter)
PP: Ah, yes and how about edo [here]?
NITSA: edepa! (laughter)
PP: (laughter)
What I hope to have shown with this lengthy excerpt is that (a) the palatalization of /li/ and /ni/ as a feature of the Patra variety is very salient in this speaker's mind, as she identified it immediately, and (b) her lack of awareness about palatalization in Poros is real, as she was directly asked to compare the pronunciations of the two locales. Similar questions were asked of all participants. Of the six participants who identified palatalization of /li/ and /ni/ as a feature of a different regional variety, three identified that region as Patra and two as Lamia, a city 200 km north of Athens, and one as the region of Macedonia. All participants had spent some time in the city they mentioned, except for the one who identified it as a Macedonian (Northern Greek) trait; she had lived in Athens for a few years.
The existence of such “intermediate” types of awareness, one of which has been uncovered in this study, leads one to wonder what their effect on language change might be. Within the limits of the sample of speakers that participated in this study, the answer to this question is complex and cannot be addressed without reference to the particular circumstances of individuals. Before we enter into that discussion, however, we need to explore the social connotations of the use of palatal /li/ and /ni/ for those speakers who are either partially or fully aware of the stereotype.
The social meaning of the palatal stereotype
Speakers' perception of the palatal variants varies by gender. Young females are most likely to view it negatively. Excerpt (1) is an appropriate starting point, because the participant uses an adjective, which is often employed by speakers who have a negative perception of the palatal variants. This adjective is vlachiko; the word literally means “pertaining to the Vlachs,” an erstwhile group of nomads who spoke a variety of Balkan Romance (Aroumanian), but it is used by many Greeks to connote qualities such as living in a rural area, being uneducated, being unsophisticated, and such.Footnote 10 Notice that the speaker quickly seeks to establish that the Kefalonian variety is not vlachlike, which in an indirect way confirms her positive attitude toward her native dialect, despite its other regional characteristics. Notice also that the speaker uses the adjective vlachiko to describe the words used in Patra, thus setting up the distinction vlachlike versus not vlachlike as a parallel to the distinction between Patra (use of palatals) and Kefalonia (no palatals). Other participants were more direct in their dislike for palatalization:
(2)
PP: How does this [the palatal]Footnote 11 sound to you?
ASPA: Ugly, [yes, I don't like how it sounds, I don't like it, I don't know].
PP: [ugly?
PP: For example, if you hear someone using it, and you don't know [him] …
ASPA: [yes
PP: … for example you pick up the phone at the office [and someone uses it] …
ASPA: [yes
PP: … what would your impression be?
ASPA: That … no, no! not that he is of a lowest [sic] level, it has nothing to do with that, I just don't like how it sounds. Basically, in my mind I think that he is from some village, that he has lived in the country for many years and he has adopted it, or rather he uses it … but, there is no other reason, I don't think anything else about him.
In this excerpt, the respondent places a negative evaluation on palatalization (“ugly”), and associates it with a rural lifestyle (“he has lived in the country”). Of course, she tries to portray her reaction as an aesthetic and not a social judgment (“I don't like the way it sounds” and “not that he is of a lowest [sic] level”), but her response clearly shows that palatalization is severely stigmatized. What is particularly interesting is that the same participant had previously spoken favorably of using Kefalonian words, the form [tsi] for the definite article and even the “melodic” style of intonation, and that this was part of her effort to establish herself as a Kefalonian after a few years in Athens. Thus, her negative evaluation of palatal /li/ and /ni/ is not connected to the local community but has a supraregional character.
In other interviews, female participants revealed that there is a fair amount of teasing concerning palatalization, especially in school, and that users of the palatal variants sound “old.”Footnote 12 The following excerpt is from an interview with a high school girl who had just moved to Kefalonia in the winter of 2006.Footnote 13 Her response to my question gives us the true measure of how stigmatized the palatalization of /li/ and /ni/ really is.
(3)
PP: Would it bother you if you had children here and they used [ɲi] and [ʎi]?
FOFI: Yes that would bother me. The [ɲi] and the [ʎi] are very annoying, I could not stand it, if they were to come up to me and say [ti kaˈɲis maˈma] (“how are you mom?”), no, no never!
The response of Keti—a 19-year-old female, who has just spent her first year in Athens as a student, but is in general favorably disposed toward the local community—to the same question nicely captures the essence of the stereotype.
(4)
KETI: Oh I don't know (nervous laughter), uhh … I believe … yes, I understand, that up until the age of 12 or 13, I would consider it pleasant, amusing, but after a certain age, not, not that it would bother me, but I simply would not recommend it, because, I see that in cities there is some reserve towards people that do not come from a city of similar size and they display their difference, they treat them … how can I say this, the outsiders, I mean, if you are speaking in a strange way, someone might say to you “what kind of speech is that mori vlachara [you hillbilly]?”Footnote 14
PP: Will they say something like that to your face?
KETI: If it is a friend who can say that to you, you know as a joke even, but between joking and seriousness, you find out the biggest truths. uhh … I believe that yes, if I speak like that with an intense [ʎi] and [ɲi], and with [tsi], and like I am singing, everyone will look at me dumbfounded …
PP: Which one do you think is uglier, we have the singing, the [tsi] and [ʎi] and [ɲi]?
KETI: [ʎi] and [ɲi].
PP: Really?
KETI: Because that is [a feature] of the pure vlachs (laughter) that live in Central Greece, so, I don't know, in Athens they have the impression when you speak like this that “he is a bit stupid, he is from a village. He does not have any experience,” thoughts that happen in a second, so you become more cautious (trouble with word).
PP: You want to be involved with marketing and public relations, would you ever hire someone who uses the [ʎi] and [ɲi]?
KETI: No.
PP: No way?
KETI: No.
The responses provided during the interviews indicate that young women associate the palatal pronunciation of /li/ and /ni/ with being rural, old, ugly, stupid, and unemployable. These evaluations comport with the usage of the palatal pronunciation in popular culture, for example, the caricature of the ridiculously America-stricken village cop in the commercials mentioned in the background section. They also show that the stigma attached to the palatal variants is especially strong, a consideration that is important when we are trying to understand how and why speakers change their linguistic behavior in response to it. Meyerhoff and Niedzielsky (Reference Meyerhoff and Niedzielsky2003:543), in a discussion about the globalization of vernacular English within the specific context of New Zealand society, employed the phrase cultural cringe in characterizing how some New Zealanders view their local culture in relation to cultures such as that of Britain or the United States:
It is a term used informally to refer to attitudes or statements that deprecate or belittle local achievements or mores, while discursively constructing some external alternative as aesthetically, morally, or practically “better.” Crucially the alternatives are presented as being better solely because they are associated with a prestigious external reference group.
The sentiments expressed in the interviews reveal a relationship that is more complicated than this, as the prestigious group is external but also native, in so far as it is easier for young women in Poros to become members of mainstream urban Greek society, than it is for New Zealanders to become Americans. In addition, the fact that local varieties are perceived to be subsets of Greek allows speakers to transport the stigmatized variants to other groups and thus maintain a positive attitude toward the local community. We could say that the reaction that we see in these participants is selective intracultural cringe.
Male respondents adopted a more defiant attitude in the interviews. Most of them reported that they became aware of the existence of the variation and of the stigma attached to the palatal pronunciation when they went away for university at a larger city. According to their accounts, they were teased by speakers from other areas, mostly Athens and Thessaloniki (the second largest Greek city). When asked how they reacted to such criticism, they responded that it was all in good fun, and they could not seriously be expected to change the way that they speak because, after all, that is who they are, and they could not be expected to “wear a mask” for the rest of their lives.
(5)
PP: Does it bother you that I am asking you about these matters?
STELIOS: No, not at all. Look I told you that in order to reach a point where you can appreciate your circumstances, you have to be able to look at yourself critically. Back then, the reason that I was trying to limit something may have been that I felt that I was the kid from the countryside and everyone else was from the capital, and the situation felt a little bit like a competition. Perhaps that was something that I was pursuing, back then, but after a while if you sit down and reflect upon who you are you say “For what reason? This is who I am, this is how I was raised, I have nothing to be ashamed of. I will speak as I please, and whoever likes it, likes it.”
Males who are only partially aware of the variation exhibited a similar attitude. Their comment on the existence of palatalization in Patra was that every region has its own pronunciation, but there does not seem to be any negative or positive evaluation, as seen in the following excerpt.
(6)
PP: Did you notice any differences in the pronunciation in Patra?
THEO: Yes every place in Greece has a different way of expression and speaking. They speak … you understand. If I hear someone, I will infer where he is from. For example, people from Patra … if he says two words to me I will understand that he is from Patra.
PP: Which words made an impression on you?
THEO: Not particular words, their pronunciation … I mean people from Patra have something … like they are stressing something. I mean when I was in the army in Florina, they had … they spoke … an accent. You can understand that they are from a certain place.
However, it would be a mistake to think that male speakers are completely impervious to the pressures that the intense stigmatization of palatal /li/ and /ni/ creates. This is seen quite clearly in the following excerpt in which a brother and a sister (Akis and Keti) are discussing the local feature with the interviewer.
(7)
KETI: In Kefalonia, where I hear it [palatals] more, then I might say it. When I don't hear it, I lose the tendency to speak that way.
AKIS: The same for me. To a great extent. In Kefalonia, when I get here, I start to hit [i.e., stress] the [ʎi]. Not [the [ɲi], the [ʎi].
PP: [Really?
AKIS: I mean, [I recognize, a few seconds, a few tenths after the word comes out, “how did that come out?”
PP: [Really?
AKIS: Really, [aˈʎiθja].
PP: And [how does it make you feel?
KETI: [[aˈʎiθja].
AKIS: [I don't feel comfortable.
KETI: [[aˈʎiθja]!
AKIS: Not that it bothers me, but it is [strange, (laughing) not that kind of lamda (/l/) Keti!
KETI: [[aˈʎiθja]!!
KETI: That is what you said, [aˈʎiθja]!!!
AKIS: (giving up): That was it, OK.
There are several interesting points to note here. The first one is that the brother's assessment of his own pronunciation is that he only pronounces the lateral as a palatal, and not the nasal, something that is not true of him but is true of other speakers, as we will see later. The second point is that there is post facto realization of the pronunciation and that it leads to some level of linguistic insecurity, “I don't feel comfortable.” The final and truly revealing point is the way that his sister immediately recognizes the palatal pronunciation in [aˈʎiθja] and begins to tease Akis with it, until he responds to her teasing “not that kind of lamda, Keti!” and eventually in a reluctant and dismissive manner concedes the point, just to stop her from teasing him. This excerpt provides us with a glimpse of how the stereotype can be used to enforce a more normative linguistic behavior.
At the same time, it would be equally simplistic to portray the attitude of young women toward the variants as monolithically negative toward the palatal variant. One young woman reported that as a user of the alveolar variants she has faced criticism: “my friends make fun of me for speaking like I do, they think I am trying to prove something” (Ralu, 20).Footnote 15 A similar attitude is depicted by Yuli in the following excerpt. This exchange happened during the interview of Aspa, for which Yuli was a silent participant, up to the point that Aspa, who went to high school in Athens for a couple of years, made a slightly negative comment about the local pronunciation.
(8)
ASPA: … some words they distort them.
YULI: (in a disgusted tone) Athenian!
ASPA: I am not Athenian, you are insulting me.
PP: (to Yuli) why are you leaving? I find this interesting, I'd like to discuss it.
YULI: OK, let's discuss it, (half mockingly to Aspa) my darling.
PP: Why do you call her Athenian?
ASPA: (jokingly) You have insulted me. No swimming today. I will take you home.
YULI (also jokingly): Really [aˈʎiθja]? Are you threatening me [mapiˈʎis]?
ASPA: (jokingly) Yes I am threatening you [sapiˈlo].
The exchange reveals an existing “outgroup” versus “ingroup” distinction, and how this may be used in the negotiation of identities. In other words, it brings forth Yuli's previously unexpressed judgment that her friend, after a short stay in Athens, speaks as an Athenian would, and in that respect has betrayed her Kefalonian heritage. Aspa who as we have discussed earlier is trying to reestablish her Kefalonian identity is clearly upset by the label “Athenian,” a label that perhaps is not solely related to her speech pattern but may be associated by Yuli with other aspects of Aspa's demeanor as well. What really stands out in this exchange is Yuli's final statement. First, she uses the word [aˈʎiθja], the same word that sparked the teasing between Keti and Akis, to test Aspa.Footnote 16 Moreover, in both the pronunciation of [aˈʎiθja] and [mapiˈʎis] the palatal pronunciation of the lateral is exaggerated; in fact I would not hesitate to classify her pronunciation in these instances as “cartoonish.” The exaggerated and farcical portrayal of the palatal pronunciation is most likely a mechanism that is employed to alleviate any feelings of linguistic inferiority or insecurity (Labov, Reference Labov1966; Macaulay, Reference Macaulay1975; Wolfram & Schilling-Estes, Reference Wolfram and Schilling-Estes1998). Such strategic use of humor has been documented in other dialectal speakers as well; see Macaulay (Reference Macaulay1987:62) for the Scottish dialect and Gasquet-Cyrus (Reference Gasquet-Cyrus2004:118) for the Regional French of Marseilles.
Outliers
Several studies (Kochetov, Reference Kochetov2006; Labov, Reference Labov1972:104, Reference Labov1994, Reference Labov2001; Maclagan et al., Reference Maclagan, Gordon and Lewis1999; Pappas, Reference Pappas and Hinskens2006b among others) have shown that investigating the behavior of particular individuals can provide important insights into the nature of variation, from both a linguistic and a nonlinguistic perspective. For that reason, we will now turn our attention to those speakers who deviate from the general pattern of their peer group and attempt to uncover the reasons for such differentiation. The outliers within the group of younger females (15–31) are Yuli along with Chrysa as they are the only two members of this group who use the palatal variants exclusively. A comparison of the profiles of these two speakers shows that they have different motivations for behaving as outliers. Chrysa differs from her peers in that she has not really left the island of Kefalonia in pursuit of her postsecondary education. She received a certificate in accounting from a school in the capital (Argostoli) and quickly found work as a clerk in Poros. The work is more challenging and satisfying than the job description because the owner has given her extended responsibilities, and she feels that she really helps people through her work. Recently, she got engaged to a man from a neighboring village and is planning to marry and start a family in the next couple of years. She is content with the lifestyle she leads and does not feel that there is anything missing. In these respects, Chrysa stands out from the other women who are around 25 years of age in that her professional and personal life appear to be well integrated and in harmony with what the community can both offer to and at the same time expect from a young woman. For the other young women, and especially those that are well educated, the problem of finding work that is challenging, satisfying, and relevant to their education has not been resolved, and they are still employed only part-time during the tourist season as waitresses or souvenir shop clerks. Chrysa's exceptional speech pattern, then, appears to be connected to two factors: having lived on the island all her life and being able to fulfill her personal and professional plans in Poros.
Yuli shares certain characteristics with Chrysa: she too is proud to be Kefalonian and would not mind living there as an adult. However, she feels that it will be necessary to leave the community for some time to get a degree or to acquire some training, and she is not certain that she will actually be able to return. She also expressed the opinion, that the lifestyle in Poros could be more exciting; there could be more and better nightclubs, there could be a better selection at clothes stores, and so on. In addition, Yuli differs from Chrysa in that she is aware of the variation with respect to /li/ and /ni/ and of the stigma that is attached to the local pronunciation. One would then expect her to use the alveolar variants and not the palatal ones. The key to understanding Yuli's status as an outlier lies in recognizing that at least in the two interviews in which she participated, she performed “tough.” I am using the term “performance” in the sense of Butler (Reference Butler1990), which Bucholz and Hall (Reference Bucholz and Hall2004:491) related as follows: “in Butler's theory, ‘performance’ denotes not acting but enacting–not a (false) representation of a ‘true self’ but the production of oneself as a culturally recognizable subject.” It can be generally said that in Greek society and especially in rural communities like this one, “toughness” is a personality trait that is desirable in males but not in females. Nonetheless, there are several other indications that during her interview and the interview of Aspa, Yuli was “playing up” her tough side: (a) when asked about her friends at school she mentioned that she tends to hang out more with the boys; (b) she claimed that the reason for (a) is that women cannot be trusted as friends, a claim that is typical among Greek men; (c) she mentioned that her interests were mostly sports, mopeds, cars, and hunting; (d) she actively participates in school pranks with the boys; (e) she has no problem using violence to settle disputes even if that means fighting a boy; and (f) when asked about how she reacts to teasing about her Kefalonian accent, she responded “that's who I am, and whoever likes it, likes it,” which, as I have already documented, is typical of young males who are or portray themselves as defiantly Kefalonian. All evidence then, indicates that the use of palatals by Yuli is part of a larger repertoire of her tough performance, and thus has a different explanation than does the use of palatals by Chrysa.Footnote 17
Participant Roxane also merits a closer look as to her use of palatals and alveolars. Although the cumulative percentage of palatalization for this speaker is 44%, this is not an accurate representation of her pattern of variation. As can be seen in Figure 8, Roxane uses an alveolar /li/ almost exclusively (93%), but for the coronal nasal only 17% of the tokens are alveolar. The cause for this split between the two sounds appears to be her awareness of the stereotype, which she has come to recognize through her sister, who has lived in Athens for five years and her sister's boyfriend who is an Athenian.
(9)
PP: What does she [sister] say to you?
ROXANE: For example the [ni], the [ɲi], which I pronounce more coarsely, she says to me (loud laughter) “how can you say it like that?” She is not bossy about it, we just talk about it on a certain level … you know.
PP: When does she tell you this, when you are talking on the phone?
ROXANE: No, no, not like that, she does not mention it on a daily basis, she does it more so we can have a laugh.
PP: Is this a Kefalonian feature or is it just you?
ROXANE: No, it's Kefalonian.
PP: Yes?
ROXANE: mm, hm or rather Heptanesian,
PP: Do they use it anywhere else in Greece, you think?
ROXANE: In Ipiro [Northwestern Greece], and the lamda, I don't say it, they say it in a coarse way in Ipiro, I say it in a normal way, the lamda, (laughter) as they say it in Athens, I believe.
PP: But not [ɲi].
ROXANE: No, I say it more coarsely, [roˈksaɲi] (name), for example, whereas, I don't know, and my mother says it the same way, and my father, and my son, I might inform you (laughter) has taken after me, and he says it just like I do.
PP: You mean that all four of you …
ROXANE: All four of us yes, only my youngest sister …
PP: I want to know if all four of you say [ɲi] but not [ʎi] …
ROXANE: Oh, no one says the lamda coarsely like that …
PP: Really?
ROXANE: Only [ɲi], yes …
PP: That is very interesting …
ROXANE: Why? Do they also say lamda? In Kefalonia? Some say it, yes. For example what word could we use?
PP: How about ksipolitos (barefoot)?
ROXANE: [ksiˈpolitos], they say [ksi-po-ʎi-ʎi-tos] [sic]. Do you see? The difference? We say [ksiˈpolitos], more (laughter) delicately. Others say [ksiˈpoʎitos], this is more common in Ipiro.
PP: That is very interesting.
ROXANE: That is my observation. But everyone in Kefalonia says [ɲi]. Sometimes my sister's boyfriend says to me (laughter) [ʎiˈmaɲi] (port see fn. 18), on purpose, or [ˈjasu roˈksaɲi ti kaɲis] (“hello, Roxane, how are you?”).
PP: And what is your reaction?
ROXANE: We laugh (laughter), we do it for a laugh, and so I say to him [ˈjasu vasi], his name is [vaˈsili], so I say to him [ˈjasu vaˈsiʎi] (laughter).
What we see in this extended excerpt is that this particular speaker is perfectly aware that she has separated the two sonorants into the alveolar /li/ and the palatal /ni/.Footnote 18 She is linguistically secure in the former, as she is even willing to caricature the palatal lateral to amuse her sister's partner, but not so much so in the latter, as can be seen in the hesitation between [ni] and [ɲi] at the beginning of the excerpt. The speaker believes that she has always had an alveolar lateral and a palatal nasal (“everyone at home speaks this way,” though this is probably not the case, because, as we have seen, almost all speakers in her parents' age group use the palatal variants.) A more probable scenario—based on the narratives of several other participants—is that the speaker began to acquire the alveolar pronunciation as a university student in Athens. For some reason, she has been more successful with /li/ than with /ni/ and, in the face of gentle pressure from her sister and her sister's partner, she has managed to acquire the alveolar pronunciation of the lateral while she continues to struggle, unconsciously, with that of the nasal. The views expressed in the excerpt are particularly interesting when we compare them with those of Akis, as the two speakers perceive the variation differently. Akis finds the palatalization of /li/ more prominent, but Roxane focuses on /ni/. The two situations are also similar in that the younger sibling assumes the role of enforcing the stereotype.Footnote 19
This is also true of speaker Tania, whose experience can be recounted as follows. After high school, she moved to the city of Volos to attend university. Several months later, her younger sister visited her there and not only remarked on the palatal pronunciation of /li/ and /ni/ in the city, but also realized that Tania had acquired this “habit” as well. “I told her that it was grating on my nerves, and that she had to stop doing it” (Andrea, 21). According to Tania herself, she “eventually managed to cut it out, more or less.” It is interesting that in this family too it is a younger sibling that seeks to correct the speech pattern of an older one. Unlike the other two pairs of siblings, however, in this case the offending variant is not considered native, but rather a feature of another region. As in other cases, the two women are mistaken in their evaluation of palatals as foreign elements, as their mother uses the palatal variants 100% of the time.
With respect to the four males of the youngest generation that exhibit differentiation between the two sonorants, the characteristic that they share is that they all have received a standard education. In addition, three of them are aware that the palatal variants are features of the Patra variety.Footnote 20 These speakers stand in contrast to the five speakers of this group that have an advanced education (all university graduates), are fully aware of palatalization as a local feature, and yet use the stigmatized variants almost exclusively. The speech pattern of young male speakers with a standard education appears to be the result of linguistic insecurity, for which there is both direct and indirect evidence in the interviews. For example, one speaker talked about being teased by his Athenian cousins for using the local dialect, and the other two characterized local vocabulary items as being weird or even bastardized (due to the Italian influence). All three mentioned that they try not to lapse into Kefalonian when they are in Athens, but that it is very hard not to and this makes them feel uncomfortable. At first glance, this may seem as a paradox because most of these speakers are proud to be Kefalonian, but we must keep in mind that the particular variant is not seen as a unique feature of the Kefalonian variety. Rather, one of the main connotations of the palatal variants is that they are vlachika, a term that implies, among other things, being from central Greece and having an inferior education. Within this particular evaluative dimension, the university graduates, on the other hand, consider the facts that they are educated and sophisticated unassailable and hence do not feel the need to change. However during their university years and in their interaction with speakers from other parts of Greece and especially from Athens and Thessaloniki, almost all of them had to confront the issue, as Stelios put it in his interview (see excerpt (5)). Also, we have seen that even university graduates, both male and female (e.g., Akis and Roxane) may continue to feel linguistically insecure but to a lesser degree.Footnote 21
In the other two age groups, we only have women outliers, three in the age group (35–52) and one in the oldest age group. The details of the life circumstances of each of these speakers provide further insight about the significance of [ʎi] and [ɲi] in this community. At first, the three women in the middle-age group do not appear to share any characteristics that would explain their outlier status. Lena and Athena have university degrees, but Eli has no postsecondary education; on the other hand, Eli and Athena are very positive about living on Kefalonia, whereas Lena sees it as an unavoidable necessity for professional and familial reasons. The interviews, however, reveal that what they all share, in contrast to the other women in this age group, is that they were married at a significantly later age, if at all. Lena and Athena were married in their late 30s, and Eli is single. The pressure to be married at an early age still appears to be prevalent in the community, especially for women. After all, all other women in this age group were married either immediately after high school or soon after university. It is not an exaggeration to state that in the absence of a career, or a good education, marriage and motherhood are the only ways for a woman to gain status in the community. Eckert (Reference Eckert and Coulmas1997:155) suggested that age should not only be treated etically but also emically. This was certainly taken into consideration as I sought to find cohorts that as Eckert stated have “a shared experience of time” in terms of major events in the life of the island and of Greece in general. However, it was not expected that these cohorts could be gender-specific and cover such a lengthy time interval. This finding is potentially important as it shows that the relationship between age and gender may be more complex than previously thought.
For example, an alternative explanation for the speech pattern of these women could be constructed around the opinion expressed by one of the younger participants, namely that the palatal variants sound “old.” It is possible then that the limited use of the palatal variants by these women is part of a younger persona that they constructed in the past (and in the case of Eli is still being constructed) to avoid the societal pressures that an unmarried woman in her late 30s faces in the community. In light of this approach, one could revisit the case of Chrysa and argue that she is enacting an older persona, one that is more congruent with her status as a soon-to-be-married and well-employed woman in the community.Footnote 22
Finally with respect to Magda, the woman in the oldest age group who uses the alveolar variant 47% of the time, it appears that neither her level of education (advanced), nor her stay in Athens for several years can explain her speech pattern, as there are two other women in the same age group who have an advanced education and have lived in Athens for an extended period in the 1960s yet they never use the alveolar. A possible explanation for Magda's speech pattern may be found in her profession. She is a schoolteacher and due to her age and experience, she is also a senior administrator. It is not unlikely that the production of stigmatized variants, in her mind, is incongruent with her role as an educator and as a role model for younger educators. After all, this view was clearly expressed by one of the participants in the Patra study (Pappas, Reference Pappas and Hinskens2006b), who is also a schoolteacher: “As far as school is concerned, especially, I believe that I have to show them [the students] what is correct. From there on, how the word will come out in my daily speech, I can't control that, but for first graders, who are just learning, you can intervene there, a little.…” At this point, it seems apropos to note that Magda was the only one of the participants that appeared to style shift during the interview. She joined her husband and me after we had already started talking (about a half hour into that interview) and was quite hesitant and distant during the first 15 min, producing only short answers. It was only after I asked them about how they met that she became more relaxed and started talking for longer stretches of time, making jokes, and laughing at those of her husband. The difference in the usage of alveolar [li] between the two periods is noticeable: 70% before the marriage topic came about and 54% after that. There were only seven tokens of /ni/ (one of which was palatalized) during the first part of her interview. Nonetheless, it is likely that even in the second part of the interview, she is using a more formal style of speech, one that she subconsciously deems more appropriate for this setting.
CONCLUSIONS
The examination of the change from [ʎi] and [ɲi] to [li] and [ni] in the rural community of Poros, Kefalonia, has taken an integrated approach to the study of variation and change, by employing both the methodology of traditional variationist studies (taking a large judgment sample of the community, statistical analysis of the data, etic independent variables) as well as that of ethnographic studies (participant observation, exploring the meaning of the variation within the community, the use of emic categories, paying attention to the behavior of individual speakers).
By employing the traditional variationist methodology, we have demonstrated that there is a change in progress in this community as younger speakers (15–31) are adopting the innovative alveolar pronunciation of /li/ and /ni/. It was also shown that women are more likely to use the innovative variant, as are speakers who are negatively disposed toward life in the community. These results are not unexpected as they conform to the finding of numerous other variationist studies. On the other hand, it is surprising that speakers with a standard education are more likely to use the alveolar than speakers with an advanced education. It is equally intriguing that speakers who are fully aware of the variation and the stigma associated with the palatal variant are less likely to use the prestigious alveolar pronunciation.
By giving participants the opportunity to comment on the topic of palatalization and the stigma that it carries, we gained a better understanding about the nature of the stereotype. First, we saw that some speakers are aware of the general stigma against palatal laterals and nasals, but are not aware that these are a feature of the local variety. Second, we saw that these variants are typically characterized as vlachika, a term that connotes rural rather than urban, uneducated rather than educated, stupid rather than smart, naive rather than sophisticated. The palatal variants are also associated with the older generation and are perceived as acoustically unpleasant. Finally, we saw that for some speakers, the palatalization of /li/ is more salient that the palatalization of /ni/ and others have the obverse evaluation.
The information about the meaning of the stereotype has provided an explanation for the two counterintuitive patterns within the overall variation. For example, well-educated young men continue to use the palatal variants despite the fact that they are aware of the accompanying stigma, because their high level of education neutralizes the effects of the stereotype regarding sophistication and intelligence. On the other hand, young men with a standard education avoid using the palatal variants precisely because they lack the diplomas and life experience that will counteract their linguistic insecurity.
The detailed study of individual speakers has also proved productive. First, it revealed that several speakers have different rates of palatalization for the two sonorants, a fact that was disguised in the overall statistical analysis because there was no preference toward a specific sonorant. Second, it showed that speakers within the same age group may exhibit the same speech pattern but for different reasons, and, finally, it uncovered some suggestive evidence that for some women, their age group may not be defined by their date of birth but rather by their life stage (married vs. unmarried).