Nomenclature
- qi
-
generalised coordinates
- xi, yi, zi
-
displacement
-
 ${\phi}_{i}, {\theta}_{i}, {\psi}_{i}$
-
roll angle, pitch angle, yaw angle
-
${\phi}_{ij}$
-
relative roll angle between flight unit i and flight unit j
- mi, Ji(i)
-
mass matrix, inertia matrix
- Di
-
angular velocity transformation matrix
-
$\dot{\boldsymbol{D}}_{\boldsymbol{i}} = \boldsymbol{D}_{\boldsymbol{i}}$
-
with respect to time t
-
$\boldsymbol{\delta},\, \dot{\!\boldsymbol{\delta }}$
,
$\,\ddot{\!\boldsymbol{\delta }}$
-
Euler angles, Euler angular velocity, Euler angular acceleration
-
$\boldsymbol{A}^{({\bf 0},\,\boldsymbol{i})}$
-
transformation matrix from body coordinate system to inertial coordinate system
-
$\boldsymbol{F}_{\boldsymbol{i}}^{\boldsymbol{(i)}}, \boldsymbol{M}_{\boldsymbol{i}}^{\boldsymbol{(i)}}$
-
force vector and moment vector in the body coordinate system
-
$\unicode{x1D731}$
-
constraint equation
-
$\unicode{x1D731}_{\boldsymbol{q}}$
-
Jacobian matrix of the constraint equation
- A
-
generalised mass-inertia matrix
- B
-
generalised force vector
-
$\boldsymbol{\lambda}$
-
Lagrange multiplier vector
-
$\boldsymbol{F}^{\boldsymbol{g}}$
-
gravity vector
-
$\boldsymbol{F}^{\boldsymbol{k}}$
-
spring force and moment vector
-
$\boldsymbol{F}^{\boldsymbol{a}}$
-
aerodynamic forces and moment vector
- CL
${}_\alpha$
, CD
${}_\alpha$
-
where
${\phi}_{ij} = 0$
, lift and drag coefficient derivatives with respect to
$\alpha$
- CY
${}_\beta$
-
where
${\phi}_{ij} = 0$
, side force coefficient derivatives with respect to
$\beta$
- Cl
${}_\beta$
, CN
${}_\beta$
-
where
${\phi}_{ij} = 0$
, rolling moment and yawing moment coefficient with respect to
$\beta$
- CM
${}_\alpha$
-
where
${\phi}_{ij} = 0$
, pitching moment coefficient derivatives with respect to
$\alpha$
- CY p
-
side force coefficient derivatives with respect to roll rate
- Clp, CNp
-
rolling moment and yawing moment coefficient derivatives with respect to roll rate
- CYr
-
sde force coefficient derivatives with respect to yaw rate
- Clr, CNr
-
rolling moment and yawing moment coefficient derivatives with respect to yaw rate
- CLq, CMq
-
lift and pitching moment coefficient derivatives with respect to pitch rate
- CD
${}_{\phi_{ij}}$
-
derivative of drag coefficient with respect to relative roll angle
- CL
${}_{\phi_{ij}}$
-
derivative of lift coefficient with respect to relative roll angle
- CY
${}_{\phi_{ij}}$
-
derivative of side force coefficient with respect to relative roll angle
- Cl
${}_{\phi_{ij}}$
-
derivative of rolling moment coefficient with respect to relative roll angle
- CM
${}_{\phi_{ij}}$
-
derivative of pitching moment coefficient with respect to relative roll angle
- CN
${}_{\phi_{ij}}$
-
derivative of yawing moment coefficient with respect to relative roll angle
- Cl
${}_\alpha$
, CN
${}_\alpha$
-
roll moment and yaw moment coefficient with respect to
$\alpha$
- Lba
-
the transformation matrix from wind system to body system
-
$\lambda$
i,
$\boldsymbol{\phi}$
i
-
the characteristic roots and characteristic vectors of the DMD mode
- gi, wi
-
the growth rate and frequency of the DMD mode
- I
-
the DMD modal energy
- eMAE
-
mean absolute error (MAE)


1.0 Introduction
Dynamic behaviour of multibody aircraft during the deployment and unfolding process is a complex dynamic problem. The entire process involves both the overall motion characteristics and the relative motion among multiple flight units [Reference Dou, Zhou and Wang1–Reference Wang, Zhu, Zhou and Bai2]. In addition, the deployment and unfolding process of the multibody aircraft is also an unsteady process, rendering traditional linear small-disturbance theory inapplicable. This is because traditional linear small-disturbance theory can analyse the flight modes of a multibody aircraft under any steady-state flight condition [Reference Montalvo and Costello3–Reference Montalvo and Costello4], but it cannot accurately describe the dynamic behaviour and stability of unsteady flight processes. However, it is not suitable for analysing a single, highly transient, non-equilibrium deployment trajectory. Bifurcation analysis excels at parametric studies of equilibrium states and is useful during the design phase for understanding the influence of the deployment design parameters on the overall stability of the six-body aircraft during the deployment and unfolding process. However, it is not applicable to analysing a single highly nonlinear and unbalanced distribution trajectory. Due to these complex dynamic characteristics, numerical simulation has become a powerful tool for studying the dynamic behaviour of multibody aircraft during deployment and unfolding processes. For example, Fujita [Reference Fujita, Motoda and Nagai5–Reference Fujita and Nagai7] developed a multibody dynamics simulation programme to evaluate the safety of the dynamic behaviour of the folding multibody aircraft during deployment and unfolding process. To better describe and characterise its dynamic behaviour, it becomes particularly important to extract physically interpretable dynamic features from the raw simulation data that can represent the dynamic behaviour. Therefore, this paper employs dynamic mode decomposition (DMD) – a data-driven method applied to simulation-generated data – to extract the characteristic modes and dominant dynamic features of the six-body aircraft deployment and unfolding process. DMD is a data-driven reduced-order modelling method capable of extracting key dynamic modes from high-dimensional dynamic systems and is suitable for the analysis of nonlinear dynamic systems.
The DMD method is a data-driven reduced-order modelling technique. By decomposing time-series data of system states, it extracts the dynamic modes of the system along with their corresponding frequencies and decay rates. The core concept of DMD lies in approximating the dynamic behaviour of high-dimensional nonlinear systems as a superposition of low-dimensional linear systems, thereby simplifying system analysis. Through the DMD approach, the dominant dynamic modes of the system can be extracted. These generalised modes effectively capture the primary dynamic behaviour of the system during the deployment and unfolding process. The extracted modes not only facilitate a deeper understanding of the system’s dynamic characteristics but also provide a foundation for subsequent stability analysis.
The DMD method was initially proposed by Schmid and is used to propose dynamic modes in high-dimensional dynamic systems [Reference Schmid8–Reference Schmid, Li and Juniper11]. The DMD approach combines linear algebra, numerical analysis and dynamical system theory, and is widely applied in aerospace fields such as aerodynamics, flight mechanics and structural vibration analysis. Sathesh [Reference Mariappan, Gardner and Richter12] utilised the DMD method to analyse the unsteady flow field around pitching wings. Soledad [Reference Le Clainche, Li and Theofilis13–Reference Le Clainche and Vega15] reviewed two DMD-based approaches in their research, namely higher-order dynamic mode decomposition (HODMD) and spatiotemporal Koopman decomposition. HODMD and Spatiotemporal Koopman Decomposition can be used to identify and extrapolate transient behaviours into permanent dynamics or to construct efficient, purely data-driven reduced-order models (ROMs). Che [16] analysed the dynamic characteristics of the early pseudo-time progression of the accompanying equation by using DMD and predicted the gradient. Arvind T. Mohan [Reference Mohan and Gaitonde17–Reference Mohan, Gaitonde and Visbal18] conducted a detailed study on the physical principles behind the dynamic stall phenomenon of wings using the DMD approach. The stability analysis of the calculated DMD model was conducted, and the unstable flow structure was determined. Liu [Reference Liu, Hu and Gao19] proposed a novel manoeuvre modelling and analysis method based on high-order multi-resolution dynamic mode decomposition (HMDMD). By leveraging the high-order Koopman assumption and standard multi-resolution DMD, this approach achieves joint spatiotemporal-frequency decomposition of the aircraft state sequences in complex flight scenarios and establishes an approximate dynamic model. Wu [Reference Wu, Yang and He20] developed a structural modal parameter identification method that integrates DMD technology with the density-based spatial clustering of applications with noise (DBSCAN) algorithm. Combined with the proposed rank-stabilisation diagram, this method utilises DBSCAN to eliminate spurious modes generated by DMD, thereby obtaining physically meaningful modal parameters.
In recent years, significant progress has been made in both the theory of DMD and its extended variants. On the theoretical front, Durán-Siguenza [Reference Durán-Siguenza, Minchala and Garza-Castañón21] provided a systematic review of modern Koopman operator theory. In terms of algorithmic developments, in addition to HODMD, numerous other DMD variants have emerged. Colbrook [Reference Colbrook, Ayton and Szőke22–Reference Colbrook23] developed the ResDMD method, which introduces a residual term to achieve rigorous error control and spurious mode detection. Physics-informed DMD incorporates physical constraints into the decomposition process, thereby improving model interpretability and generalisation capability [Reference Baddoo, Herrmann and McKeon24–Reference Valva and Giannakis25]. Although DMD and its variants have been successfully applied to various problems in fluid mechanics and structural dynamics, their application to the deployment and unfolding dynamics of multibody aircraft has received little attention. For the highly non-equilibrium and nonlinear deployment and unfolding process, whether DMD can extract the dominant modes characterising the deployment and unfolding dynamic behaviour is the main research question of this paper. Therefore, this study employs standard DMD as a starting point to analyse the deployment and unfolding dynamics, due to its high computational efficiency and clear physical interpretability, with the understanding that future research can naturally extend to HODMD or ResDMD to improve the modelling accuracy of the transient deployment process of multibody aircraft.
Therefore, in this paper, the multibody flight dynamics model suitable for analysing the dynamic behaviour of multibody aircraft during the deployment and unfolding process is established. Based on the multibody flight dynamics model, numerical simulations were conducted to obtain the state variable data of each flight unit during the deployment process of a six-body aircraft. DMD was applied to analyse the deployment dynamics of six-body aircraft and extract its dominant modes. The dynamic behaviour represented by each mode was then interpreted through eigenvector analysis. The dominant modes were utilised to reconstruct the dynamic behaviour of the six-body aircraft during its deployment process. Through comparative analysis with the original simulation data, the validity of the reconstructed model was successfully verified. Furthermore, the impact of the number of DMD modes on the reconstruction error was analysed using the mean absolute error (MAE), and the optimal modes were selected based on their energy contribution to characterise the deployment and unfolding dynamics. Finally, airdrop experiments of the six-body aircraft were conducted, which validated the accuracy of both the multibody flight dynamics model and the equivalent DMD model, thereby providing a theoretical foundation for analysing the deployment dynamics of the multibody aircraft.
The content of this paper is arranged as follows. Section 2 establishes a multibody flight dynamics model for multibody aircraft. Section 3 introduces the DMD method and the normalised method for each state quantity of multibody aircraft. In Section 4, the multibody flight dynamics model is first used to perform numerical simulations of the dynamics during the deployment of the six-body aircraft. Next, DMD is applied to the resulting simulation data to extract the characteristic modes of the deployment process, and the physical meaning of each mode is analysed via its eigenvectors. In the final step, a reconstruction model is established based on these characteristic modes. The correctness of this model is verified by comparing it with the multibody flight dynamics model simulations, and the impact of the number of characteristic modes on the reconstruction error is examined. Section 5 carried out the deployment experiment of the six-body aircraft. The data collected from the experiment verified the correctness of the dynamic model of the multibody aircraft and the reconstructed model obtained based on the DMD feature mode. Section 6 summarises the full text.
2.0 Multibody flight dynamics model
2.1 Multibody dynamics model
Before analysing the dynamic behaviour of the six-body aircraft during the deployment and unfolding process by using dynamic model decomposition approach, it is necessary to obtain the numerical simulation data of the deployment and unfolding process by using the multibody flight dynamics model.
The six-body aircraft considered consists of six rigid bodies. In the following analysis, each rigid body is referred to as a flight unit. All flight units are connected via rotating hinges and can achieve relative rotation during the deployment and unfolding process. The Lagrange multiplier method and the absolute coordinate method are adopted to establish the flight dynamics model of the six-body aircraft. Then the generalised coordinates of each flight unit can be expressed as
 \begin{equation}\boldsymbol{q}_{\boldsymbol{i}}=\left(x_{i},y_{i},z_{i},\phi _{i},\theta _{i},\psi _{i}\right)\end{equation}
The subscript i indicates the number of each flight unit of the multibody aircraft. The dynamic equations of each flight unit under unconstrained conditions can be uniformly written in the following form.
 \begin{equation}\boldsymbol{m}_{\boldsymbol{i}}\ddot{\boldsymbol{r}}_{\boldsymbol{i}}=\boldsymbol{A}^{({\bf 0},\,\boldsymbol{i})}{\boldsymbol{F}}_{\boldsymbol{i}}^{\left(\boldsymbol{i}\right)},i=1,2,3,\cdots ,6\end{equation}
 \begin{equation}{\boldsymbol{J}}_{\boldsymbol{i}}^{\left(\boldsymbol{i}\right)}\boldsymbol{D}_{\boldsymbol{i}}{\ddot{\boldsymbol{\delta }}}_{\boldsymbol{i}}^{\left(\boldsymbol{i}\right)}+\left({\boldsymbol{J}}_{\boldsymbol{i}}^{\left(\boldsymbol{i}\right)}\dot{\boldsymbol{D}}_{\boldsymbol{i}}+\left({\boldsymbol{D}_{\boldsymbol{i}}}{\dot{\boldsymbol{\delta }}_{\boldsymbol{i}}}\right)_{\boldsymbol{R}}{\boldsymbol{J}}_{\boldsymbol{i}}^{\left(\boldsymbol{i}\right)}\boldsymbol{D}_{\boldsymbol{i}}\right)\dot{\boldsymbol{\delta }}_{\boldsymbol{i}}={\boldsymbol{M}}_{\boldsymbol{i}}^{\left(\boldsymbol{i}\right)},i=1,2,3,\cdots 6\end{equation}
where mi is the mass matrix and Ji(i) is the inertia matrix.
 $\boldsymbol{A}^{({\bf 0},\, \boldsymbol{i})}$
is the transformation matrix from the aircraft-body coordinate system to the inertial coordinate system, and its expression is given as follows.
 \begin{equation}{\rm A}^{(0,{\rm i})}=\left[\!\begin{array}{c@{\quad}c@{\quad}c} \cos \unicode{x03B8} _{{\rm i}}\cos \unicode{x03C8} _{{\rm i}} & \sin \unicode{x03B8} _{{\rm i}}\cos \unicode{x03C8} _{{\rm i}}\sin \unicode{x03D5} _{{\rm i}}-\sin \unicode{x03C8} _{{\rm i}}\cos \unicode{x03D5} _{{\rm i}} & \sin \unicode{x03B8} _{{\rm i}}\cos \unicode{x03C8} _{{\rm i}}\cos \unicode{x03D5} _{{\rm i}}+\sin \unicode{x03C8} _{{\rm i}}\sin \unicode{x03D5} _{{\rm i}}\\ \cos \unicode{x03B8} _{{\rm i}}\sin \unicode{x03C8} _{{\rm i}} & \sin \unicode{x03B8} _{{\rm i}}\sin \unicode{x03C8} _{{\rm i}}\sin \unicode{x03D5} _{{\rm i}}+\cos \unicode{x03C8} _{{\rm i}}\cos \unicode{x03D5} _{{\rm i}} & \sin \unicode{x03B8} _{{\rm i}}\sin \unicode{x03C8} _{{\rm i}}\cos \unicode{x03D5} _{{\rm i}}-\cos \unicode{x03C8} _{{\rm i}}\sin \unicode{x03D5} _{{\rm i}}\\ -\sin \unicode{x03B8} _{{\rm i}} & \cos \unicode{x03B8} _{{\rm i}}\sin \unicode{x03D5} _{{\rm i}} & \cos \unicode{x03B8} _{{\rm i}}\cos \unicode{x03D5} _{{\rm i}} \end{array}\!\right]\end{equation}
Di denotes the transformation matrix that converts the Euler angle rates into the three angular velocity components (p, q, r) expressed in the body-fixed coordinate system.
 \begin{equation}{\rm D}_{{\rm i}}=\left[\begin{array}{c@{\quad}c@{\quad}c} 1 & 0 & -\sin \unicode{x03B8} _{{\rm i}}\\ 0 & \cos \unicode{x03D5} _{{\rm i}} & \sin \unicode{x03D5} _{{\rm i}}\cos \unicode{x03B8} _{{\rm i}}\\ 0 & -\sin \unicode{x03D5} _{{\rm i}} & \cos \unicode{x03D5} _{{\rm i}}\cos \unicode{x03B8} _{{\rm i}} \end{array}\right]\end{equation}
 $\dot{\boldsymbol{D}}_{\boldsymbol{i}}$
is the first derivative of the angular velocity transformation matrix Di with respect to time t, and its matrix form can be expressed as
 \begin{equation}\dot{{\rm D}}_{{\rm i}}=\left[\begin{array}{c@{\quad}c@{\quad}c} 0 & 0 & -\cos \unicode{x03B8} _{{\rm i}}\cdot \dot{\unicode{x03B8} }_{{\rm i}}\\ 0 & -\sin \unicode{x03D5} _{{\rm i}}\cdot \dot{\unicode{x03D5} }_{{\rm i}} & \cos \unicode{x03D5} _{{\rm i}}\cos \unicode{x03B8} _{{\rm i}}\cdot \dot{\unicode{x03D5} }_{{\rm i}}-\sin \unicode{x03D5} _{{\rm i}}\sin \unicode{x03B8} _{{\rm i}}\cdot \dot{\unicode{x03B8} }_{{\rm i}}\\ 0 & -\cos \unicode{x03D5} _{{\rm i}}\cdot \dot{\unicode{x03D5} }_{{\rm i}} & -\sin \unicode{x03D5} _{{\rm i}}\cos \unicode{x03B8} _{{\rm i}}\cdot \dot{\unicode{x03D5} }_{{\rm i}}-\cos \unicode{x03D5} _{{\rm i}}\sin \unicode{x03B8} _{{\rm i}}\cdot \dot{\unicode{x03B8} }_{{\rm i}} \end{array}\right]\end{equation}
(*)R is the anti-symmetric coordinate square of the vector product operation. The detailed expression of (*)R can be found in Reference [Reference Wang, Zhu, Zhou and Bai2].
Diagram of hinge constraints between flight units.

Figure 1. Long description
A diagram of hinge constraints between flight units. The diagram shows two aircraft units labeled as aircraft unit i and aircraft unit j connected by a rotating hinge labeled Hj. Each aircraft unit has its own coordinate system with axes xbi, ybi, zbi for aircraft unit i and xbj, ybj, zbj for aircraft unit j. The diagram includes vectors rij, rj, cij, and cjj indicating the relative positions and orientations between the units. The rotating hinge Hj is depicted as a vertical red dashed line connecting the two aircraft units. The overall structure illustrates the dynamic relationship and constraints between the two aircraft units during deployment and unfolding processes.
The individual flight units are actually connected by rotational hinges, as illustrated in Figure 1. Thus, constraint equations for these hinges must be established using generalised coordinates, the formulation of which is given below.
 \begin{equation}{\boldsymbol{ \Phi}}_{{\bf 1}}={\boldsymbol{r}}_{\boldsymbol{i}}^{({\bf 0},\,\boldsymbol{i})}+\boldsymbol{A}^{({\bf 0},\,\boldsymbol{i})}{\boldsymbol{c}}_{\boldsymbol{ij}}^{\left(\boldsymbol{i}\right)}-{\boldsymbol{r}}_{\boldsymbol{j}}^{({\bf 0},\,\boldsymbol{j})}-\boldsymbol{A}^{({\bf 0},\,\boldsymbol{j})}{\boldsymbol{c}}_{\boldsymbol{jj}}^{\left(\boldsymbol{j}\right)}\end{equation}
 \begin{equation}\Phi _{2}=\theta _{i}-\theta _{j}\end{equation}
 \begin{equation}\Phi _{3}=\psi _{i}-\psi _{j}\end{equation}
Among them, c ij is the body hinge vector from the centre of mass of flight unit i to the hinge point O j, and c jj is the body hinge vector from the centre of mass of flight unit j to the hinge point O j. A linear coil spring is added to the rotating hinge, and the recovery moment of the coil spring is utilised to enable the six-body aircraft to achieve the unfolding motion. The calculation formula for the moment of the coil spring is as follows:
 \begin{equation}M_{ij}=-K_{ij}\cdot (\phi _{i}-\phi _{j})\end{equation}
In the formula, K ij represents the stiffness coefficient of the coiled spring. The Lagrange multiplier is introduced to express the constraint relationship between flight units. Therefore, the dynamic equation expression of the multibody aircraft described in absolute coordinates is obtained as
 \begin{equation}\left[\begin{array}{c@{\quad}c} \boldsymbol{A} & {{\boldsymbol{ \Phi}}}_{\boldsymbol{q}}^{\boldsymbol{T}}\\ {\boldsymbol{ \Phi}}_{\boldsymbol{q}} & {\bf 0} \end{array}\right]\left[\begin{array}{c} \ddot{\boldsymbol{q}}\\ \boldsymbol{\lambda } \end{array}\right]=\left[\begin{array}{c} \boldsymbol{B}\\ -\left({{\boldsymbol{ \Phi}}_{\boldsymbol{q}}}\dot{\boldsymbol{q}}\right)_{\boldsymbol{q}}\!\dot{\boldsymbol{q}} \end{array}\right]\end{equation}
where
 $\boldsymbol{A} = diag(\begin{array}{ccc} \boldsymbol{A}_{{\bf 1}} & \cdots & \boldsymbol{A}_{\boldsymbol{n}} \end{array})$
is the mass-inertia matrix, Φ q is the Jacobian matrix of the constraint equation and
 $\boldsymbol{B} = (\begin{array}{ccc} \boldsymbol{B}_{{\bf 1}} & \cdots & \boldsymbol{B}_{\boldsymbol{n}} \end{array})^{T}$
is the generalised force vector. The specific expressions of the elements Ai and Bi in the mass inertia matrix A and the generalised force vector B are as follows:
 \begin{equation}\boldsymbol{A}_{\boldsymbol{i}}=\left[\begin{array}{cc} \boldsymbol{m}_{\boldsymbol{i}}\boldsymbol{E} & {\bf 0}\\ {\bf 0} & {\boldsymbol{J}}_{\boldsymbol{i}}^{\left(\boldsymbol{i}\right)}\boldsymbol{D}_{\boldsymbol{i}} \end{array}\right]\end{equation}
 \begin{equation}\boldsymbol{B}_{\boldsymbol{i}}=\left[\begin{array}{c} {\bf 0}\\ -\left({\boldsymbol{J}}_{\boldsymbol{i}}^{\left(\boldsymbol{i}\right)}\dot{\boldsymbol{D}}_{\boldsymbol{i}}+\left({\boldsymbol{D}_{\boldsymbol{i}}}{\dot{\boldsymbol{\delta }}_{\boldsymbol{i}}}\right)_{\boldsymbol{R}}{\boldsymbol{J}}_{\boldsymbol{i}}^{\left(\boldsymbol{i}\right)}\boldsymbol{D}_{\boldsymbol{i}}\right)\dot{\boldsymbol{\delta }}_{\boldsymbol{i}} \end{array}\right]+{\boldsymbol{F}}_{\boldsymbol{i}}^{\boldsymbol{g}}+{\boldsymbol{F}}_{\boldsymbol{i}}^{\boldsymbol{k}}+{\boldsymbol{F}}_{\boldsymbol{i}}^{\boldsymbol{a}}\end{equation}
Fg represents the generalised force and generalised moment corresponding to gravity, and its expression form is as follows
 \begin{equation}{\boldsymbol{F}}_{\boldsymbol{i}}^{\boldsymbol{g}}=\left[\begin{array}{c@{\quad}c@{\quad}c@{\quad}c@{\quad}c@{\quad}c} 0 & 0 & mg & 0 & 0 & 0 \end{array}\right]^{T}\end{equation}
Fk represents the generalised force and generalised moment corresponding to the coiled spring, and its expression form is as follows
 \begin{equation}{\boldsymbol{F}}_{\boldsymbol{i}}^{\boldsymbol{k}}=\left[\begin{array}{c@{\quad}c@{\quad}c@{\quad}c@{\quad}c@{\quad}c} 0 & 0 & 0 & M_{ij} & 0 & 0 \end{array}\right]^{T}\end{equation}
Fa represents the generalised force and generalised moment corresponding to the aerodynamic force and aerodynamic moment acting on the flight unit, and their expression forms are as follows
 \begin{equation}{\boldsymbol{F}}_{\boldsymbol{i}}^{\boldsymbol{a}}=\left[\begin{array}{c@{\quad}c@{\quad}c@{\quad}c@{\quad}c@{\quad}c} X & Y & Z & L & M & N \end{array}\right]^{T}\end{equation}
2.2 Aerodynamic model
The aerodynamic model of the multibody aircraft is a mathematical model developed by expanding the aerodynamic characteristics of multibody aircraft on the basis of the original aerodynamic model of fixed-wing aircraft [Reference Song and Ai26, Reference An, Huo, Meng, Xie and Yang27]. Therefore, when establishing the aerodynamic model of multibody aircraft, it is necessary to model the aerodynamic characteristics of the following multibody aircraft. Firstly, multibody aircraft are composed of multiple flight units combined through hinges, and there is mutual aerodynamic interference among the flight units. Therefore, the established aerodynamic model should be able to reflect the additional moment caused by the uneven aerodynamic distribution resulting from wingtip interference. Secondly, during the deployment process of the six-body aircraft, the relative roll angles between flight units will change, and the aerodynamic characteristics of the flight units will also vary. Therefore, the established aerodynamic model must also account for the influence of the relative roll angles on the aerodynamic properties of the flight units.
To reduce the complexity of the aerodynamic model, it is assumed that non-adjacent flight units do not generate mutual aerodynamic interference. To verify the correctness of the simplifying assumptions, a brief sensitivity analysis is conducted next using the three-body aircraft as the research object. Take the absolute folding angle of 120° in the three-body aircraft configuration as the analysis object, as shown in the schematic diagram in Figure 2.
Schematic diagrams of the three-body aircraft.

As shown in Figure 2, flight unit 2 and flight unit 3 remain stationary, while flight unit 1 performs a simple harmonic motion of relative rolling about the hinge point. The roll angle amplitude of flight unit 1 is 45°, and the frequency of the relative rolling motion is ω = π/2. The freestream velocity is 10 m/s, and the freestream direction in the inertial coordinate system is
 $[\!\begin{array}{ccc} -\cos (2^{\circ}) & 0 & -\sin (2^{\circ})\! \end{array}]$
. The variation curves of the aerodynamic forces in the three directions of each flight unit in the inertial coordinate system with the motion of flight unit 1 are shown in Figure 3.
The variation curves of aerodynamic forces on each flight unit of the three-body aircraft.

It can be seen from Figure 3 that during the relative rolling motion of flight unit 1, the aerodynamic forces on the adjacent flight unit 2 exhibit significant variations. In contrast, the variations on the non-adjacent flight unit 3 are very small and can be almost neglected. The average variation rate of the aerodynamic forces on flight unit 2 is approximately 33.2%, while that on flight unit 3 is only 3.5%. This demonstrates that no significant aerodynamic interference occurs between non-adjacent flight units.
In this paper, the CFD method is mainly employed to investigate the interference between adjacent units and the influence of relative roll angles. A database of aerodynamic forces and moments for each flight unit is established via computational fluid dynamics (CFD), taking into account aerodynamic coupling effects and the influence of relative roll angles. Finally, the aerodynamic coefficients are obtained through aerodynamic data fitting and differentiation with respect to the state variables. The aerodynamic model is established using the obtained aerodynamic coefficients. The aerodynamic force acting on the flight unit in the wind coordinate system can be uniformly written in the following form.
 \begin{equation}\left[\begin{array}{c} X_{a}\\ Y_{a}\\ Z_{a} \end{array}\right]=\left[\begin{array}{c} CD_{0}+CD_{\alpha }\alpha +\sum _{j}CD_{{\phi _{ij}}}\phi _{ij}\\[3pt] CY_{\beta }\beta +CY_{p}\overline{p}+CY_{r}\overline{r}+\sum _{j}CY_{{\phi _{ij}}}\phi _{ij}\\[3pt] CL_{0}+CL_{\alpha }\alpha +CL_{q}\overline{q}+\sum _{j}CL_{{\phi _{ij}}}\phi _{ij} \end{array}\right]{1 \over 2}\rho V^{2}S\end{equation}
where the subscript j denotes the flight unit adjacent to i, V is the resultant velocity of the flight unit and S is the wing area of the flight unit. Parameters CL
 ${}_\alpha$
and CD
 ${}_\alpha$
represent the derivatives of the lift coefficient and drag coefficient with respect to the angle-of-attack for the flight unit when the relative roll angles between the flight units are zero. CY
 ${}_\beta$
is the derivative of the side force coefficient with respect to the sideslip angle for the flight unit when the relative roll angles between the flight units are zero. Parameters CYp and CYr are respectively the derivatives of the lateral force coefficient with respect to roll rate and yaw rate. CLq is the derivative of the lift coefficient with respect to the pitch rate. CD
 ${}_{\phi_{ij}}$
, CY
 ${}_{\phi_{ij}}$
and CL
 ${}_{\phi_{ij}}$
represent the derivatives of additional aerodynamic force increments with respect to relative roll angles caused by variations in the relative roll angles between flight units, reflecting the influence of inter-unit relative roll angles on the aerodynamic forces of flight units.
The generalised forces corresponding to the aerodynamic forces acting on the flight unit are originally defined in the inertial coordinate system. Therefore, these aerodynamic forces must be transformed into the inertial coordinate frame using a coordinate transformation matrix.
 \begin{equation}\left[\begin{array}{c} X\\ Y\\ Z \end{array}\right]=\boldsymbol{A}^{({\bf 0},\,\boldsymbol{i})}\boldsymbol{L}_{\boldsymbol{ba}}\left[\begin{array}{c} X_{a}\\ Y_{a}\\ Z_{a} \end{array}\right]\end{equation}
Among them,
 $\boldsymbol{A}^{({\bf 0},\,\boldsymbol{i})}$
is the transformation matrix from the aircraft-body coordinate system to the inertial coordinate system. Lba is the transformation matrix from the wind coordinate system to the aircraft-body coordinate system, and its expression is given as follows:
 \begin{equation}\boldsymbol{L}_{\boldsymbol{ba}}=\left[\begin{array}{c@{\quad}c@{\quad}c} {cos }{\alpha }cos\beta & {cos }{\alpha }sin\beta & -sin\alpha \\ -sin\beta & cos\beta & 0\\ {sin } {\alpha }cos\beta & {sin } {\alpha }sin\beta & cos\alpha \end{array}\right]\end{equation}
The expression of the aerodynamic moment acting on the flight unit of the multibody aircraft in the aircraft coordinate system can be uniformly written in the following form.
 \begin{equation}\left[\begin{array}{c} L\\ M\\ N \end{array}\right]=\left[\begin{array}{c} \left(Cl_{\beta }\beta +Cl_{0}+Cl_{\alpha }\alpha +Cl_{p}\overline{p}+Cl_{r}\overline{r}+\sum _{j}Cl_{{\phi _{ij}}}\phi _{ij}\right)\dfrac{1 }{ 2}\rho V^{2}Sl\\[7pt] \left(CM_{\alpha }\alpha +CM_{0}+CM_{q}\overline{q}+\sum _{j}CM_{{\phi _{ij}}}\phi _{ij}\right)\dfrac{1 }{ 2}\rho V^{2}Sc_{A}\\[7pt] \left(CN_{\beta }\beta +CN_{0}+CN_{\alpha }\alpha +CN_{p}\overline{p}+CN_{r}\overline{r}+\sum _{j}CN_{{\phi _{ij}}}\phi _{ij}\right)\dfrac{1 }{ 2}\rho V^{2}Sl \end{array}\right] \end{equation}
In the formula, l represents the spread length of the wing, and cA represents the average aerodynamic chord length of the wing. Cl
 ${}_\beta$
and CN
 ${}_\beta$
are respectively the derivatives of the roll moment coefficient and the yaw moment coefficient with respect to the sideslip angle. CM
 ${}_\alpha$
is the derivative of the pitch moment coefficient with respect to the angle-of-attack. Parameters Cl 0 and CN 0 represent the roll moment coefficient and yaw moment coefficient of the flight unit, respectively, when the multibody aircraft operates at 0° angle-of-attack and 0° sideslip angle. Cl
 ${}_\alpha$
and CN
 ${}_\alpha$
are respectively the derivatives of the roll moment coefficient and the yaw moment coefficient with respect to the angle-of-attack. Clp and Clr are respectively the derivatives of the rolling moment coefficient with respect to roll rate and the derivative of the rolling moment with respect to yaw rate. CNp and CNr are respectively the derivatives of the yaw moment coefficient with respect to roll rate and the derivative of the roll moment with respect to yaw rate. Cl
 ${}_{\phi_{ij}}$
, CM
 ${}_{\phi_{ij}}$
and CN
 ${}_{\phi_{ij}}$
are the derivatives of additional aerodynamic moment increments with respect to relative roll angles between flight units, caused by variations in their relative roll angles. These parameters characterise the influence of inter-unit relative roll angles on the aerodynamic moments of the flight units. Cl
 ${}_\alpha$
represents the derivative of the roll moment coefficient with respect to the angle-of-attack. Cl 0 denotes the roll moment coefficient of the flight unit at 0° angle-of-attack. Equation Cl 0 + Cl
 ${}_\alpha$
 $\alpha$
quantifies the additional roll moment coefficient induced by asymmetric lift distribution.
3.0 The application of DMD approach
3.1 Dynamic mode decomposition
This paper employs DMD to analyse the motion characteristics of the multibody aircraft during the deployment and unfolding process. As a data-driven approach, DMD utilises simulation data from multibody flight dynamics models to extract dominant dynamic features that characterise the system’s dynamic behaviour. The method is applicable to both numerical simulation and experimental data. DMD can extract the frequencies of the entire dynamic behaviour, and the obtained frequencies are complex frequencies, where the imaginary part represents the oscillation frequency and the real part represents the growth rate.
The method constructs matrices using time-varying state variable data, where column vectors represent the state variables and row vectors contain the time-series data. The core concept of DMD relies on linear transformation. It assumes the existence of a linear mapping matrix A that advances the system state q from timestep i to i + 1, as shown in Equation (21).
 \begin{equation}\boldsymbol{A}q_{i}=q_{i+1}\end{equation}
If the mapping matrix A is constant for the entire dynamic system, then for the state quantities at any two moments, the following relationship exists.
 \begin{equation}q_{j}=\boldsymbol{A}^{j-i}q_{i}\end{equation}
The DMD approximates a subset of the eigenvalues and eigenvectors of matrix A from the input data. These eigenvalues and corresponding modes characterise the system’s dynamic behaviour. For a sufficiently large dataset, the system state at the Nth timestep can be expressed as a linear combination of the states from the preceding N-1th timesteps, as shown in the following formula.
 \begin{equation}\boldsymbol{q}_{\boldsymbol{N}}\approx {\sum }_{i=1}^{m}b_{i}{\lambda }_{i}^{N}\boldsymbol{\phi }_{i}\end{equation}
In the formula, b represents the initial value,
 $\lambda$
is the eigenvalue of matrix A and
 $\phi$
is the corresponding mode. Among them, the eigenvalue can be replaced by using the attenuation rate.
 \begin{equation}\lambda =exp(\mu \cdot t)\end{equation}
Substituting Equation (21) into Equation (20), the distance N can be transformed into the form of time t.
 \begin{equation}\boldsymbol{q}_{\boldsymbol{t}}\approx {\sum }_{i=1}^{m}b_{i}e^{{\mu _{i}}t}\boldsymbol{\phi }_{i}\end{equation}
From this, it can be seen that as long as the eigenvalues, eigenvectors and initial moments of the system matrix A are obtained, the state quantities of the system at any subsequent moment can be obtained. Meanwhile, based on the eigenvalues of matrix A, the growth rate and change frequency of the system can be obtained.
This paper employs the singular value decomposition (SVD) method to solve the system matrix A. First, it is necessary to define the matrices X and Y. Assuming there are m state variables in the system, the matrix X is constructed using the first N-1 steps of the system state data, with its specific expression given as follows.
 \begin{equation}\boldsymbol{X}=\left[\begin{array}{c@{\quad}c@{\quad}c} q_{1}(t_{1}) & \cdots & q_{1}(t_{N-1})\\ \vdots & \ddots & \vdots \\ q_{m}(t_{1}) & \cdots & q_{m}(t_{N-1}) \end{array}\right]\end{equation}
The matrix Y is constructed using the data from the 2th to the Nth step of the state quantity, and its representation is as follows.
 \begin{equation}\boldsymbol{Y}=\left[\begin{array}{c@{\quad}c@{\quad}c} q_{1}(t_{2}) & \cdots & q_{1}(t_{N})\\ \vdots & \ddots & \vdots \\ q_{m}(t_{2}) & \cdots & q_{m}(t_{N}) \end{array}\right]\end{equation}
The matrix X is decomposed using the SVD method.
 \begin{equation}\left[\begin{array}{c@{\quad}c@{\quad}c} \boldsymbol{U} & \boldsymbol{S} & \boldsymbol{V} \end{array}\right]=svd\left(\boldsymbol{X}\right)\end{equation}
Using matrices Y, U, S and V, the system matrix A is computed through the following formula.
 \begin{equation}\boldsymbol{A}=\boldsymbol{U}^{\boldsymbol{T}}\boldsymbol{YV}\boldsymbol{S}^{-{\bf 1}}\end{equation}
The eigenvalues
 $\lambda$
and eigenvectors ω of the approximated system matrix A are subsequently computed. Define φ as the mode characterising dynamic behaviour, and its expression is as follows.
 \begin{equation}\boldsymbol{\phi }=\boldsymbol{YV}\boldsymbol{S}^{-{\bf 1}}\boldsymbol{\omega }\end{equation}
The initial value corresponding to the DMD mode is
 \begin{equation}\boldsymbol{\phi }\cdot \boldsymbol{b}=\boldsymbol{q}(\boldsymbol{t}_{{\bf 1}})\end{equation}
The growth rate g i and frequency w i corresponding to the eigenvalues
 $\lambda$
i of the system matrix A are respectively defined in the following forms.
 \begin{equation}g_{i}=Re(lg(\lambda _{i}))/\Delta {\rm t}\end{equation}
 \begin{equation}w_{i}=Im(lg(\lambda _{i}))/\varDelta t\end{equation}
By analysing the growth rate associated with the eigenvalues, the stability during the deployment process can be determined. Negative growth rate indicates that the corresponding mode is stable, leading to gradual convergence of the system. Conversely, positive growth rate suggests an unstable mode, which may cause the system to diverge over time.
To prevent matrix singularity (i.e. an excessively large condition number of the matrix) when extracting dynamic features using standard DMD, the truncation rank of the system matrix A is determined by the number of singular values greater than 10−6 during SVD decomposition. Under this condition, the condition number of the system matrix A is approximately 104.
3.2 Normalised state quantities
The dynamic behaviour describing the deployment motion laws should be independent of dimensional effects. Normalised state quantities refer to the processing of data to eliminate the dimensional influence between different features, enabling comparison or operation of data on the same scale. This non-dimensional treatment enhances the performance of DMD algorithms, as it ensures all features are calculated on a common scale. This is particularly critical when handling multi-dimensional variable data, as it helps eliminate discrepancies in units and orders of magnitude, allowing the algorithm to focus more effectively on inherent patterns and variation trends in the data itself.
Therefore, for the data of the deployment and unfolding process obtained from the dynamic model, the min–max normalisation method is adopted to perform linear transformation on the original data and map it to the range of [0,1]. The calculation formula is as follows
 \begin{equation}\overline{q}={q-q_{min} \over q_{max}-q_{min}}\end{equation}
Among them, q max is the maximum value of each state quantity, and q min is the minimum value of each state quantity.
During the normalised process, although state quantities can be transformed into normalised forms to simplify analysis and calculation, this process may significantly amplify the high-frequency noise introduced by numerical calculation in the time-domain simulation. Specifically, when the true value of the state quantity q approaches zero, the corresponding normalised state quantity may be amplified due to minor calculation errors, causing the normalised error to potentially reach a magnitude comparable to that of the true signal. Thus, false dynamic modes or numerical oscillations are introduced during the process of dynamic mode decomposition.
Therefore, this paper introduces a threshold judgement. When the absolute value of the state quantity q is less than the preset threshold, it is considered that its physical meaning can be ignored, and it is forcibly assigned a value of zero, that is
 \begin{equation}\overline{q}=\left\{\begin{array}{rr} 0, & \left| q\right| \lt \unicode{x025B} \\ \dfrac{q-q_{min} }{ q_{max}-q_{min}}, & \left| q\right| \geq \unicode{x025B} \end{array}\right.\end{equation}
The selection of threshold
 $\unicode{x025B} $
should be determined based on the specific problem. Firstly, the threshold should be much smaller than the feature magnitude of the system’s dominant dynamics. Secondly, it is necessary to have a local truncation error order higher than that of the simulation algorithm to avoid masking the real physical phenomenon. An overly large threshold may mask the real small-scale physical phenomena. In this article, the value of the threshold
 $\unicode{x025B} $
is 10−5.
4.0 Dynamics simulation and DMD analysis of six-body aircraft deployment
4.1 Six-body aircraft model
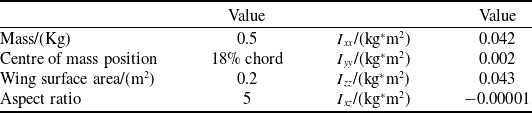
This paper takes a hinge-connected six-body aircraft as the research object. This six-body aircraft is mainly composed of six identical flight units connected through a single-degree-of-freedom rotating hinge, and each flight unit can also be regarded as an independent flight unit. The flight unit adopts a full-wing layout and consists of two parts: the wing and the vertical tail. The wingspan of the flight unit is 1 m, and the average aerodynamic chord length is 0.2 m. The aerofoil adopts CLARK Y airfoil (a classic airfoil series developed by V.E. Clark). The vertical tail has a span of 0.2 m and a chord length of 0.2 m. The aerofoil adopts NACA0012 airfoil (a symmetric airfoil from the National Advisory Committee for Aeronautics four-digit series, with a maximum thickness of 12% of the chord). The mass-inertia parameters of the flight unit are shown in the Table 1. The geometric model of the flight unit is shown in the Figure 4.
Geometric and mass-inertial parameters of flight units

Table 1. Long description
A table titled ’Geometric and mass-inertial parameters of flight units’ with two columns and six rows. The first column is labeled ’Value’ and the second column is also labeled ’Value’. The table contains the following data: Row 1: Mass/(Kg), 0.5; Ixx/(kg*m^2), 0.042. Row 2: Centre of mass position, 18 percent chord; Iyy/(kg*m^2), 0.002. Row 3: Wing surface area/(m^2), 0.2; Izz/(kg*m^2), 0.043. Row 4: Aspect ratio, 5; Ixz/(kg*m^2), -0.00001.
The geometric model of the flight unit.

4.2 Numerical simulation calculation of the deployment process of the six-body aircraft
In this section, numerical simulations will be conducted to analyse the dynamic behaviour of the multibody aircraft during the deployment process, based on multibody flight dynamics model. The six-body aircraft adopts a ‘W’-type folding configuration, with an absolute folding angle of 120° between flight units. The initial roll angles of each flight unit are as follows.
 \begin{equation}\phi _{1}=-\phi _{2}=\phi _{3}=-\phi _{4}=\phi _{5}=-\phi _{6}=60^{\circ}\end{equation}
The connection stiffness coefficient between flight units is set to 4 (N
 $ \cdot $
m)/rad. The initial velocity of the six-body aircraft when it is launched is 0.01 m/s, and the initial pitch angle is −70°. The simulation duration is 10 s and the step size is 0.01 s. The dynamic response curve of the six-body aircraft during the deployment process is shown in Figures 5–8. The schematic diagram of the deployment process for the six-body aircraft is shown in Figure 9.
The variation curves of the roll angles of each flight unit with time during the deployment process of the six-body aircraft.

Pitch angle variation during deployment process of six-body aircraft.

Velocity variation of each flight units during six-body aircraft deployment.

Roll rate variation of each flight units during six-body aircraft deployment.

Deployment process of the six-body spacecraft. Subplots (a) show the deployment dynamics during the entire simulation period, while subplots (b) focus on the first 2 s of deployment dynamics.

As can be seen from the simulation curves in Figures 5–8, the six-body aircraft eventually transitions to a steady gliding motion after undergoing a deployment phase and a period of heaving motion. The roll angle curve in Figure 5 indicates that during the entire deployment process, the roll angles of each individual flight unit continuously converge until they reach zero. When the roll angles of all flight units become zero, it signifies that the six-body aircraft has achieved full deployment. As can be seen from the flight velocity curves of the individual units in Figure 7, there are discrepancies in the flight speeds among the units during the first 1-second deployment phase. After 1 s, when the six-body aircraft completes its deployment and enters the heaving motion, the variation in flight speed shows no significant differences. As can be seen from the roll rate curve in Figure 8, the values change significantly during the first second, indicating that the six-body aircraft is in the deployment phase. After 1 s, the roll angular velocity converges to near zero, indicating that the deployment is complete and the aircraft enters the phase of heaving motion.
The dynamic behaviour of the six-body aircraft during the deployment process has been investigated through numerical simulations. Following this analysis, the DMD method will be employed to extract the characteristic modes of the deployment process and to reconstruct the underlying dynamics.
4.3 Dynamic behaviour analysis based on the DMD method
In the previous section, based on the multibody flight dynamics model, the deployment and unfolding dynamic behaviours of the six-body aircraft were obtained. In this section, the results obtained from numerical simulation calculations are used as the data input for the DMD, and the DMD approach is utilised to extract the characteristic modes during the deployment process of the six-body aircraft.
Shows the characteristic modes of the deployment and unfolding dynamic behaviour of six-body aircraft.

DMD is employed to extract characteristic dynamic modes and achieve dimensionality reduction for the deployment dynamics of the six-body aircraft during the deployment process. In section 4.2, the state quantity variation data of each flight unit of the multibody aircraft over time was obtained. The total simulation duration is 10 s with a timestep of 0.01s, where each simulation step corresponds to one discrete time instance. Therefore, the data of all state variables from timestep 1 to timestep 1000 are arranged in chronological order to form the matrix X, while the data from timestep 2 to timestep 1001 are arranged similarly to form the matrix Y. By applying the DMD approach, the characteristic modes of the dynamics during the deployment process of the six-body aircraft are extracted.
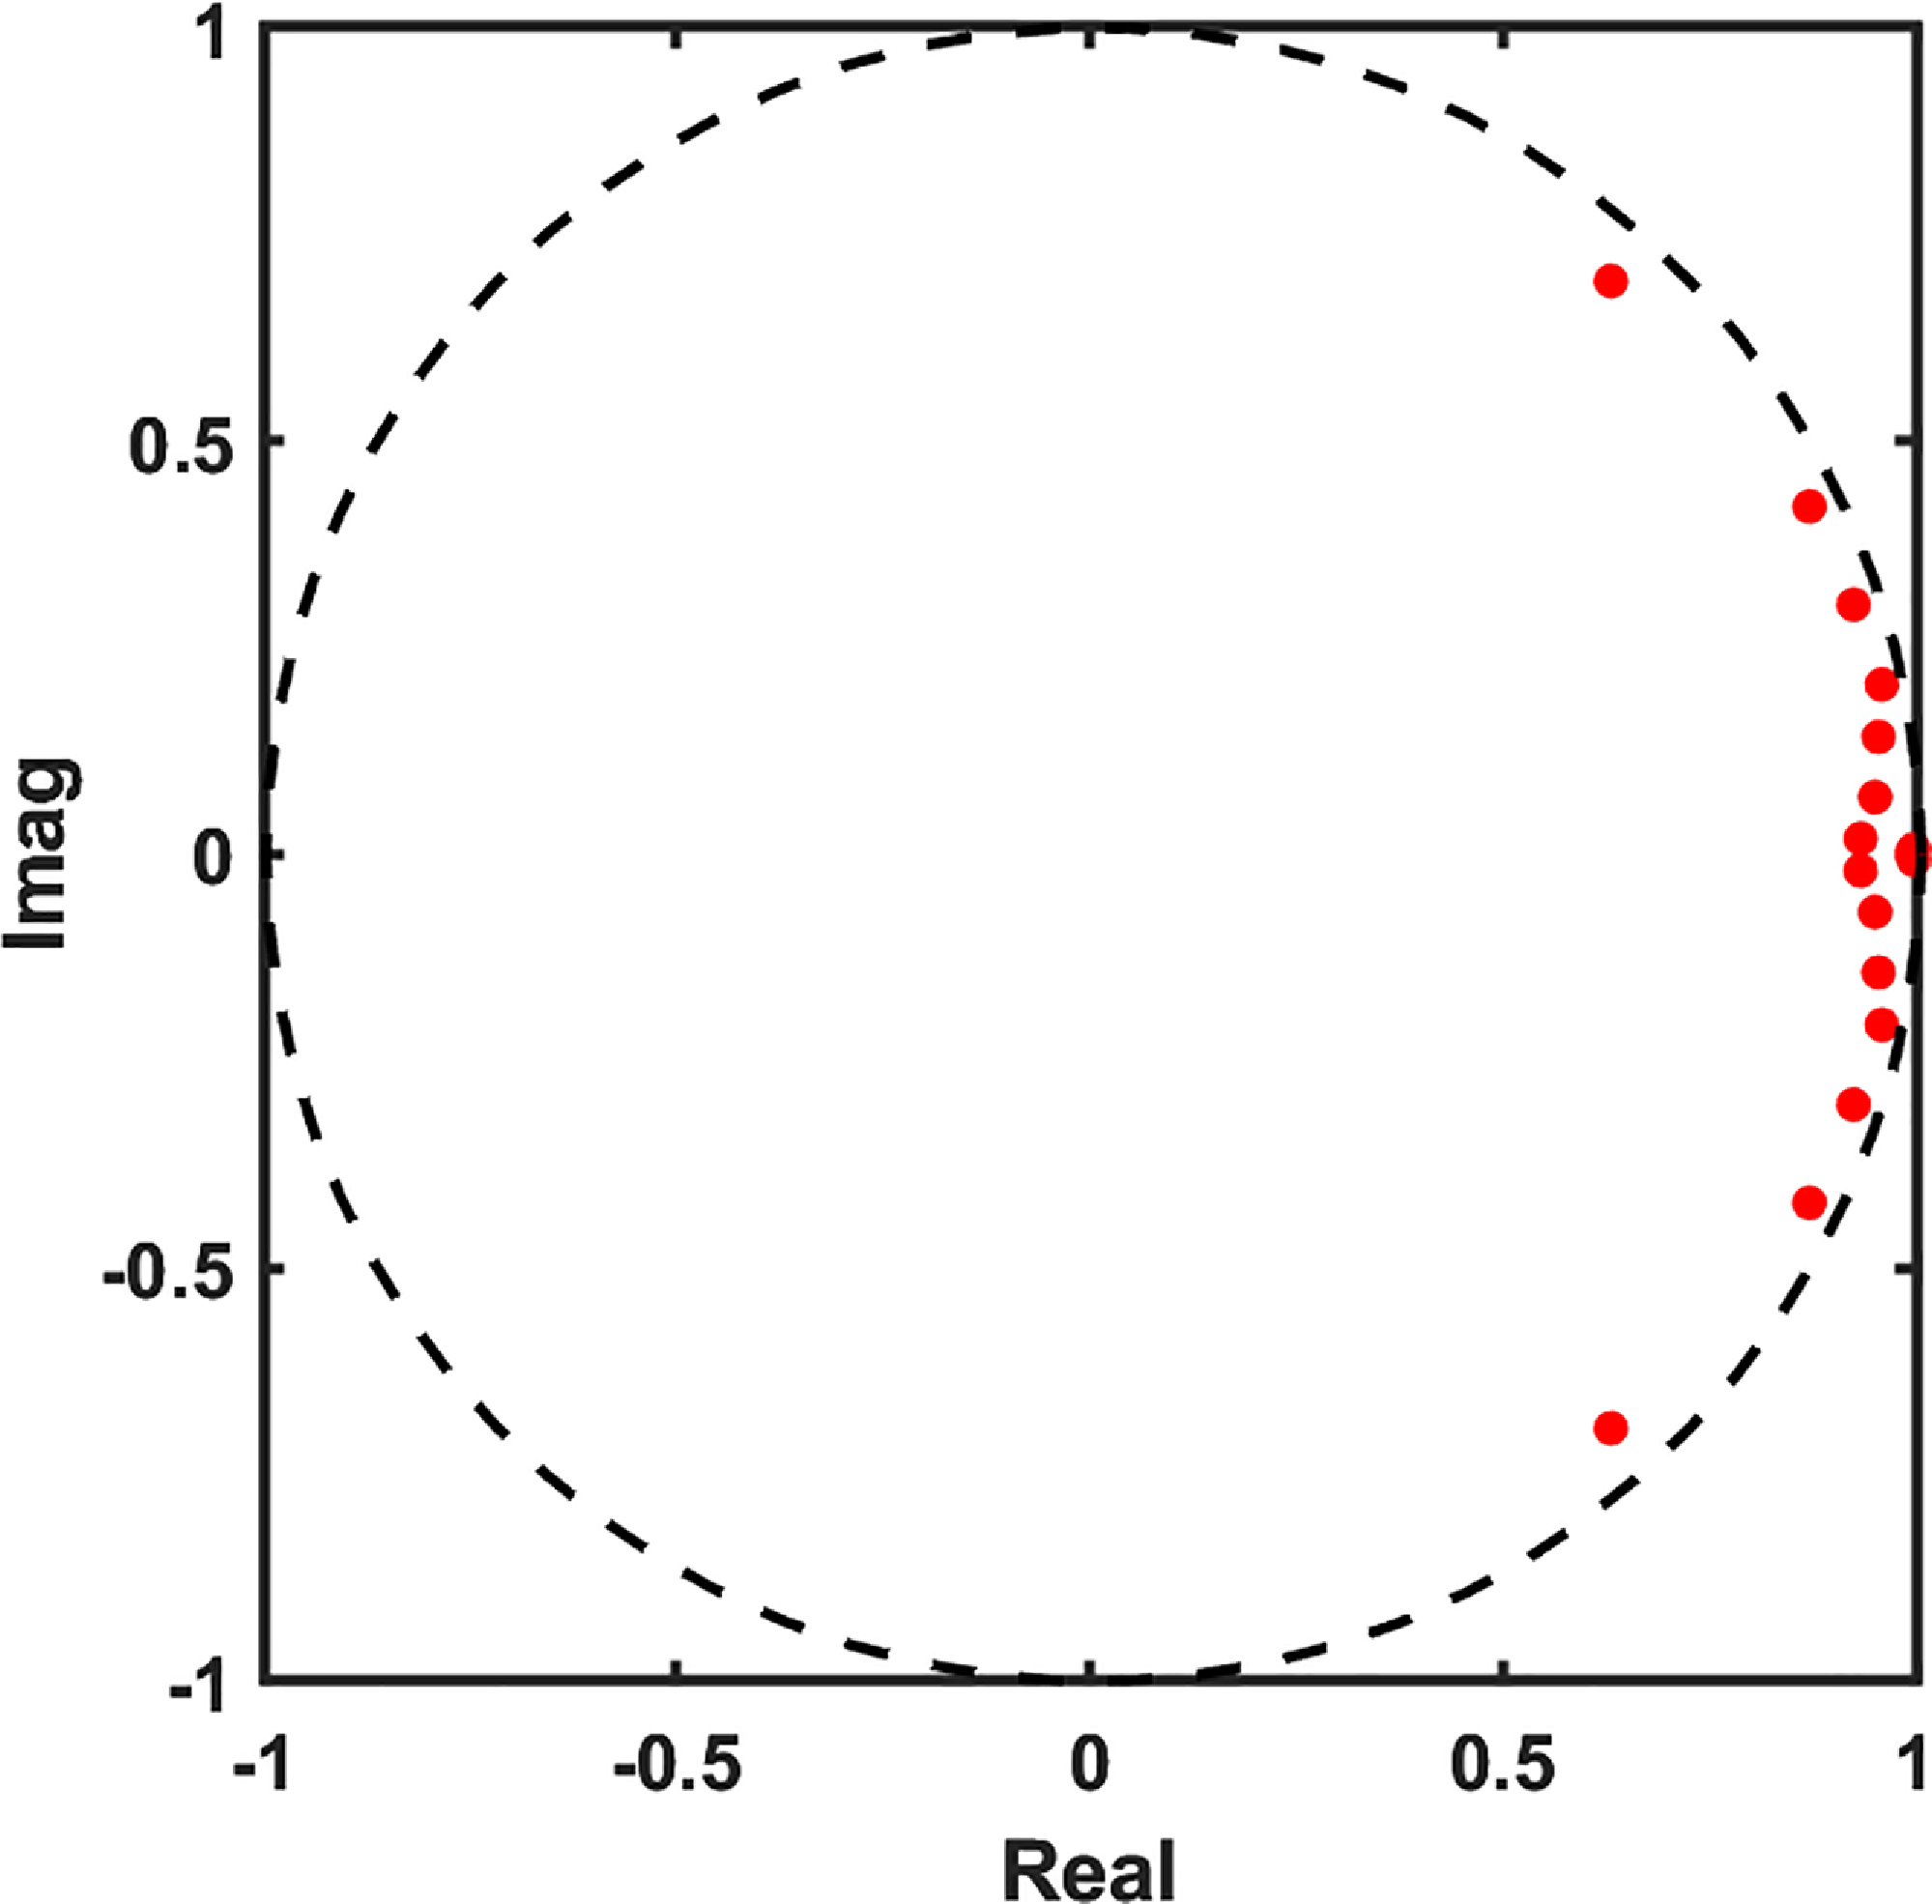
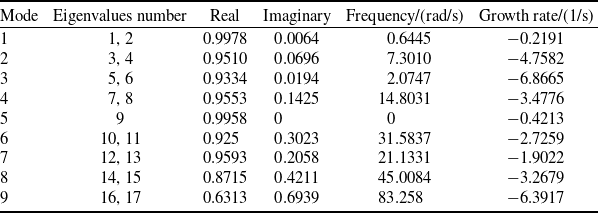
The characteristic modes of the deployment dynamics for the six-body aircraft during the deployment and unfolding process, obtained via DMD, are shown in Figure 10. The characteristic eigenvalues obtained from DMD typically appear as complex conjugate pairs. If DMD eigenvalue lies on the unit circle, the corresponding mode is neutrally stable – neither growing nor decaying. If eigenvalue lies inside the unit circle, the corresponding mode is a stable damped mode. If eigenvalue lies outside the unit circle, the corresponding mode is an unstable growing mode. As shown in Figure 10, all characteristic eigenvalues obtained from DMD that represent the deployment and unfolding of the six-body aircraft lie inside the unit circle, indicating that all modes characterising the deployment and unfolding dynamic behaviour of the six-body aircraft are stable damped modes. This also demonstrates that the six-body aircraft achieves a stable deployment and unfolding motion. The information for each order of the characteristic modes extracted by DMD is summarised in Table 2.
The basic information of each order of characteristic modes

Table 2. Long description
A table summarizing the characteristics of different modes of deployment dynamics for a six-body aircraft. The table has 9 rows and 6 columns. The columns are labeled Mode, Eigenvalues number, Real, Imaginary, Frequency/(rad/s), and Growth rate/(1/s). Each row provides the corresponding values for each mode from 1 to 9. For example, Row 1: Mode 1, Eigenvalues number 1, 2, Real 0.9978, Imaginary 0.0064, Frequency/(rad/s) 0.6445, Growth rate/(1/s) -0.2191.
Following the analysis of the eigenvalues for each DMD mode, the next step is to examine the corresponding eigenvectors to interpret the dynamic behaviour represented by each characteristic mode. The principal components of the eigenvectors are plotted as vectors in polar coordinates. The eigenvectors for the first six modes are shown in Figures 11–13.
The eigenvectors corresponding to modes 1.

The eigenvectors corresponding to modes 2.

The eigenvectors corresponding to modes 3.

As can be seen from Figure 11, modes 1 are primarily dominated by pitch angle θ, velocity
 $ \,\dot{\!x} $
and
 $ \,\dot{\!z} $
and pitch rate
 $ \dot{\theta} $
, characterising the sinking and floating motion of the six-body aircraft during the deployment process. Therefore, modes 1 are phugoid mode. Figure 12 shows that modes 2 are mainly governed by the roll angle
 $\phi$
and roll rate
 $ \dot{\phi} $
of the flight units, representing the unfolding motion of the six-body aircraft during deployment. From Figure 13, it can be observed that modes 3 are predominantly influenced by the pitch rate
 $ \dot{\theta} $
, characterising the pitching motion of the six-body aircraft during the deployment process. Therefore, modes 3 are short-period modes. By analysing the eigenvectors of different modes, it can be demonstrated that the characteristic modes obtained through DMD analysis possess strong physical interpretability.
Due to the existence of multiple modes, it is also necessary to utilise the energy values of each mode to select the appropriate mode to reconstruct the deployment process of the six-body aircraft. The expression of the DMD modal energy I is
 \begin{equation}I={\sum }_{k}^{n}\left| \alpha _{i}\left(\lambda _{i}\right)^{k-1}\right| {\left|\left|\unicode{x1D6F7} _{i}\right|\right|}_{F}^{2}\varDelta t\end{equation}
Among them, k = 1, 2 … n is a certain moment during the deployment process of the six-body aircraft, and i represents the number of eigenvalues obtained by DMD, Φ is the characteristic mode characterising the dynamic behaviour and
 $\lambda$
is the characteristic root of the mode.
 $\alpha$
i is the initial state quantity. Δt represents the step size.
The higher the energy proportion of the DMD mode, the better it can reflect the deployment process of the six-body aircraft. Therefore, the energies of each mode are arranged from largest to smallest, and the energy proportion graphs of the first N modes are drawn, as shown in Figure 14.
Energy contribution diagram of the first N characteristic modes representing the deployment and unfolding dynamics of the multibody aircraft.

As can be seen from Figure 14, the cumulative energy contribution of the first seven modes exceeds 98%, indicating that these modes captured through DMD are sufficient to represent the deployment process of the six-body aircraft. Therefore, the first seven modes are identified as the dominant characteristic modes governing the deployment and unfolding dynamics of the six-body aircraft.
4.4 Comparative analysis between the reconstructed model and the original simulation data
To further verify the feasibility of the DMD method in analysing the dynamic characteristics of the deployment and expansion of the six-body aircraft, based on Section 4.3, the dynamic behaviour of the deployment and unfolding of the six-body aircraft is obtained through Equation (23), and the accuracy of the extracted feature modes is verified. To verify the correctness of the low-dimensional equivalent model, this paper uses the MAE to evaluate the accuracy of the equivalent model, and its calculation formula is as follows
 \begin{equation}e_{MAE}={1 \over m}{\sum }_{i=1}^{m}\left| y-\hat{y}\right|\end{equation}
In the formula, m represents the data volume, y represents the data values of each state quantity obtained from the simulation of the multibody flight dynamics model and
 $\hat{y}$
is the data value of each state quantity calculated based on the equivalent model obtained from DMD. The smaller the e MAE, the better the effect of the characteristic modes obtained by DMD decomposition in characterising the dynamic behaviour of the deployment process.
The deployment process of the six-body aircraft was simulated and calculated by using the original multibody flight dynamics model and the DMD modal reconstruction model. The dynamic response results of the two models are compared from Figures 15 to 20.
Dynamic responses of normalised roll angle for all flight units: comparison between the original and reconstructed models.

Figure 15. Long description
Six line graphs compare normalized roll angle variation curves for different flight units using two models. Panel A: The normalized roll angle variation curve of flight unit 1. The graph shows time in seconds on the horizontal axis and normalized roll angle on the vertical axis. Two lines are plotted: one for the multi-body flight dynamics model and another for the DMD equivalent model. Both lines show a sharp peak at the beginning and then stabilize. Panel B: The normalized roll angle variation curve of flight unit 2. The graph shows time in seconds on the horizontal axis and normalized roll angle on the vertical axis. Two lines are plotted: one for the multi-body flight dynamics model and another for the DMD equivalent model. Both lines show a sharp peak at the beginning and then stabilize. Panel C: The normalized roll angle variation curve of flight unit 3. The graph shows time in seconds on the horizontal axis and normalized roll angle on the vertical axis. Two lines are plotted: one for the multi-body flight dynamics model and another for the DMD equivalent model. Both lines show a sharp peak at the beginning and then stabilize. Panel D: The normalized roll angle variation curve of flight unit 4. The graph shows time in seconds on the horizontal axis and normalized roll angle on the vertical axis. Two lines are plotted: one for the multi-body flight dynamics model and another for the DMD equivalent model. Both lines show a sharp peak at the beginning and then stabilize. Panel E: The normalized roll angle variation curve of flight unit 5. The graph shows time in seconds on the horizontal axis and normalized roll angle on the vertical axis. Two lines are plotted: one for the multi-body flight dynamics model and another for the DMD equivalent model. Both lines show a sharp peak at the beginning and then stabilize. Panel F: The normalized roll angle variation curve of flight unit 6. The graph shows time in seconds on the horizontal axis and normalized roll angle on the vertical axis. Two lines are plotted: one for the multi-body flight dynamics model and another for the DMD equivalent model. Both lines show a sharp peak at the beginning and then stabilize.
As shown in Figures 15–20, the dynamic responses of the original multibody flight dynamics model and the reconstructed model are compared. It can be clearly seen that the equivalent model obtained by reconstructing the feature modes has basically the same characteristic behaviour as the original model, mainly manifested in the complete coincidence of oscillation frequencies and amplitudes during the expansion process. This indicates that the extracted feature modes can not only well represent the dynamic behaviour characteristics during the deployment process of the six-body aircraft, but also reconstruct the dynamic behaviour of the deployment with higher accuracy based on this. By using Equation (38) to analyse the error between the equivalent model and the original model, it is determined that the error in reconstructing the deployment dynamics using the DMD modal reconstruction model is 7.78%.
Dynamic responses of normalised roll rate for all flight units: comparison between the original and reconstructed models.

Dynamic responses of normalised pitch angle and pitch rates for all flight units: comparison between the original and reconstructed models.

Dynamic responses of normalised velocity Vx for all flight units: comparison between the original and reconstructed models.

Dynamic responses of normalised velocity Vy for all flight units: comparison between the original and reconstructed models.

Figure 19. Long description
Six line graphs depict the normalized velocity Vy for six different flights, comparing the multi-body flight dynamics model with the DMD equivalent model. Each graph has the normalized velocity Vy on the vertical axis and time in seconds on the horizontal axis. Panel A shows the normalized velocity Vy of flight 1, with both models closely matching and stabilizing around 0.8. Panel B illustrates the normalized velocity Vy of flight 2, where both models align closely and stabilize around 0.8. Panel C presents the normalized velocity Vy of flight 3, with both models showing a similar trend and stabilizing around 0.8. Panel D displays the normalized velocity Vy of flight 4, where both models align closely and stabilize around 0.2. Panel E shows the normalized velocity Vy of flight 5, with both models closely matching and stabilizing around 0.2. Panel F illustrates the normalized velocity Vy of flight 6, where both models align closely and stabilize around 0.2. Each graph includes a legend indicating the multi-body flight dynamics model in blue and the DMD equivalent model in orange.
Based on the criterion of 98% energy contribution, this study selected the first seven DMD modes as the characteristic modes representing the deployment dynamics of the six-body aircraft. Next, the rationality of taking the energy proportion as the standard will be verified by studying the influence of the number r of DMD modes on the reconstruction error. To study the influence of the number r of DMD modes on the reconstruction error, the dynamic behaviour of the six-body aircraft during the deployment and unfolding process was reconstructed using the first r-order modes respectively, and the relationship between the number of modes and the reconstruction error was investigated. The Figure 21 presents the reconstruction errors under different numbers of modes.
As can be seen from Figure 21, the larger the parameter r is, the more modes it contains, and the smaller the reconstruction error will be. When the parameter r exceeds a certain value, the reconstruction error will no longer decrease significantly. It can be clearly seen from the marked points in the figure that after the current r-order feature mode energy proportion exceeds 98%, the reconstruction error will no longer decrease significantly. Therefore, it can be judged that it is accurate and reliable to select the appropriate characteristic mode to characterise the dynamic behaviour of the six-body aircraft by taking the energy proportion as the reference standard.
Dynamic responses of normalised velocity Vz for all flight units: comparison between the original and reconstructed models.

The relationship curve between the number of reconstructed modes r and the reconstruction error.

After analysing the impact of the number of modes on the reconstruction error, the next step is to examine the effect of the threshold
 $\varepsilon$
on the total number of DMD eigenvalues and on the number of eigenvalues required to capture 98% of the energy. The horizontal axis is taken as −log(
 $\varepsilon$
), ranging from 1 to 15 at unit intervals. The corresponding threshold values range from 10−15 to 10−1. The effect of varying the threshold on both the number of DMD eigenvalues and the number of modes needed to achieve 98% of the energy is shown in Figure 22.
The effect of the threshold on the total number of DMD eigenvalues and the number of dominant eigenvalues.

As shown in Figure 22, when the threshold is less than 10−13, the number of dynamic modes obtained from the DMD increases. This is caused by the amplification of high-frequency noise during the nondimensionalisation process. When the threshold exceeds 10−2, the number of eigenvalues required to capture 98% of the energy decreases, because an excessively large threshold masks some small-scale motion modes. Thus, within the threshold range of interval A, both the total number of DMD eigenvalues and the number of eigenvalues needed to achieve 98% of the energy remain stable. The number of eigenvalues required to reach 98% of the energy is 12, corresponding to the first seven modes selected based on the energy criterion.
Next, the influence of the threshold value on the frequency and growth rate of each eigenvalue is analysed. Figure 23 shows the effect of the threshold on the frequency of each eigenvalue, and Figure 24 shows the effect of the threshold on the growth rate of each eigenvalue.
Impact of the threshold on the frequency of each eigenvalue.

Figure 23. Long description
A line graph showing the impact of the threshold on the frequency of each eigenvalue. The horizontal axis is labeled ‘Threshold -lg(e)’ and ranges from 1 to 9. The vertical axis is labeled ‘Frequency (rad/s)’ and ranges from -5 to 40. The graph includes multiple lines, each representing a different eigenvalue (λ1 to λ13). Each line is color-coded and uses different line styles (solid, dashed, dotted) to distinguish between them. The lines show various trends: some increase, some decrease, and some remain relatively constant as the threshold increases. The legend on the right side of the graph indicates the corresponding eigenvalue for each line.
Impact of the threshold on the growth rate of each eigenvalue.

As can be seen from Figures 23 and 24, when the threshold is less than 10−4, the frequency and growth rate of each eigenvalue tend to stabilise and remain almost unchanged. Combined with the effect of the threshold on the number of DMD modes, it is evident that the DMD analysis exhibits good stability when the threshold is less than 10−4 and greater than 10−12. Therefore, the threshold value of 10−5 selected in this paper provides a good balance between noise suppression and retaining physically meaningful dynamic characteristics.
5.0 Deployment experiment verification for six-body aircraft
In this section, experiments will be carried out on the six-body aircraft to verify the correctness of the multibody aircraft dynamics model and the DMD feature mode reconstruction model. The research subjects in Section 4.1 were used as the experimental subjects to carry out the deployment experiment. The six-body aircraft is composed of six identical flight units connected by a hinge device. The hinge device can embed a coil spring. The stiffness coefficient of the connection between the flight units is determined by the number of coil springs and the stiffness coefficient of each spring. The experimental prototype of the six-body aircraft, the hinge device and the sensor are shown in the Figure 25.
Experimental prototype of the six-body aircraft.

During the assembly process, the rotating shafts of the hinge mechanism components need to be parallel to the fuselage axes of each flight unit. Meanwhile, due to the mutual interference among structural components, the maximum relative roll angle between the six-body aircraft is 120°. In addition, sensors equipped with gyroscopes and accelerometers are installed at the centre of mass of each flight unit to detect the flight status information of each flight unit in real time during the deployment process. Four release devices are used to hoist the six-body aircraft at four points. The four points are released simultaneously through the ground remote control to achieve the purpose of air release.
The initial height of the experimental prototype is approximately 15 m, the initial pitch angle is approximately −60 degrees and the absolute value of the initial folding angle between the flight units is approximately 120 degrees. After the six-body aircraft is launched, it undergoes an unfolding and sliding motion in an open-loop state. Just one aerial deployment experiment was performed for the six-body aircraft. The deployment and unfolding process of the six-body aircraft is shown in the Figure 26. The attitude angles of each flight unit and the folding angles between flight units measured by the sensors are shown in the Figures 27 and 28.
Deployment and unfolding process of the six-body aircraft during the experiment.

Pitch angle variation data collected during the deployment experiment of the six-body aircraft.

Figure 27. Long description
Panel A: A line graph showing pitch angle variations over time for six aircraft during deployment. The horizontal axis represents time in seconds, ranging from 0 to 400 seconds. The vertical axis represents the pitch angle in radians, ranging from -2 to 1.5 radians. The graph includes six data lines, each representing a different aircraft: aircraft 1 in red, aircraft 2 in green, aircraft 3 in blue, aircraft 4 in black, aircraft 5 in orange, and aircraft 6 in pink. The graph is divided into three stages: ascending stage, falling stage, and after landing. During the ascending stage, the pitch angles of all aircraft initially decrease and then stabilize. In the falling stage, the pitch angles show significant fluctuations. After landing, the pitch angles of all aircraft stabilize again.
Fold angle variation data collected during the deployment experiment of the six-body aircraft.

As can be seen from Figure 26, after the six-body aircraft was released, it began to continuously unfolding under the action of the springs between the flight units. While deploying, due to its own stability, the six-body aircraft kept raising its head. This demonstrates that the folded six-body aircraft can achieve open-loop deployment when released, while also actively pulling up and transitioning to steady gliding flight. It can be seen from the variation curve of the pitch angle in Figure 27 that the entire deployment process is clearly divided into three stages: the preparation for ascent stage, the deployment stage and the landing stage. The six-body aircraft began to be released at 230 s, and the entire process of unfolding and descending lasted for approximately 3 s. Under the effect of its own stability, the six-body aircraft keeps pulling up, thus the pitch angle keeps increasing. Figure 28 shows the variation curve of the folding angle during the unfolding and descending process of the six-body aircraft. In the figure, the fold-angle 1 is the folding angle between flight unit 1 and flight unit 2, the fold-angle 2 is the folding angle between flight unit 2 and flight unit 3, and so on. It can be seen from the variation curve of the folding angle that during the period from 230 to 231 s, the folding angle between the flight units continuously converges under the action of the curling spring. It is indicated that during the entire deployment process, the deployment movement of the six-body aircraft lasted for approximately one second. At about 233 s, the six-body aircraft landed.
The three-second experimental data of the fall phase was extracted and compared and analysed with the simulation data of the multibody flight dynamics model and the fall data calculated by the DMD reconstruction model in the same time dimension. Figure 29 shows the comparison curve of the folding angle between the flight units and the pitch angle of the six-body aircraft.
Figures (a) to (f) show the comparison curves of the folding angle and pitch angle between the flight units during the deployment process of the six-body aircraft.

Figure 29. Long description
Panel A: A line graph compares the folding angle change curves between Flight Unit 1 and Flight Unit 2. The x-axis represents time in seconds, and the y-axis represents the folding angle in degrees. The graph includes three lines: a solid black line for the deployment experiment, a dashed red line for the multi-body flight dynamics model, and a dotted green line for the DMD reconstruction model. Panel B: A line graph compares the folding angle change curves between Flight Unit 1 and Flight Unit 2. The x-axis represents time in seconds, and the y-axis represents the folding angle in degrees. The graph includes three lines: a solid black line for the deployment experiment, a dashed red line for the multi-body flight dynamics model, and a dotted magenta line for the DMD reconstruction model. Panel C: A line graph compares the folding angle change curves between Flight Unit 3 and Flight Unit 4. The x-axis represents time in seconds, and the y-axis represents the folding angle in degrees. The graph includes three lines: a solid black line for the deployment experiment, a dashed red line for the multi-body flight dynamics model, and a dotted green line for the DMD reconstruction model. Panel D: A line graph compares the folding angle change curves between Flight Unit 4 and Flight Unit 5. The x-axis represents time in seconds, and the y-axis represents the folding angle in degrees. The graph includes three lines: a solid black line for the deployment experiment, a dashed red line for the multi-body flight dynamics model, and a dotted green line for the DMD reconstruction model. Panel E: A line graph compares the folding angle change curves between Flight Unit 5 and Flight Unit 6. The x-axis represents time in seconds, and the y-axis represents the folding angle in degrees. The graph includes three lines: a solid black line for the deployment experiment, a dashed red line for the multi-body flight dynamics model, and a dotted blue line for the DMD reconstruction model. Panel F: A line graph compares the pitch angle change curves. The x-axis represents time in seconds, and the y-axis represents the pitch angle in degrees. The graph includes three lines: a solid black line for the deployment experiment, a dashed red line for the multi-body flight dynamics model, and a dotted green line for the DMD reconstruction model.
It can be seen from the variation curve in the Figure 29 that the variation trends of the folding angle and pitch angle calculated by the multibody flight dynamics model and the DMD modal reconstruction model are basically consistent with the variation curves of the experimental data of the six-body aircraft deployment. The average error of the folding angle unfolding frequency is approximately 31%. Comparison of the experimental pitch angles with those from the original and DMD models yielded average errors of approximately 8.9% and 9.34%, respectively. Through comparison and analysis with experimental data, the reliability of the multibody flight dynamics model and the DMD modal reconstruction model in analysing the deployment process of the six-body aircraft was verified.
The experimental errors in the deployment of the six-body aircraft mainly come from the following aspects. First, the aircraft wobbles at high altitude, making it difficult for the simulation to exactly replicate the initial experimental conditions. Second, friction, clearance and damping are neglected in the model, affecting the deployment frequency. Additionally, the linear spring assumption has limitations, and plastic deformation of the springs also influences the deployment frequency. This experiment is acceptable for trend prediction. The multibody flight dynamics model and the DMD reduced-order model successfully capture the overall deployment and longitudinal motion trends. In particular, the average error for the pitch angle is only about 9%, demonstrating the model’s reasonable reliability in predicting longitudinal motion. However, for precise time-sequence prediction, refined modelling and multiple drop-test experiments are needed.
6.0 Conclusions
This paper first establishes a multibody flight dynamics model by using the multibody dynamics model and the aerodynamic model. Based on the multibody flight dynamics model, the state quantity data of each flight unit of the six-body aircraft during the deployment and unfolding process were obtained through numerical simulation calculations.
Then, the DMD method was employed to analyse the dynamic characteristics of the six-body aircraft during the deployment and unfolding process, and characteristic modes representing the deployment process were extracted. The frequency and growth rate of each mode were analysed through eigenvalues. Meanwhile, the dynamic behaviours corresponding to each characteristic mode were interpreted by analysing the eigenvectors. A reconstruction model was established using the feature modes extracted by DMD. By comparing with the original simulation data, it can be obtained that the error of the DMD reconstruction model is approximately 7.78%. This indicates that the characteristic modes obtained through DMD analysis can not only reflect the deployment process of the six-body aircraft, but also have strong interpretability.
Secondly, by analysing the influence of the number of DMD modes on the reconstruction error, it can be seen that after the current r-order feature mode energy proportion exceeds 98%, the reconstruction error will no longer decrease significantly. It indicates that it is reasonable to select characteristic modes based on the energy proportion as the reference standard to characterise the dynamic behaviour of the six-body aircraft during the deployment process.
Finally, by comparing with the air launch experiments of the six-body aircraft, it was found that the variation trends of the folding angle and pitch angle calculated by the multibody flight dynamics model and the DMD modal reconstruction model were basically consistent with the variation curves of the six-body aircraft launch and deployment experiment data. The average error of the folding angle unfolding frequency is approximately 31%. For the pitch angle, the average error of the multi-vehicle flight dynamics model is approximately 8.9%, while the error of the DMD equivalent model is approximately 9.34%. This verified the reliability of the multibody flight dynamics model and the DMD modal reconstruction model in analysing the deployment process of the six-body aircraft.
In this paper, DMD technology has been employed to extract the dynamic characteristics of the deployment and unfolding process of the multibody aircraft and to establish an equivalent model. Nevertheless, certain limitations remain. Therefore, future work will focus on the following three aspects:
First, this paper applies standard DMD over the entire 10-second simulation. However, the deployment process – especially the first second – is highly nonlinear and non-equilibrium. Standard DMD may miss fast dynamics. Future work should use HODMD to extract modes and improve reconstruction accuracy. Multi-window DMD can also be used to analyse mode evolution over time.
Second, deployment and system parameters affect the dynamics and the characteristic modes. Future work should study how initial deployment parameters influence these modes to develop parametric reduced-order models for deployment strategy design.
Finally, only one experiment was conducted for verification, and some errors remained. Future work should investigate the sources of these errors, further refine the model and perform more deployment experiments for verification.