1 Introduction
Flow past a sphere in close proximity to a free surface, or piercing it, has a number of potential practical applications, such as offshore structures, underwater vessels, buoys, submarines and especially power generation equipment using wave and tidal energy. Most floating ocean structures for offshore petroleum drilling and production operations also consist of submerged and semi-submerged structures. Despite such practical applications, the flow past a sphere close to a free surface, and also piercing it, is not well understood. Many studies have reported on the two-dimensional counterpart, the cylinder, elaborating on the effect of a free surface on the flow past that geometry. Reichl, Hourigan & Thompson (Reference Reichl, Hourigan and Thompson2005) studied the two-dimensional flow past a cylinder close to a free surface at
 $Re=180$
. Their major finding was that for low Froude number (
 $Fr\leqslant 0.3$
), where the surface deformation is minimal, the flow is largely governed by geometric constraints and behaves similarly to the flow past a cylinder close to a no-slip wall. However, for higher Froude numbers, where surface deformation becomes substantial, there is significant surface vorticity generation that can diffuse or convect into the main flow, altering the development of vortex shedding. The flow in such cases is characterised by two metastable states, which can coexist for the same system parameters. Such metastable states were previously observed in the experimental investigations by Sheridan, Lin & Rockwell (Reference Sheridan, Lin and Rockwell1995) and Sheridan, Lin & Rockwell (Reference Sheridan, Lin and Rockwell1997). The latter authors investigated experimentally the flow past a cylinder close to a free surface over the Froude number range of
 $0.47\leqslant Fr\leqslant 0.72$
and Reynolds number range
 $5990\leqslant Re\leqslant 9120$
. They reported that the flow past a cylinder close to a free surface at high Froude number gives rise to fundamental classes of near-wake structures that are distinctly different from the wake of a completely submerged cylinder located far beneath the free surface. Considering the limiting case of a piercing cylinder, Yu, Avital & Williams (Reference Yu, Avital and Williams2008) studied the flow past a cylinder piercing the free surface numerically for
 $Re=1\times 10^{5}$
at Froude numbers up to
 $Fr=3$
. Their results showed that the free surface inhibits the vortex generation in the near wake, leading to reduced vorticity and vortex shedding. For
 $Fr=0.8$
, the vortex structures exhibited strong three-dimensional (3-D) features; however, the flow in the deep wake remained two-dimensional. Furthermore, at
 $Fr=2$
, the free-surface effect propagated throughout the wake, inhibiting regular vortex shedding past the cylinder. Similar results were observed numerically by Inoue, Baba & Himeno (Reference Inoue, Baba and Himeno1993) and Kawamura et al. (Reference Kawamura, Mayer, Garapon and Sorensen2002) for a piercing cylinder. The latter study reported a diverging Kelvin wave system at the free surface and observed surface fluctuations related to the shear-layer instabilities under the free surface. From all these studies, it can be inferred for a cylinder that the free surface acts like a rigid free-slip boundary for low Froude numbers of
 $Fr\leqslant 0.5$
. For
 $0.8\leqslant Fr<2$
, the free surface influences the shedding near the free surface, leading to 3-D features very close to the free surface; however, for very high Froude numbers of
 $Fr\geqslant 2$
, the free surface was significantly deformed; there were then strong wave–wake interactions, and the periodic vortex shedding was suppressed for cylinder depths less than one diameter from the free surface.
Although the above-mentioned studies focused on fixed cylinders, significant attenuation and alteration of the vortex shedding can be expected for an elastically mounted cylinder. A very recent study by de Oliveira Barbosa et al. (Reference de Oliveira Barbosa, Qu, Metrikine and Lourens2017) reported the effect of proximity to a solid wall boundary on the vortex-induced vibration (VIV) response of a freely vibrating cylinder. They observed a reduction in the amplitude response for gaps between 0.75 and 2 diameters and an increase in the amplitude and frequency of oscillations for gaps smaller than 0.75 diameters, when the cylinder actually impacted the boundary.
Unlike the situation for circular cylinder VIV, there are relatively few previous studies on VIV of even a fully submerged tethered sphere (Govardhan & Williamson Reference Govardhan and Williamson1997; Williamson & Govardhan Reference Williamson and Govardhan1997; Jauvtis, Govardhan & Williamson Reference Jauvtis, Govardhan and Williamson2001; Pregnalato Reference Pregnalato2003; Govardhan & Williamson Reference Govardhan and Williamson2005; van Hout, Krakovich & Gottlieb Reference van Hout, Krakovich and Gottlieb2010; Behara, Borazjani & Sotiropoulos Reference Behara, Borazjani and Sotiropoulos2011; Krakovich, Eshbal & van Hout Reference Krakovich, Eshbal and van Hout2013; Lee, Hourigan & Thompson Reference Lee, Hourigan and Thompson2013; Behara & Sotiropoulos Reference Behara and Sotiropoulos2016). Williamson & Govardhan (Reference Williamson and Govardhan1997), Govardhan & Williamson (Reference Govardhan and Williamson1997) and Jauvtis et al. (Reference Jauvtis, Govardhan and Williamson2001) reported the existence of multiple modes of vibrations in a free stream, namely modes I, II and III. Modes I and II, which occur over a reduced velocity range of
 $U^{\ast }\sim 5{-}10$
, are the fundamental modes of vibrations that are associated with the lock-in of the vortex-shedding frequency with the system natural frequency, similar to the 2S and 2P modes for an excited circular cylinder. Mode III occurs over a wide range at higher reduced velocities
 $U^{\ast }\sim 20{-}40$
, where the vortex-shedding frequency is much higher than the vibration frequency. This state leads to remarkably regular vibrations with a vibration period corresponding to three to eight vortex-shedding periods. This robust mode does not have any apparent counterpart in VIV of a circular cylinder. This was later categorised as a ‘movement-induced vibration’ by Govardhan & Williamson (Reference Govardhan and Williamson2005). Van Hout et al. (Reference van Hout, Krakovich and Gottlieb2010) and Lee et al. (Reference Lee, Hourigan and Thompson2013) also observed several regimes of vibrations for a heavy tethered sphere and a neutrally buoyant tethered sphere, respectively. The former reported a response region III, which was linked to the mode III state reported by Jauvtis et al. (Reference Jauvtis, Govardhan and Williamson2001), and the latter reported a chaotic regime VI, which was linked to mode IV reported by Jauvtis et al. (Reference Jauvtis, Govardhan and Williamson2001). Both these studies reported these modes to exhibit non-stationary chaotic dynamics, where large variation in amplitude is observed. This was also reported by an extensive experimental study by Sareen et al. (Reference Sareen, Zhao, Lo Jacono, Sheridan, Hourigan and Thompson2018).
All the above-mentioned studies focused on a fully submerged sphere located well away from a boundary. However, when a sphere is elastically mounted close to a free surface, the dynamics could be very different. There is a very brief preliminary study by Mirauda, Plantamura & Malavasi (Reference Mirauda, Plantamura and Malavasi2014) on the dynamic response of a light (
 $m^{\ast }=1.34$
, where
 $m^{\ast }=\text{total oscillating mass }(\text{m})/$
mass of the displaced fluid
 $(m_{d})$
) tethered sphere in a shallow water flow. Although their study lacked any forces or vorticity measurements to support their claims, they indicated a reduction in the vibration response amplitude with the presence of a free surface. However, the main limitation of the study was that there were large variations in the blockage ratio with the immersion depth in their experimental set-up. Also, there were appreciable wall effects, as the sphere was placed close to the channel floor (3 mm from the channel wall), which were neglected. There appears to be no study so far investigating the VIV response of a semi-submerged sphere that pierces the free surface. It is still unknown if the case of a semi-submerged sphere, which is quite ubiquitous in ocean engineering, oscillates more vigorously than a fully submerged sphere or if the vibrations are greatly reduced due to the free surface. These questions remain unanswered. The current study systematically documents the effect on the VIV response of a free surface, for fully and semi-submerged spheres.
For these experiments, the sphere is elastically mounted in the transverse direction to the oncoming flow, where the principal VIV vibrations are observed. The VIV response is investigated experimentally over a wide range of reduced velocities and submergence depths, employing comprehensive displacement, force and vorticity measurements. To further understand the flow dynamics, various flow visualisation techniques are also employed.
In the present study, the following questions are addressed. Does the proximity to the free surface attenuate the vibrations of a sphere? What happens to the different modes of vibrations? Does the proximity to the free surface change the wake structure of the sphere? What happens in the limiting case of a piercing sphere? Does it still vibrate with analogues of the characteristic modes seen for fully submerged spheres?
The experimental method used in the current study is detailed in § 2, and a validation study based on VIV of a non-rotating oscillating sphere is given in § 3. In § 4, the effect of a free surface on the VIV response of a fully submerged sphere is discussed. Following this, § 5 focuses on the VIV response of a semi-submerged sphere piercing the free surface, § 6 focuses on the effect of the support rod. In § 7, the vorticity measurements are presented and discussed, supported by flow visualisations. Finally § 8 draws together conclusions, summarising important findings and the significance of the current study.
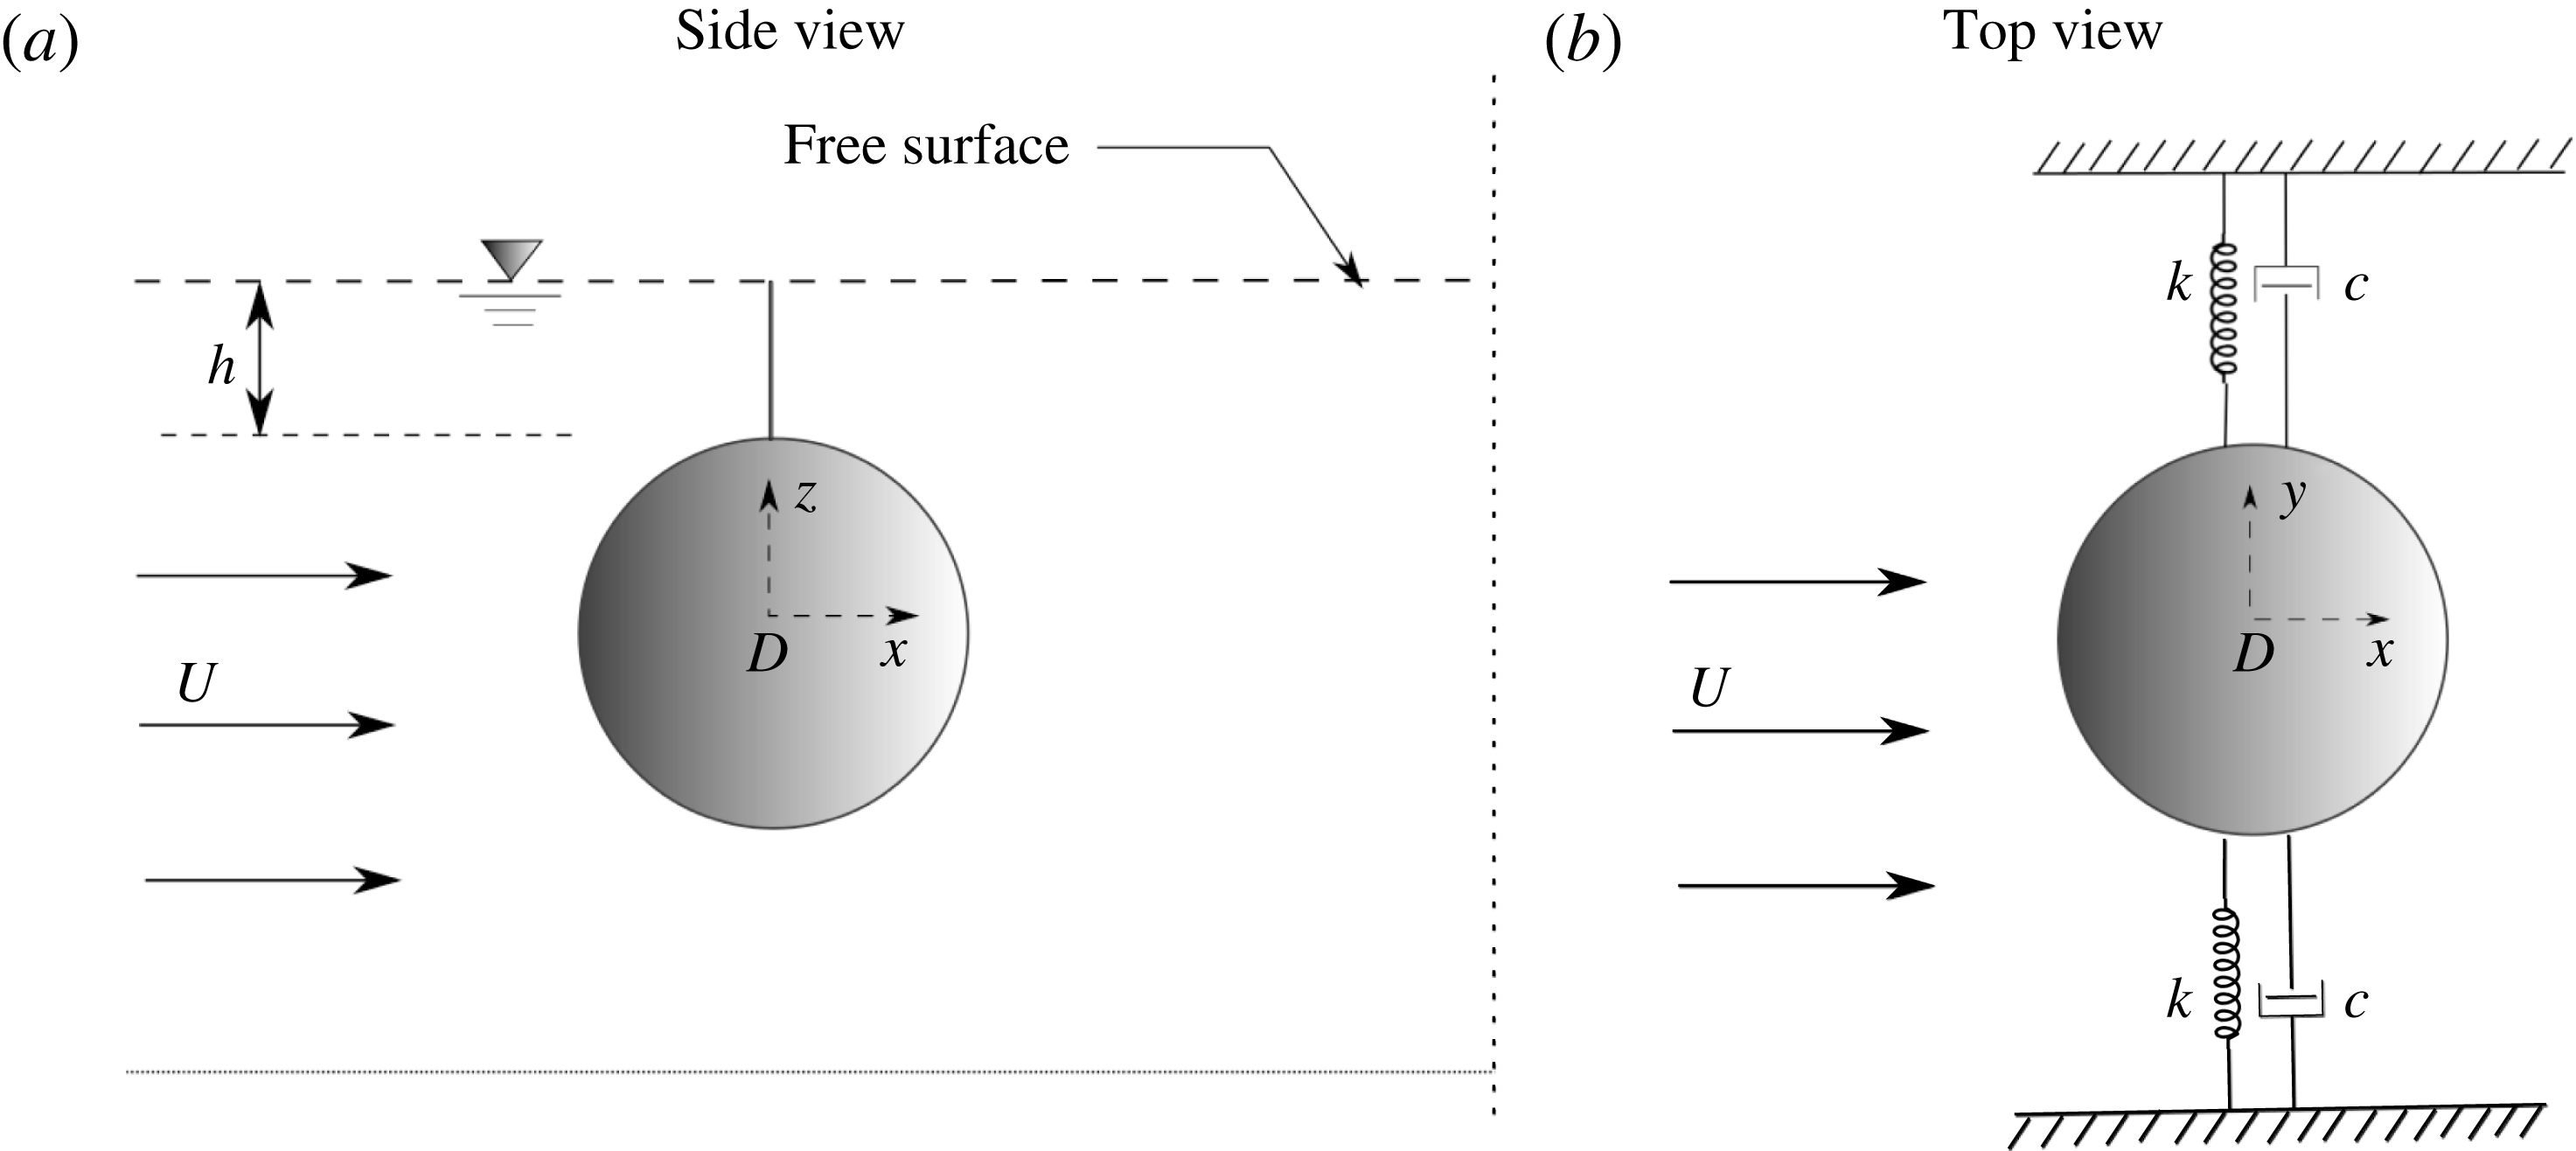
Schematic showing an overview of the experimental arrangement and definition of the geometric and flow parameters: (a) side view and (b) top view. Here,
 $D$
is the sphere diameter,
 $U$
is the free-stream velocity,
 $k$
is the spring constant of the system and
 $c$
is the structural damping;
 $h$
is the distance measured from the top of the sphere to the free surface.

2 Experimental details
2.1 Fluid–structure system
Figure 1 presents a brief schematic of the current fluid–structure interaction problem showing an overview of the experimental arrangement together with definitions of the important geometric and flow parameters. The sphere is elastically mounted in the direction transverse to the oncoming flow. The distance from the free surface is varied in terms of the parameter
 $h^{\ast }=h/D$
– the immersion ratio – where
 $h$
is the distance measured from the top of the sphere surface to the undisturbed free surface directly above and
 $D$
is the sphere diameter.
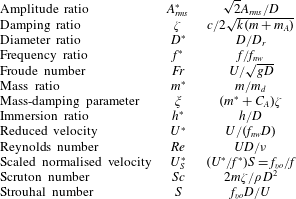
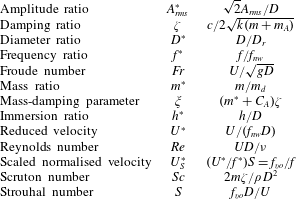
Table 1 shows the set of non-dimensional parameters relevant for the current study. In problems involving flow-induced vibrations (FIV) of bluff bodies, the response dynamics of the system is often characterised by the normalised vibration amplitude (
 $A^{\ast }$
) and frequency response (
 $f^{\ast }$
) versus reduced velocity. In the current study, the normalised amplitude response is defined as
 $A^{\ast }=\sqrt{2}A_{rms}/D$
, where
 $A_{rms}$
is the root mean square (r.m.s.) of the oscillation amplitude of the body. The reduced velocity is defined as
 $U^{\ast }=U/f_{nw}D$
, where
 $U$
is the free-stream velocity and
 $f_{nw}$
is the natural frequency of the system in quiescent water. Another important parameter in the current fluid–structure system is the mass ratio defined as
 $m^{\ast }=m/m_{d}$
, where
 $m$
is the total oscillating mass of the system, and
 $m_{d}$
is the displaced fluid mass (
 $m_{d}=\unicode[STIX]{x1D70C}\unicode[STIX]{x03C0}D^{3}/6$
with
 $\unicode[STIX]{x1D70C}$
being the fluid density).
The governing equation for motion characterising cross-flow VIV of a sphere can be written as
 $$\begin{eqnarray}m\ddot{y} +c{\dot{y}}+ky=F_{y},\end{eqnarray}$$
where
 $F_{y}$
represents fluid force in the transverse direction,
 $m$
is the total oscillating mass of the system,
 $c$
is the structural damping of the system,
 $k$
is the spring constant and
 $y$
is the displacement in the transverse direction. Using the above equation, the fluid force acting on the sphere can be calculated from the directly measured displacement, and its time derivatives.
Non-dimensional parameters used in this study. In the above parameters,
 $A_{rms}$
is defined as the root mean square of the structural vibration amplitude in the
 $y$
direction.
 $D$
is sphere diameter;
 $D_{r}$
is the support-rod diameter,
 $f$
is the body oscillation frequency and
 $f_{nw}$
is the natural frequency of the system in quiescent water;
 $m$
is the total oscillating mass,
 $c$
is the structural-damping factor and
 $k$
is the spring constant;
 $U$
is the free-stream velocity, and
 $\unicode[STIX]{x1D708}$
is the kinematic viscosity;
 $m_{A}$
denotes the added mass, defined by
 $m_{A}=C_{A}m_{d}$
, where
 $m_{d}$
is the mass of the displaced fluid and
 $C_{A}$
is the added-mass coefficient (0.5 for a sphere);
 $f_{vo}$
is the vortex-shedding frequency of a fixed body.
As a first approximation, it is often assumed that
 $y(t)$
and
 $F_{y}(t)$
are both approximately sinusoidal and can be represented by
 $$\begin{eqnarray}\displaystyle & \displaystyle y(t)=A\sin (2\unicode[STIX]{x03C0}ft), & \displaystyle\end{eqnarray}$$
 $$\begin{eqnarray}\displaystyle & \displaystyle F_{y}(t)=F_{o}\sin (2\unicode[STIX]{x03C0}ft+\unicode[STIX]{x1D719}), & \displaystyle\end{eqnarray}$$
where
 $A$
is the displacement amplitude,
 $F_{o}$
is the amplitude of
 $F_{y}$
and
 $\unicode[STIX]{x1D719}$
is the phase between the fluid force and the body displacement.
As done for VIV of spheres and cylinders by Govardhan & Williamson (Reference Govardhan and Williamson2000), the total transverse fluid force (
 $F_{y}$
) can be split into a potential force
 $F_{potential}$
(comprising the potential added-mass force) and a vortex force
 $F_{vortex}$
that is due to the vorticity dynamics. From potential theory, the instantaneous
 $F_{potential}$
acting on the sphere can be expressed as
 $$\begin{eqnarray}F_{potential}(t)=-C_{A}m_{d}\ddot{y} (t),\end{eqnarray}$$
with
 $C_{A}$
the potential added-mass coefficient (
 $C_{A}=0.5$
for a sphere). Thus, the vortex force
 $F_{vortex}$
can be computed from
 $$\begin{eqnarray}F_{vortex}=F_{y}-F_{potential}.\end{eqnarray}$$
The vortex phase is the phase difference between the vortex force and the body displacement and the total phase
 $\unicode[STIX]{x1D719}_{total}$
is the phase difference between the total force and the body displacement. In general, phase jumps are associated with a switch from one VIV mode to another, and have even been used to distinguish between different modes (Govardhan & Williamson Reference Govardhan and Williamson2005). The instantaneous relative phases between the two forces are calculated using the Hilbert transform (e.g. see Khalak & Williamson Reference Khalak and Williamson1999). For the piercing sphere cases, the potential force is calculated considering the fraction of the sphere that is submerged and assuming that the added-mass coefficient remains the same.
2.2 Experimental details
The experiments were conducted in the recirculating free-surface water channel of the Fluids Laboratory for Aeronautical and Industrial Research (FLAIR), Monash University, Australia. The test section of the water channel has dimensions of
 $600~\text{mm}$
in width,
 $800~\text{mm}$
in depth and
 $4000~\text{mm}$
in length. The free-stream velocity in the present experiments could be varied continuously over the range
 $0.05\leqslant U\leqslant 0.45~\text{ms}^{-1}$
. The free-stream turbulence level was less than 1 % in the current experiments.
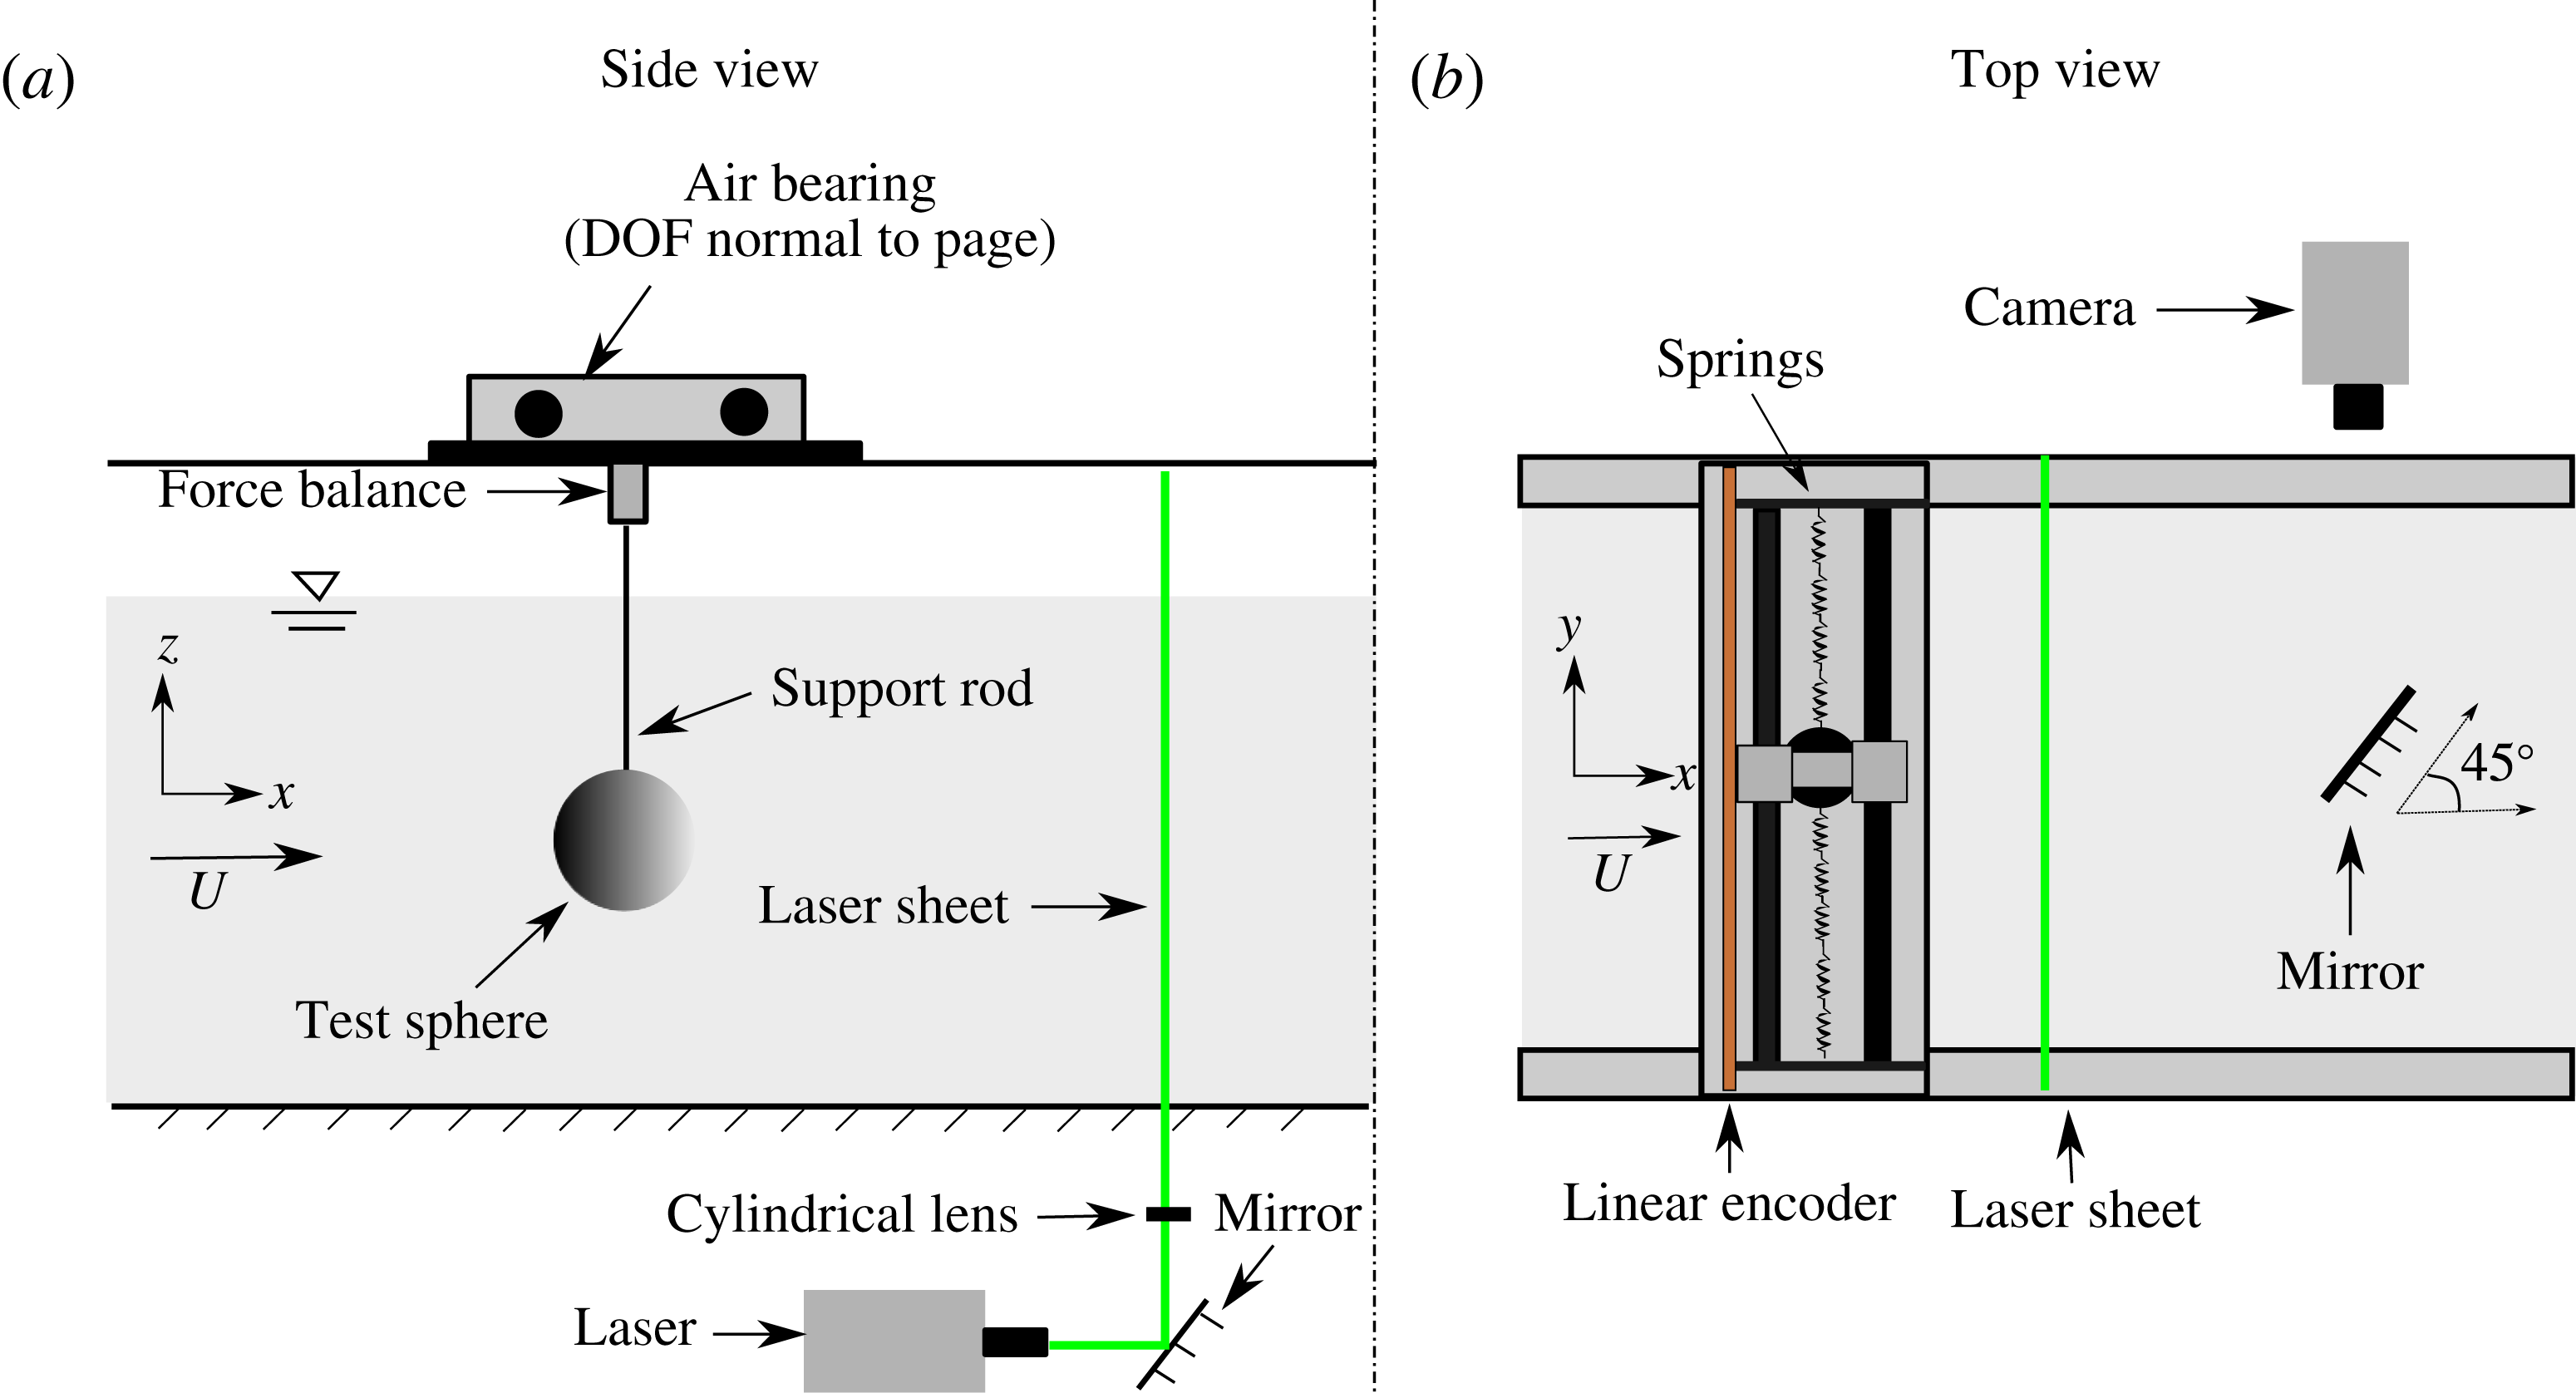
The current hydro-elastic problem was modelled using a low-friction air-bearing system that provided a very low structural damping and almost frictionless motion of the sphere in the transverse direction to the oncoming flow. The structural stiffness was controlled by extension springs that were attached to both sides of a slider carriage. Further details of the hydro-elastic facility can be found in Zhao et al. (Reference Zhao, Leontini, Lo Jacono and Sheridan2014a ,Reference Zhao, Leontini, Lo Jacono and Sheridan b ).
Experimental schematic (not to scale) showing an overview of the experimental arrangement.

A detailed schematic of the experimental set-up is presented in figure 2, showing important components of the set-up. The sphere models used in the present study were solid spherical balls precision-machined from acrylic plastic with a very smooth surface finish. The accuracy of the diameter was within
 $\pm 200~\unicode[STIX]{x03BC}\text{m}$
. Different spheres with sizes of
 $D=40~\text{mm}$
,
 $D=80~\text{mm}$
and
 $120~\text{mm}$
were used in the current experiments. The spherical models were supported using a thin cylindrical support rod
 $3~\text{mm}$
in diameter, manufactured from hardened nitrided stainless steel for extra stiffness and to maintain straightness.
The body displacement was measured using a linear encoder (model: RGH24, Renishaw, UK) with a resolution of
 $1~\unicode[STIX]{x03BC}\text{m}$
. Since the linear encoder was digital, electromagnetic noise did not affect the accuracy of the displacement signal measurement. This provided highly accurate displacement signals and allowed reliable velocity and acceleration signals to be derived. This enabled an accurate determination of the lift force signal to be derived from the displacement signal using (2.1). In the experimental study by Sareen et al. (Reference Sareen, Zhao, Lo Jacono, Sheridan, Hourigan and Thompson2018), the process was tested through a direct comparison against the lift force determined by a force sensor over a wide range of
 $U^{\ast }$
. It was found that the lift force derived from the linear encoder displacement signal matched well with that measured using the force sensor, except that they were generally smoother, indicating accurate measurements of the displacement and the lift force. Zhao et al. (Reference Zhao, Leontini, Lo Jacono and Sheridan2014b
) also reported such a comparison. Hence, all the force coefficients reported in the current study are derived from the measured displacement signal. It should be noted that the lift force obtained using the force sensor includes the inertial force associated with the acceleration of the mass below the force sensor (e.g. see Zhao et al. (Reference Zhao, Leontini, Lo Jacono and Sheridan2014b
) and Sareen et al. (Reference Sareen, Zhao, Lo Jacono, Sheridan, Hourigan and Thompson2018)). That term, which is derived by calculating the acceleration from the displacement signal, needs to be subtracted from the measured force to give the lift force. Hence the force sensor by itself does not enable the lift force to be measured directly. Also, the force measurements from the force sensor suffered from a greater degree of noise, presumably from electromagnetic sources; hence, the preference for the force derived from the displacement signal. Note here that this approach is appropriate only because highly accurate digital displacement measurements are possible with the current displacement encoder. Of course, one requires accurate measurements of the relevant parameters of the spring–mass system (total oscillating mass, spring constant and the structural damping).
The data acquisition and the controls of the flow velocity were automated via customised LabVIEW programs. For each data set, the displacement signal was acquired at a sampling frequency of
 $100~\text{Hz}$
for at least 100 vibration cycles.
The natural frequencies and structural damping of the system in both air and water were measured by conducting free decay tests individually in air and in quiescent water. Most of the experiments reported in this paper were performed for a mass ratio of
 $m^{\ast }=7.8$
. The structural damping ratio with consideration of the added mass was determined to be
 $\unicode[STIX]{x1D701}=2.04\times 10^{-3}$
. The Scruton number
 $Sc$
(mass-damping parameter) for the current study was 0.00134.
To gain insight into the flow dynamics, velocity field measurements using particle image velocimetry (PIV) were undertaken in the cross-plane, 1.5 diameters downstream of the sphere. For this purpose, the flow was seeded with
 $13~\unicode[STIX]{x03BC}\text{m}$
hollow micro-spheres having a specific weight of
 $1.1~\text{g}~\text{m}^{-3}$
. A laser sheet of
 ${\sim}3~\text{mm}$
thickness from a continuous laser (model: MLL-N-532-5W, CNI, China), aligned parallel to the
 $y$
–
 $z$
plane, was employed to illuminate the laser plane. A mirror was placed at
 $45^{\circ }$
angle to the free-stream direction towards the downstream side of the sphere. The mirror was placed more than six diameters away from the sphere. Imaging was performed using a high-speed camera (model: Dimax S4, PCO, AG) with a resolution of
 $2016\times 2016~\text{pixels}^{2}$
. This camera was equipped with a
 $105~\text{mm}$
Nikon lens, giving a magnification of approximately
 $11.34~\text{pixel}~\text{mm}^{-1}$
for the field of view. Velocity fields were deduced using in-house PIV software developed originally by Fouras, Lo Jacono & Hourigan (Reference Fouras, Lo Jacono and Hourigan2008), using
 $32\times 32~\text{pixel}^{2}$
interrogation windows in a grid layout with
 $50\,\%$
window overlap. All the vorticity fields shown in the current study were phase-averaged over more than 100 cycles. For each PIV measurement case, a set of
 $3100$
image pairs were sampled at
 $10~\text{Hz}$
. Each image set was sorted into
 $24$
phase bins based on the sphere’s displacement and velocity, resulting in more than
 $120$
image pairs for averaging at each phase.
In the present study, the VIV response was studied over a wide reduced velocity range of
 $3\leqslant U^{\ast }\leqslant 20$
. The immersion ratio was varied over a range of
 $0\leqslant h^{\ast }\leqslant 1$
for the first set of experiments, and
 $-0.062\leqslant h^{\ast }\leqslant -0.750$
for the next set of experiments with the piercing sphere. The Reynolds number for the current study varied between
 $5000$
and
 $30\,000$
.
3 VIV response of a fully submerged sphere: validation experiments
In this section, the VIV response of a fully submerged sphere is presented. For this set of experiments, the spherical model was 80 mm in diameter supported with a cylindrical support rod 3 mm in diameter. The immersed length of the support rod was one diameter (80 mm). The free decay tests were conducted individually in air and water to obtain the natural frequency in air,
 $f_{na}=0.2539$
, and in water,
 $f_{nw}=0.2455$
. The mass ratio was
 $m^{\ast }=7.8$
and the structural damping of the system was
 $\unicode[STIX]{x1D701}=0.002$
. The response was studied for the
 $U^{\ast }$
range of
 $3\leqslant U^{\ast }\leqslant 20$
, corresponding to a Reynolds number range of approximately
 $5000\leqslant Re\leqslant 30\,000$
. The signal was acquired at
 $100~\text{Hz}$
for approximately 170 cycles at each data point in this set of experiments.
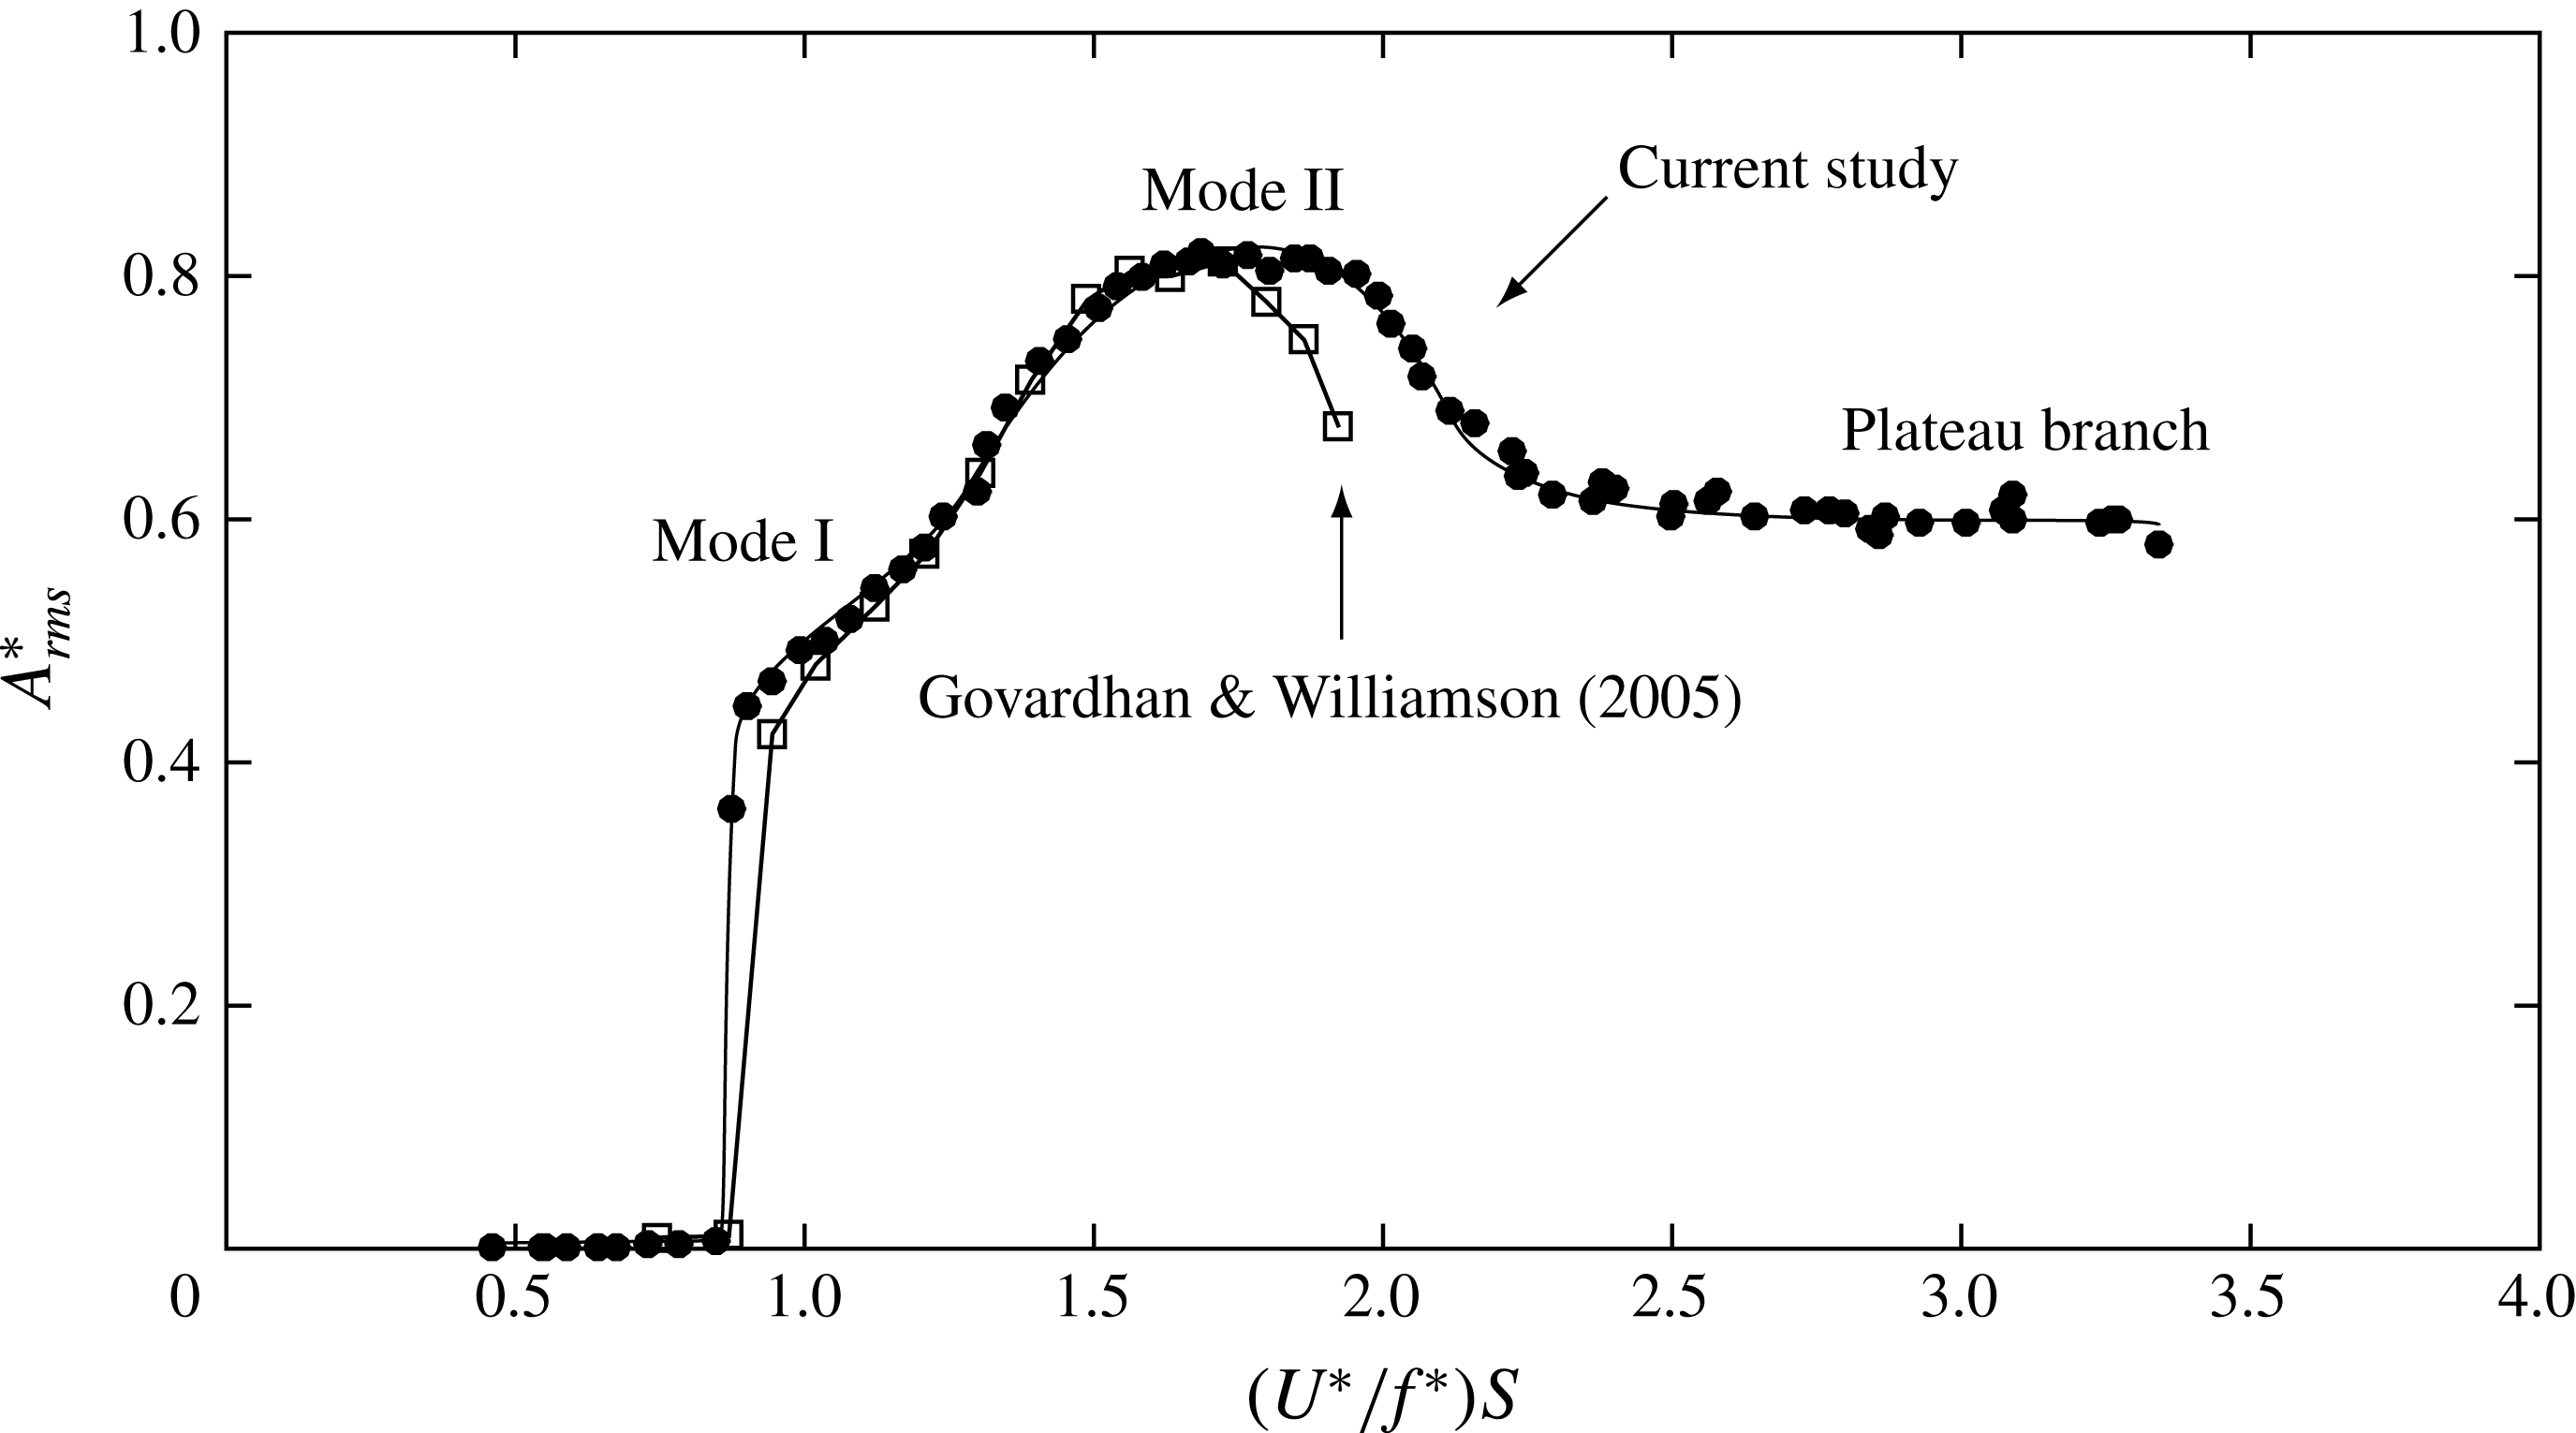
In figure 3, the results from the current study are directly compared to the results reported by Govardhan & Williamson (Reference Govardhan and Williamson2005) for a similar mass ratio of
 $m^{\ast }=7$
. The mass damping of the current study was
 $(m^{\ast }+C_{A})\unicode[STIX]{x1D701}=0.0169$
, compared to approximately 0.03 in their study. For comparison with their study here,
 $A_{rms}^{\ast }$
is plotted against the scaled
 $U_{S}^{\ast }$
, defined as
 $U_{S}^{\ast }=(U^{\ast }/f^{\ast })S\equiv f_{vo}/f$
, where
 $S$
is the Strouhal number for the vortex shedding (
 ${\approx}$
0.18 in this case).
Amplitude response of a fully submerged sphere obtained in the current study compared to that reported by Govardhan & Williamson (Reference Govardhan and Williamson2005). The mass damping in the current study is
 $(m^{\ast }+C_{A})\unicode[STIX]{x1D701}=0.0169$
, compared to approximately 0.03 in their study.

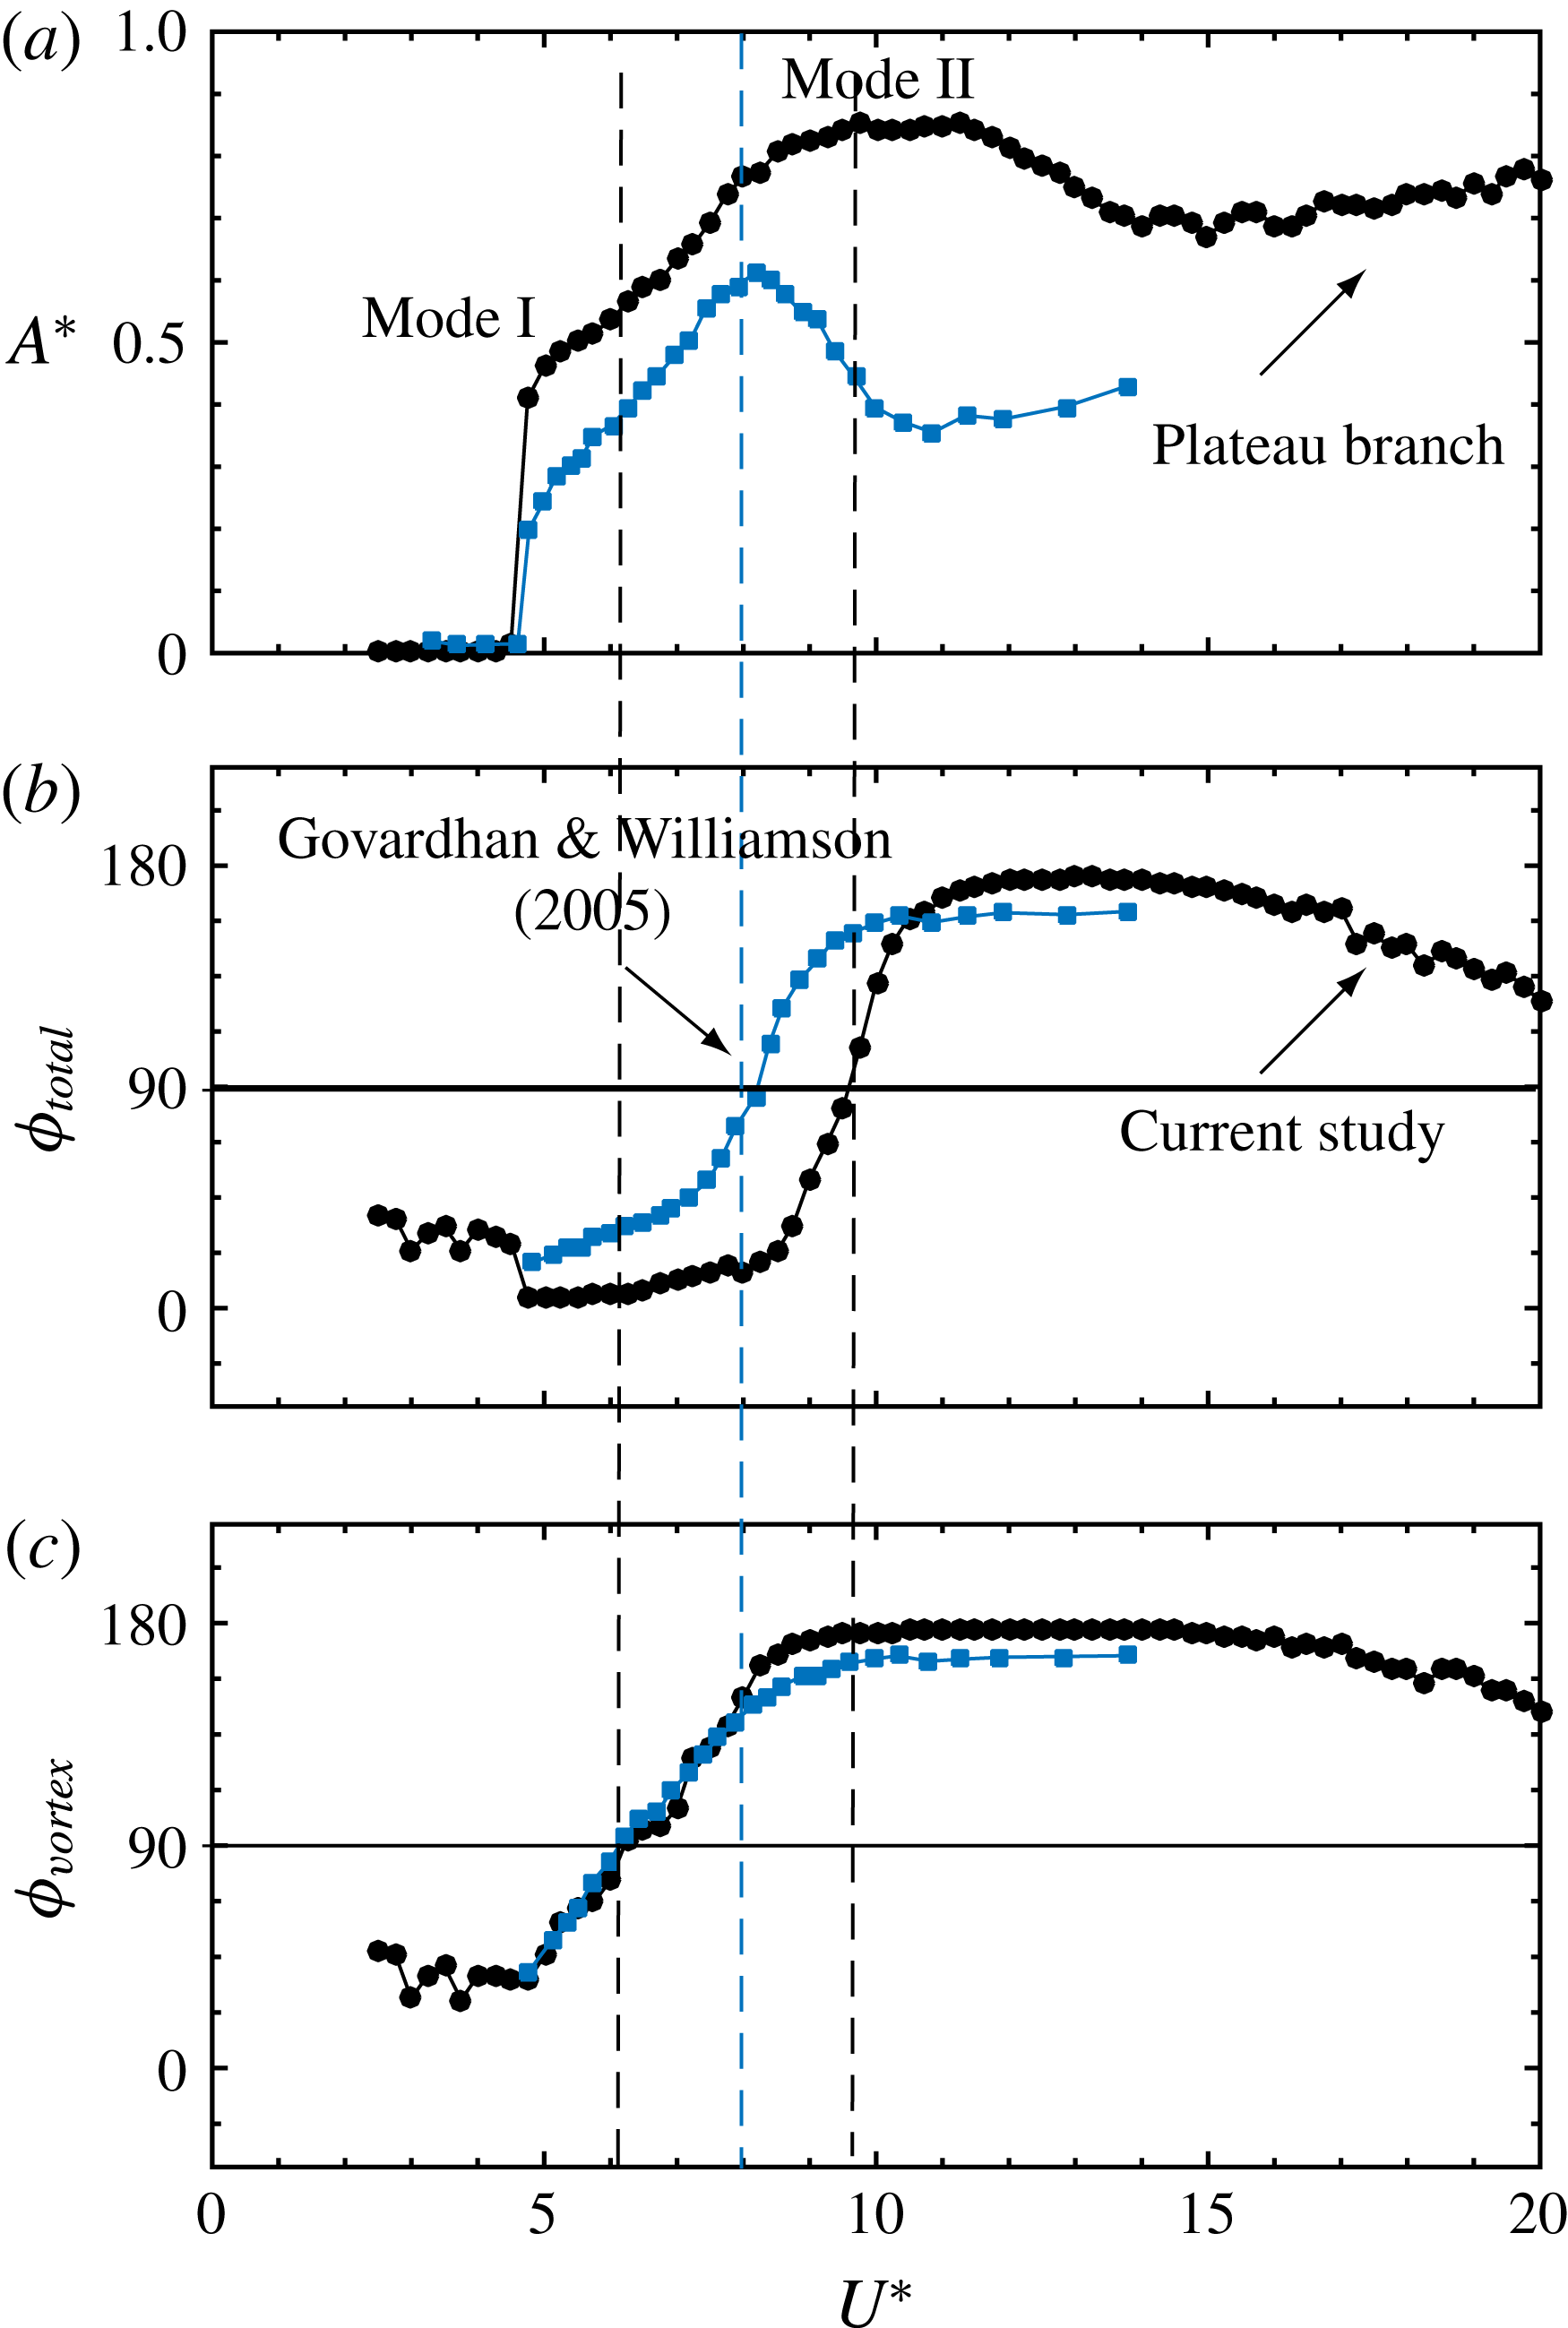
Variation of the total phase
 $\unicode[STIX]{x1D719}_{total}$
(b) and vortex phase
 $\unicode[STIX]{x1D719}_{vortex}$
(c) with
 $U^{\ast }$
, correlated with the amplitude response (a). For comparison, the variations reported by Govardhan & Williamson (Reference Govardhan and Williamson2005) are also presented (blue square symbols). The mass ratio of the current study is
 $m^{\ast }=7.8$
compared to 31.3 in their study.

As evident from the figure, the amplitude response of a sphere in the current study closely follows the trend reported by Govardhan & Williamson (Reference Govardhan and Williamson2005). The vibrations lock in at
 $U_{S}^{\ast }\approx 0.87$
, corresponding to a
 $U^{\ast }$
value of 4.5, continuously progressing from mode I to mode II and reaching a peak saturation amplitude of 0.8 in both cases. Although, in the study by Govardhan & Williamson (Reference Govardhan and Williamson2005), the response at this mass ratio is reported only until
 $U_{S}^{\ast }=2$
, the current study reveals that after the peak response in mode II, the amplitude response smoothly drops to a lower plateau that extends towards mode III as
 $U_{S}^{\ast }\rightarrow 3$
. The vibrations in the ‘plateau’ region exhibit slight differences to the highly periodic vibrations in mode II, even though the frequency of oscillation stays close to the natural frequency of the system over the entire
 $U_{S}^{\ast }$
range examined in the current study.
Unlike the case of a tethered sphere with a very low mass ratio, where the two vibration modes are distinctly separated by a desynchronised region, there is no such separation between the two modes in 1-DOF hydro-elastic VIV and with higher mass ratio in this study. The transition between the modes is continuous and gradual with
 $U^{\ast }$
, hence it is difficult to differentiate between the two modes by just looking at the amplitude response. The transition from one mode to the other is made clear through observations of the phase differences between the force and the sphere displacement signals for the two modes.
Figure 4 shows the variation of the total phase
 $\unicode[STIX]{x1D719}_{total}$
(phase difference between the sphere displacement and the total transverse force) and the vortex phase
 $\unicode[STIX]{x1D719}_{vortex}$
(phase difference between the sphere displacement and the vortex force) with
 $U^{\ast }$
, correlated with the amplitude response. The results reported by (Govardhan & Williamson Reference Govardhan and Williamson2005) for a relatively higher mass ratio of
 $m^{\ast }=31.1$
are also shown for comparison. As is evident from the figure, the response in the current study undergoes a transition from mode I to mode II when
 $\unicode[STIX]{x1D719}_{vortex}$
crosses through
 $90^{\circ }$
, corresponding to the ‘inflection point’ in the amplitude response. Likewise, within the mode II regime,
 $\unicode[STIX]{x1D719}_{total}$
passes continuously through
 $90^{\circ }$
, corresponding to the peak of the amplitude response. Similar trends in the total and the vortex phases were also observed in the data reported by (Govardhan & Williamson Reference Govardhan and Williamson2005) for a higher mass ratio of
 $m^{\ast }=31.1$
.
In the current study, with the
 $U^{\ast }$
range further extended beyond
 $U^{\ast }=14$
, a slight decrease in both the total phase,
 $\unicode[STIX]{x1D719}_{total}$
, and the vortex phase,
 $\unicode[STIX]{x1D719}_{vortex}$
, was observed as shown in the figure 4. Simultaneously a slight increase in the vibration amplitude is also evident in the figure. This corresponds to the ‘plateau branch’ mentioned above in figure 3 when
 $(U^{\ast }/f^{\ast })S\rightarrow 3$
. Jauvtis et al. (Reference Jauvtis, Govardhan and Williamson2001) reported the existence of another mode of vibration, mode III, for higher
 $U^{\ast }$
values varying from 20 to 40 for a tethered sphere of mass,
 $m^{\ast }=80$
in wind tunnel experiments. Therefore, the vibrations in the ‘plateau branch’ can be considered to be approaching the mode III response of the sphere vibrations. A careful study of the wake in this region could shed more light on the subtle differences between the modes, which is somewhat difficult and complex to unravel for three-dimensional and chaotic flows like these. As pointed out by e.g. Govardhan & Williamson (Reference Govardhan and Williamson2005), the scaled reduced velocity
 $(U^{\ast }/f^{\ast })S$
is a useful parameter to remove mass ratio effects on sphere VIV response, as it aligns the peaks of different data sets corresponding to different mass ratios. However, this scaling does not work for the current study for a sphere near or piercing a free surface, therefore, the sphere VIV response is presented as a function of
 $U^{\ast }$
instead of
 $(U^{\ast }/f^{\ast })S$
in the remainder of the article.
4 Effect of free surface on the VIV response of a fully submerged sphere
In this section, the effect of a free surface on the VIV response of a sphere is studied. The immersion ratio is sequentially varied from
 $h^{\ast }=1$
(fully submerged case) to
 $h^{\ast }=0$
(when the top of the sphere touches the free surface) in small increments. Note that a water-level controller is installed in the water channel to maintain a constant water level over time. In addition, during experiments the change in the water level was found to be less than
 ${\sim}$
1 % of the sphere diameter as the velocity was changed between the minimum and maximum values (0.05 to
 $0.45~\text{ms}^{-1}$
). Free decay tests in water were performed for each set of experiments to estimate
 $f_{nw}$
for each case. The data were acquired generally at
 $100~\text{Hz}$
for 120 cycles, and for 240 cycles in some cases, where vibrations were not very periodic.
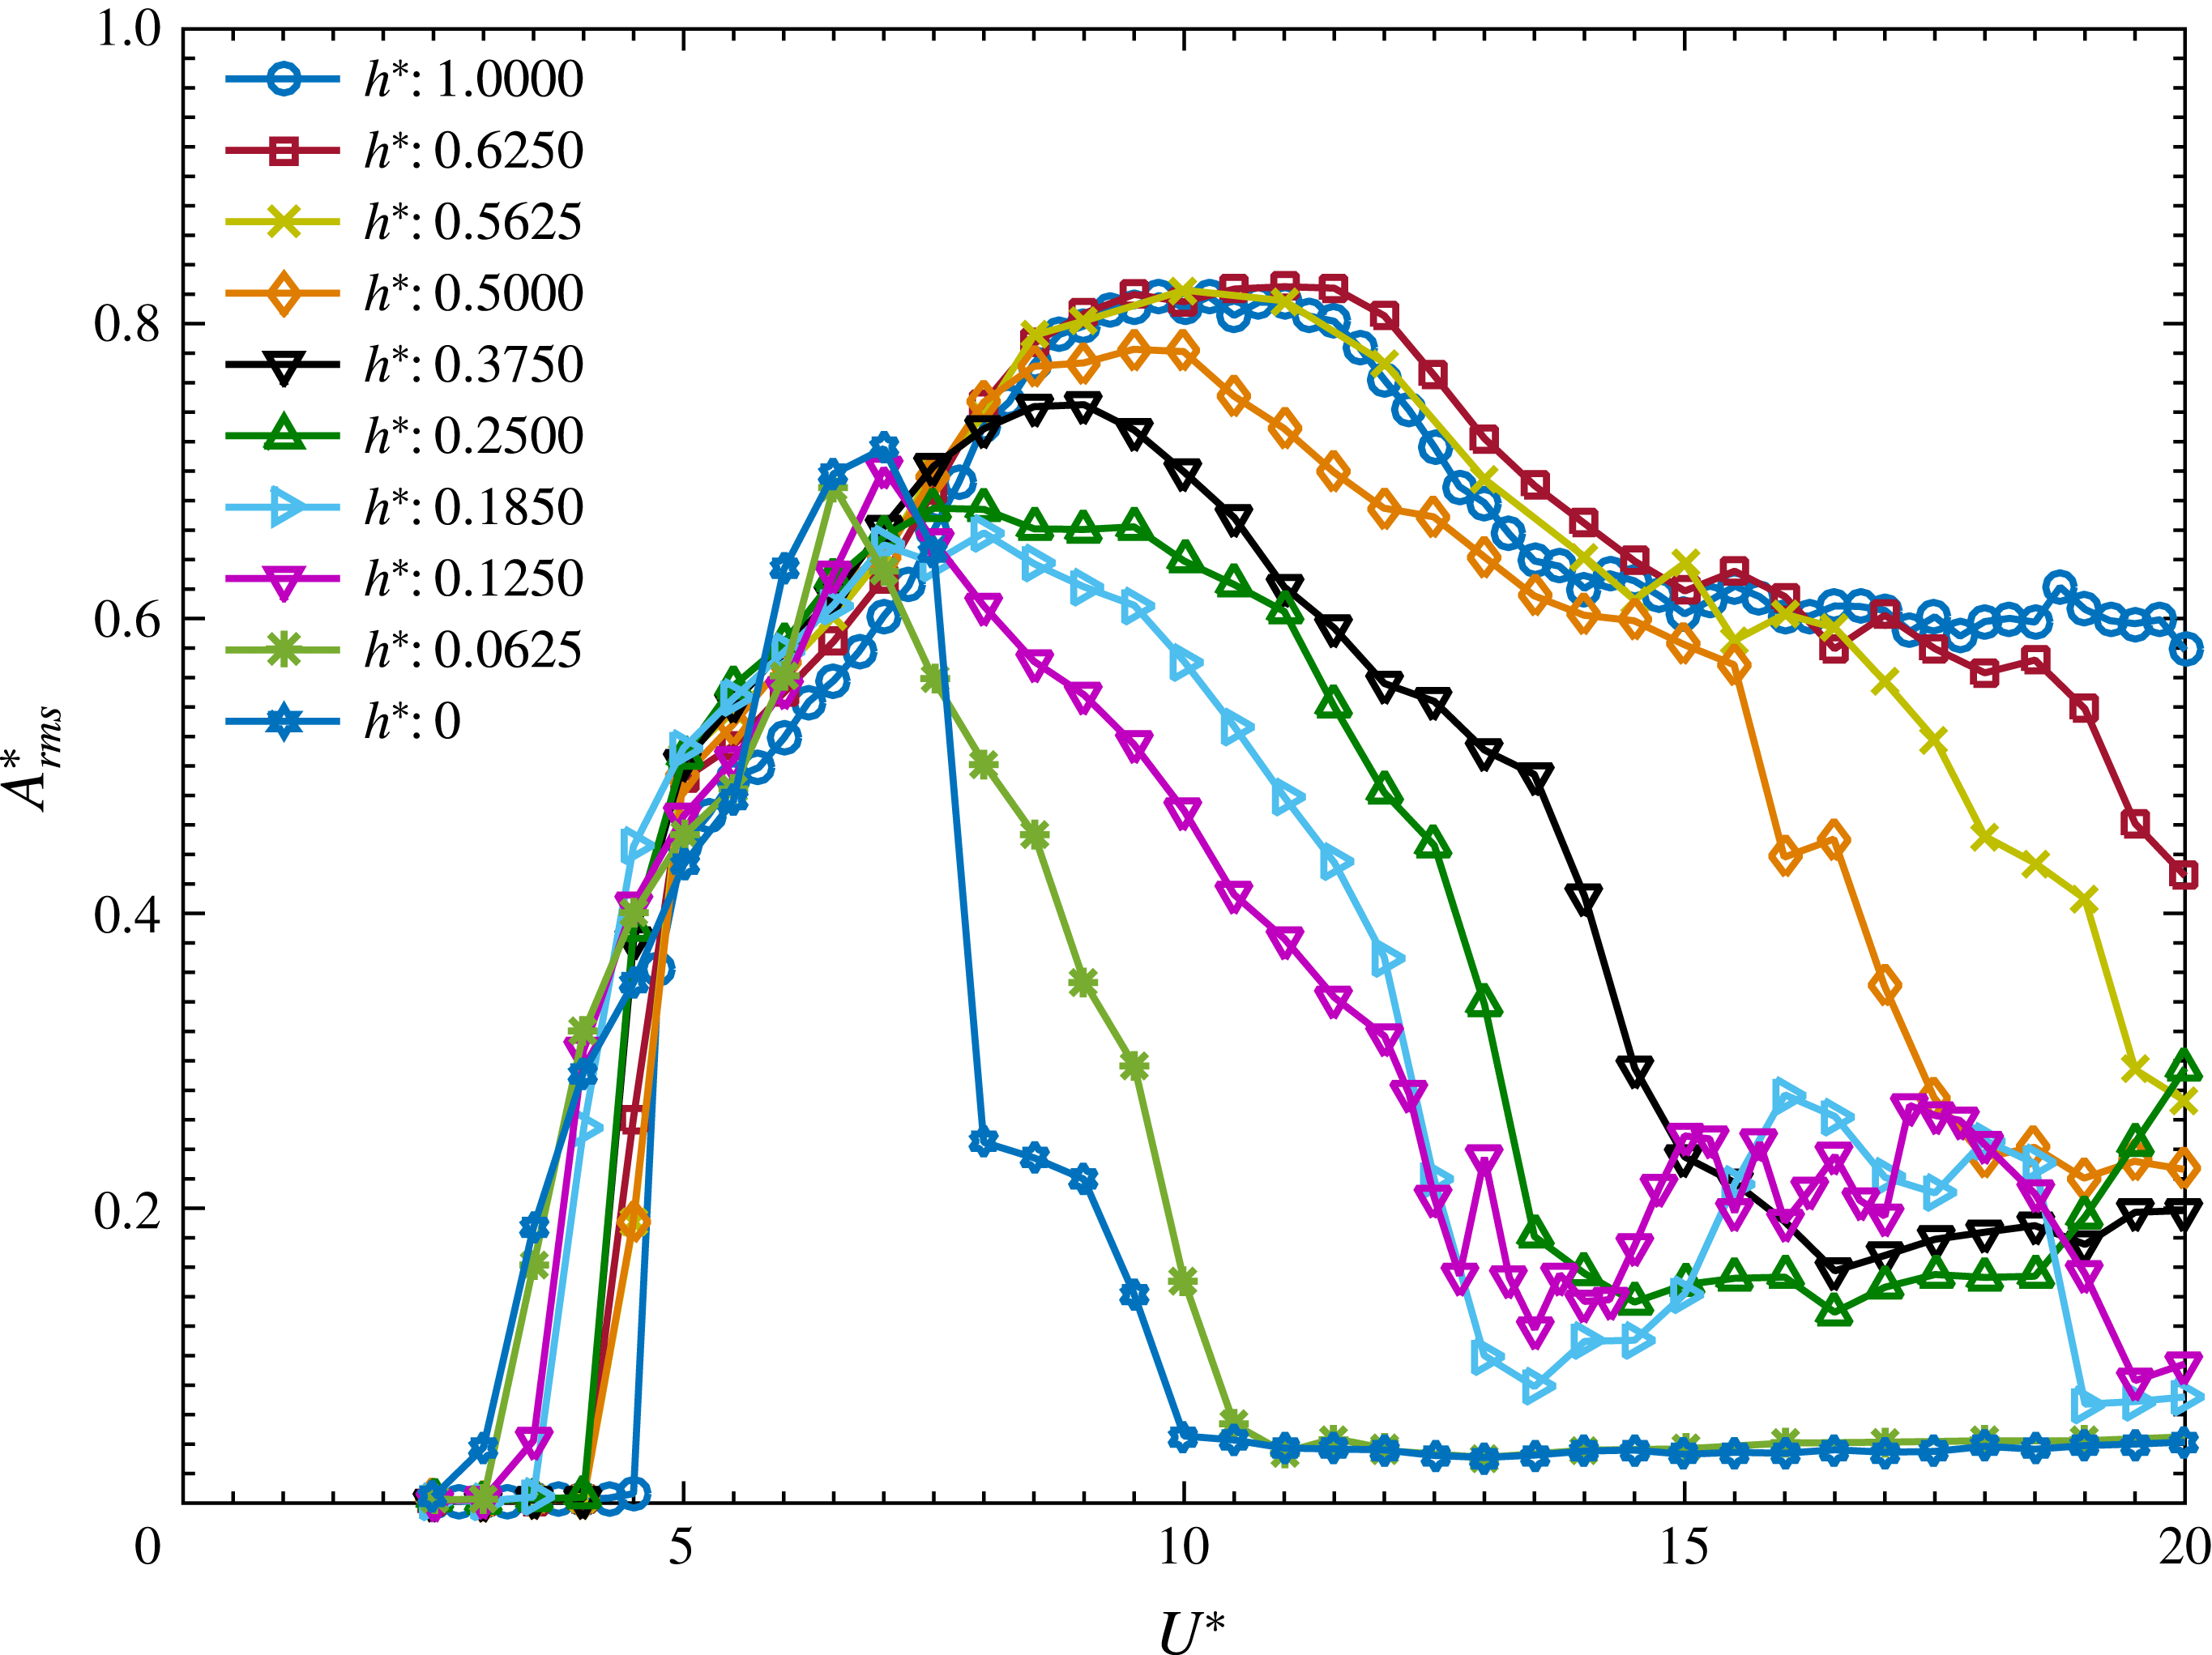
Variation of the amplitude response (
 $A_{rms}^{\ast }$
) with reduced velocity (
 $U^{\ast }$
) for various immersion ratios.

Figure 5 shows the variation of
 $A_{rms}^{\ast }$
with
 $U^{\ast }$
for various immersion ratios
 $h^{\ast }$
. For
 $h^{\ast }=1$
, the response gradually progresses from mode I to mode II, approaching the plateau branch for higher
 $U^{\ast }$
values (
 $15\leqslant U^{\ast }\leqslant 20$
), as observed previously by Govardhan & Williamson (Reference Govardhan and Williamson2005) and Sareen et al. (Reference Sareen, Zhao, Lo Jacono, Sheridan, Hourigan and Thompson2018) for relatively higher mass ratios of
 $m^{\ast }=31.1$
and
 $m^{\ast }=14.2$
, respectively. At this
 $h^{\ast }$
, the response is similar to the previously reported VIV responses, corroborating the negligible effect of the free surface at this submergence depth. However, when the immersion ratio was decreased to 0.625, the response tapers off for
 $U^{\ast }\geqslant 18$
. This drop becomes more prominent for
 $h^{\ast }\leqslant 0.5$
cases, with the reduction observed for progressively smaller
 $U^{\ast }$
values with decreasing
 $h^{\ast }$
. It is evident that the vibration response for
 $h^{\ast }\leqslant 0.625$
loses the ‘plateau branch’, which is typical of a fully submerged VIV response of a sphere. It can also be noticed from figure 5 that the vibrations lock in to the natural frequency at relatively lower
 $U^{\ast }$
values with a decrease in
 $h^{\ast }$
.
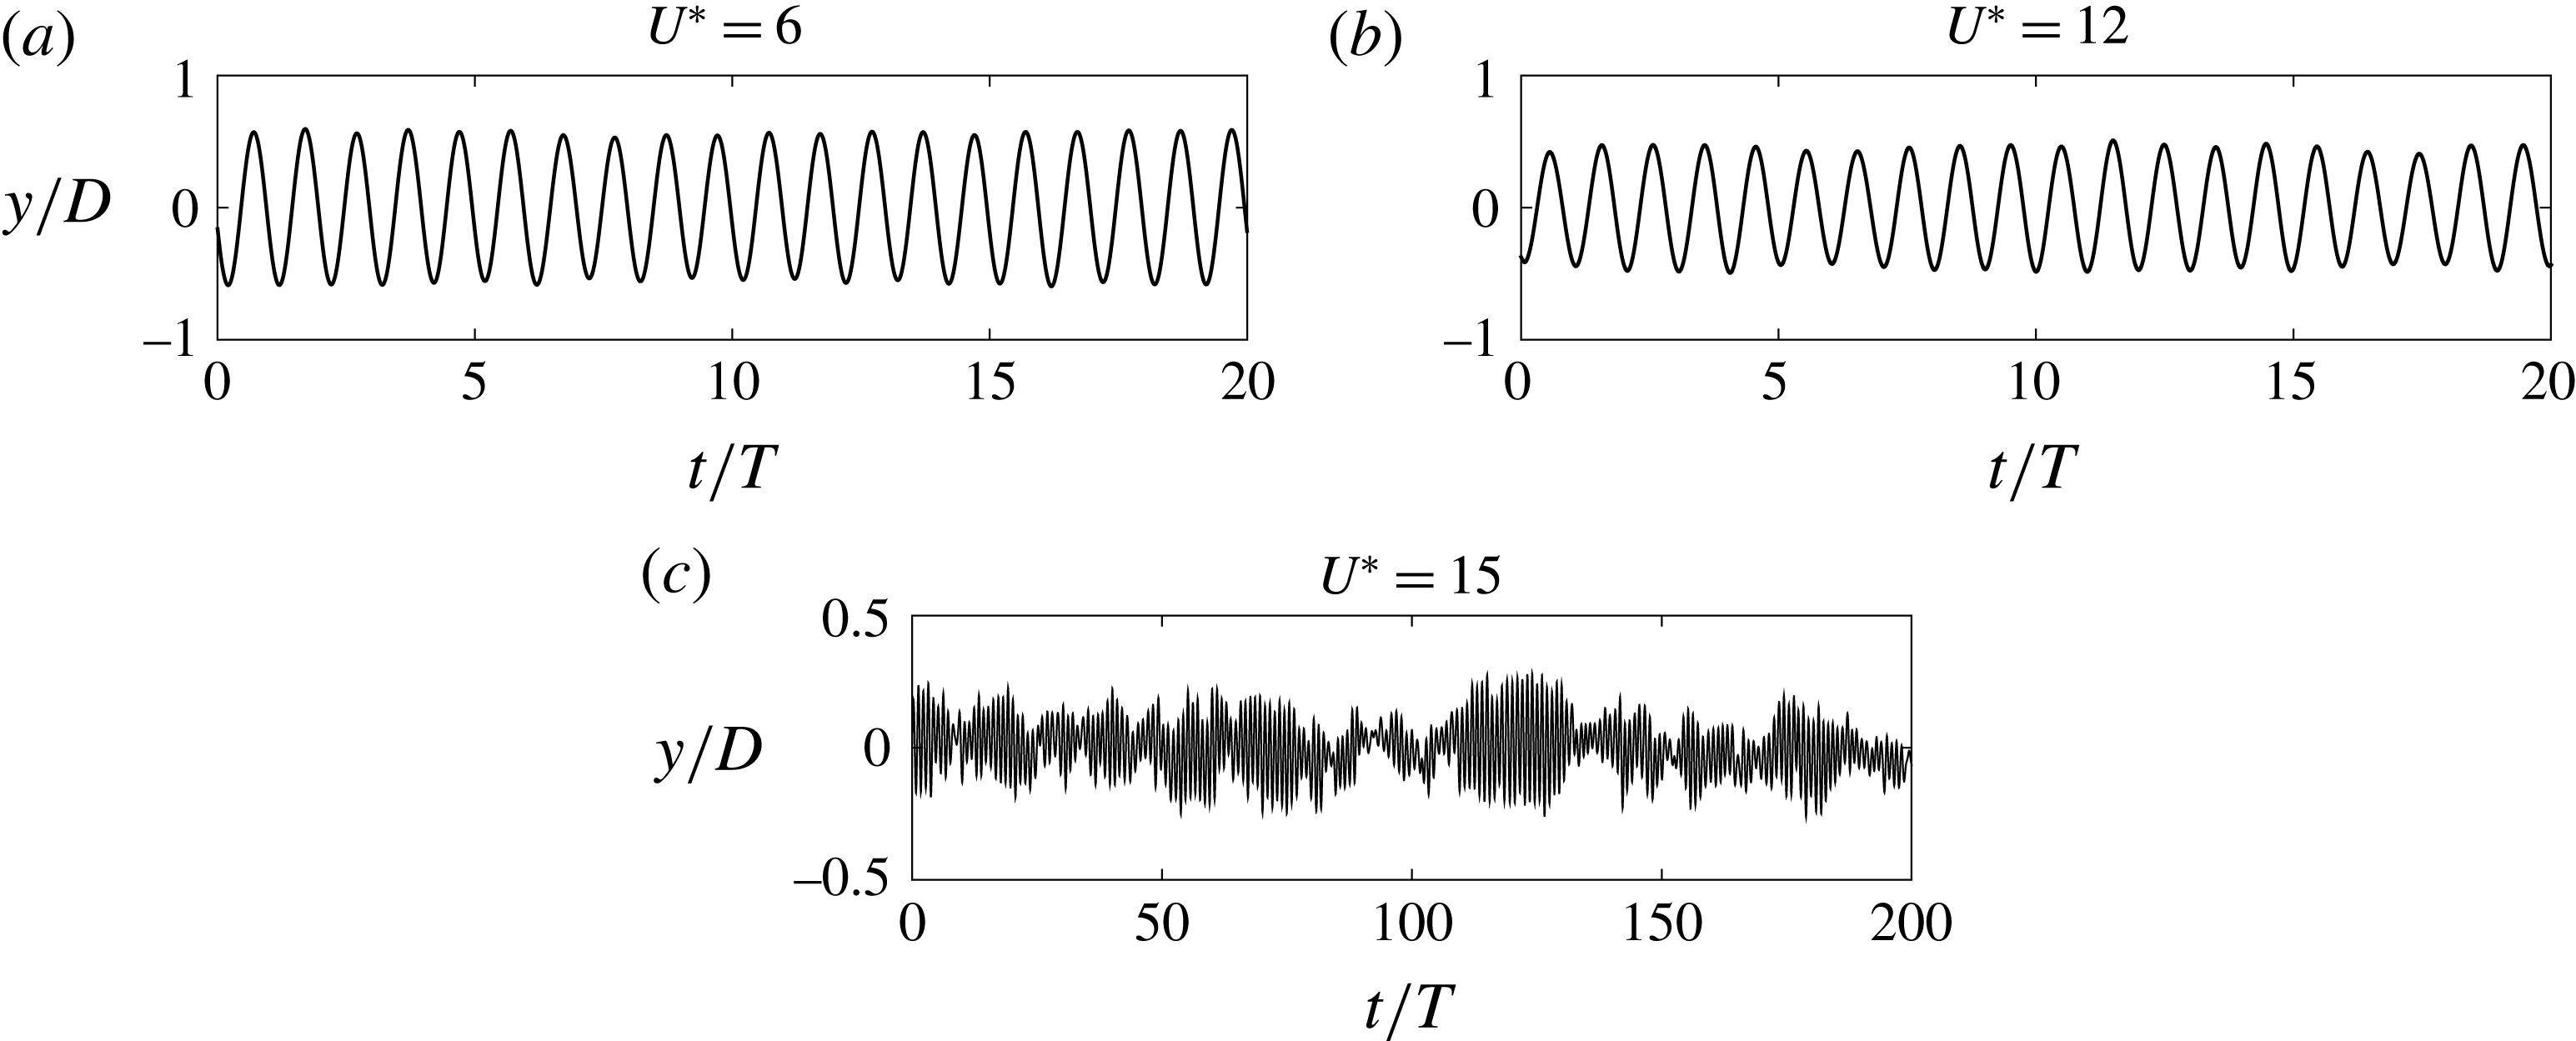
Variation of the displacement amplitude (
 $y/D$
) with dimensionless time (
 $t/T$
) for various
 $U^{\ast }$
values at an immersion ratio of 0.25. Here,
 $t$
is time and
 $T$
is the oscillation period.

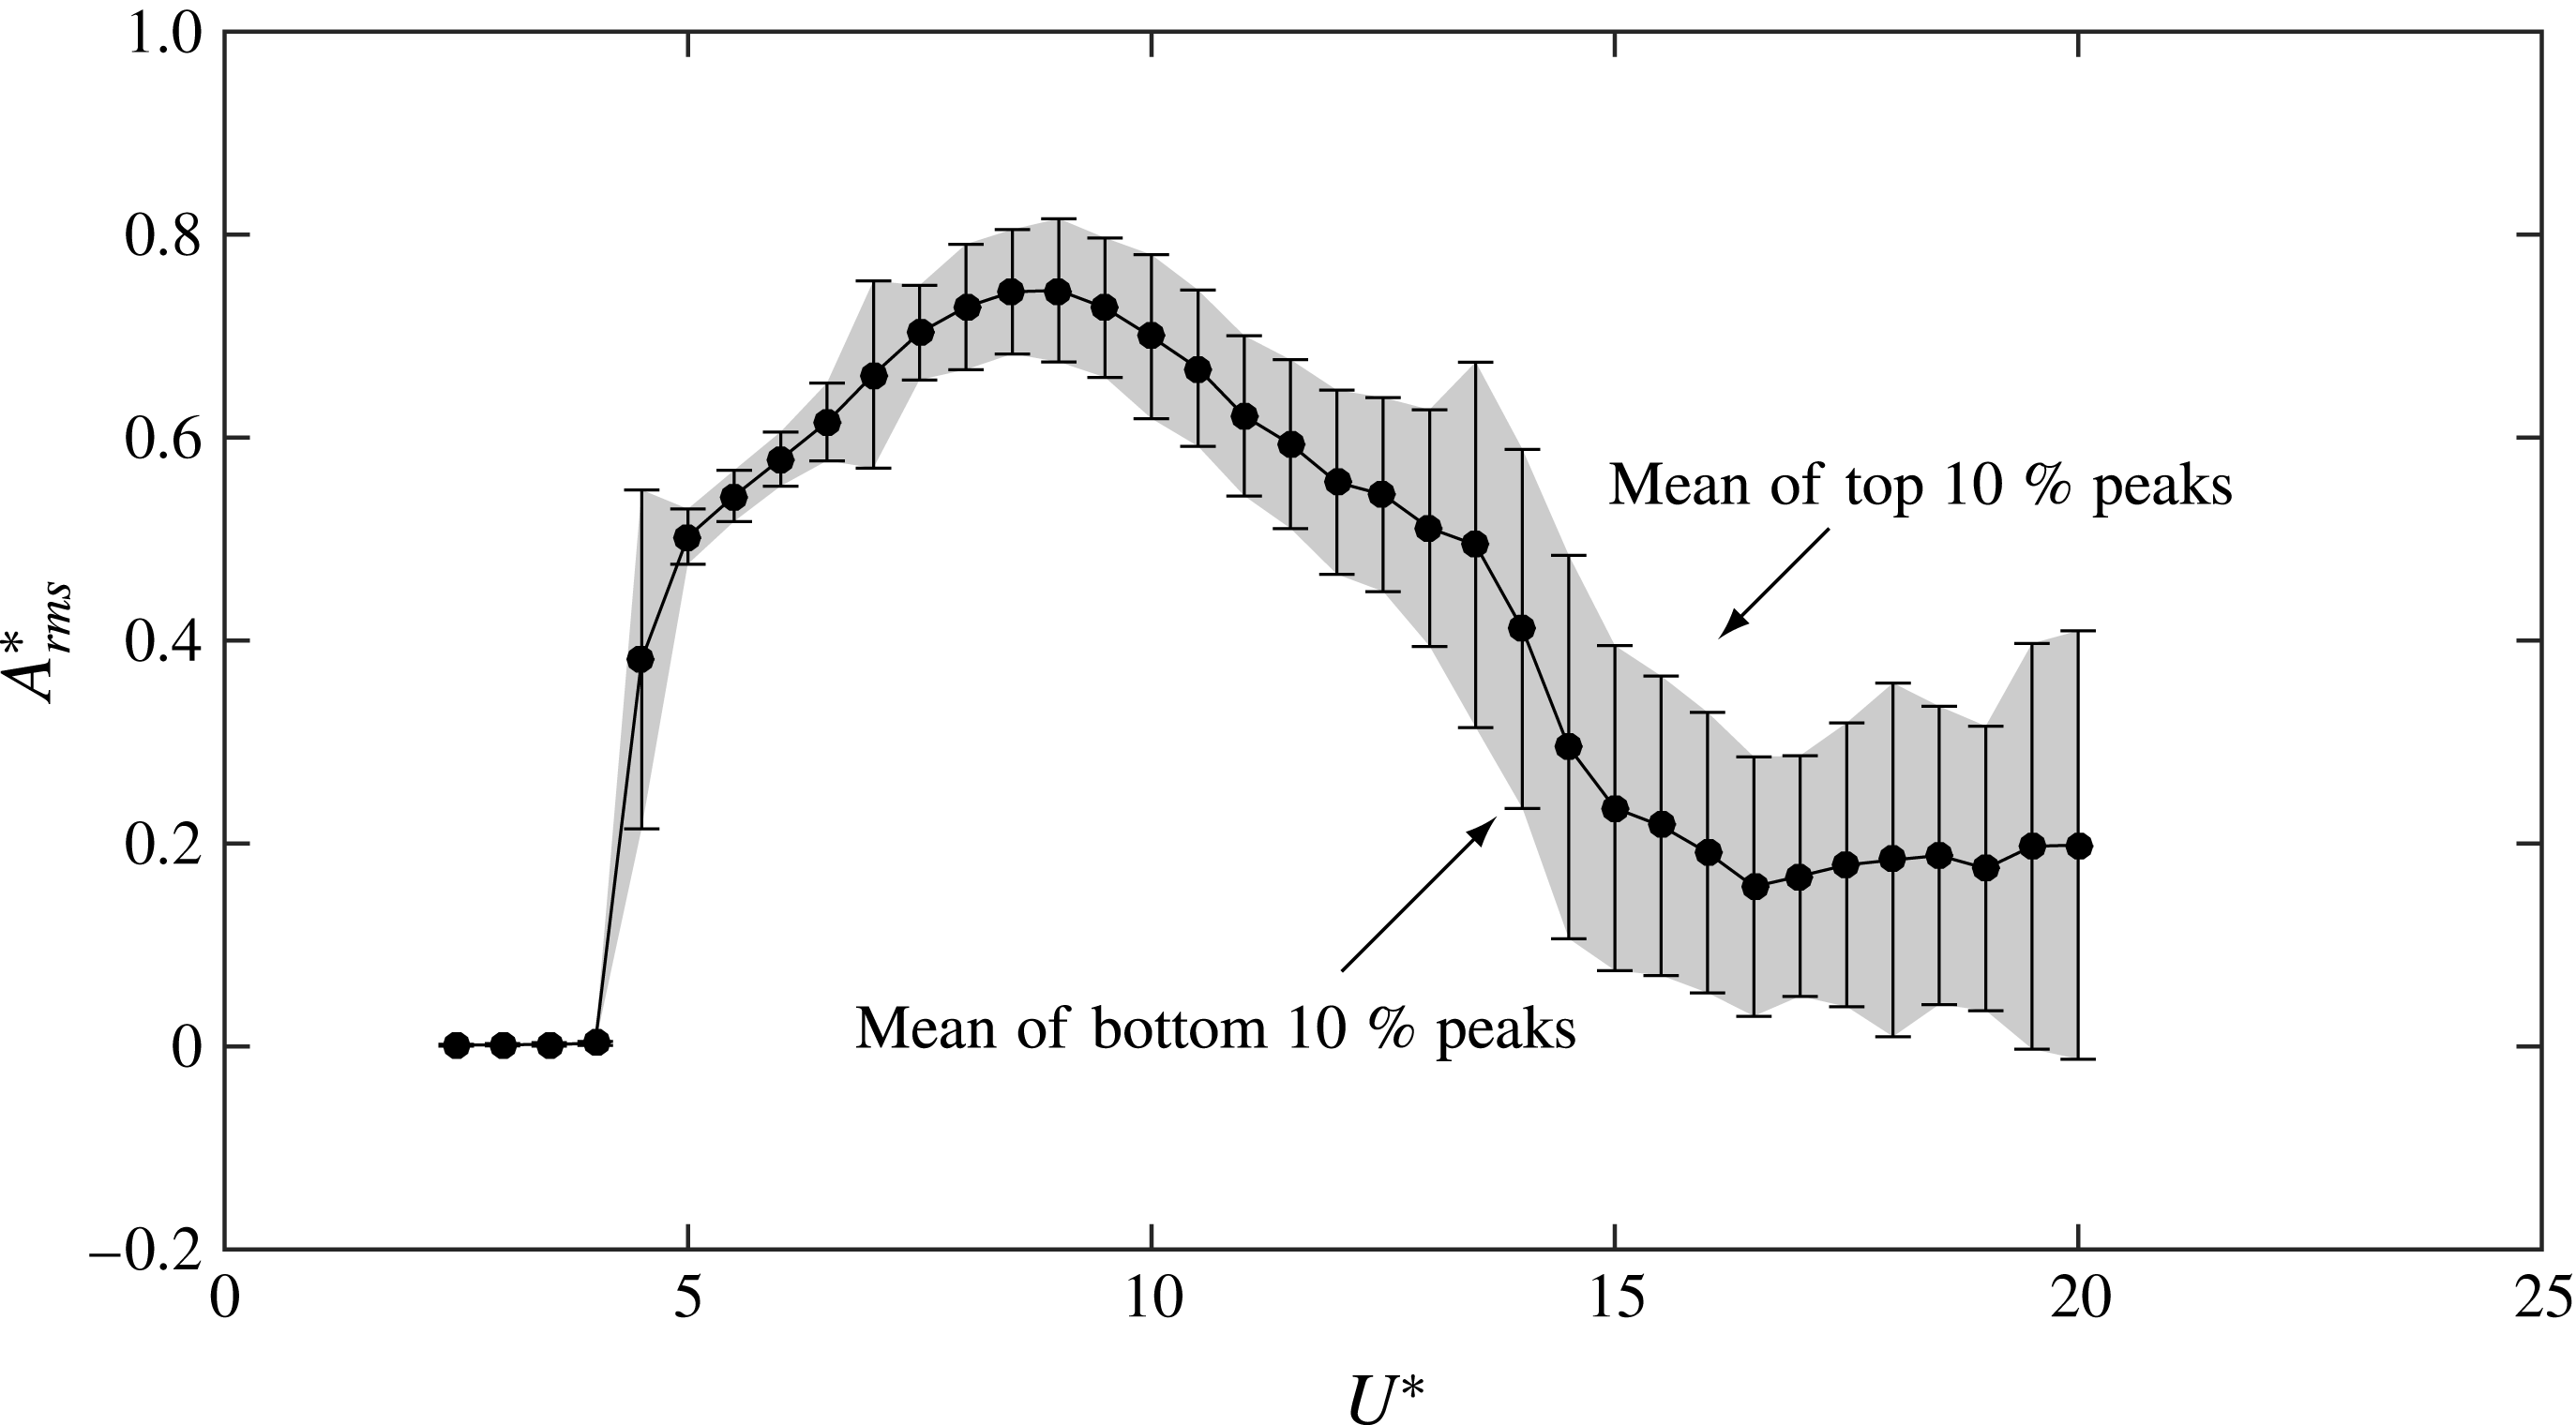
Amplitude response of a sphere for
 $h^{\ast }=0.375$
. Here, the shaded region is bounded by the mean of the top 10 % of peaks and the mean of the bottom 10 % of peaks, giving an indication of the periodicity/regularity of the signal.

The vibrations remain fairly periodic in the synchronisation region for all immersion ratios. Figure 6 shows the time trace of the sphere vibrations for different
 $U^{\ast }$
values at an immersion ratio of
 $h^{\ast }=0.25$
. For
 $U^{\ast }=6$
and 12 the vibrations are highly periodic, whereas for
 $U^{\ast }=15$
the vibrations are clearly non-periodic, and are characterised by sudden bursts of intermittent small vibrations. This behaviour was found to be true for all the other cases tested in this study. Consequently,
 $A_{rms}^{\ast }$
may not be the best representation of the response characteristics outside the synchronisation regime in this scenario, where small bursts of non-periodic vibrations are observed, as the estimated
 $A_{rms}^{\ast }$
value may change substantially with the sampling time. In order to demonstrate the large variations in the amplitude, especially in this region, an alternative way of presenting VIV response is shown in figure 7, where the mean of top 10 % of the peaks and the mean of bottom 10 % of the peaks are also plotted. This also gives a good indication of the variation in the signal over the sampling time at each
 $U^{\ast }$
value. This plot highlights the significant variations in the displacement amplitude for higher
 $U^{\ast }$
values, and that the vibrations are much less periodic in the higher reduced velocity range. This type of response is a typical of all the
 $h^{\ast }$
values investigated in the current study.
(a) Variation of the peak saturation amplitude
 $A_{max}^{\ast }$
with
 $h^{\ast }$
. (b) Variation of
 $U_{peak}^{\ast }$
with
 $h^{\ast }$
.

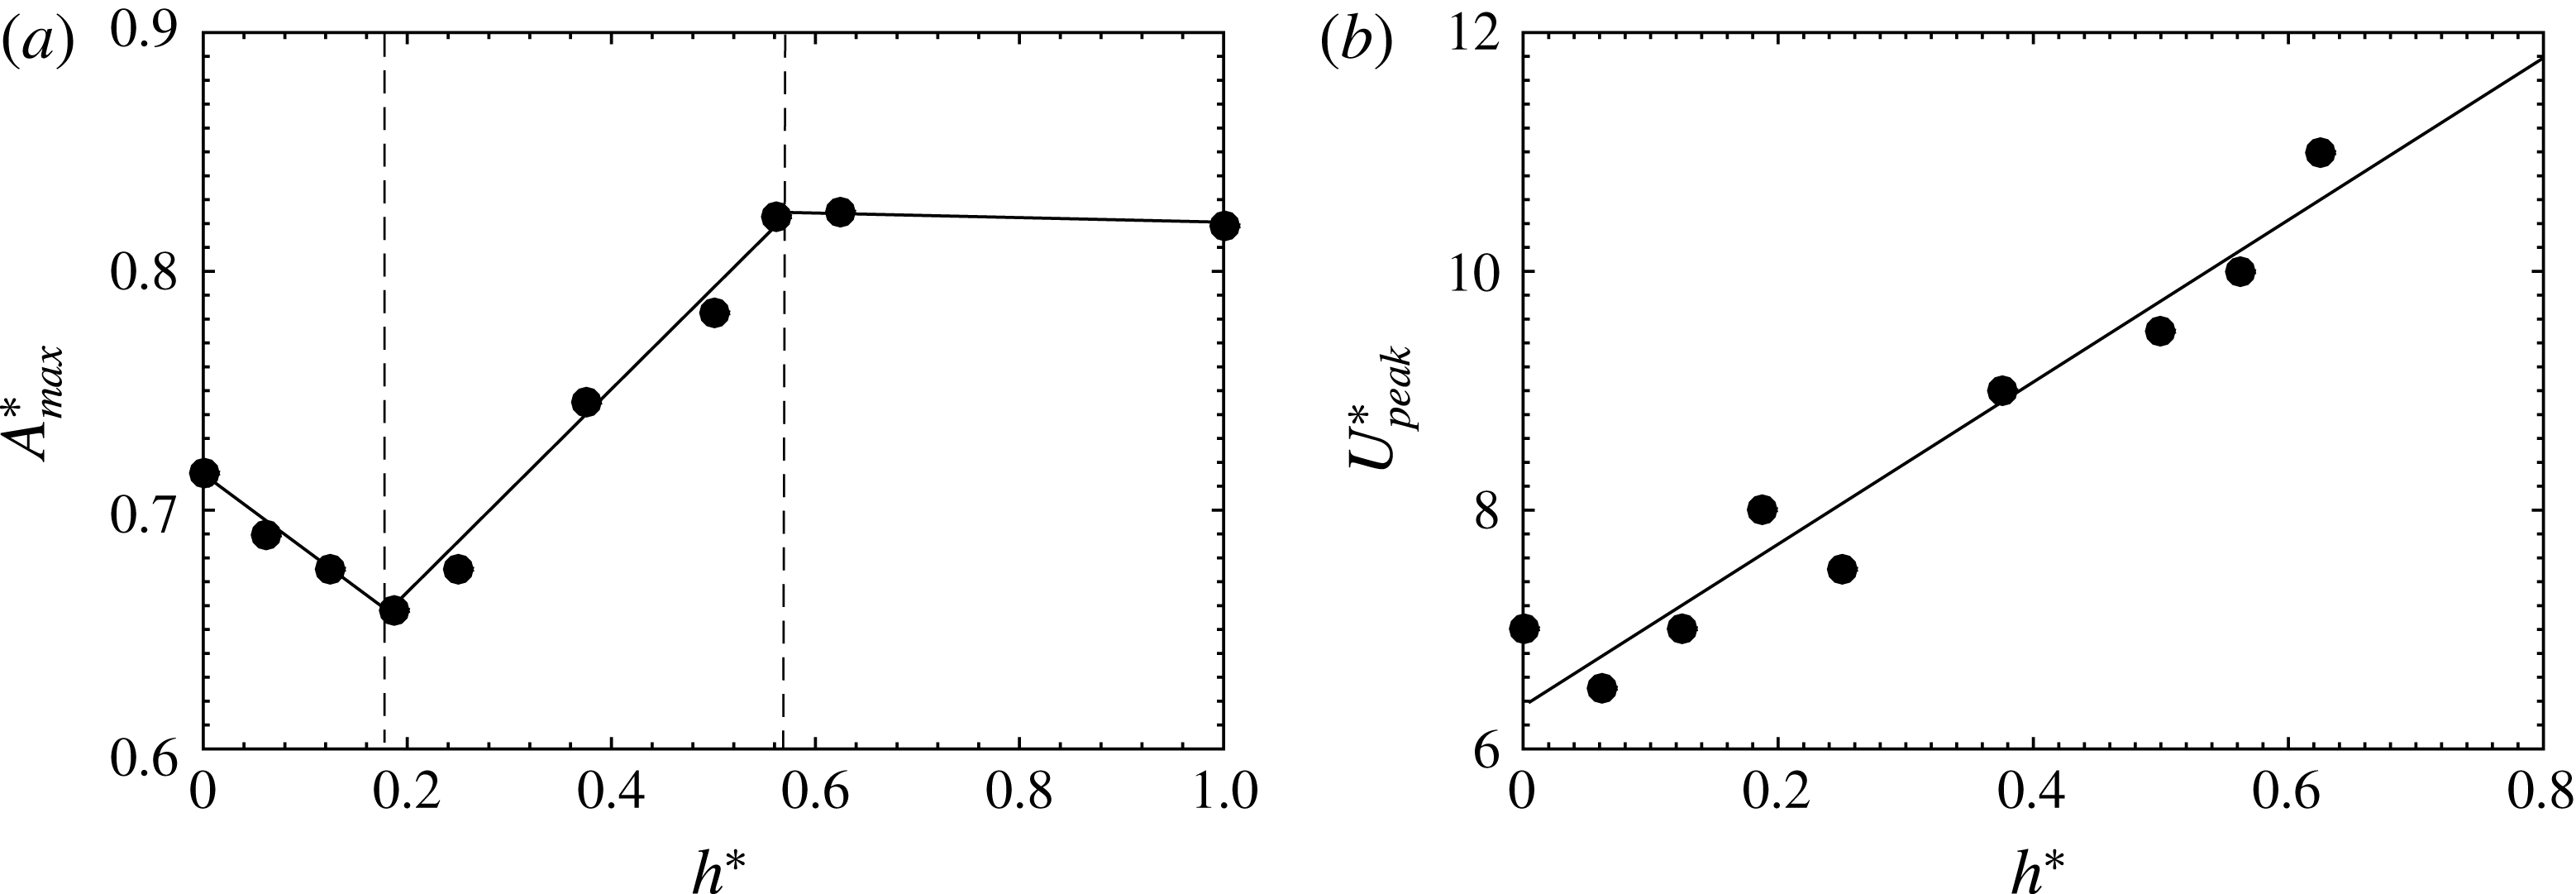
The synchronisation regime, the
 $U^{\ast }$
range where large amplitude vibrations are observed, becomes narrower with decreasing
 $h^{\ast }$
. The variation of the peak saturation amplitude,
 $A_{max}$
, with
 $h^{\ast }$
is shown in the figure 8. For
 $0.5\leqslant h^{\ast }\leqslant 1$
, the peak saturation amplitude remains almost constant; however, for
 $0.185\leqslant h^{\ast }\leqslant 0.5$
, there is a sharp linear decrease in
 $A_{max}^{\ast }$
with decreasing
 $h^{\ast }$
. Interestingly, when
 $h^{\ast }$
is further decreased, a linear increase in the peak response amplitude is observed. In contrast, the
 $U^{\ast }$
corresponding to
 $A_{max}$
, which is denoted by
 $U_{peak}^{\ast }$
in figure 8(b), decreases almost linearly with
 $h^{\ast }$
in the range
 $0\leqslant h^{\ast }\leqslant 0.625$
.
Frequency contour plots for
 $h^{\ast }=0.1875$
(c) and
 $h^{\ast }=0$
(d). The amplitude response curves correlated with the frequency contour plots are also shown in (a,b).

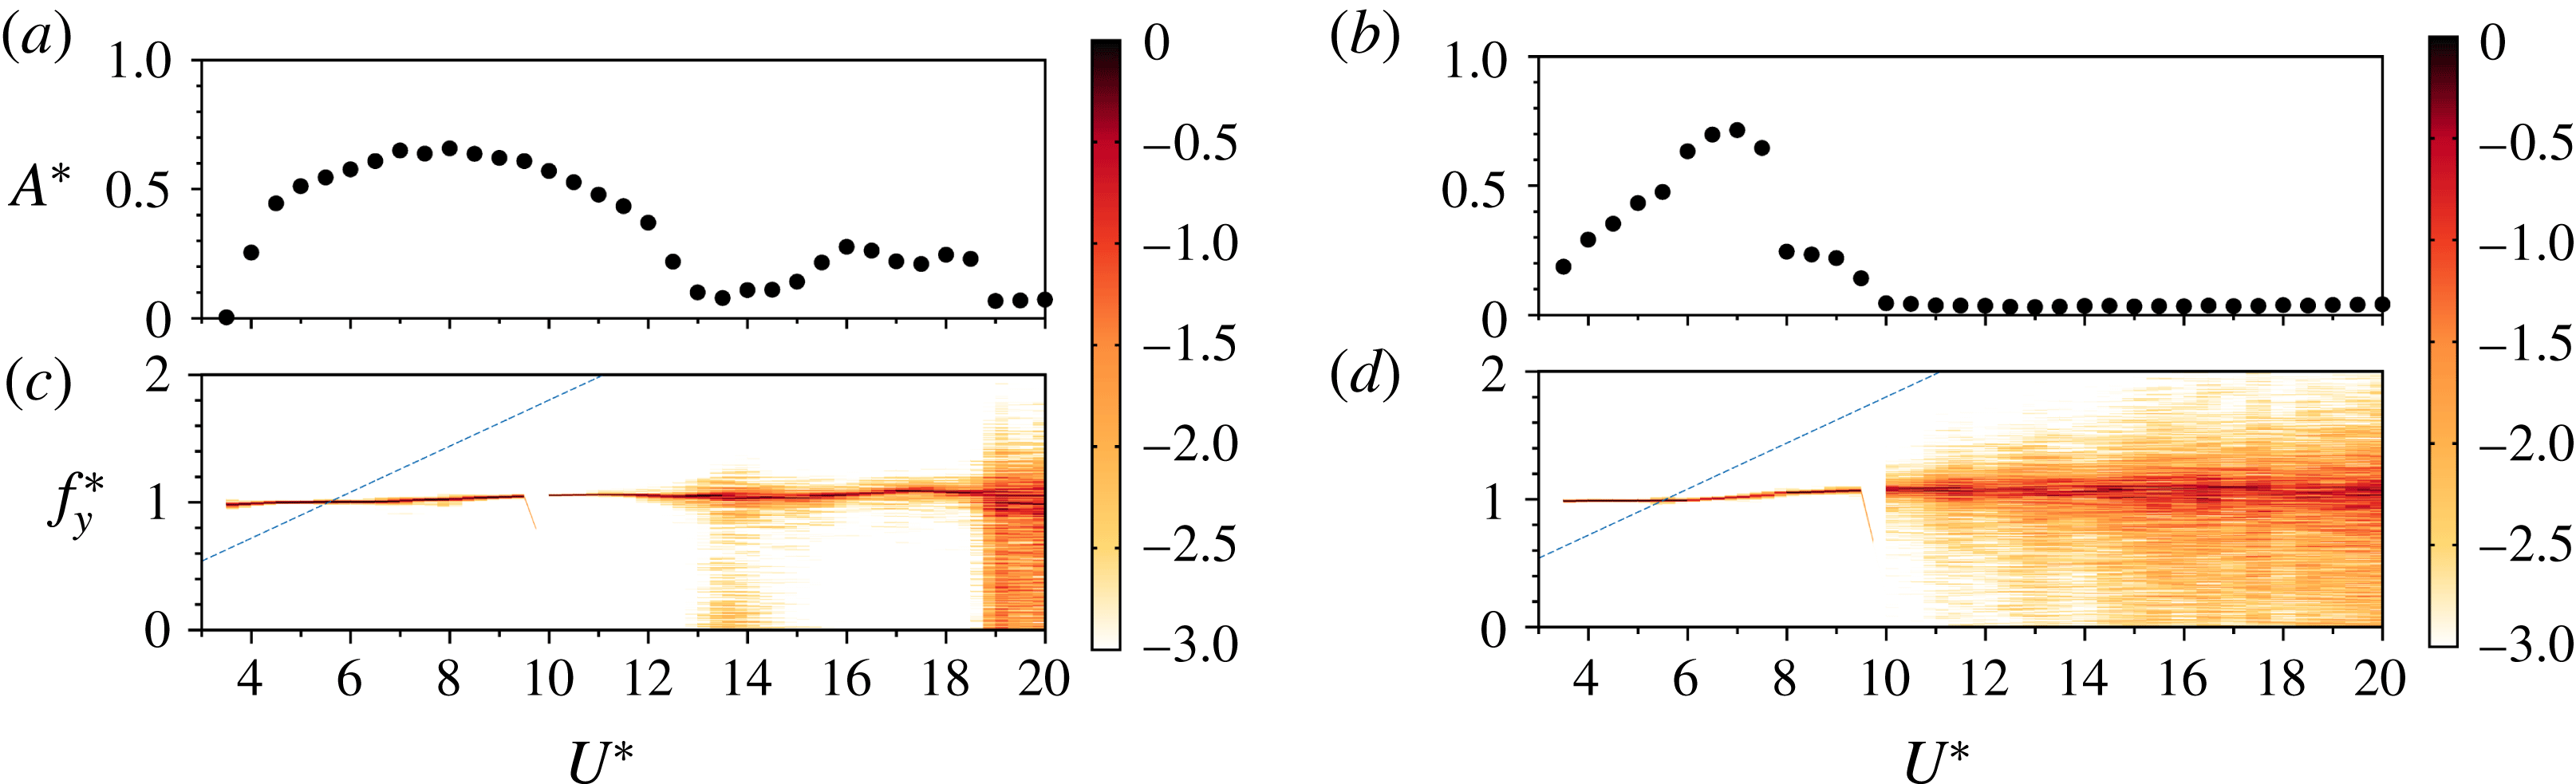
Figure 9 shows logarithmic-scale power-spectrum plots depicting the dominant vibration frequency (
 $f^{\ast }=f/f_{nw}$
) as a function of
 $U^{\ast }$
for two different immersion ratios. It is clear from the contour plots that the frequency stays close to the natural frequency (lock-in) for all
 $U^{\ast }$
values. It can be observed that within the synchronisation regime the signal exhibits a clean frequency response with maximum power close to
 $f_{y}^{\ast }=1$
. However, a broader range of frequencies is observed outside the synchronisation regime, where small non-periodic vibrations are observed.
Variation of
 ${C_{y}}_{rms}$
with
 $U^{\ast }$
for varying immersion ratios
 $h^{\ast }$
. The direction of the arrow shows the shift of the lock-in to smaller reduced velocities.

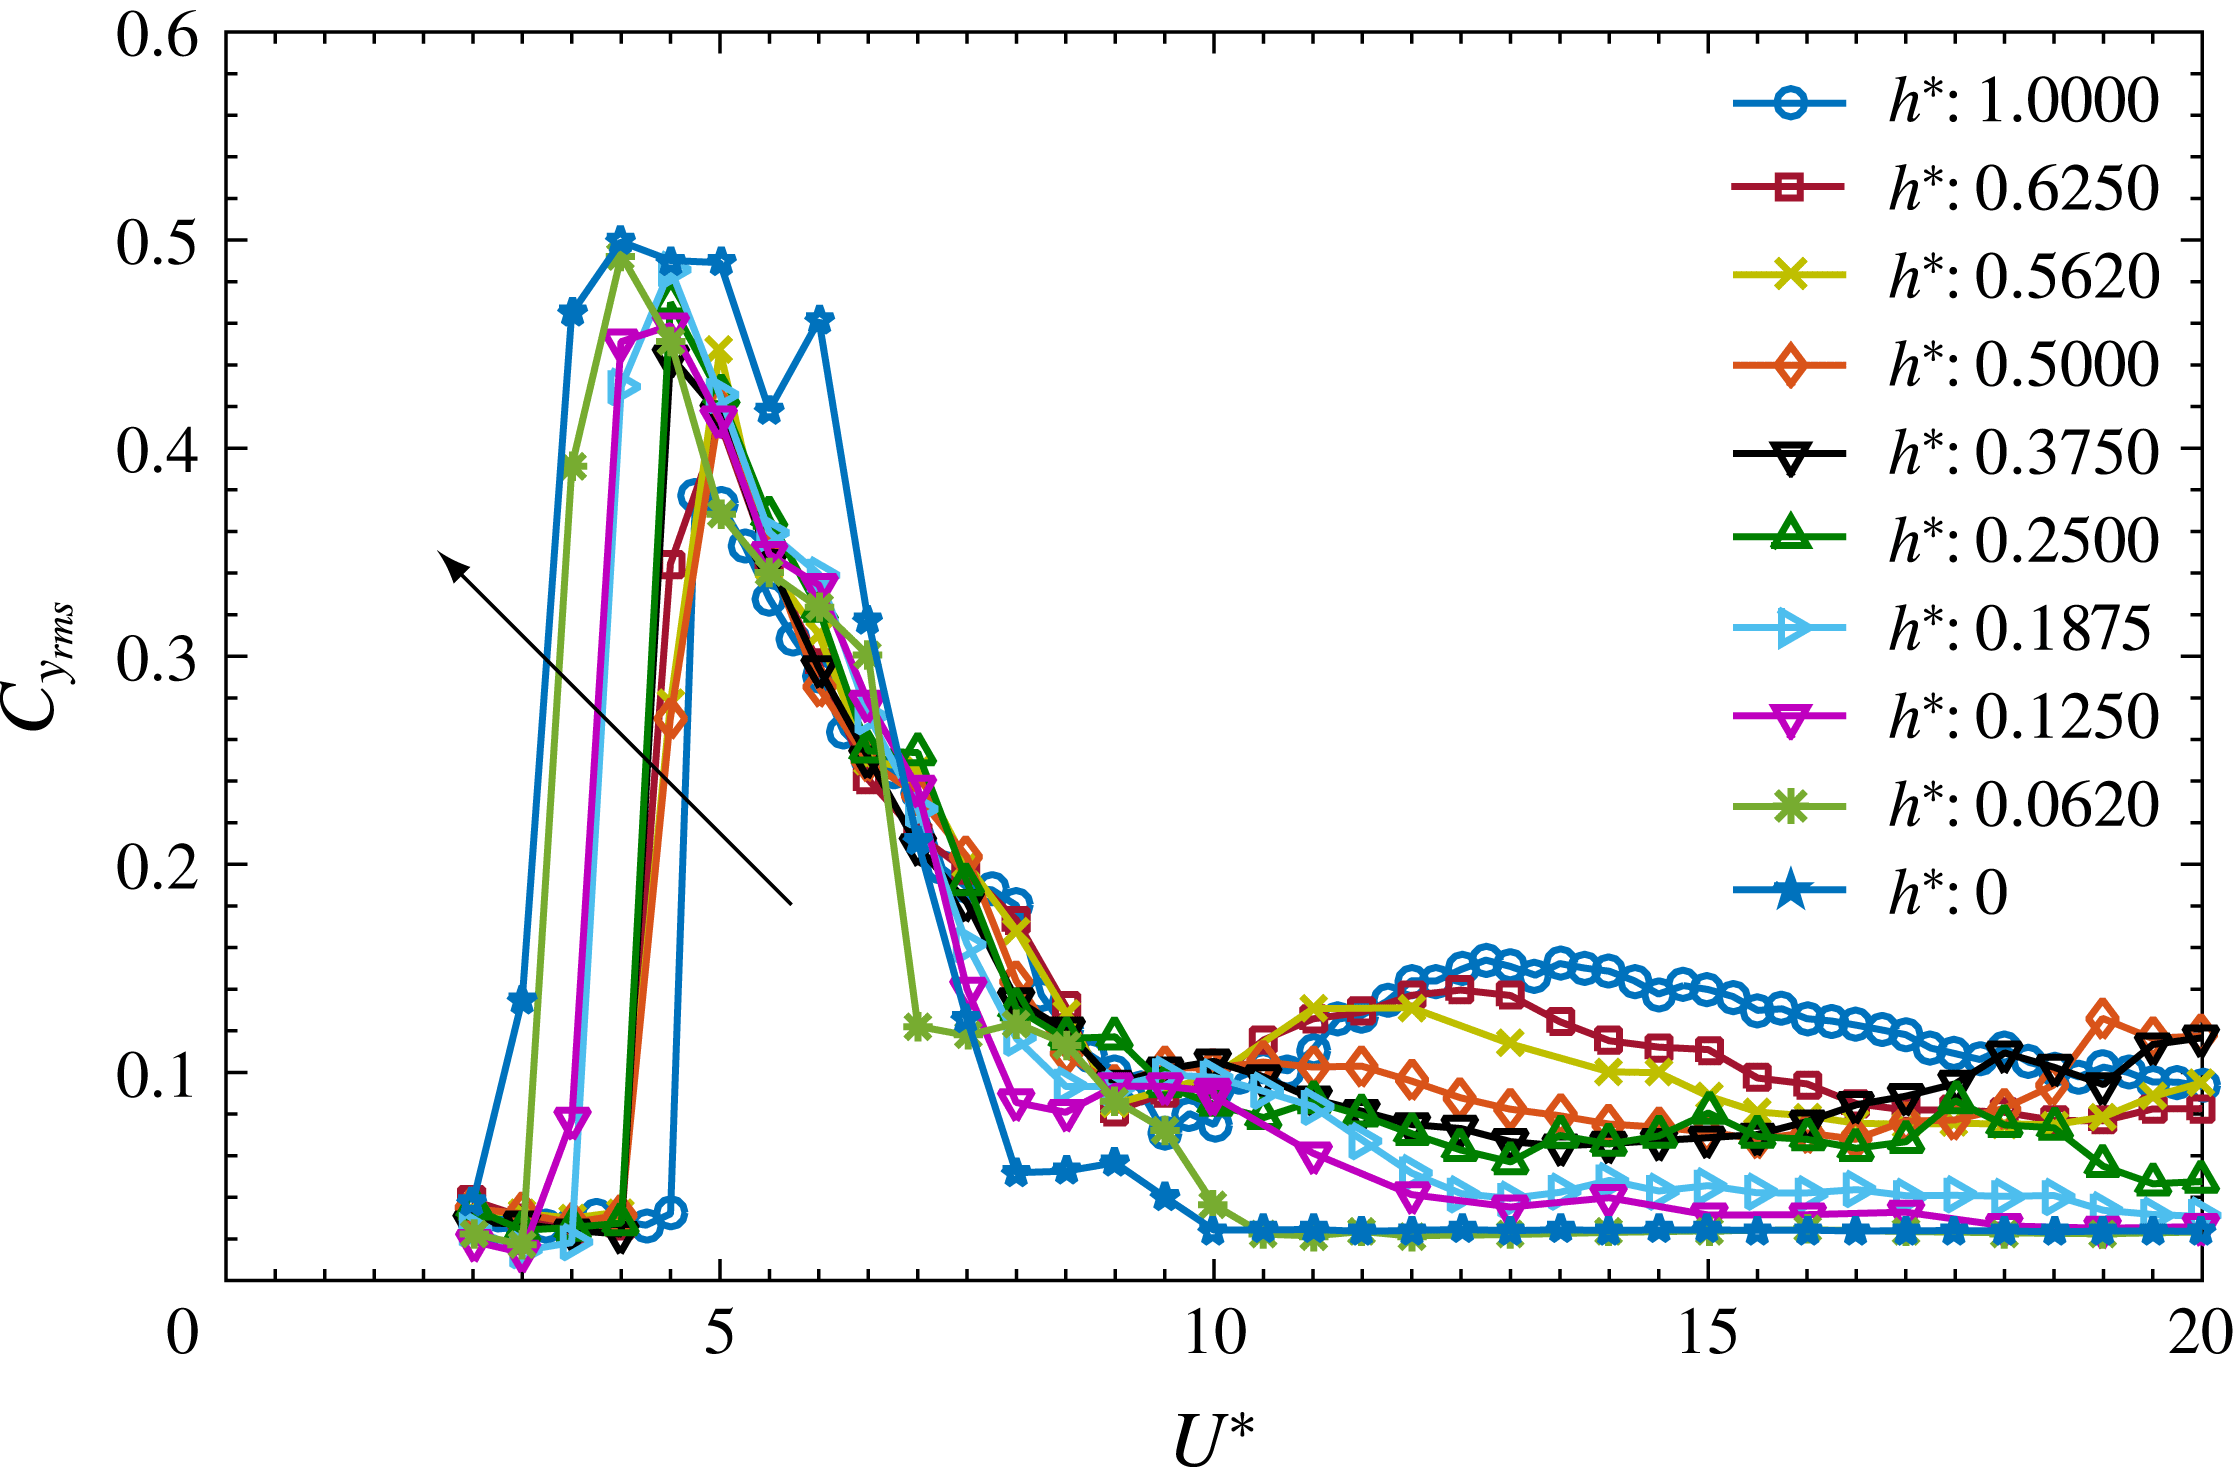
Figure 10 shows the variation of the r.m.s. of the transverse force coefficient,
 ${C_{y}}_{rms}$
, with
 $U^{\ast }$
for varying immersion ratios,
 $h^{\ast }$
. As evident from the figure, there is a sudden jump in
 ${C_{y}}_{rms}$
associated with the sudden increase in the amplitude response during lock-in, as shown in figure 5. The
 $U^{\ast }$
corresponding to lock-in shifts to the left with decreasing
 $h^{\ast }$
, as indicated by the arrow in the figure. For higher
 $U^{\ast }$
values of
 $U^{\ast }\geqslant 10$
, there is a relatively larger influence of decreasing
 $h^{\ast }$
in terms of decreasing the transverse fluctuating force acting on the sphere. Similar behaviour was observed for the displacement amplitudes as well, where the amplitudes were greatly influenced in the higher
 $U^{\ast }$
range, as shown in figure 5. These observed behaviours of the transverse fluctuating force coefficient
 ${C_{y}}_{rms}$
are consistent with the amplitude response.
Variation of the total phase
 $\unicode[STIX]{x1D719}_{total}$
(a) and vortex phase
 $\unicode[STIX]{x1D719}_{vortex}$
(b) with
 $U^{\ast }$
, for three different immersion ratios.

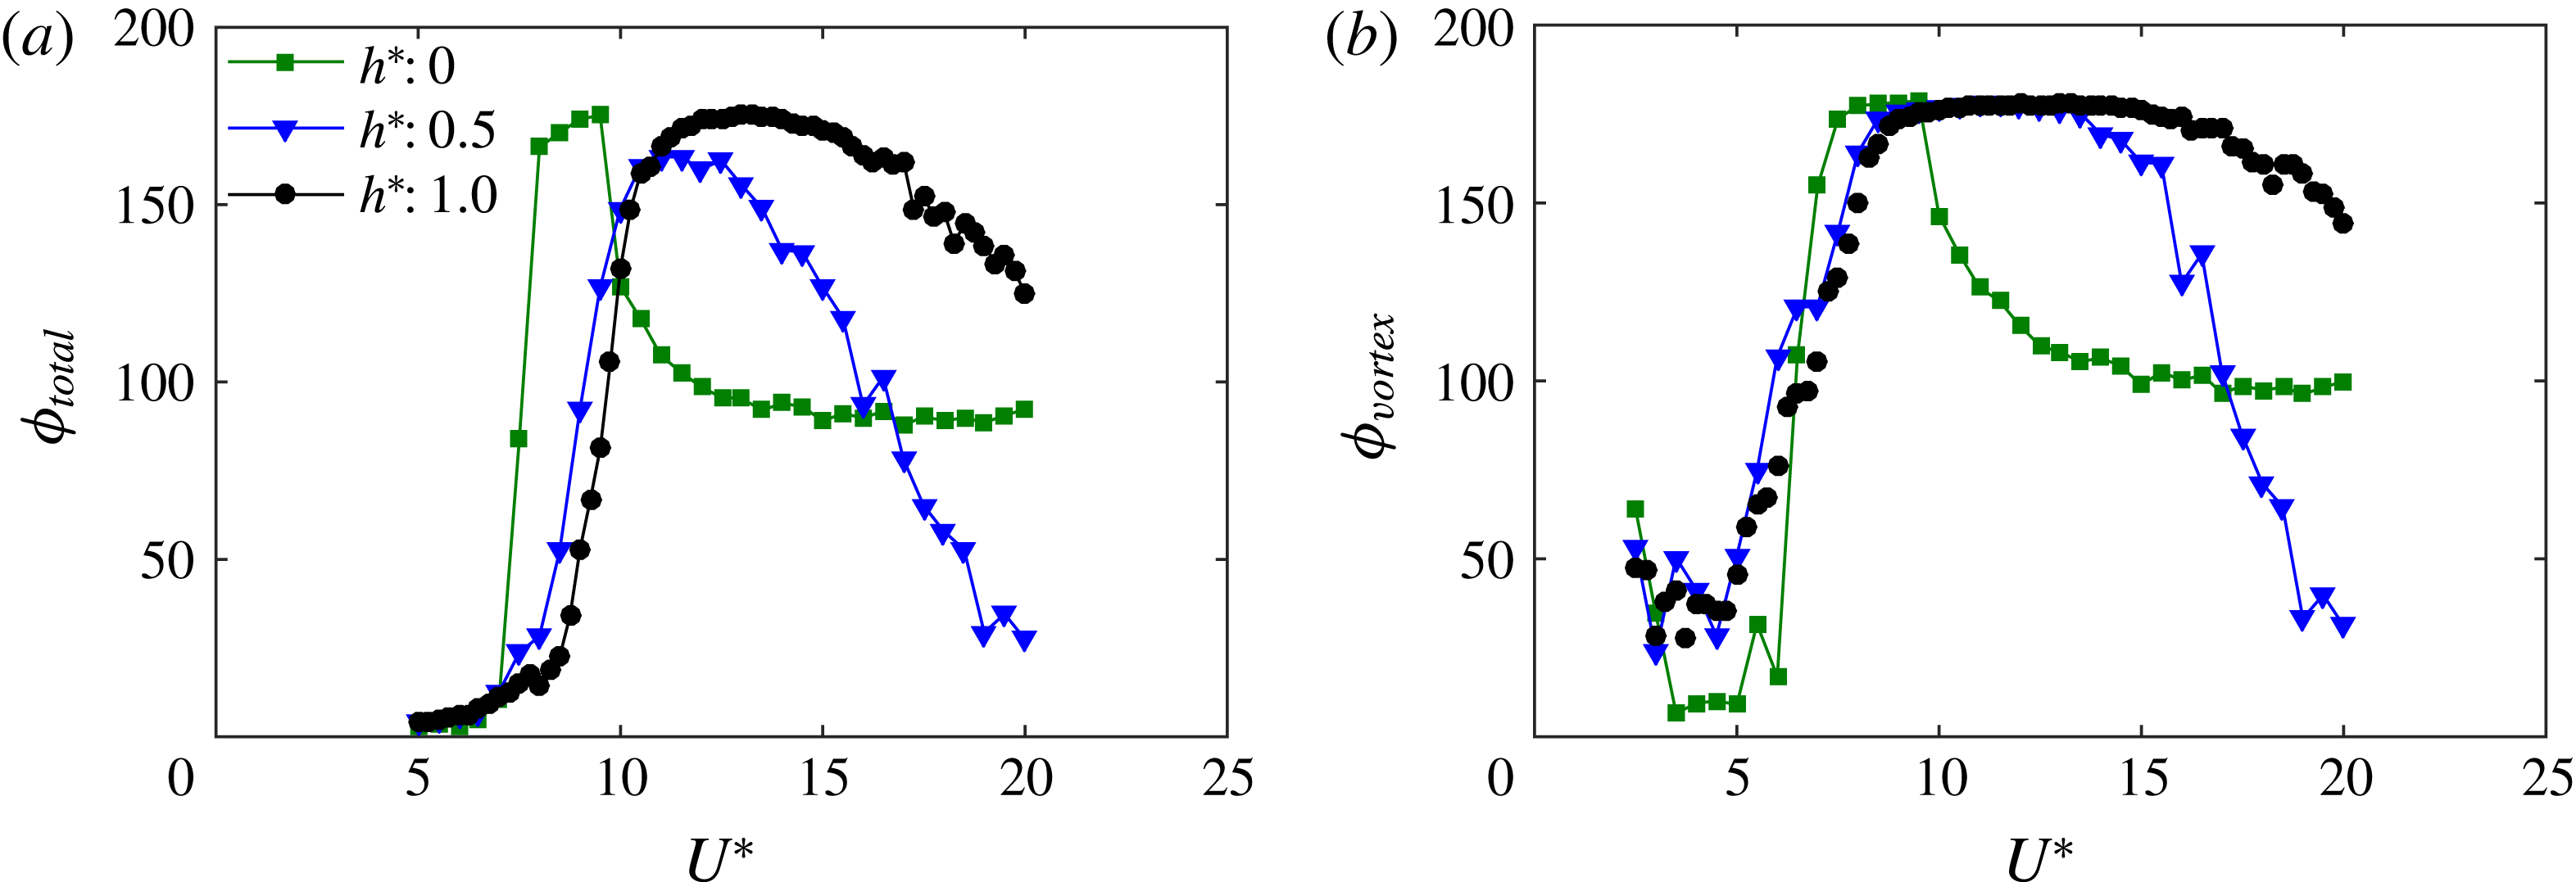
Figure 11 shows the variation of the total phase
 $\unicode[STIX]{x1D719}_{total}$
and the vortex phase
 $\unicode[STIX]{x1D719}_{vortex}$
with
 $U^{\ast }$
for three different immersion ratios. For
 $h^{\ast }=1$
,
 $\unicode[STIX]{x1D719}_{vortex}$
gradually increases from
 ${\approx}20^{\circ }$
to
 ${\approx}170^{\circ }$
as the sphere response continuously progresses from mode I to mode II; however,
 $\unicode[STIX]{x1D719}_{total}$
only starts increasing when the response has reached the peak saturation value. This is consistent with the previously reported trends for the phases by Govardhan & Williamson (Reference Govardhan and Williamson2005) and Sareen et al. (Reference Sareen, Zhao, Lo Jacono, Sheridan, Hourigan and Thompson2018). For
 $h^{\ast }=0.5$
, both
 $\unicode[STIX]{x1D719}_{total}$
and
 $\unicode[STIX]{x1D719}_{vortex}$
start reducing at higher
 $U^{\ast }$
values, unlike the
 $h^{\ast }=0$
case, where both phases settle down at
 ${\approx}90^{\circ }$
for higher
 $U^{\ast }$
values. Another interesting point to note here is that
 $\unicode[STIX]{x1D719}_{total}$
starts rising at progressively lower
 $U^{\ast }$
values for decreasing
 $h^{\ast }$
. This is consistent with the linear decrease of
 $U_{peak}^{\ast }$
with
 $U^{\ast }$
, as discussed above in figure 8. It can be concluded here that the mode II response occurs for progressively lower
 $U^{\ast }$
values with decreasing
 $h^{\ast }$
.
It follows that in the parameter space studied here, as the sphere comes closer to the free surface, the transverse fluctuating force acting on the sphere decreases with a greater influence in the higher
 $U^{\ast }$
range. Consequently, there is a consistent decrease in the displacement amplitude response of the sphere. For the cases where highly reduced vibrations were observed, the response was less periodic, characterised by sudden bursts of small vibrations with larger variations in amplitudes. The location of the peak saturation amplitude progressively shifts to the left with decreasing
 $h^{\ast }$
, with the amplitude initially decreasing linearly but with a sudden linear increase beyond
 $h^{\ast }\lesssim 0.2$
.
The response was also studied for cases where the sphere pierces the free surface. Interestingly, the dynamics are quite different. The results are discussed in detail in the following section.
5 VIV of a semi-submerged sphere
This section focuses on the VIV response of a semi-submerged sphere piercing the free surface. The immersion depth ratio,
 $h^{\ast }$
, of the sphere was varied in small increments between 0 and
 $-$
0.75, where
 $h^{\ast }=0$
denotes the case when the free surface just touches the top of the sphere. The response was studied for the reduced velocity range of
 $2.5\leqslant U^{\ast }\leqslant 20$
for all the immersion ratios. Each data point was acquired at an acquisition rate of
 $100~\text{Hz}$
, for more than
 ${\sim}200$
cycles for the highly periodic oscillations (at lower
 $U^{\ast }$
values) and
 ${\sim}400$
cycles for the non-periodic vibrations (at higher
 $U^{\ast }$
values).
5.1 Vibration response measurements
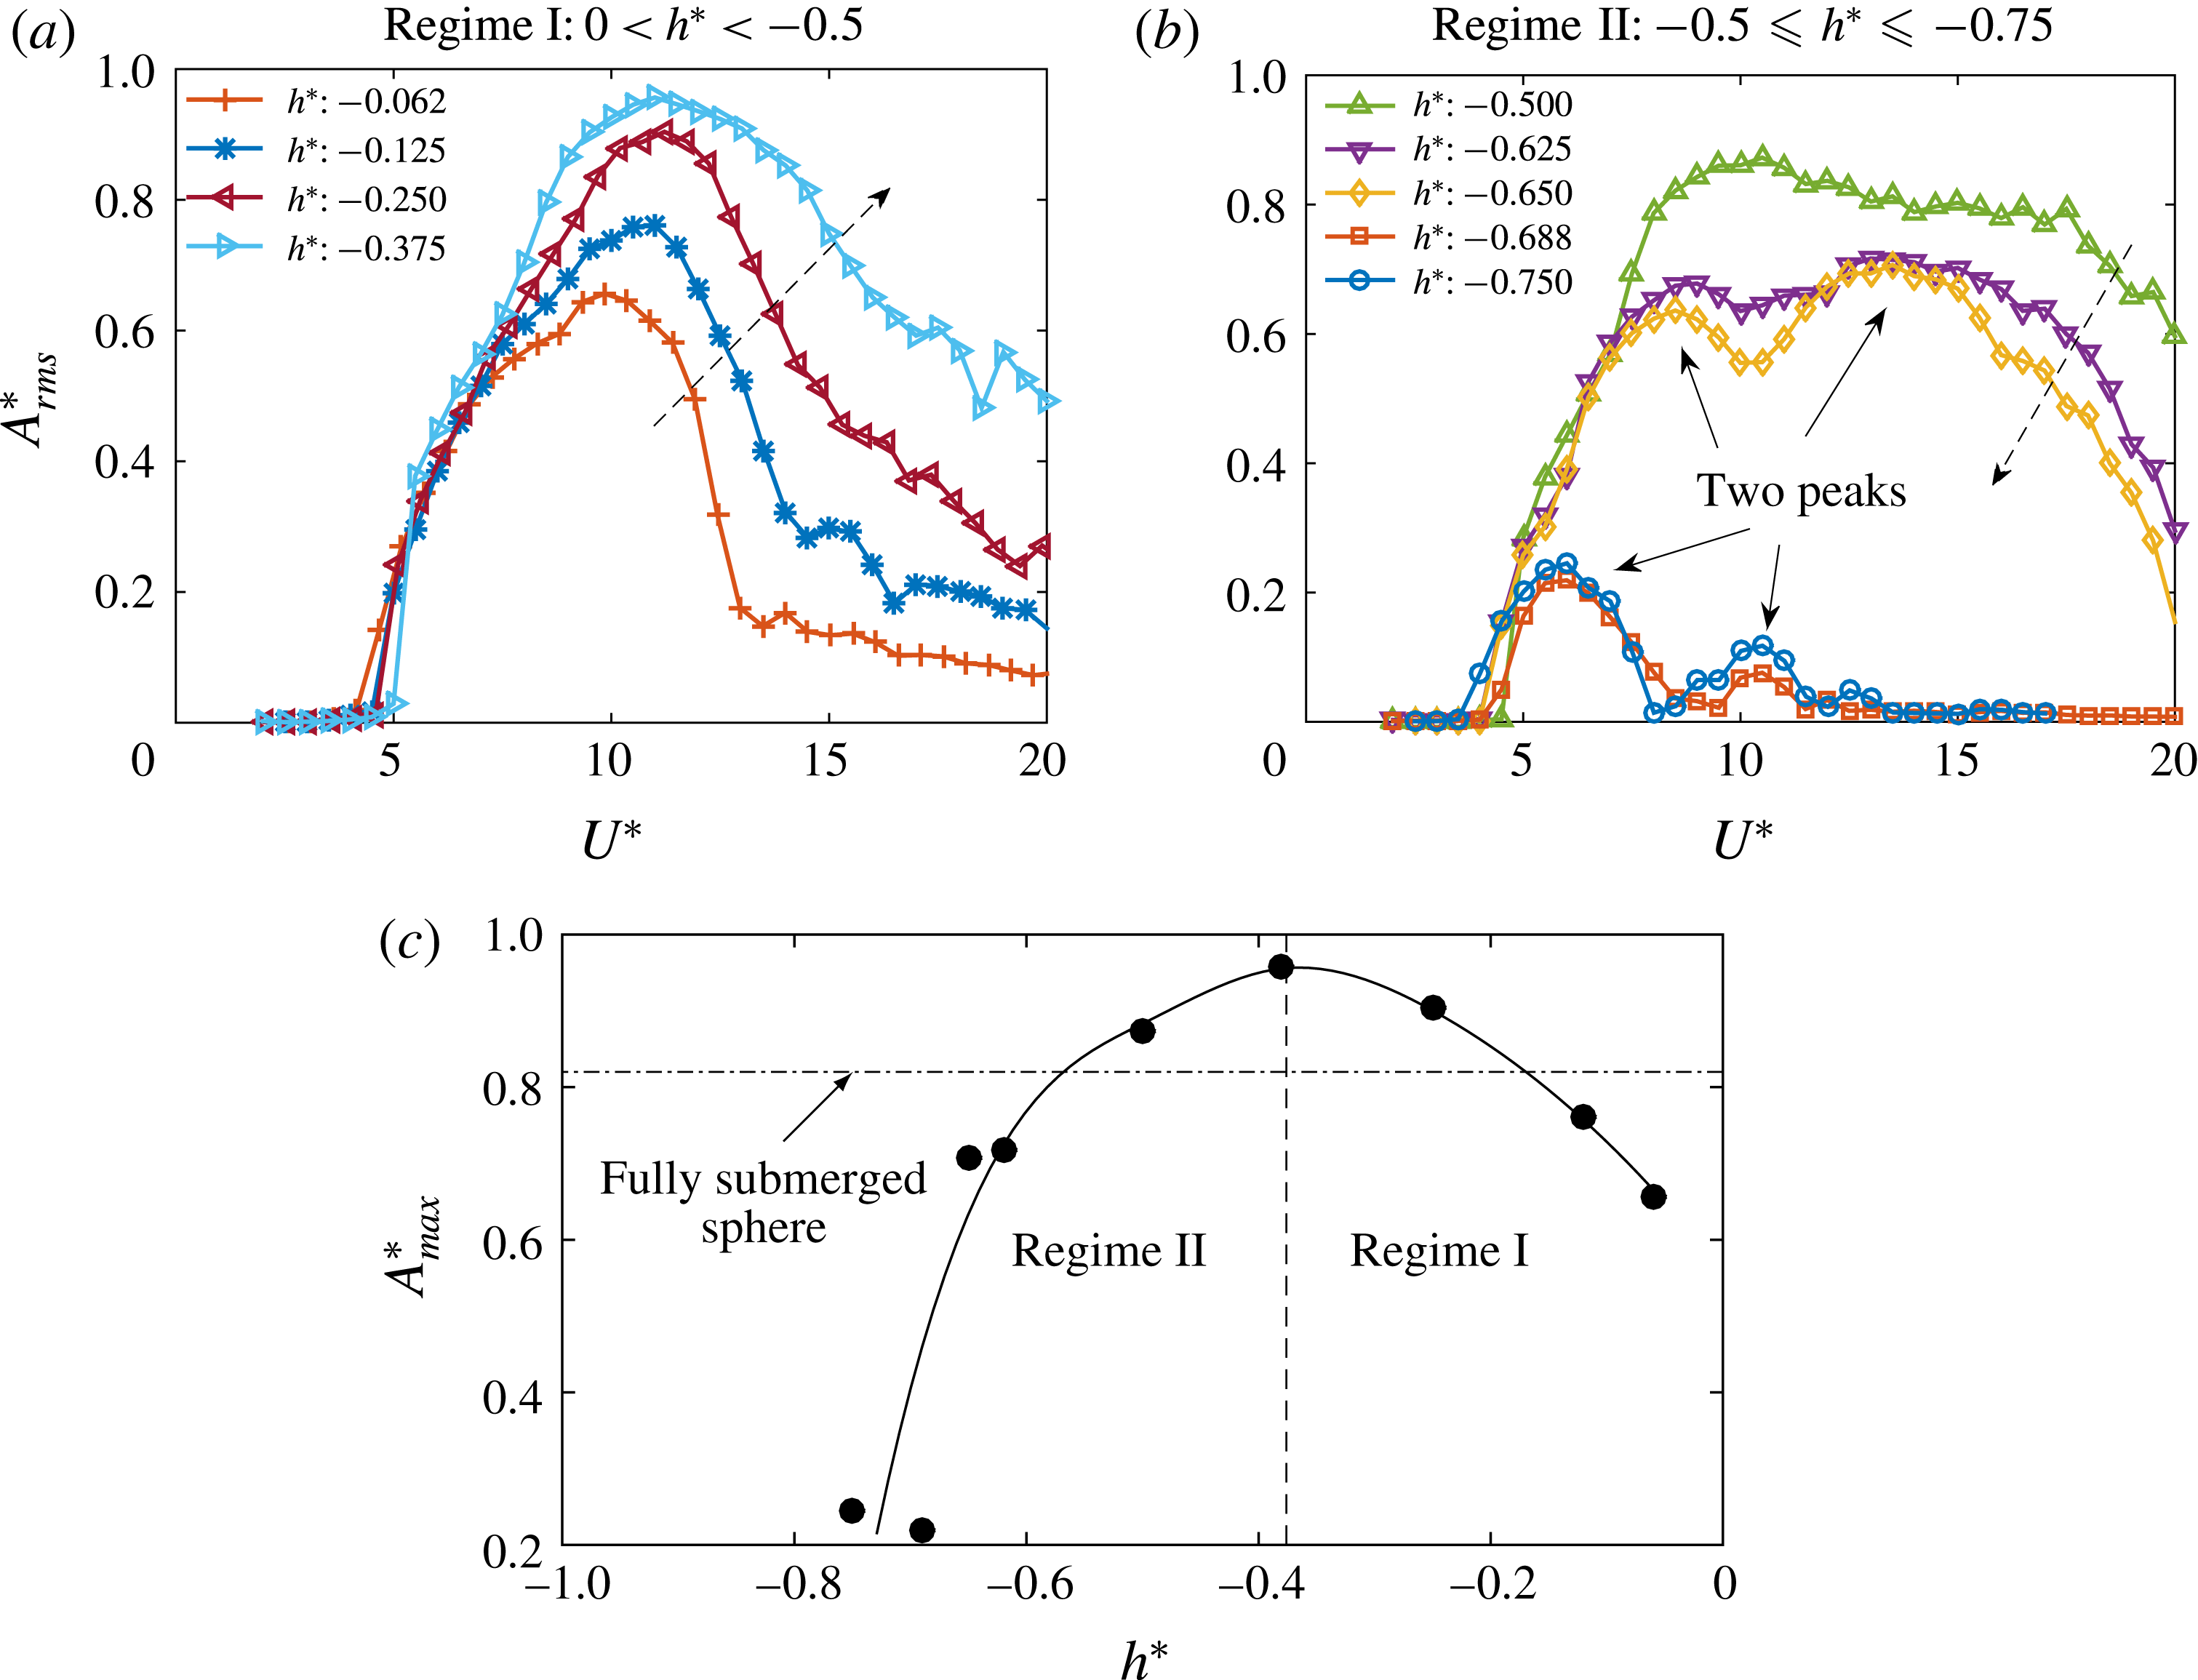
The response of a semi-submerged sphere can be divided into two regimes, one with
 $0<h^{\ast }<-0.5$
, and the other with
 $-0.5\leqslant h^{\ast }\leqslant -0.75$
, due to distinct differences in the response characteristics. Figure 12 shows the variation of
 $A_{rms}^{\ast }$
with
 $U^{\ast }$
for various
 $h^{\ast }$
values for both these regimes. In regime I, as
 $h^{\ast }$
is decreased from
 $-$
0.062 to
 $-$
0.375, the displacement amplitude progressively increases and the synchronisation region sequentially widens.
Amplitude response of a sphere piercing the free surface. (a) The amplitude response in regime I. (b) The amplitude response in regime II. (c) Variation of the peak amplitude,
 $A_{max}^{\ast }$
, with
 $h^{\ast }$
. The dashed arrow in (a,b) represents the direction of increasing
 $h^{\ast }$
(in magnitude).

In contrast to regime I, the displacement amplitude in regime II decreases with a decrease in
 $h^{\ast }$
, as can be observed in figure 12(b). The amplitude response for
 $-0.5<h^{\ast }\leqslant -0.75$
is characterised by two peaks, unlike regime I, where only one peak is evident for the
 $U^{\ast }$
range tested. As observed from the figure, the drop in amplitude is dramatic between
 $-$
0.650 and
 $-$
0.688, which was found to be repeatable in follow-up experiments. The amplitudes for
 $h^{\ast }=-0.688$
and
 $-$
0.750 are highly reduced with a suppression of vibrations for
 $U^{\ast }\geqslant 15$
.
Figure 12(c) shows the variation of the peak amplitude,
 $A_{max}^{\ast }$
, with
 $h^{\ast }$
. Intriguingly, for
 $h^{\ast }=-0.250$
,
 $-$
0.375 and
 $-$
0.5, the amplitudes become even higher than the amplitude response of a fully submerged sphere (shown with dashed horizontal line). In these cases, the vibrations corresponding to the peak amplitude remain highly periodic; however, the periodicity decreases as the response decreases at higher
 $U^{\ast }$
values, as also shown in the following discussion.
Variation of the displacement amplitude (
 $y/D$
) with non-dimensional time (
 $t/T$
) for various
 $U^{\ast }$
values at an immersion ratio of
 $h^{\ast }=-0.062$
(left) and
 $h^{\ast }=-0.750$
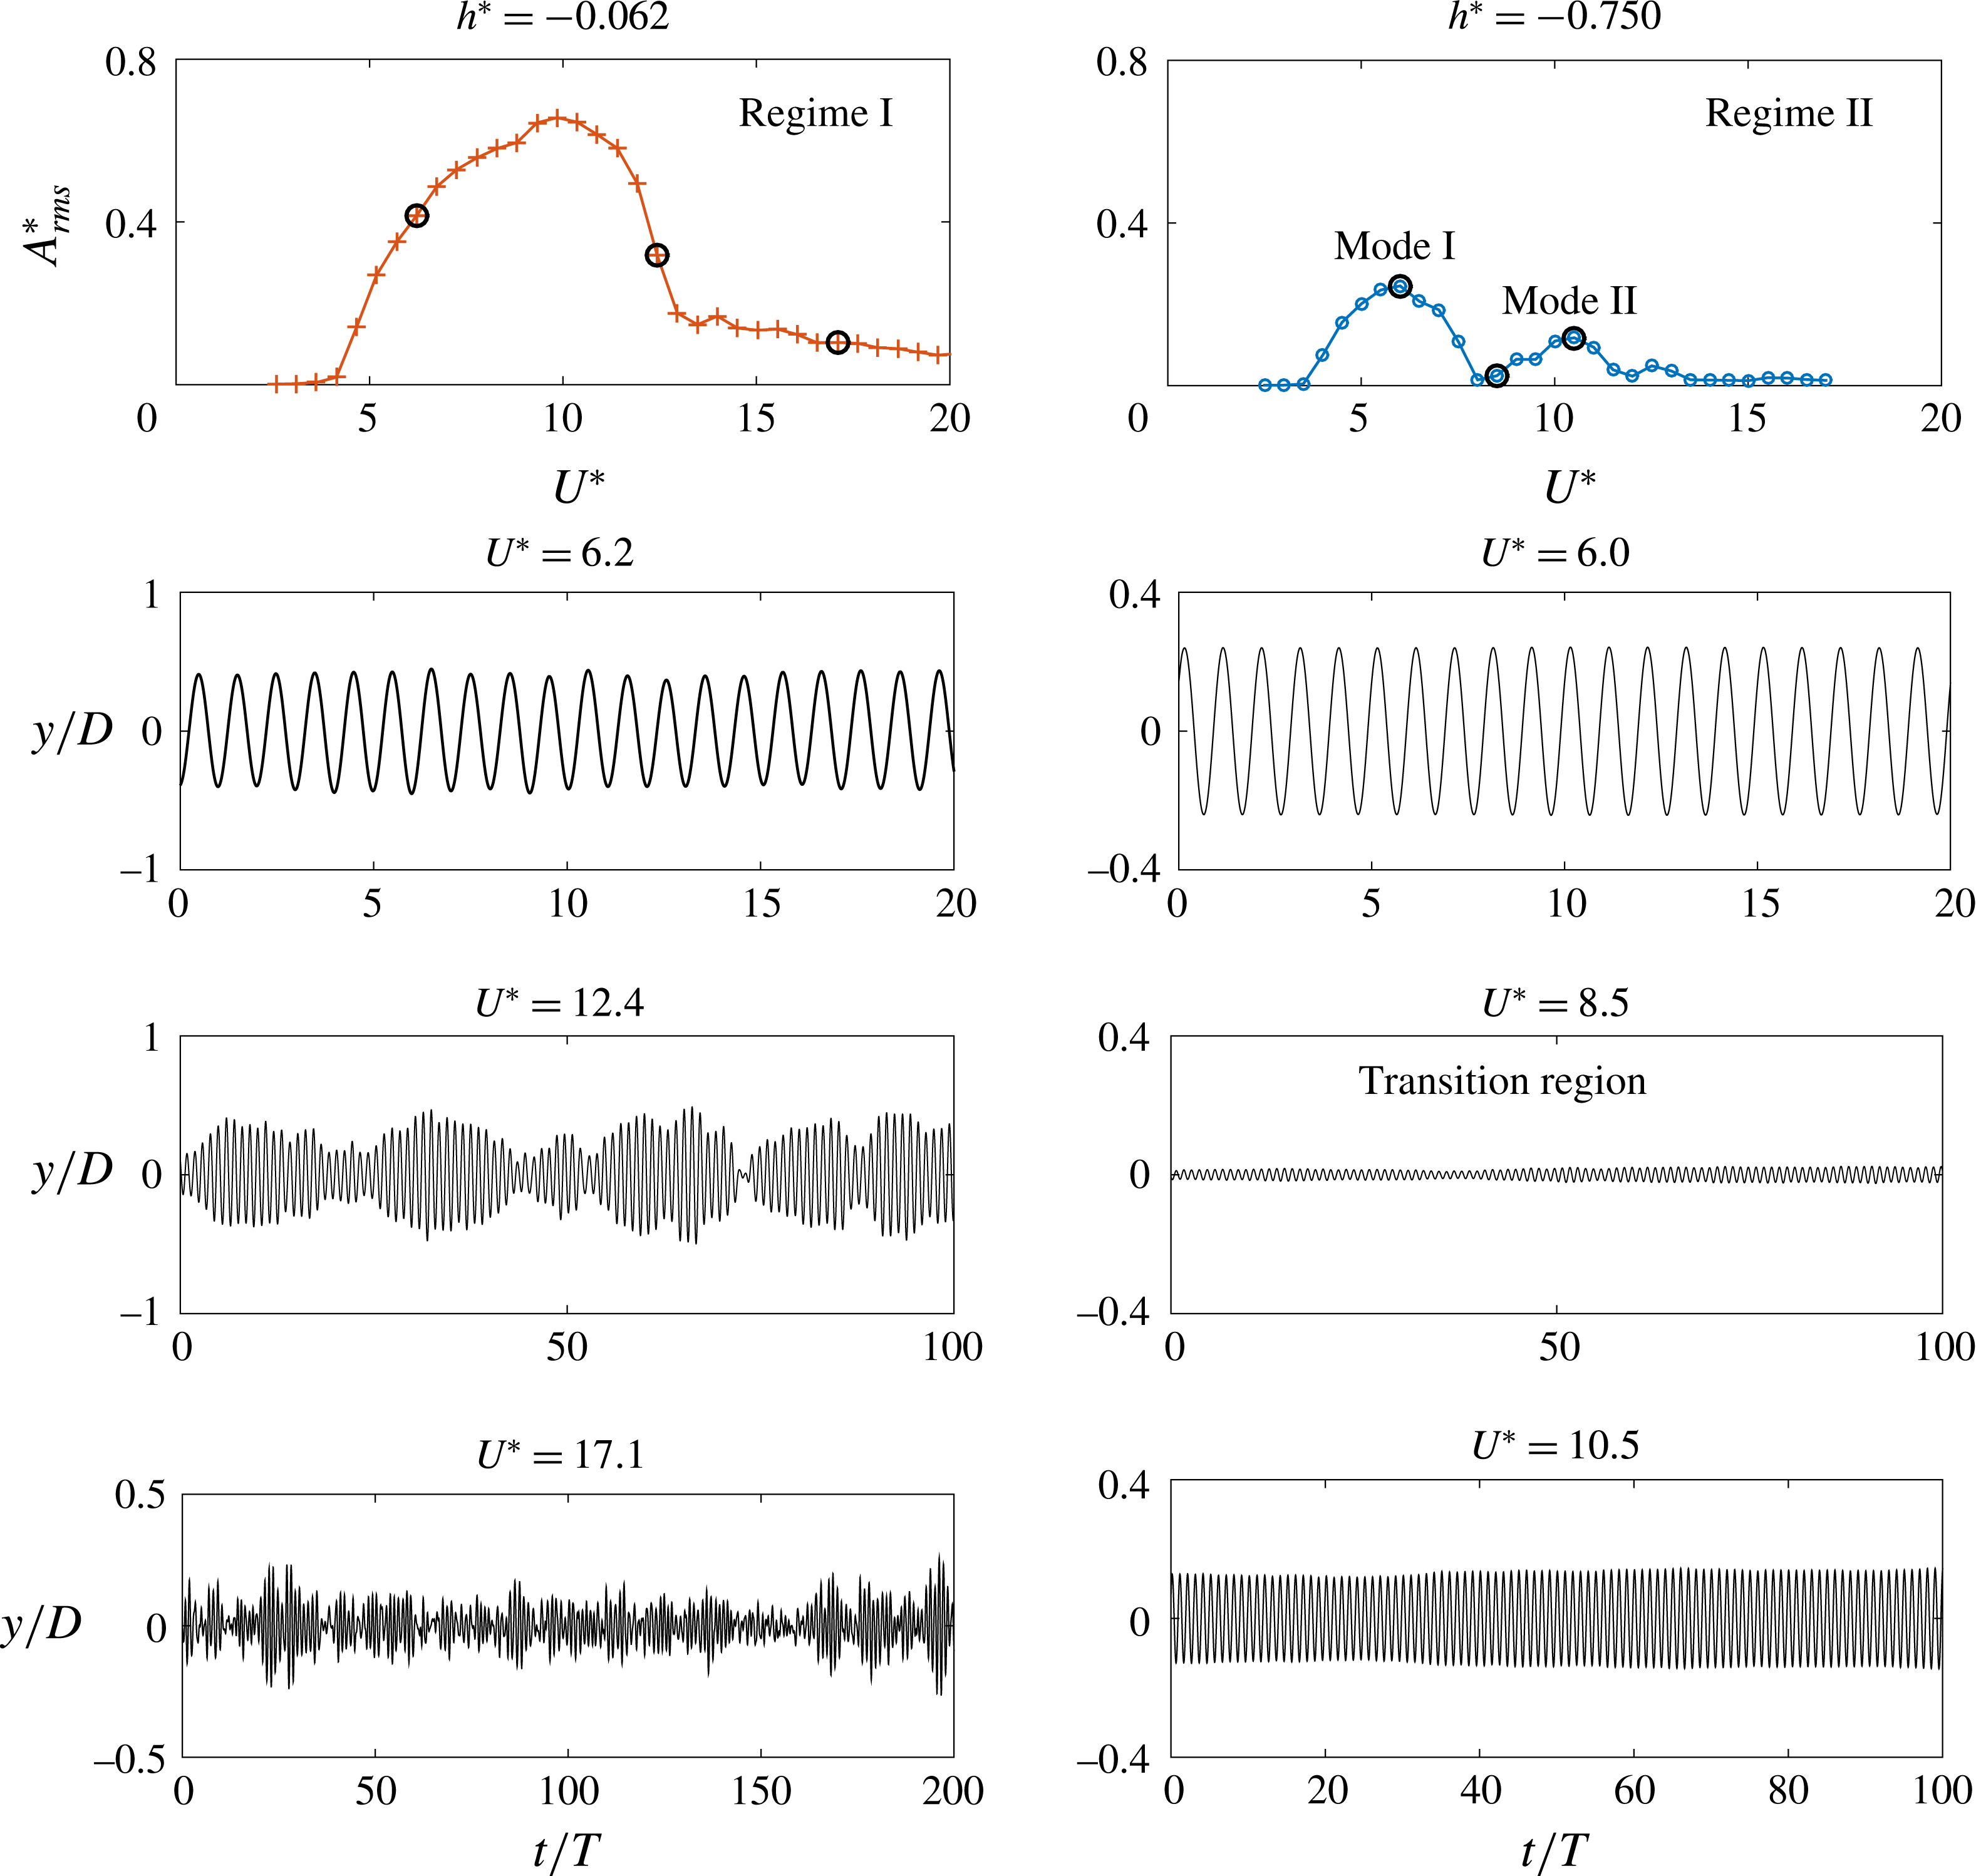
(right). The corresponding amplitude response is shown at the top.

In figure 13, the time trace of the displacement signal is shown at selected
 $U^{\ast }$
values for
 $h^{\ast }=-0.062$
(regime I) and
 $h^{\ast }=-0.750$
(regime II). As evident in regime I (left column), the vibrations are highly periodic for
 $U^{\ast }=6.2$
; however, for
 $U^{\ast }=12.4$
in the decreasing amplitude branch of the response, the vibrations are of similar magnitude but the periodicity has decreased. For
 $U^{\ast }=17.1$
, the vibrations become highly non-periodic and consist of small amplitude intermittent vibrations. This behaviour was found to be typical of all other cases in regime I. In regime II on the other hand, the two peaks are separated by a transition region, where there is a sudden decrease in the amplitude; nevertheless, the vibrations are still locked in.
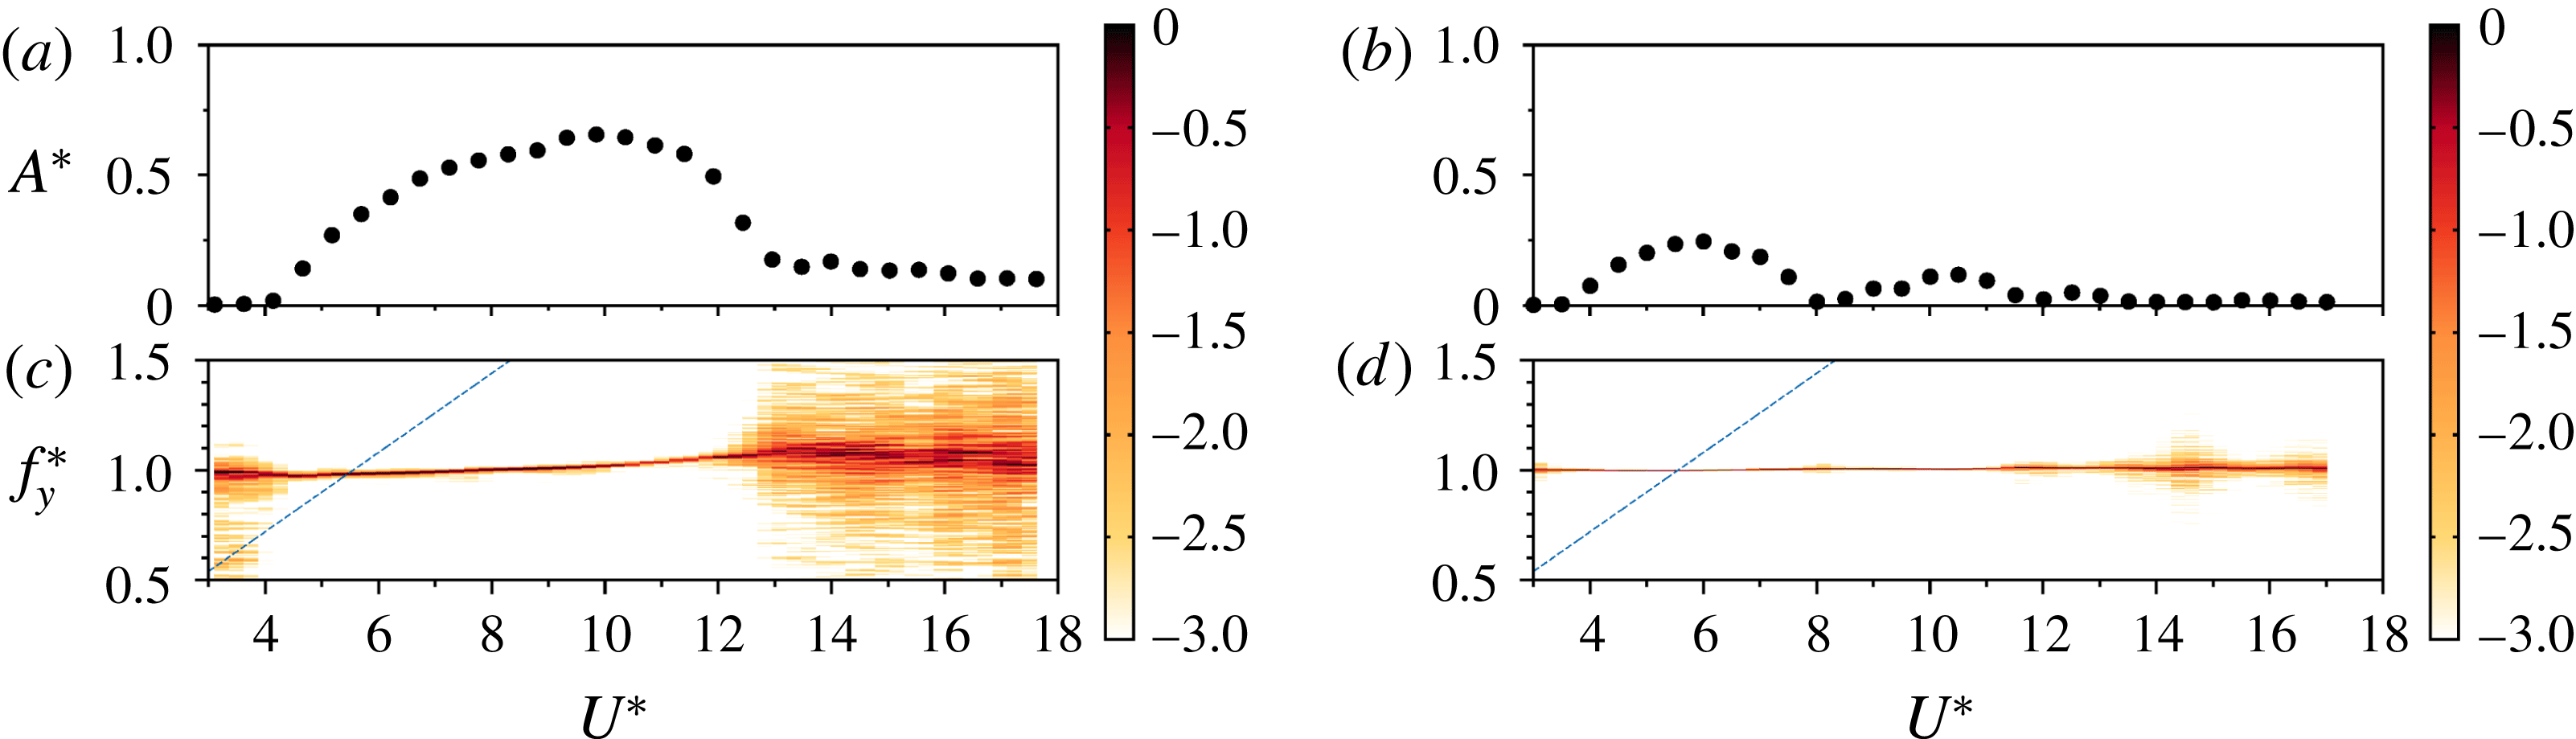
As evident in the frequency contours plots for these
 $h^{\ast }$
values shown in figure 14, there are slight differences in the frequency spectrum as well in the two regimes. For
 $h^{\ast }=-0.062$
, there is an increase in the frequency of vibration (albeit small) as the response progresses from the increasing
 $A^{\ast }$
branch to the decreasing
 $A^{\ast }$
branch extending towards a highly non-periodic vibration branch at higher
 $U^{\ast }$
. On the contrary, for
 $h^{\ast }=-0.750$
, the frequency remains constant over the entire range of
 $U^{\ast }$
. The question arises, what causes two peaks in regime II? Insight into the transition between the vibration modes in this scenario can be gained through analysis of the force measurement data, as explained in detail in the following section.
5.2 Force measurements
For 1-DOF VIV, the transition between the principal modes of vibrations is continuous and gradual, unlike for the small mass ratio 2-DOF case. Hence, it is difficult to infer the existence of two modes and their existence boundaries from the amplitude response alone. A careful inspection of the force measurement data can provide insight into the mode transitions. Hence, the total transverse force coefficient,
 ${C_{y}}_{total}$
, and the vortex force coefficient,
 $C_{vortex}$
, were derived from the displacement signal and its time derivatives. The total phase,
 $\unicode[STIX]{x1D719}_{total}$
, and the vortex phase,
 $\unicode[STIX]{x1D719}_{vortex}$
, were also computed to understand the mode transitions in both these regimes.
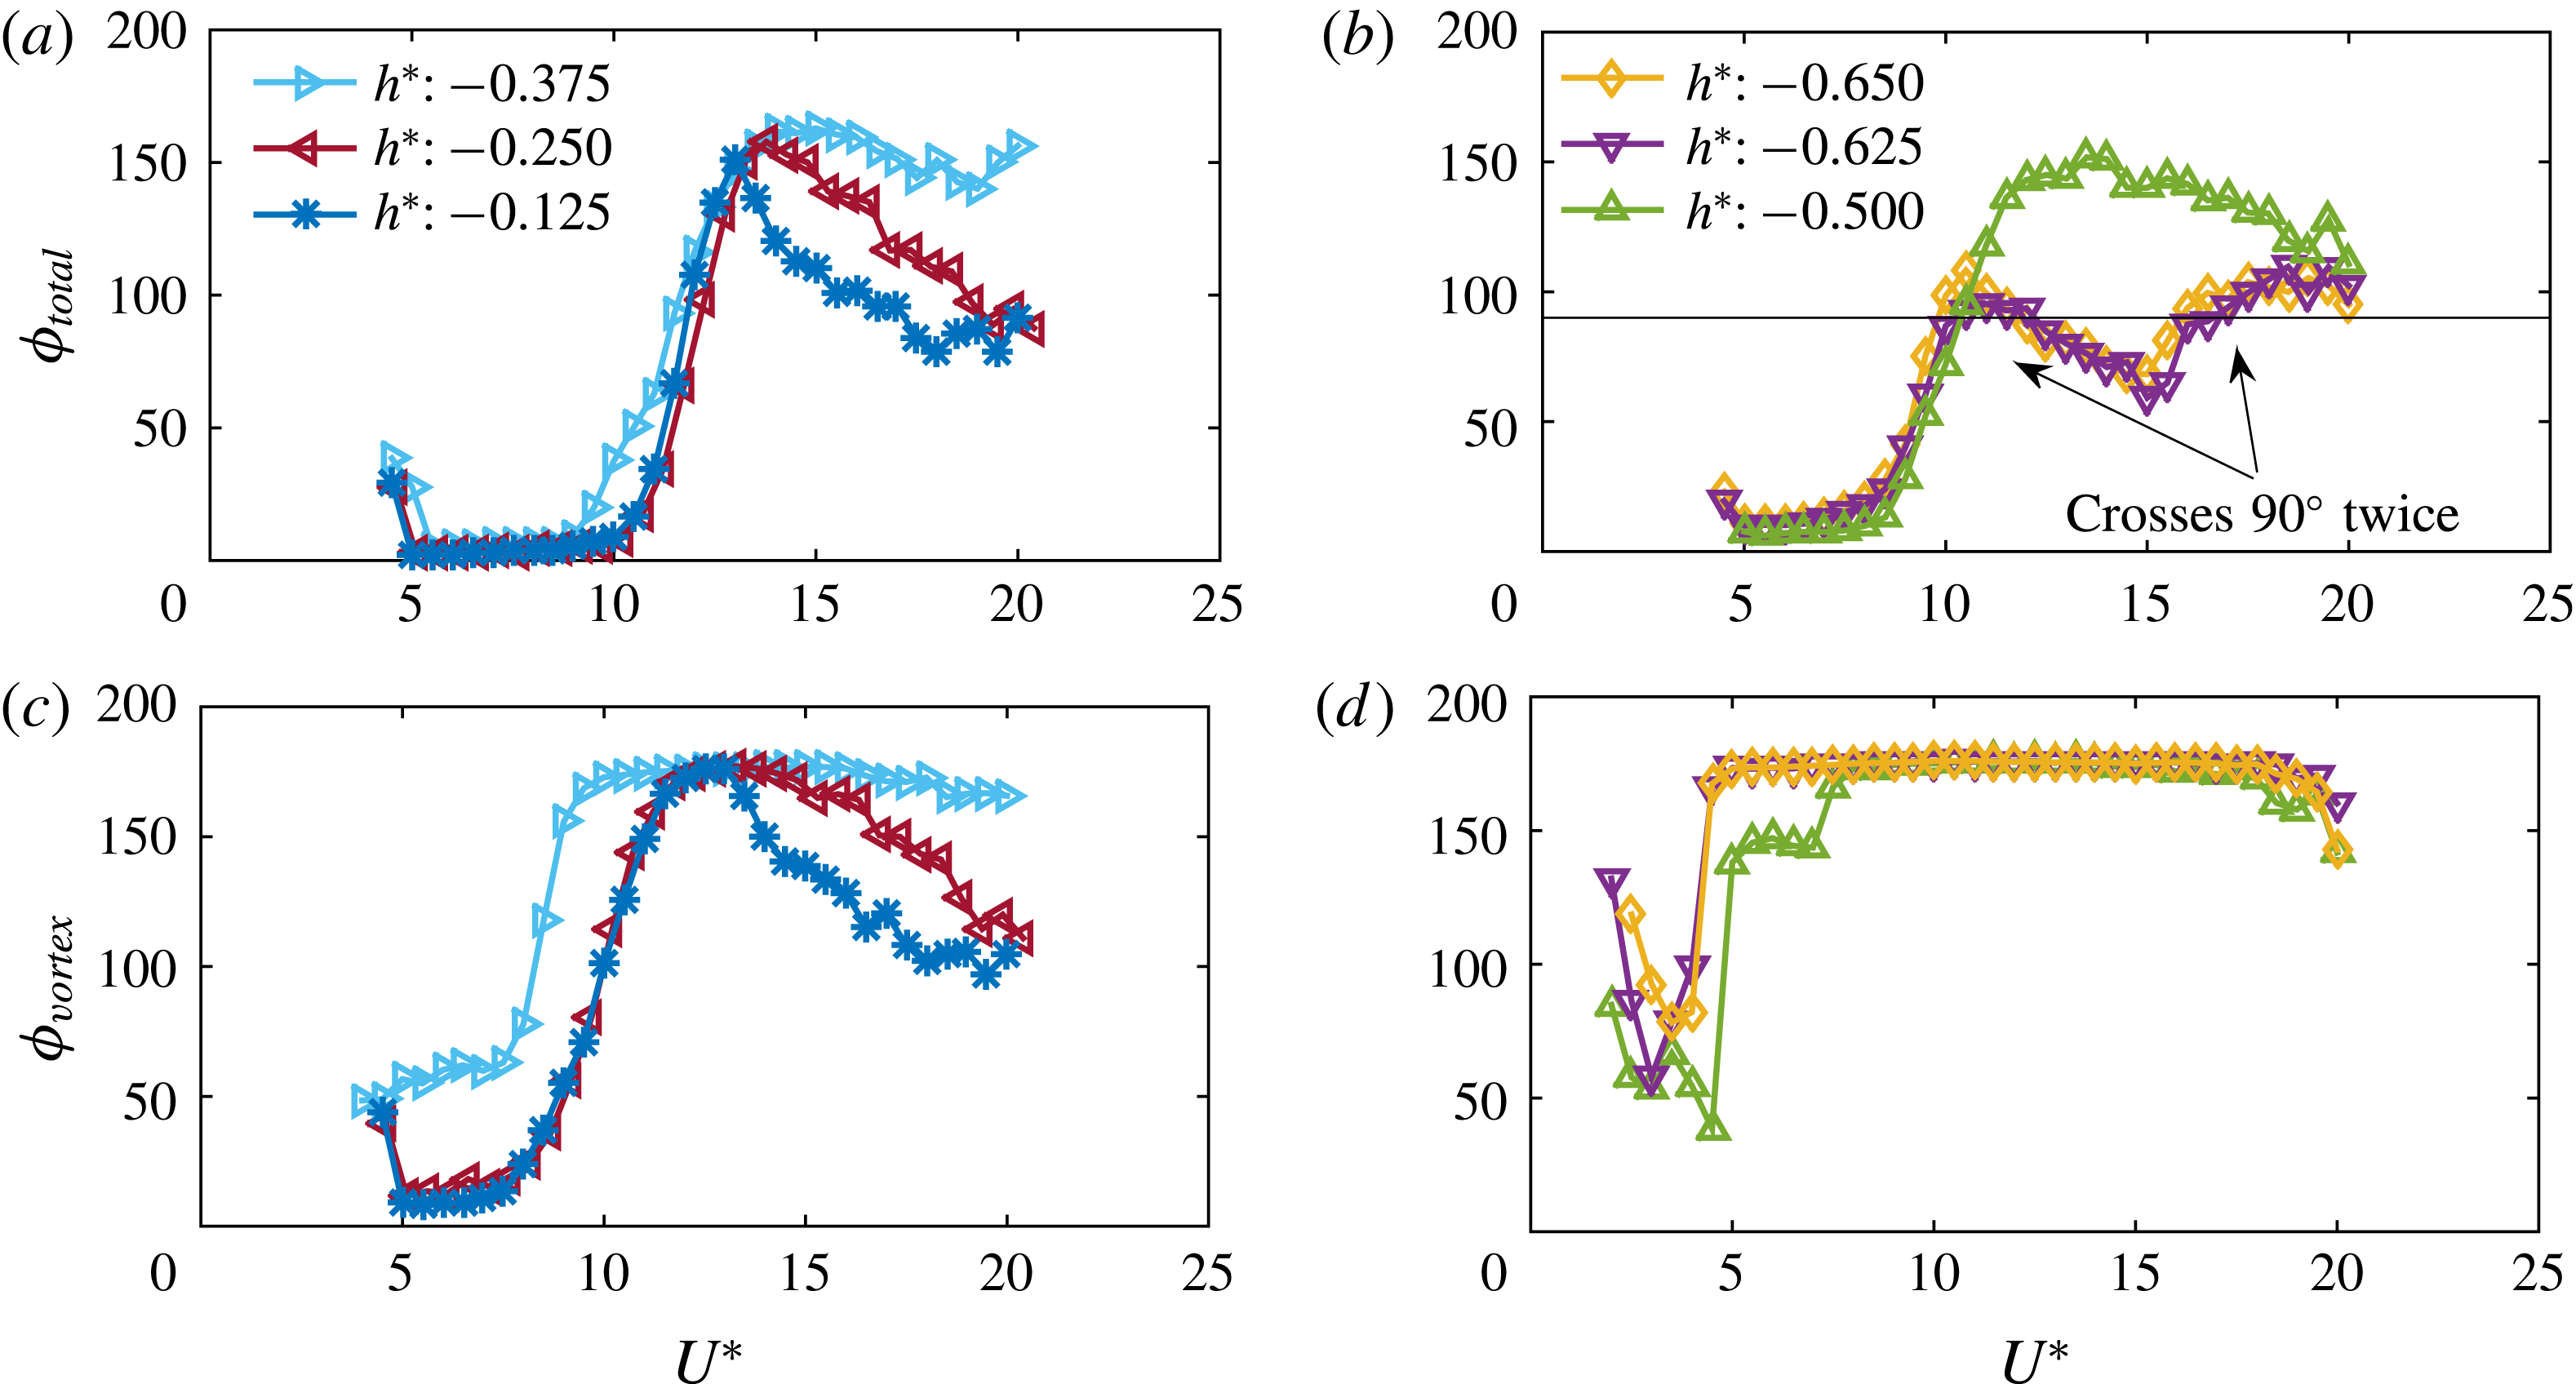
In figure 15, the variation of
 $\unicode[STIX]{x1D719}_{total}$
and
 $\unicode[STIX]{x1D719}_{vortex}$
with
 $U^{\ast }$
is shown for three different
 $h^{\ast }$
values in both the regimes. In regime I, both
 $\unicode[STIX]{x1D719}_{total}$
and
 $\unicode[STIX]{x1D719}_{vortex}$
increase from lower values to up to
 ${\sim}170^{\circ }$
, indicating the presence of mode I and II vibrations. In contrast,
 $\unicode[STIX]{x1D719}_{vortex}$
in regime II jumps up to
 ${\sim}170^{\circ }$
during lock-in and remains constant over the entire
 $U^{\ast }$
range. For
 $h^{\ast }=-0.625$
and
 $h^{\ast }=-0.500$
, where two peaks in the amplitude response were observed (see figure 12), the total phase crosses
 $90^{\circ }$
twice, in line with the presence of two peaks in the amplitude response. However, it is difficult to infer from this what is the physical basis of the two peaks. A careful inspection of the
 $C_{vortex}$
variation helps to make the picture clearer.
Variation of the frequency response (c,d) correlated with the amplitude response (a,b) for two different semi-submerged cases: (a,c)
 $h^{\ast }=-0.062$
, with the sphere slightly piercing the surface; (b,d)
 $h^{\ast }=-0.750$
, where only a small section of the sphere is submerged.

Variation of the total phase,
 $\unicode[STIX]{x1D719}_{total}$
, (a,b) and the vortex phase,
 $\unicode[STIX]{x1D719}_{vortex}$
, (c,d) for three different
 $h^{\ast }$
values in regime I (a,c) and regime II (b,d).

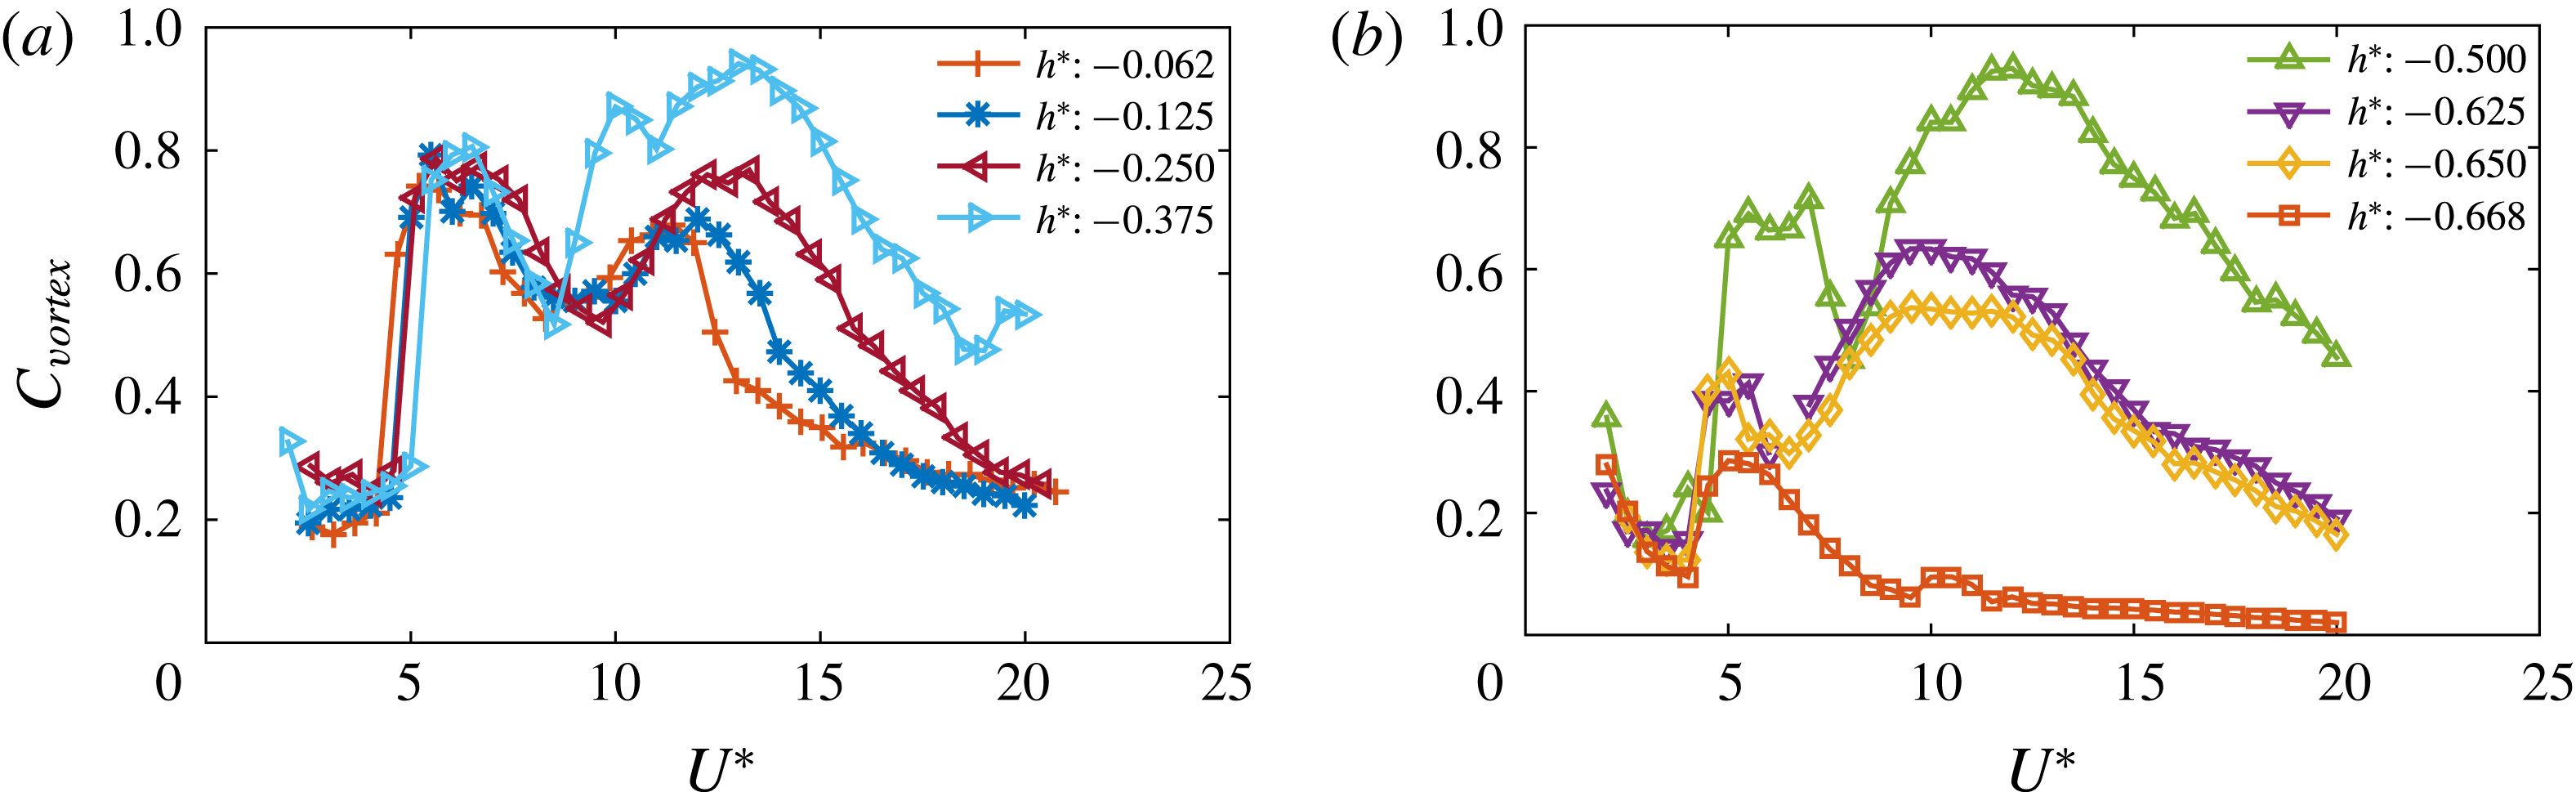
Variation of the vortex force coefficient (
 $C_{vortex}$
) with reduced velocity (
 $U^{\ast }$
) for various immersion ratios: (a) regime I; (b) regime II.

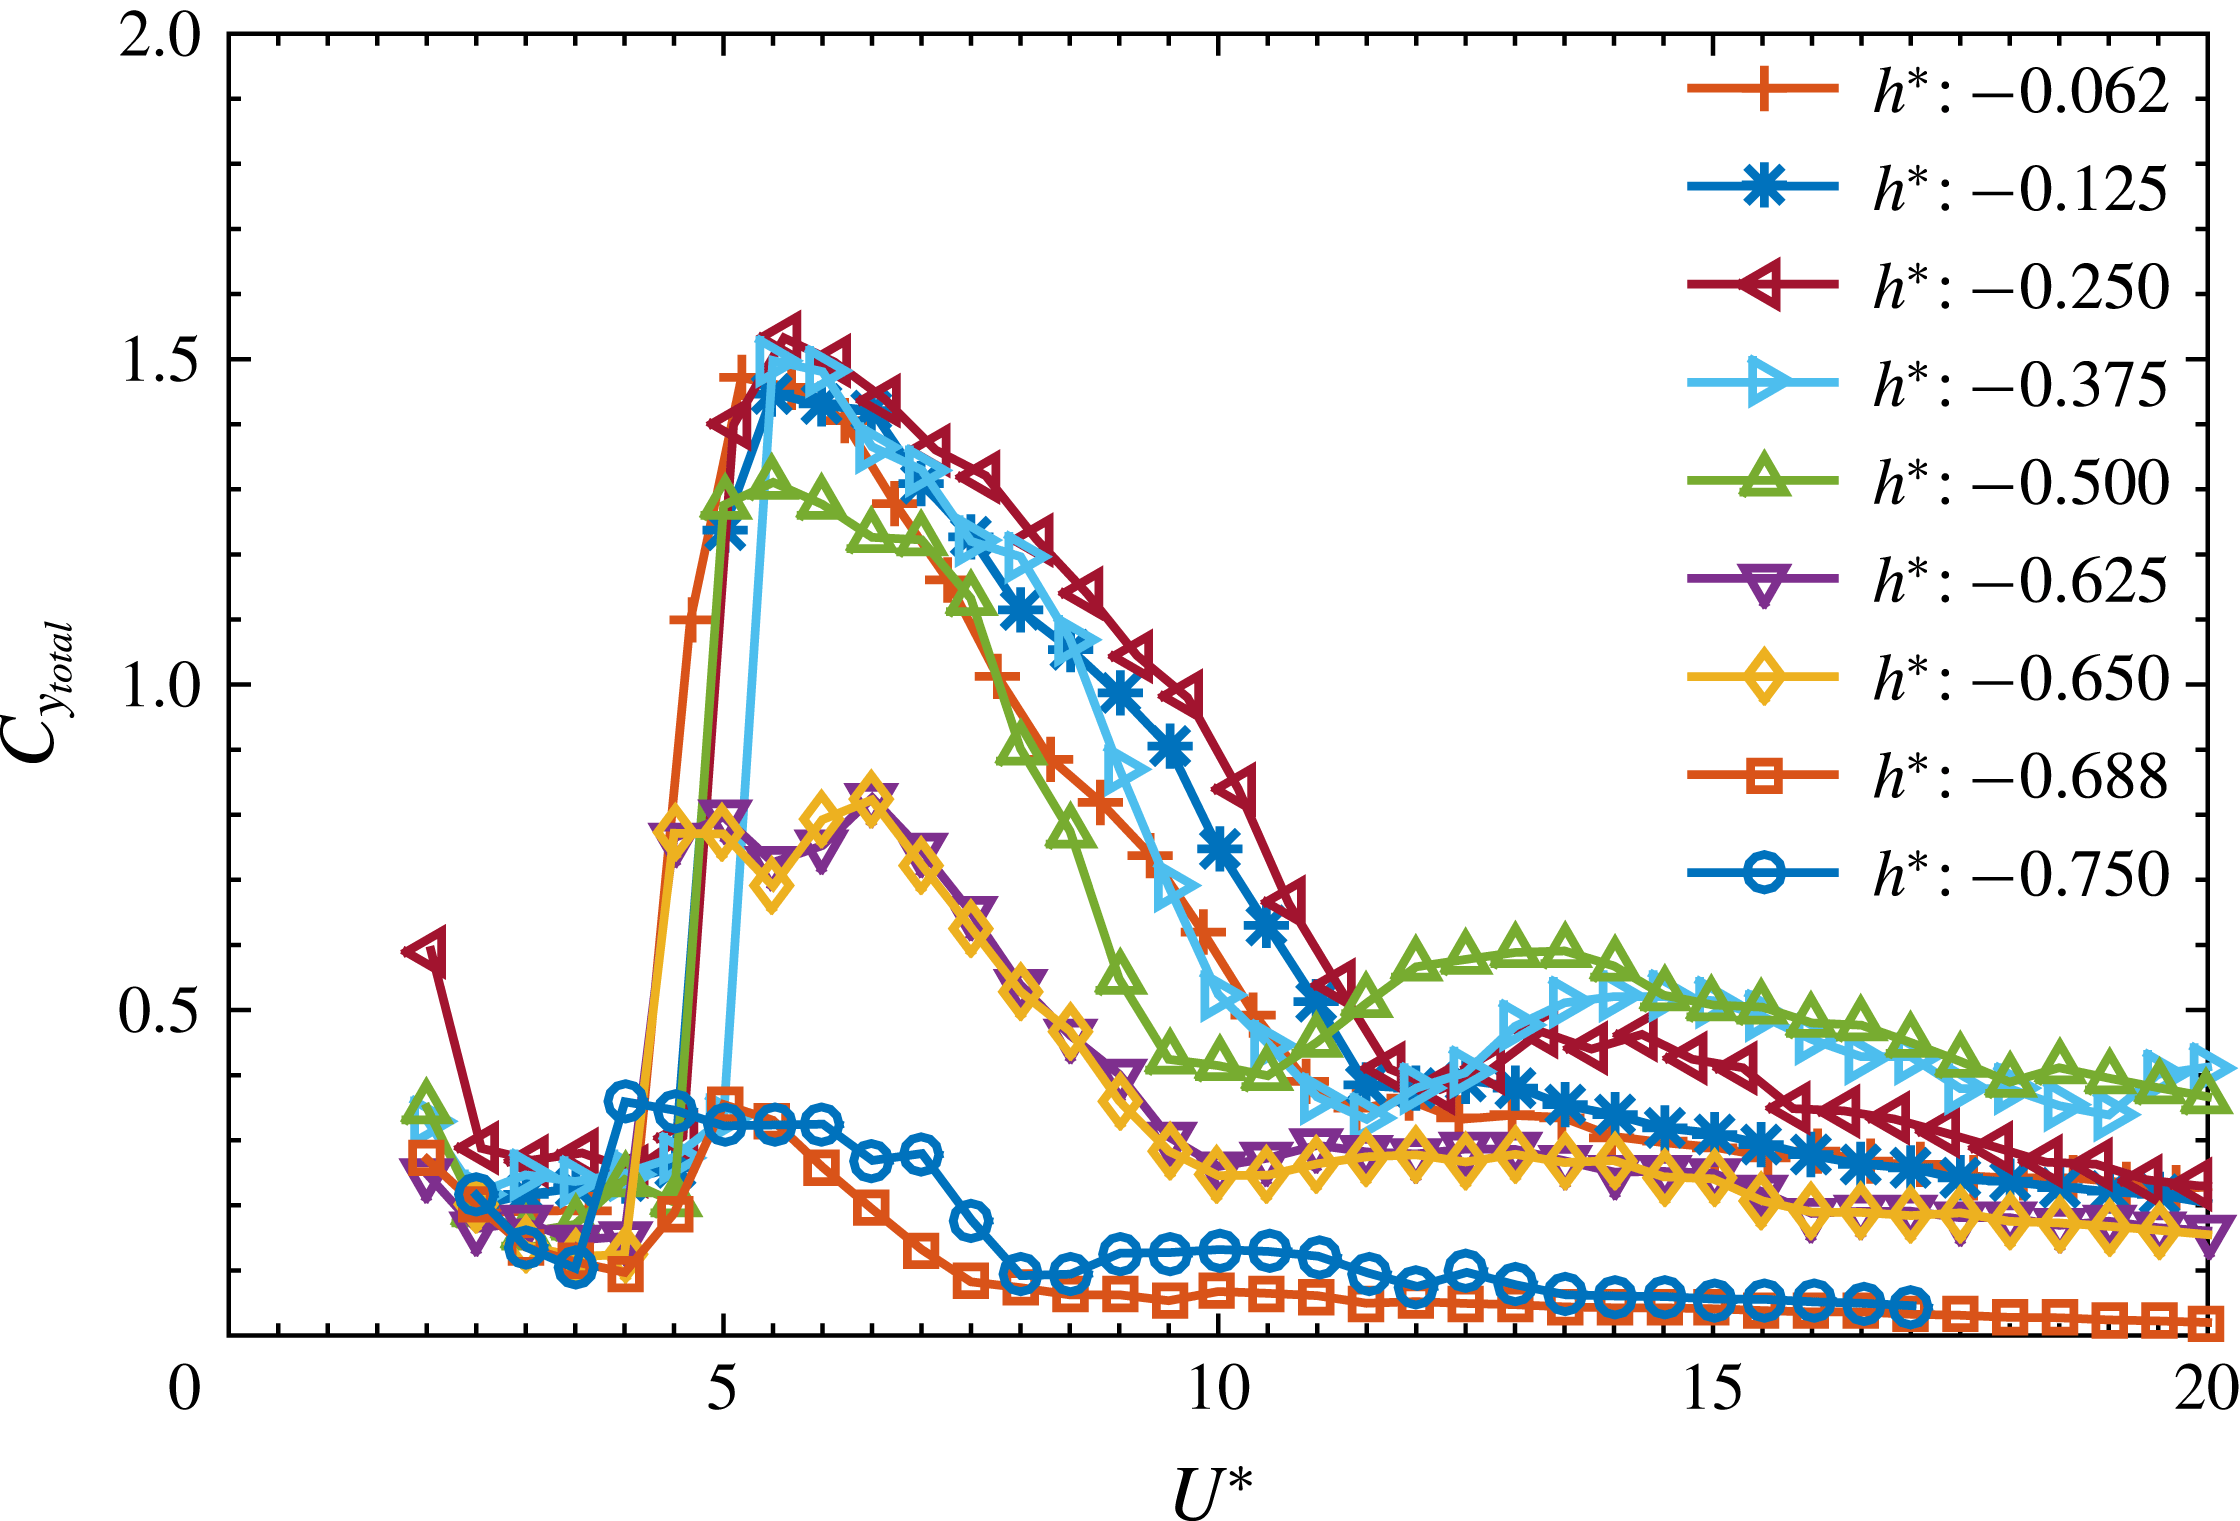
Variation of the total transverse force coefficient,
 ${C_{y}}_{total}$
, with
 $U^{\ast }$
for varying immersion ratios
 $h^{\ast }$
.

Figure 16 shows the variation of
 $C_{vortex}$
for various immersion ratios for both the regimes. As evident in figure 16(a), the vortex force coefficient jumps up abruptly at the vibration lock-in, at approximately
 $U^{\ast }\approx 5$
in these cases, and then starts decreasing. However, for
 $U^{\ast }\approx 8{-}10$
,
 $C_{vortex}$
starts increasing again, indicating the transition to mode II of the vibration response. This trend was also observed by Govardhan & Williamson (Reference Govardhan and Williamson2005) for the 1-DOF fully submerged sphere VIV case. The two peaks in the vortex force indicates these two vibration modes. On the other hand in regime II, it can be observed that the first peak is smaller than the second peak. Also, the transition from the first peak to the second occurs at lower
 $U^{\ast }$
values compared to regime I for
 $h^{\ast }=-0.625$
and
 $-$
0.650. Beyond the transition,
 $C_{vortex}$
gradually increases to a saturation value and then decreases to a lower value with no other peak for all the cases in regime II. It can be conjectured here that there are only two fundamental modes of vibrations for all these cases and there is no mode III, at least within the
 $U^{\ast }$
range studied. The two peaks in regime II indeed correspond to modes I and II.
Figure 17 shows the variation of the total transverse force coefficient,
 ${C_{y}}_{total}$
, with increasing
 $U^{\ast }$
for various
 $h^{\ast }$
values. The total force also follows a similar trend. However, it is not easy to demarcate the two modes and their transitions just by looking at this plot as there is no other peak evident (significantly bigger) for regime II for higher
 $U^{\ast }$
values.
It is an interesting finding that although for a 1-DOF sphere VIV, there is no clear demarcation between the two modes for the fully submerged case, the VIV response of a semi-submerged sphere can show a transition region between the two where the amplitude drops, in line with the transition between the two vibration modes seen in low mass ratio tethered sphere studies.
5.3 Effect of Froude number
The Froude number (
 $Fr$
) is an important parameter in problems involving proximity to a free surface. It is defined as the ratio of the inertial force to the gravitational force, and it quantifies the deformation at the free surface. In the current problem,
 $Fr$
can be defined as
 $Fr=U/\sqrt{gD}$
for a fixed
 $h^{\ast }$
case.
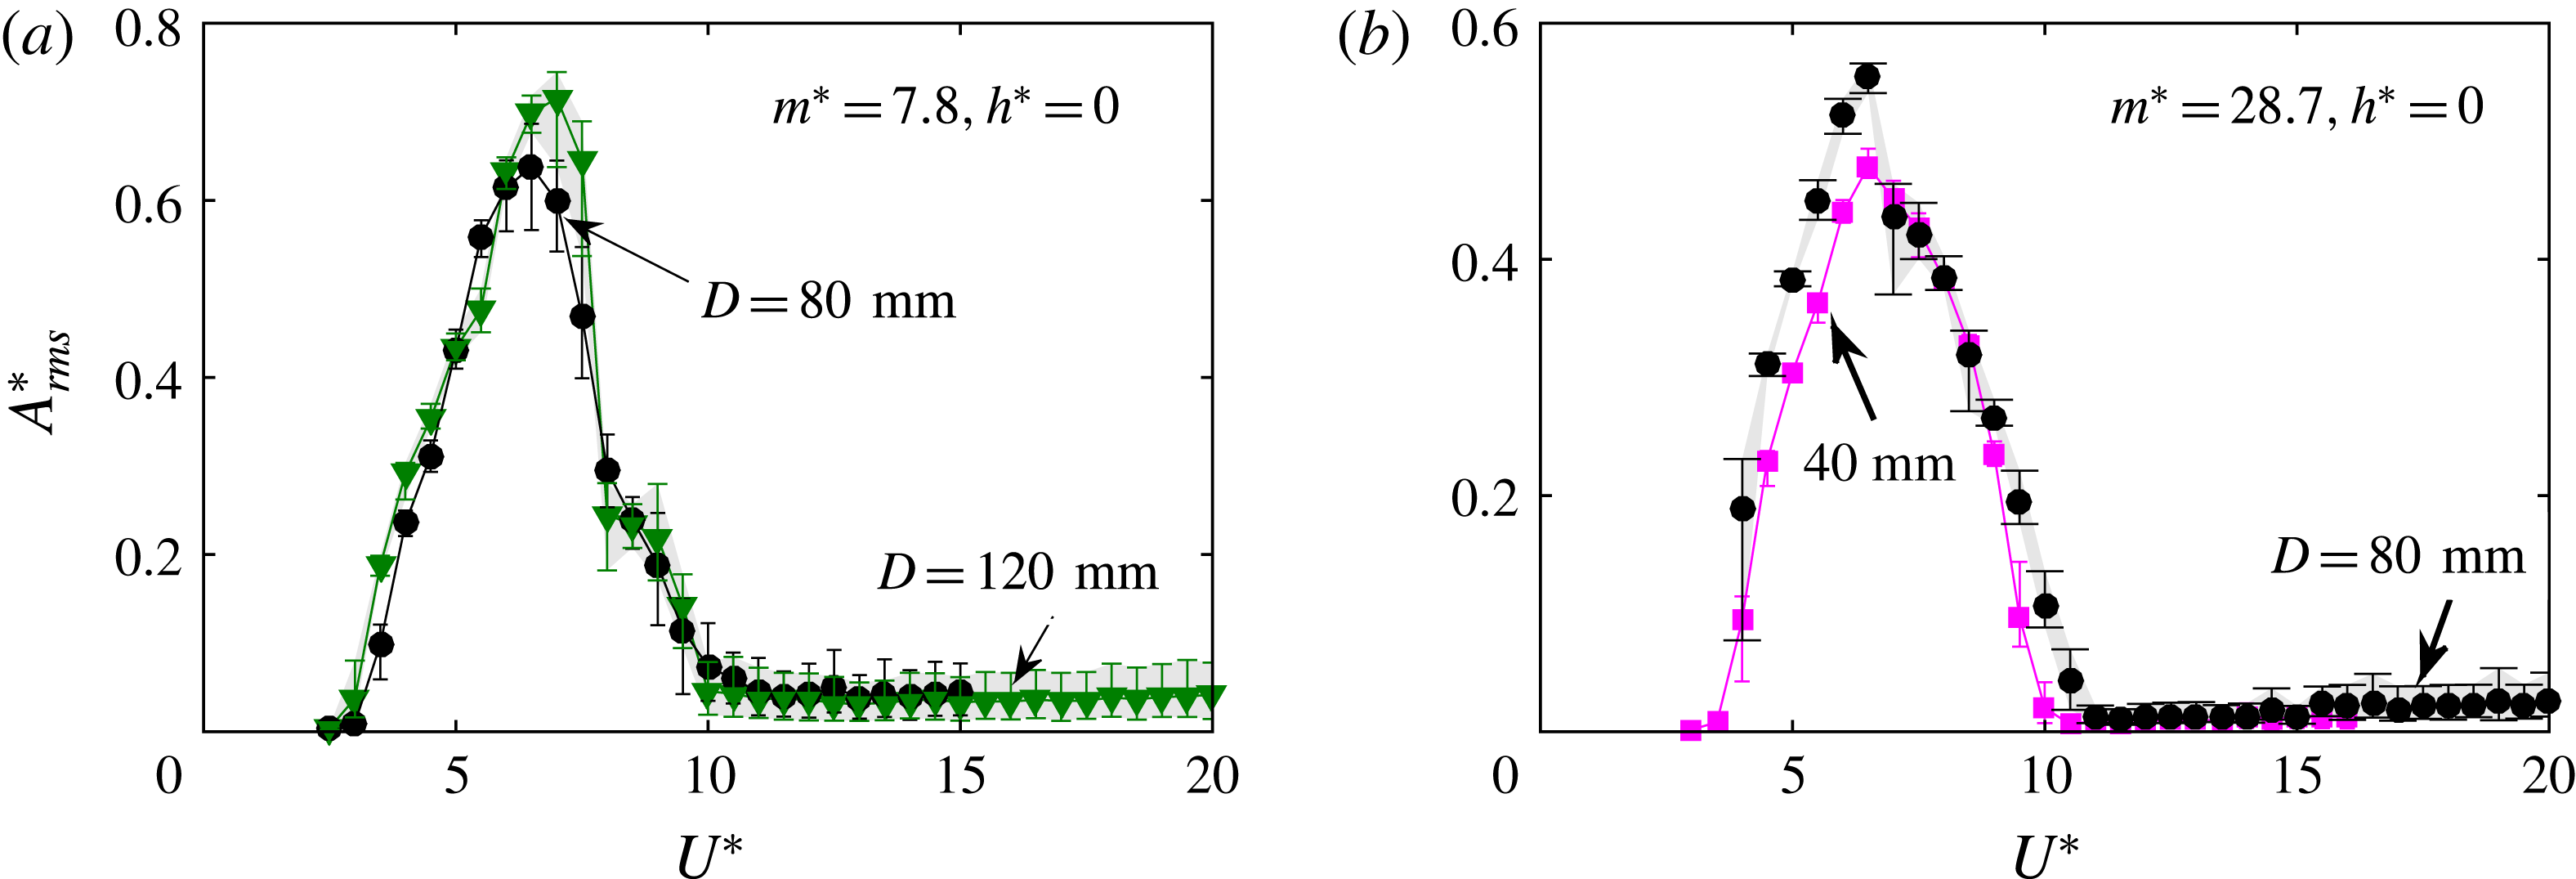
Effect of Froude number on the amplitude response curves for the case when the sphere is just touching the free surface. (a) Mass ratio
 $m^{\ast }=7.8$
for spheres of diameter 80 mm and 120 mm. (b) Mass ratio
 $m^{\ast }=28.7$
for spheres of diameter 40 mm and 80 mm. Note that the Froude number varies with reduced velocity as well as sphere diameter.

In the current study, the Froude number is based on the sphere diameter, and
 $Fr$
varies over the range of
 $0.05\leqslant Fr\leqslant 0.45$
for both scenarios: where the sphere is close to the free surface; and also where the sphere pierces the free surface. From previous studies with circular cylinders, it can be conjectured that in this range of Froude numbers, there will no large surface deformations at the free surface leading to any significant wave–wake interactions. Nevertheless, some tests were performed to check the sensitivity of the VIV response to a change in Froude number in this range.
The response was measured for three spheres of different sizes:
 $D=40$
, 80 and 120 mm. Since changing the size of the sphere changes
 $m^{\ast }$
due to change in the displaced fluid mass and the sphere mass, extra weights were placed on top of the air-bearing rig to maintain the same mass ratio, when possible. Figure 18(a) shows the response of a sphere of size
 $120~\text{mm}$
compared to that for a
 $80~\text{mm}$
sphere, for
 $m^{\ast }=7.8$
and
 $h^{\ast }=0$
. The Froude number range changed from
 $0.06\leqslant Fr\leqslant 0.45$
(for the
 $80~\text{mm}$
sphere) to
 $0.03\leqslant Fr\leqslant 0.2$
(for the
 $120~\text{mm}$
sphere); however, no significant change in the shape of the response curve was found. Note here that
 $Fr$
scales with the
 $U$
as well, so it increases with increasing
 $U^{\ast }$
. Similarly, in figure 18(b), the response of a sphere of
 $D=40~\text{mm}$
is shown compared to that for the
 $80~\text{mm}$
sphere, for
 $m^{\ast }=28.7$
and
 $h^{\ast }=0$
. The Froude number range in this case changed from
 $0.06\leqslant Fr\leqslant 0.45$
(for the
 $80~\text{mm}$
sphere) to
 $0.11\leqslant Fr\leqslant 0.6$
(for the
 $40~\text{mm}$
sphere); however, again no significant change in the response curve shape was seen. Despite this, these two figures do show a slight increase in peak amplitude as the diameter of the sphere is increased, or the Froude number is reduced. However, overall, it can be inferred that the VIV response is relatively insensitive to the Froude number in this Froude number range.
For a high Froude number range of
 $Fr\geqslant 2$
, significant wave–wake interactions can be expected for the sphere. Of course, for a 3-D flow past a sphere at this higher Reynolds number, capturing the time-varying surface deformations and their effect on the 3-D structures would be complicated and this remains open for future studies.
In summary, the current results are representative of the general problem of sphere VIV close to or piercing the free surface for a low
 $Fr$
range.
5.3.1 Effect of mass ratio
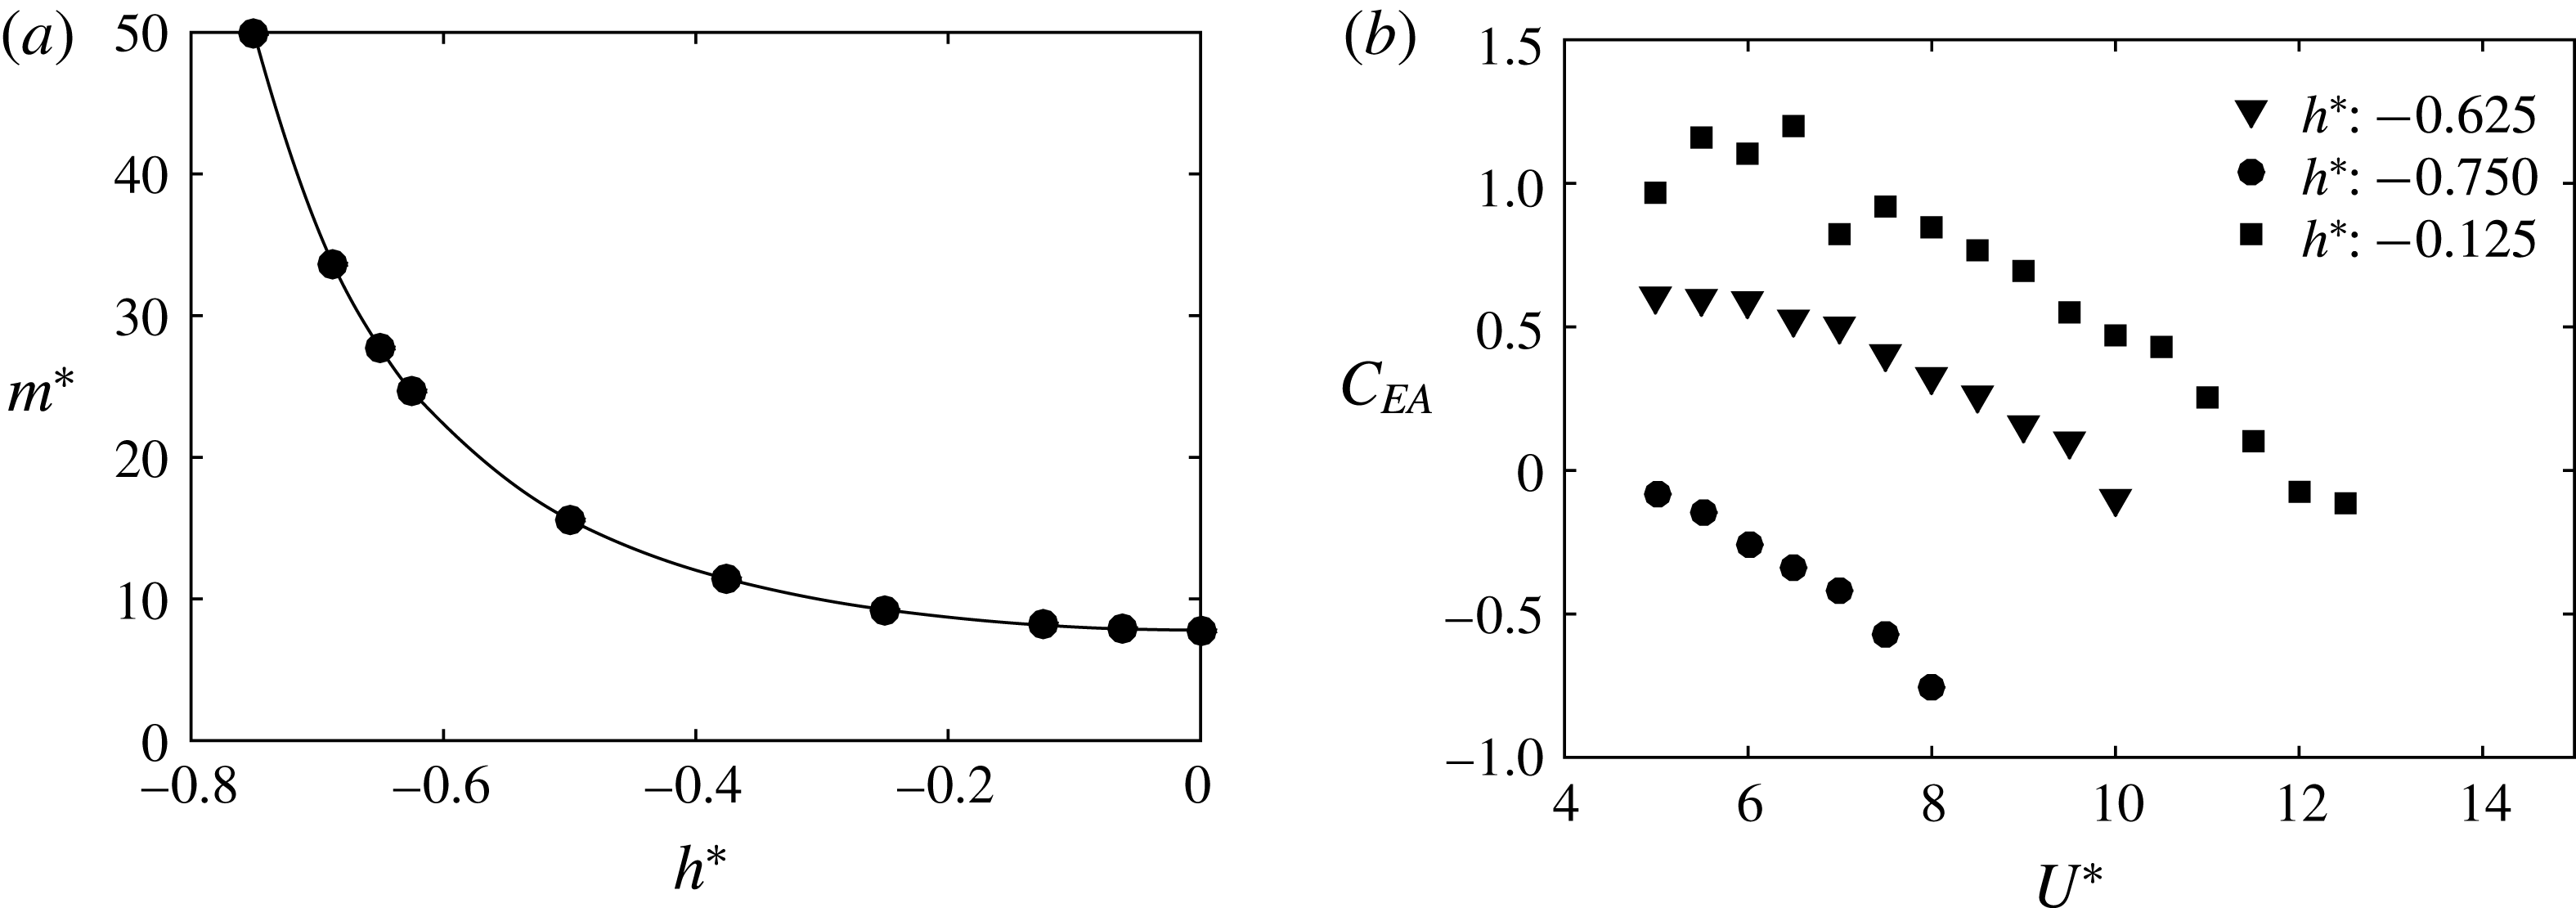
Due to nature of the problem set-up, the displaced fluid mass changes with each immersion ratio for a semi-submerged sphere. This changes the mass ratio and the effective added-mass coefficient for the sphere with each
 $h^{\ast }$
as shown in figure 19(a,b).
(a) Change in the mass ratio as the immersion ratio is varied for the semi-submerged sphere. (b) Variation in the effective added-mass coefficient at different immersion ratios as a function of the reduced velocity.

When the peak amplitude response of a sphere with either 1-DOF (
 $y$
-only motion) or 2-DOF (
 $x$
–
 $y$
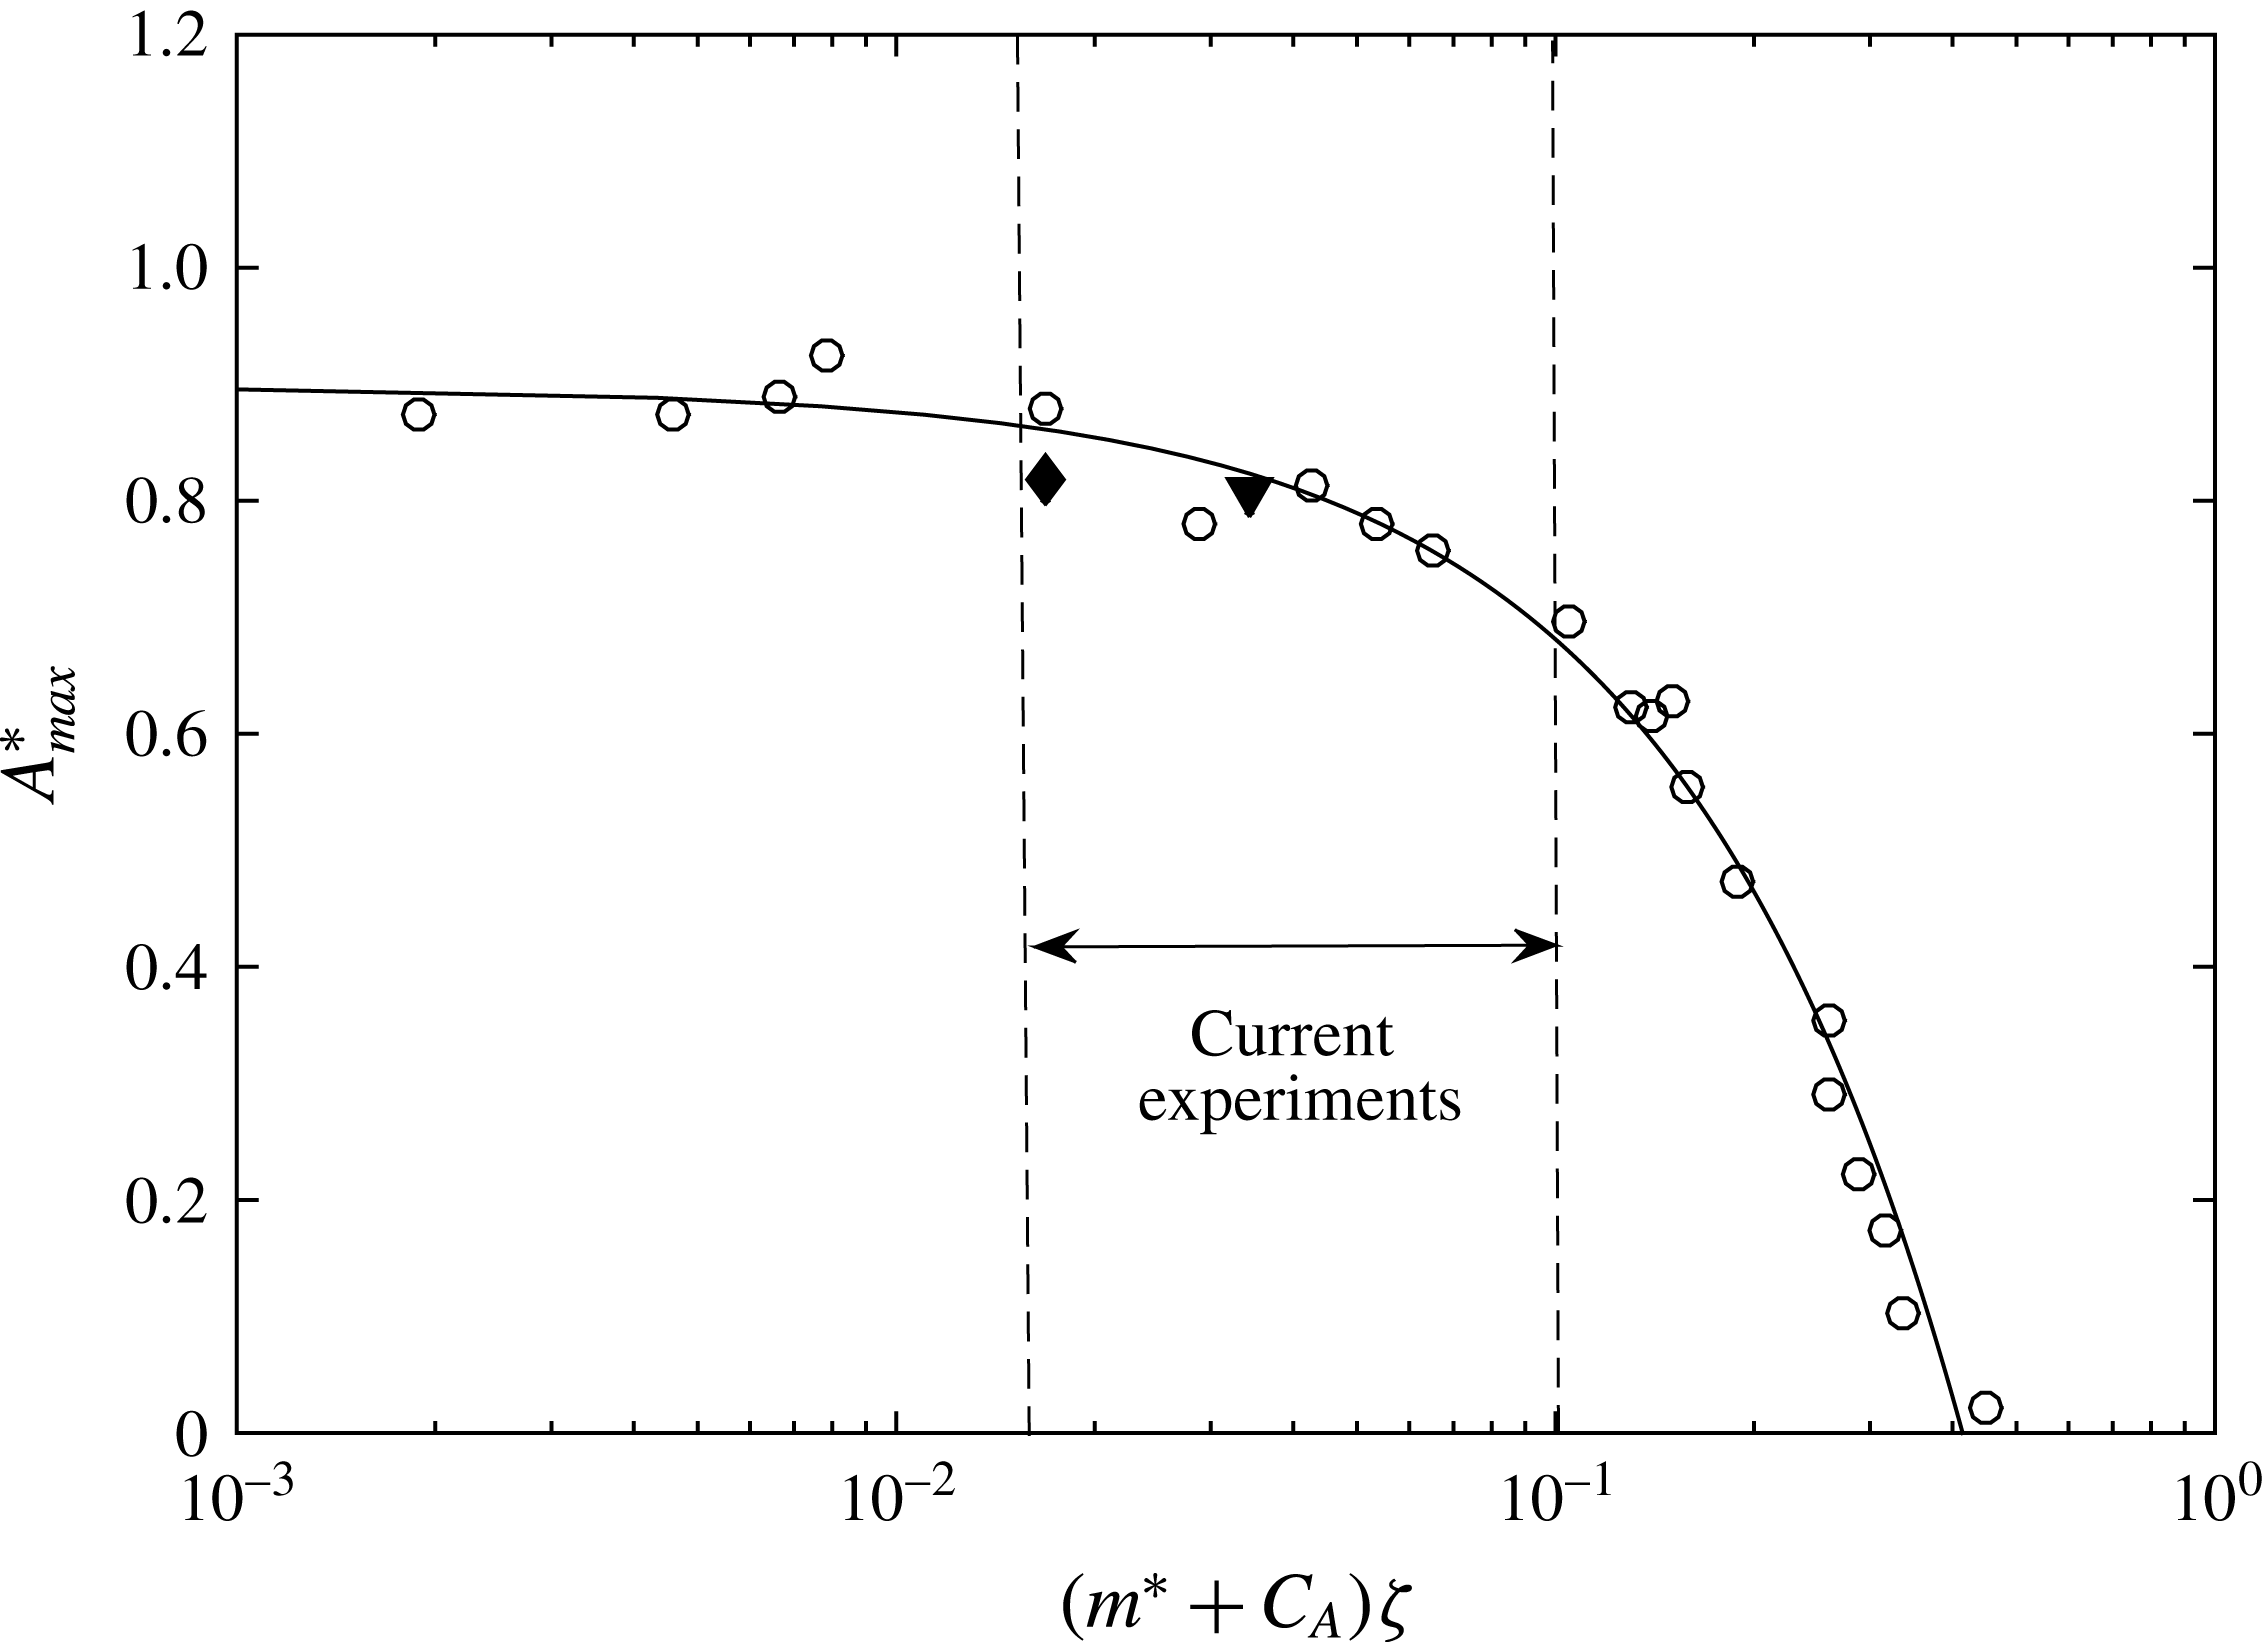
motion) is plotted against the mass-damping parameter, it collapses the data onto a single curve. Such a curve is known as a Griffin plot, as shown in figure 20. The open circles are data reported by Govardhan & Williamson (Reference Govardhan and Williamson2005) for 1-DOF and 2-DOF cases. The peak amplitude for a fully submerged sphere in the current study, plotted as the solid diamond symbol, also falls on the same curve, noting that in practice there is a slight Reynolds number dependence (see Govardhan & Williamson Reference Govardhan and Williamson2006 for the effect on circular cylinder VIV). For the semi-submerged sphere, the mass damping changes substantially from 0.018 to 0.1 as
 $h^{\ast }$
varies from
 $-$
0.062 to
 $-$
0.750. According to figure 20, this should only result in a variation of
 $A_{max}^{\ast }$
of less than 20 %. However, the situation is not quite as simple as this because the semi-submerged immersed body geometry can no longer be described as spherical once part of it lies above the waterline, and the effect of the free surface is to alter the wake, and hence the vortex forcing, considerably, as vorticity diffuses into the free surface. As can be gauged from the data presented in the previous sections, the current problem of a semi-submerged sphere shows characteristics distinct from the fully submerged case. Hence, further tests were undertaken to determine the sensitivity of the response to
 $m^{\ast }$
.
Griffin plot for the VIV of a sphere: variation of
 $A_{max}^{\ast }$
with the mass-damping parameter
 $(m+C_{A})\unicode[STIX]{x1D701}$
. Open circle (
 $\circ$
), the data reported by Govardhan & Williamson (Reference Govardhan and Williamson2005); solid diamond,
 $A_{max}^{\ast }$
for a fully submerged sphere in the current study; solid triangle,
 $A_{max}^{\ast }$
reported by Sareen et al. (Reference Sareen, Zhao, Lo Jacono, Sheridan, Hourigan and Thompson2018).

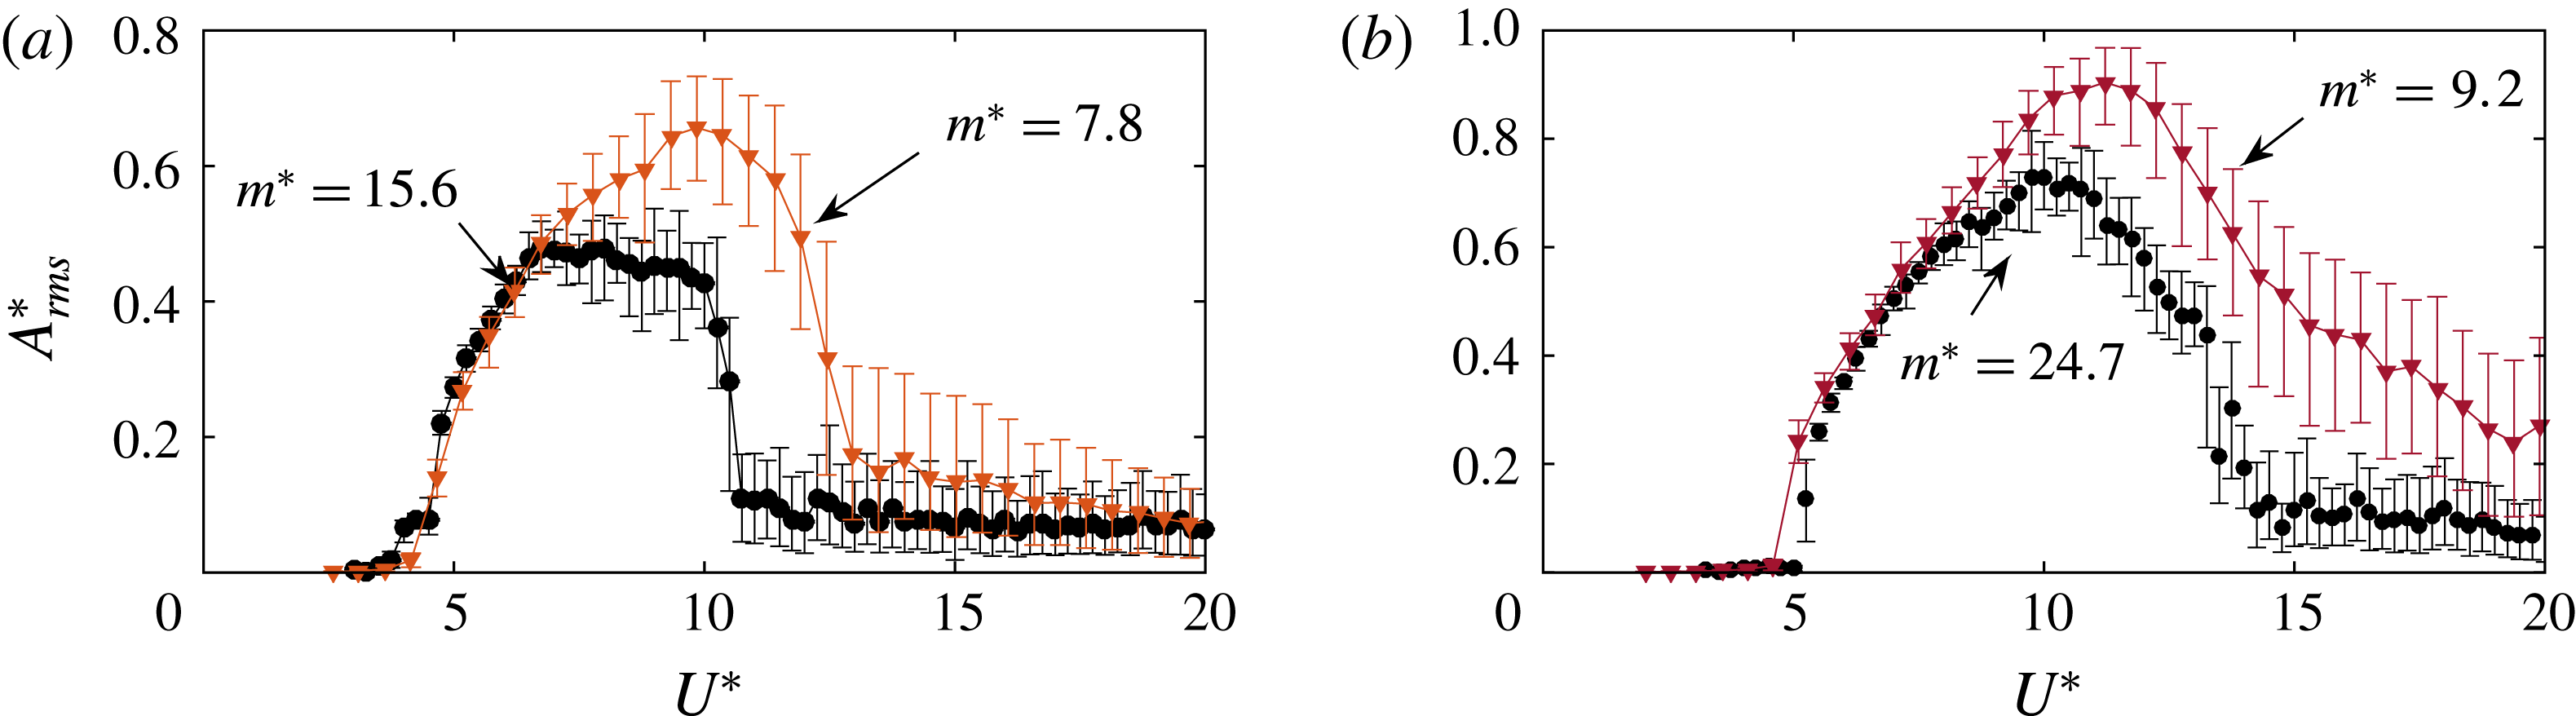
Variation of
 $A_{rms}^{\ast }$
with
 $U^{\ast }$
for different mass ratios: (a)
 $h^{\ast }=-0.062$
; (b)
 $h^{\ast }=-0.25$
.

Figure 21(a) shows the variation of vibration amplitude with
 $U^{\ast }$
for two different
 $m^{\ast }$
values at
 $h^{\ast }=-0.062$
with the sphere just piercing the surface, while figure 21(b) shows the effect of the mass ratio for
 $h^{\ast }=-0.25$
when the sphere has a greater proportion of its volume above the waterline. As evident from these figures, the amplitude response is more sensitive to a change in mass ratio than for the fully submerged case. For instance, for the case when the top of the sphere is just above the water surface at
 $h^{\ast }=-0.062$
, doubling the mass ratio from
 $m^{\ast }=7.8$
to 15.6 (and hence the mass-damping ratio from 0.017 to 0.032) results in a reduction in the peak amplitude of approximately 30 %. However, the predicted variation from the Griffin plot (figure 20) for a fully submerged sphere is only a few per cent. The second case, for
 $h^{\ast }=0.25$
, also shows a much greater reduction than predicted by the Griffin plot variation. Thus, the presence of the free surface has a much stronger effect on the reduction in the peak amplitude with mass-damping ratio. Despite this, the general reduction in the synchronisation range, and the reduction of amplitude at higher
 $U^{\ast }$
values, is consistent with the trend observed for a fully submerged sphere. Unfortunately, limits on the weight that the air-bearing rig could support meant that it was not possible to quantify the effect further at higher mass-damping ratios. However, this clearly indicates that further future work is required in order to fully understand and characterise mass-damping ratio effects on VIV of a semi-submerged sphere.
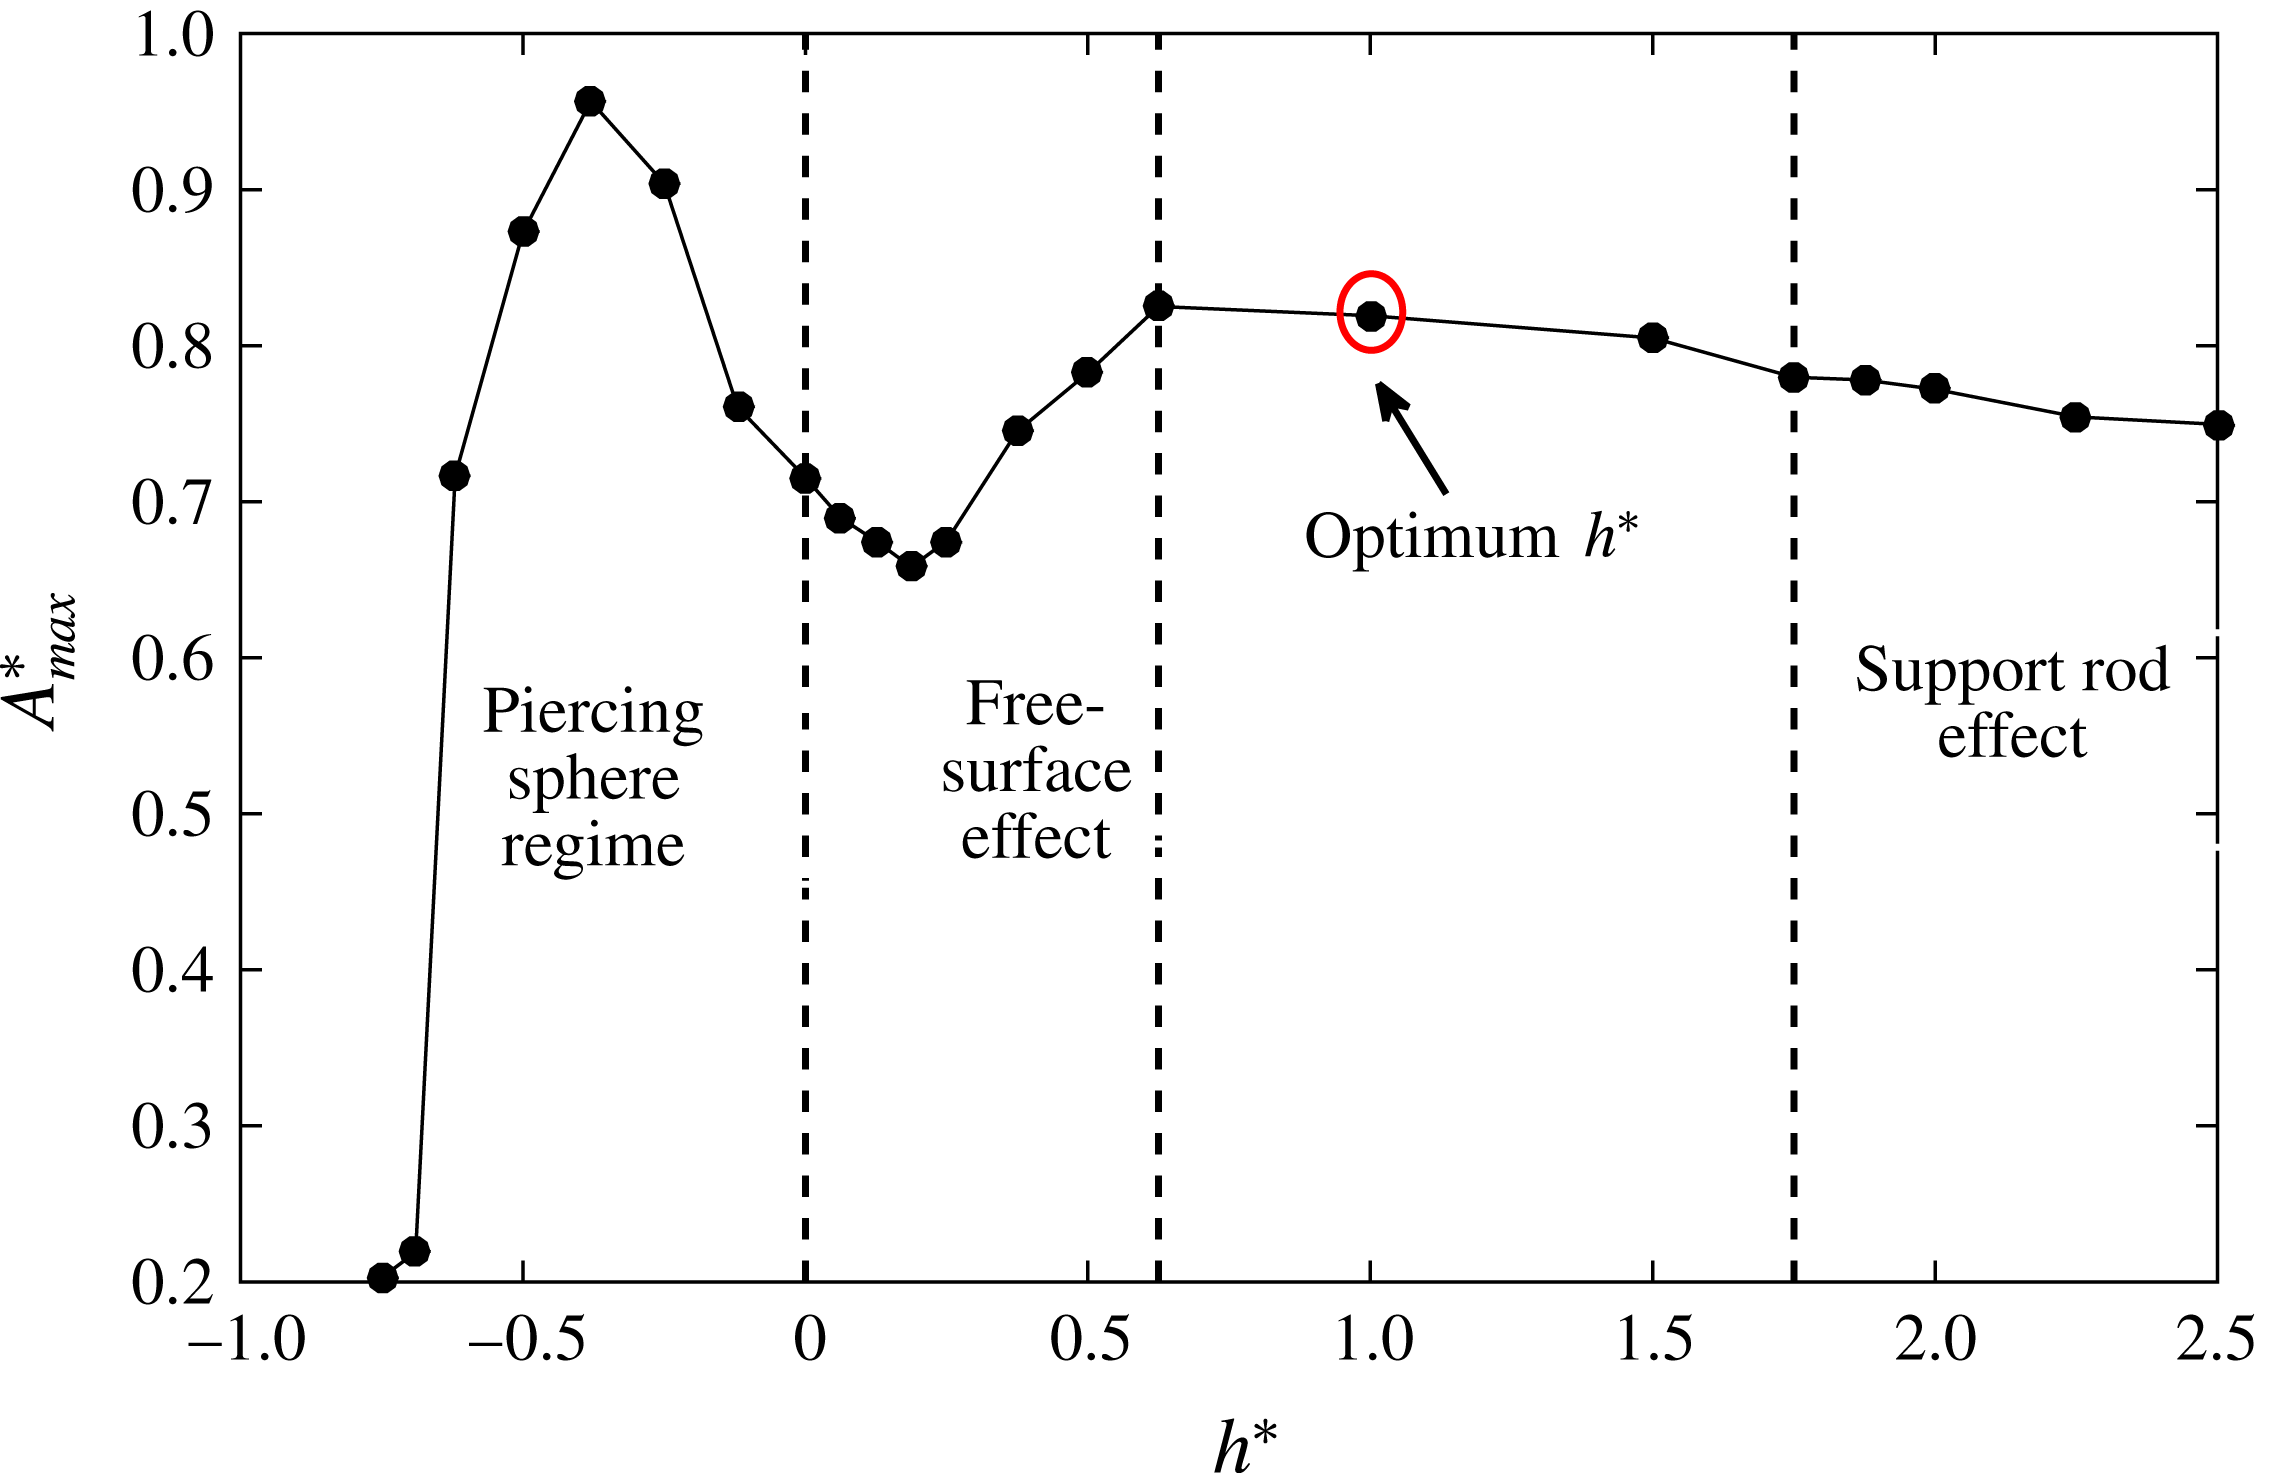
Variation of
 $A_{max}^{\ast }$
with
 $h^{\ast }$
highlighting various regimes where different effects are dominant. The marked (in red) optimum
 $h^{\ast }$
denotes the suggested approximate optimum value of
 $h^{\ast }$
for studying the VIV response of a fully submerged sphere if the support rod and the free-surface effects are to be minimised. The results are shown for
 $D^{\ast }=26.6$
.

6 Effect of the support mechanism
In § 4, the sphere VIV response was studied for immersion ratios varying in the range
 $0\leqslant h^{\ast }\leqslant 1$
. It was shown that for
 $h^{\ast }=1$
, the free-surface effect is negligible (at least in the
 $U^{\ast }$
range
 $0\leqslant U^{\ast }\leqslant 20$
), and the response matched well with the previous study of a fully submerged sphere (Govardhan & Williamson Reference Govardhan and Williamson2005) (who also used
 $h^{\ast }\sim 1$
). For higher immersion ratios (
 $h^{\ast }>1$
), one expects to see the response of a fully submerged sphere. However, in the current study, when the immersion ratio was increased from
 $1<h^{\ast }\leqslant 2.5$
, another regime was found, where the support-rod effects were dominant. Mode I and mode II were found to be quite robust to the changes in immersion depths; however, the response in the ‘plateau’ branch was greatly influenced. It was found that not only the immersion ratio but also the diameter ratio (
 $D^{\ast }=D/D_{r}$
), with
 $D_{r}$
being the support-rod diameter, can have significant influences on the vibration amplitude response. More detailed discussions on the support rod and submergence effects are provided in appendix A as they may be useful for future studies.
6.1 Peak response variation with submergence ratio
Figure 22 shows the variation of peak amplitude,
 $A_{max}^{\ast }$
, with the immersion ratio,
 $h^{\ast }$
, summarising the results in the current and previous sections. Based on the current study, the response can be conveniently categorised into several regimes where certain effects are dominant. Amongst other things, this figure highlights that the suggested optimum
 $h^{\ast }$
for studying the response of a fully submerged sphere, if free surface and support-rod effects are to be minimised, corresponds to
 $h^{\ast }\approx 1D$
. However, there are also strong effects of
 $D^{\ast }$
on the peak response, and both
 $h^{\ast }$
and
 $D^{\ast }$
strongly affect the amplitude response at higher reduced velocities beyond where the peak response occurs.
7 Wake measurements
7.1 Vorticity measurements in the cross-plane
In terms of VIV wake dynamics, the central distinction between a three-dimensional body like a sphere, and its two-dimensional counterpart, the cylinder, is that VIV of a sphere is induced by streamwise vorticity. This is in contrast to the cylinder whose dynamics are mainly induced by spanwise vortex structures in the wake. The generation of lift from the presence of streamwise vortex structures in the former case is analogous to the induced force on an aircraft wings due to counter-rotating trailing tip vortices. Govardhan & Williamson (Reference Govardhan and Williamson2005) demonstrated this by comparing the direct force measurements from a force sensor to the vortex force calculated using the knowledge of strength and spacing of the streamwise vortices. Therefore, the principal conclusion one may draw is that most of the transverse force on the sphere is associated with the streamwise vorticity, and with the knowledge of the strength of the upper vortex and the spacing between the vortex pair, one may deduce the vortex force acting on the sphere. As performed for a sphere undergoing VIV with 1-DOF by Govardhan & Williamson (Reference Govardhan and Williamson2005), the vortex force (or the lift force) acting on the sphere in this case can be given by the expression
 $$\begin{eqnarray}F_{vortex}=-\unicode[STIX]{x1D70C}U_{v}\unicode[STIX]{x1D70F}b,\end{eqnarray}$$
where
 $U_{v}$
is the convection speed of the trailing vortices,
 $\unicode[STIX]{x1D70F}$
is the strength of the upper vortex and
 $b$
is the spacing between the vortices.
Particle image velocimetry (PIV) measurements in a plane normal to the flow can reveal important insights into the temporal evolution of streamwise vorticity as the vortex loops pass through the cross-plane. Hence, in the current study, the measurement of the streamwise vorticity has been carried out in a cross-plane at a distance of
 $1.5D$
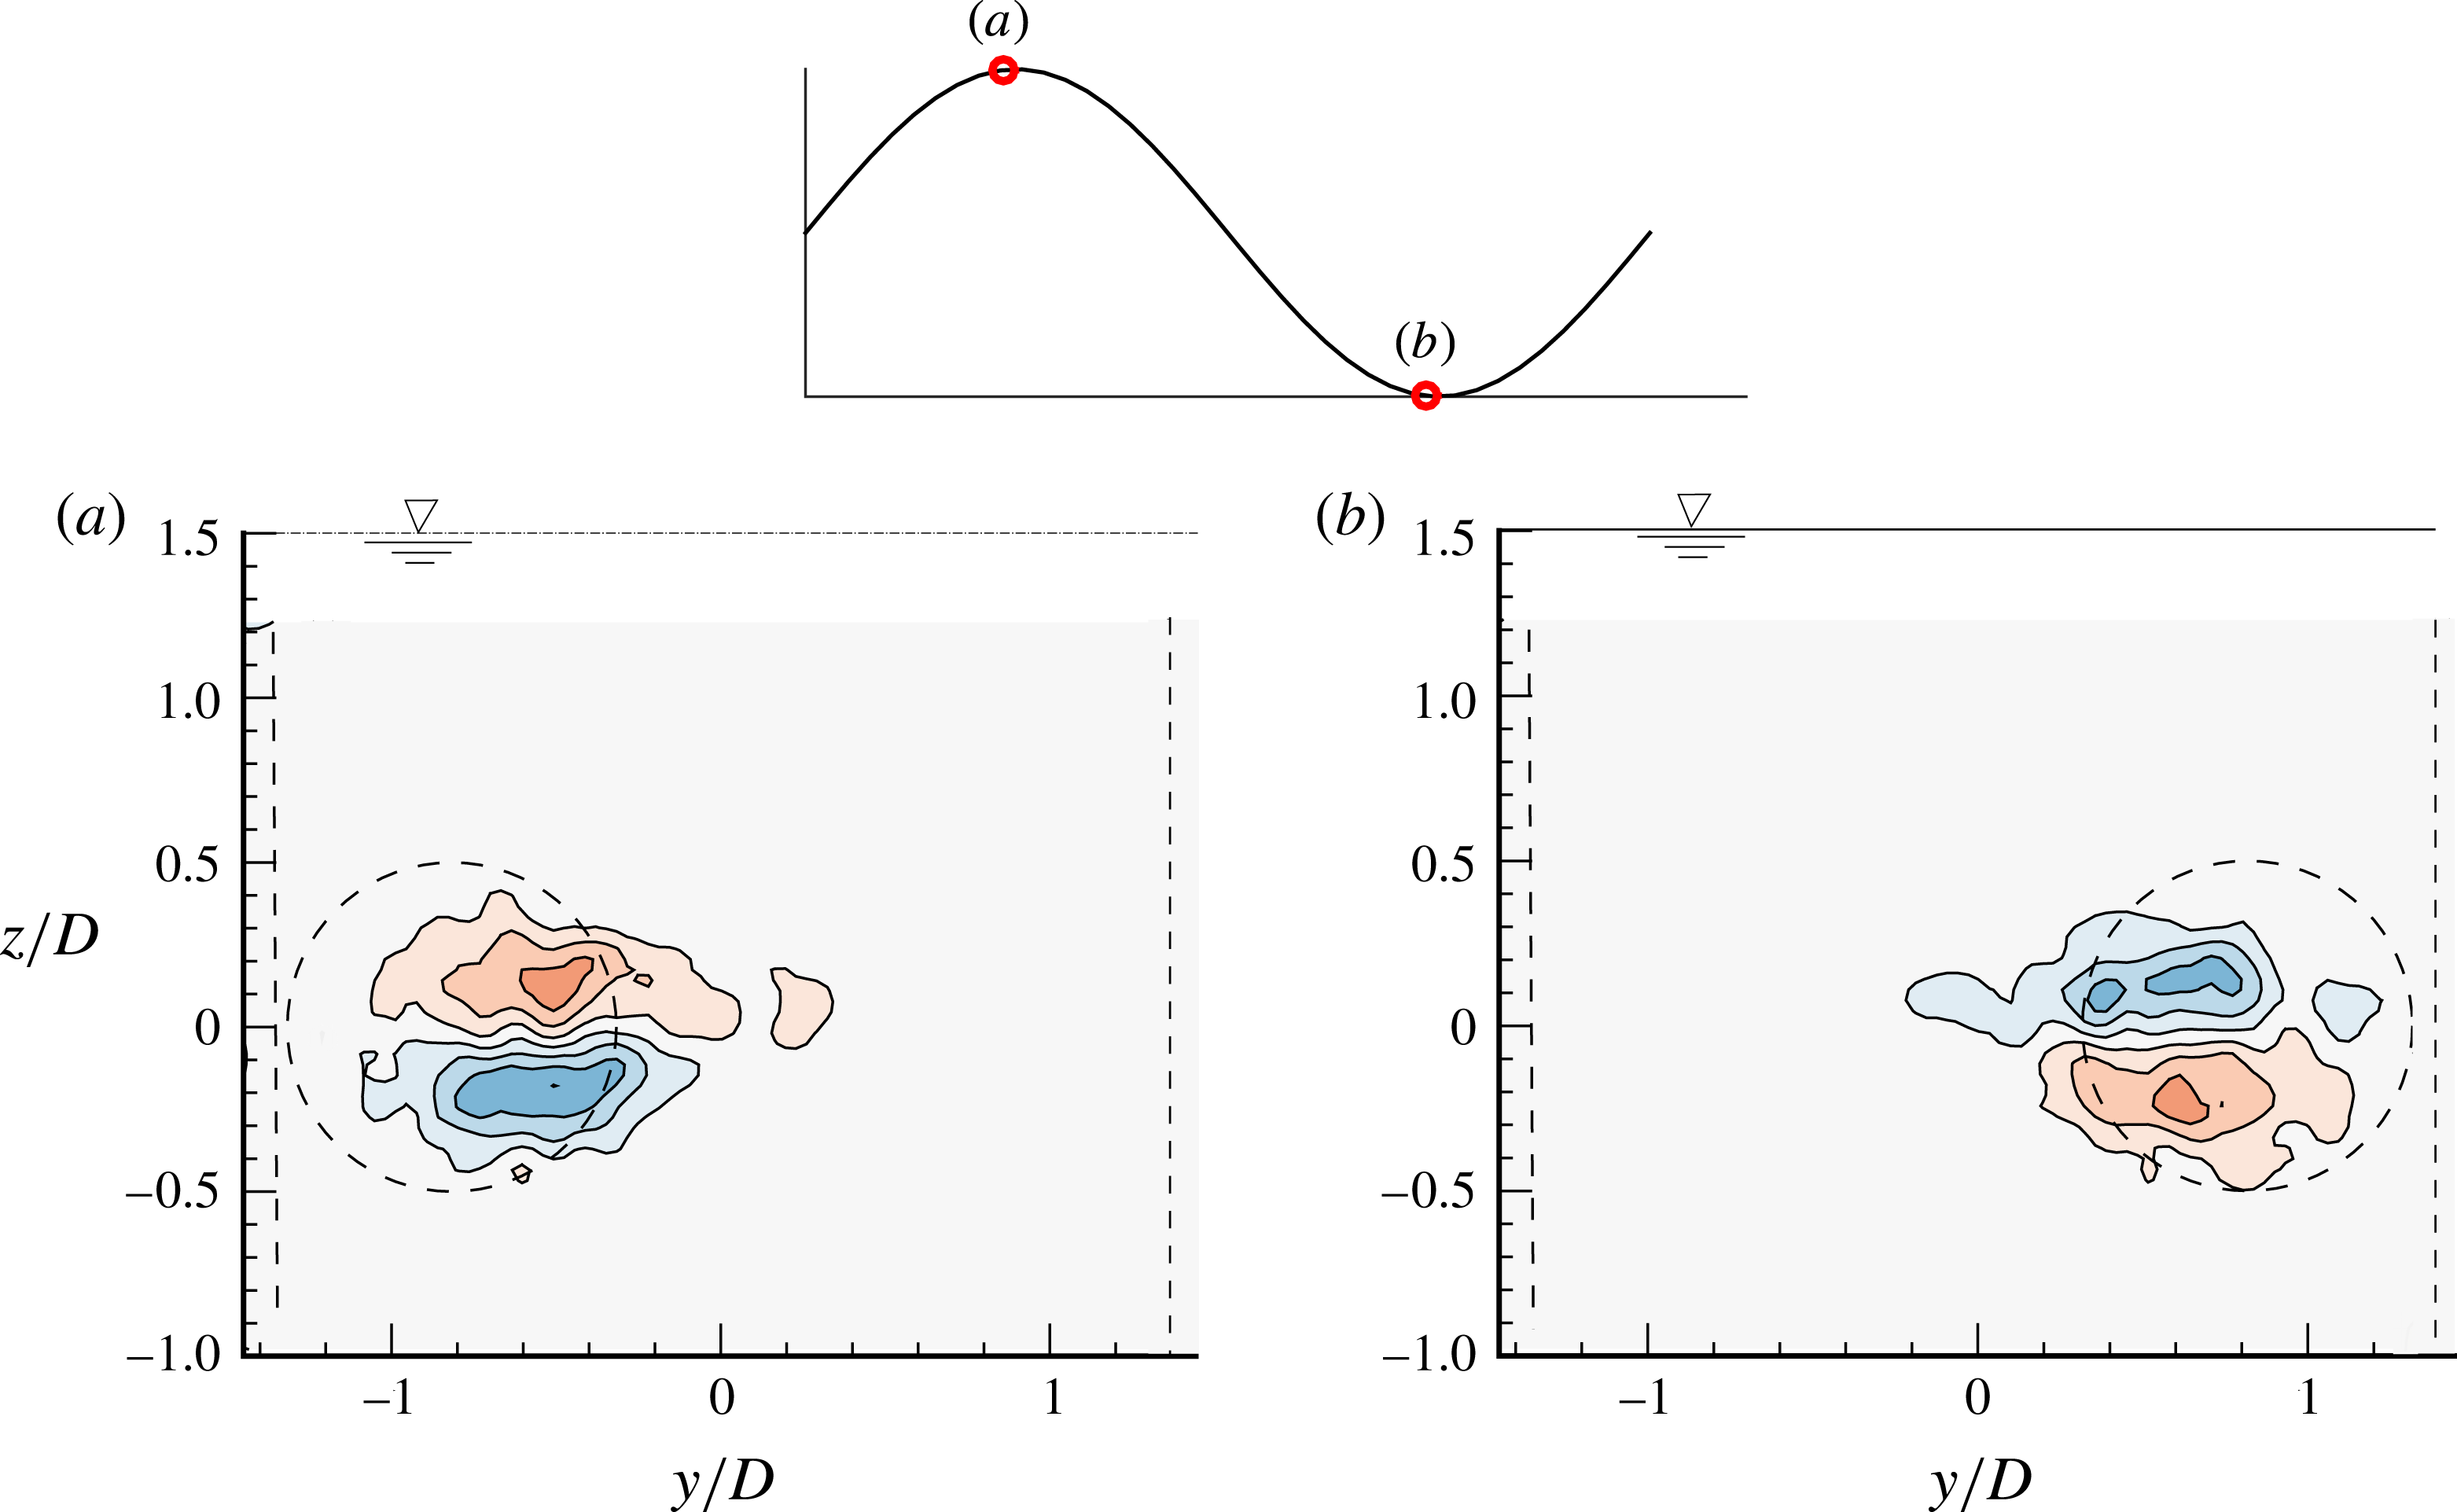
from the sphere rear surface similar to the vorticity measurements by Govardhan & Williamson (Reference Govardhan and Williamson2005). Figure 23 shows the vorticity contour plots phase-averaged (over more than 100 cycles) at two different phases of the oscillation cycle for a fully submerged sphere (
 $h^{\ast }=1$
). The plots are shown for a reduced velocity of
 $U^{\ast }=10$
, which corresponds to the peak amplitude in the VIV response (the heart of mode II). The top boundary in all the contour plots reported in the paper marks the free-surface boundary.
Streamwise vorticity plots for a fully submerged sphere VIV at
 $U^{\ast }=10$
taken
 $1.5D$
downstream of the sphere. The above phase-averaged plots from cross-sectional digital particle image velocimetry (DPIV) measurements show mean vorticity contours at approximately the two opposite extremes of the displacement cycle. The position of the sphere is shown by the dashed circle. Blue contours show anticlockwise vorticity and red contours show clockwise vorticity. Contour levels vary in eight steps in the range
 $\unicode[STIX]{x1D714}D/U\in [-3.33,3.33]$
. The top boundary indicates the location of the free surface.

As clearly observed from figure 23(a,b), the streamwise vorticity consists of a dominant counter-rotating vortex pair symmetric across the horizontal plane, which is consistent with the formation of vortex loops on both the sides of the wake (Sakamoto & Haniu Reference Sakamoto and Haniu1990; Brücker Reference Brücker1999; Govardhan & Williamson Reference Govardhan and Williamson2005). Streamwise vorticity measurements by Govardhan & Williamson (Reference Govardhan and Williamson2005) also revealed a counter-rotating streamwise vortex pair similar to the current study. As the sphere oscillates from one side to the other, the observed vorticity changes sign. In figure 23(a), the blue vortex (anticlockwise vorticity) is above the red vortex (clockwise vorticity). On the other hand, when the sphere traverses towards the opposite side, the vorticity changes sign with the red vortex now above the blue vortex. This is congruent with the fact that as the sphere oscillates from one side to the other, hairpin loops from opposite sides are shed downstream into the wake. Vorticity measurements in a cross-plane,
 $1.5D$
downstream of the sphere by Govardhan & Williamson (Reference Govardhan and Williamson2005), also reported similar findings for a fully submerged sphere.
Streamwise vorticity measurements (phase-averaged) for
 $U^{\ast }=10$
for a sphere with an immersion ratio of
 $h^{\ast }=0.125$
at marked phases over a displacement cycle. The corresponding displacement phases are depicted in the plot above. See figure 23 for further information.

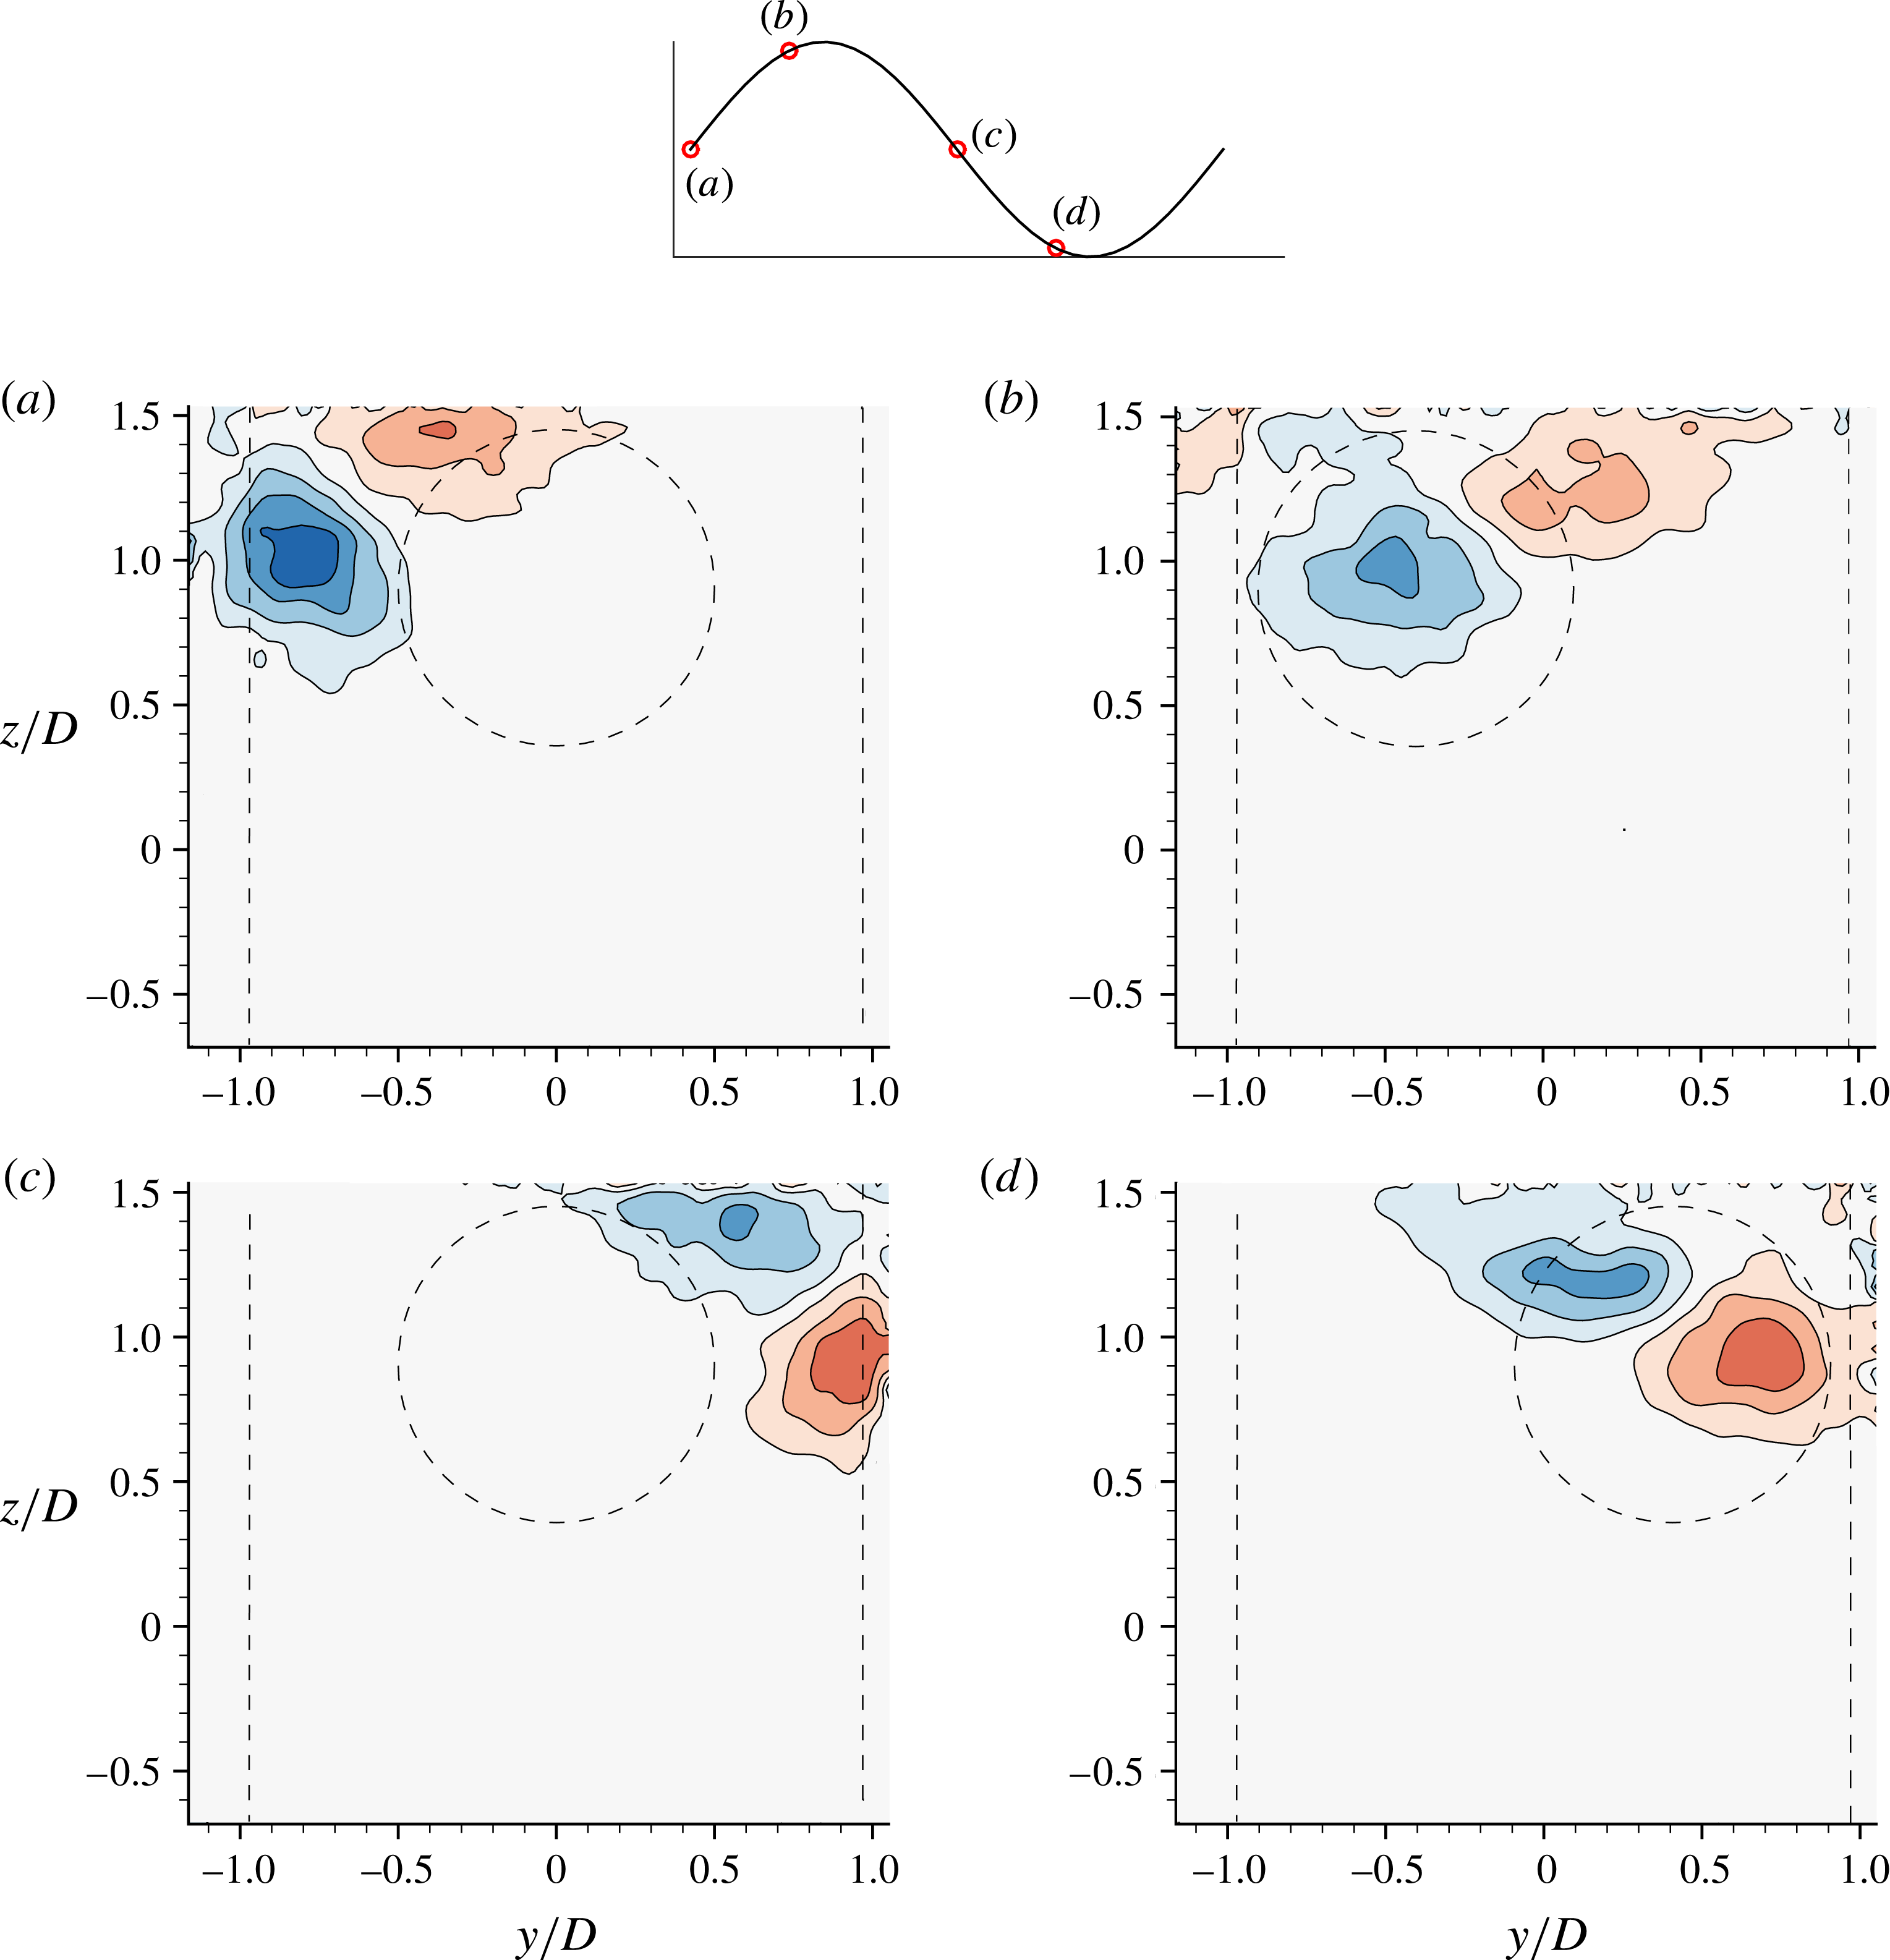
The question arises: how do these counter-rotating vortex pairs (depicting propagating streamwise vortex pairs) change when the sphere moves closer to the free surface? In order to answer this question, similar streamwise vorticity measurements at
 $1.5D$
downstream were undertaken for several different immersion ratios. Figure 24(a–d) shows vorticity contour plots at several phases of the oscillation cycle for a sphere close to a free surface, in this case for an immersion ratio of
 $h^{\ast }=0.125$
. As evident from the figure, the orientation of the vortex pair has changed dramatically due to proximity to the free surface, indicating that the vortex loops change orientation and the horizontal plane through the sphere centre no longer acts as a plane of symmetry.
In figure 24 when the sphere traverses to one side, the vortex closer to the free surface (red) is reduced in size remarkably; however, as the sphere returns to the other side, the red vortex is seemingly restored and instead the size of the blue vortex is reduced substantially. This means that the anticlockwise (blue) vorticity is the dominant vorticity during the first half of the cycle and the clockwise (red) vorticity is dominant in the next half. These observations of vorticity transformation via turning, stretching and diffusion in the current results are perhaps related to the case of a vortex ring approaching a free surface as reported by Zhang, Shen & Yue (Reference Zhang, Shen and Yue1999). They demonstrated that the mechanisms of vorticity transformation via turning, stretching and diffusion take on distinct roles in the two surface layers, i.e. an inner viscous layer and an outer blockage layer. Similar observations of disconnection and termination of vortex lines at the free surface have been made previously by several studies, e.g. Bernal & Kwon (Reference Bernal and Kwon1989), Gharib & Weigand (Reference Gharib and Weigand1996) and Zhang et al. (Reference Zhang, Shen and Yue1999) for the case of an approaching vortex ring near a free surface, Reichl et al. (Reference Reichl, Hourigan and Thompson2005) for the case of a fixed cylinder near a free surface, Ohring & Lugt (Reference Ohring and Lugt1991) for a vortex pair near a free surface and also in the review study by Sarpkaya (Reference Sarpkaya1996) on the vorticity and free-surface interactions.
In the current case, where the vortex pair is streamwise orientated during the initial evolution, the dynamics may be even simpler. As the upper vortex of the pair advects downstream, the stress-free free-surface condition means that a velocity gradient cannot be maintained, i.e. the vortex diffuses into the free surface (e.g. Wu Reference Wu1995; Brøns, Thompson & Leweke Reference Brøns, Thompson, Leweke and Hourigan2014). Thus, the pair becomes unequal in strength. This causes rotation in the cross-plane through mutual induction, allowing the lower vortex of the pair to move outwards and upwards. During the second half of the cycle, the newly formed vortex pair originating from the opposite side experiences the same dynamics, except with the signs swapped and positions reversed. One can also notice asymmetric deformation of the vortex pair due to unequal induced strains due to the presence of the free surface.
It can be concluded here that as the sphere traverses from one side to the other (in one displacement cycle), the strength of the upper vortex decreases in the cross-plane. This reduction in the strength of the upper vortex suggests a reduction in the vortex force (or lift) acting on the sphere (see (7.1)). Since the transverse force acting on the sphere decreases in this case, the vibration amplitude could be expected to decrease. This is consistent with the amplitude response measurements shown earlier in figure 5. There is considerable reduction in the amplitude response of the sphere for
 $h^{\ast }=0.125$
at
 $U^{\ast }=10$
compared to the fully submerged sphere.
Streamwise vorticity measurements (phase-averaged) for
 $U^{\ast }=10$
for a sphere with an immersion ratio of
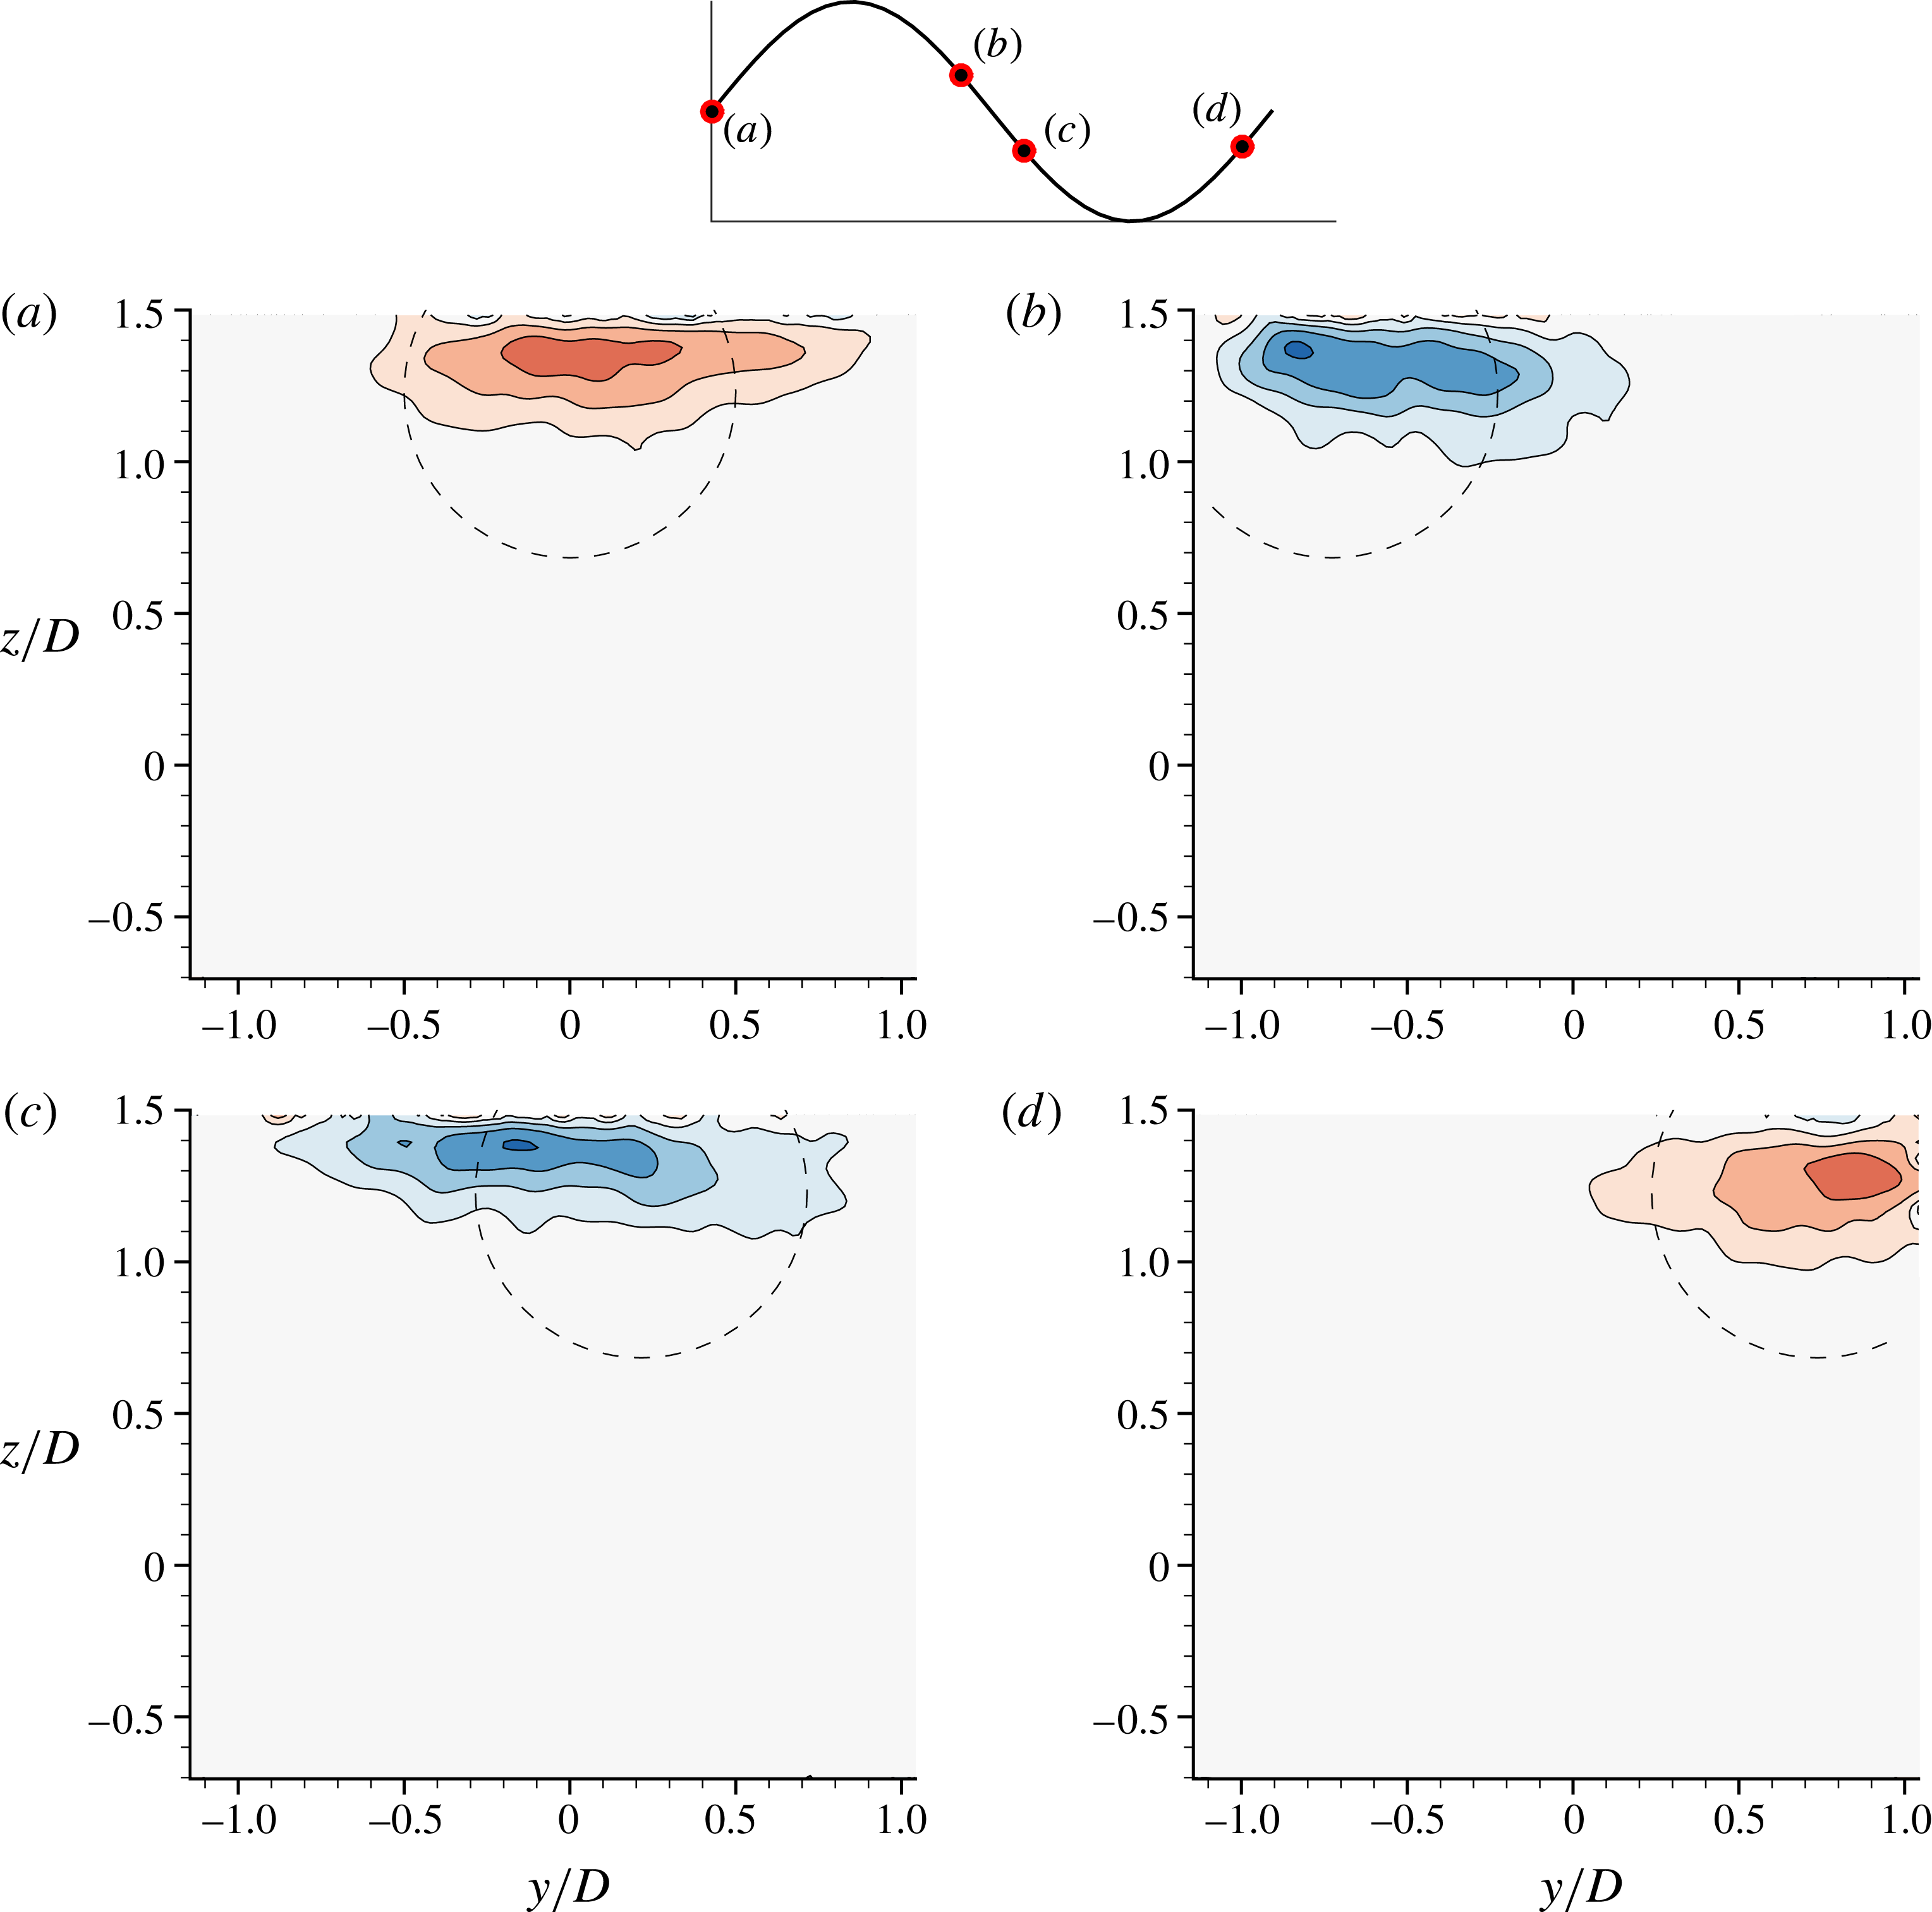
 $h^{\ast }=-0.25$
at several phases through a displacement cycle. See figure 23 for further details.

An interesting case is where the sphere pierces through the free surface. Figure 25(a–d) shows cross-stream vorticity contour plots for
 $h^{\ast }=-0.25$
at
 $U^{\ast }=10$
. Notably, at a distance
 $1.5D$
downstream, the upper vorticity has completely disappeared. In contour panels (a) and (b), only anticlockwise vorticity is present in the cross-plane. For panels (c,d), only clockwise vorticity is present. Of course, there may still be some vorticity of opposite sign in the region (in the same plane) not captured by the PIV imaging plane. Also, these observations indicate that the formation length of the vortices is significantly longer compared to a fully submerged case, and large elliptic deformation is evident. From these vorticity contour plots, it seems likely that there are no hairpin vortex loops that develop in the wake past the sphere for a piercing sphere case. Hence, the VIV dynamics in this case are very different to that of the fully submerged case. For a partially submerged sphere (in this case,
 $h^{\ast }=-0.25$
, i.e. only 75 % of the sphere is submerged), as the sphere traverses from one side to the other, only one streamwise vortex is seen in the cross-plane with alternate signs, in contrast to the fully submerged sphere, where a counter-rotating vortex pair is seen with alternate signs. However, for this case, the vibrations are larger compared to the fully submerged case, as shown in the amplitude response measurements in figure 12. To obtain the full picture of the vortex dynamics for this case, with implications for the sphere forcing, would seem to require capturing the vorticity formation closer to the sphere. This is difficult to capture with the current PIV imaging set-up.
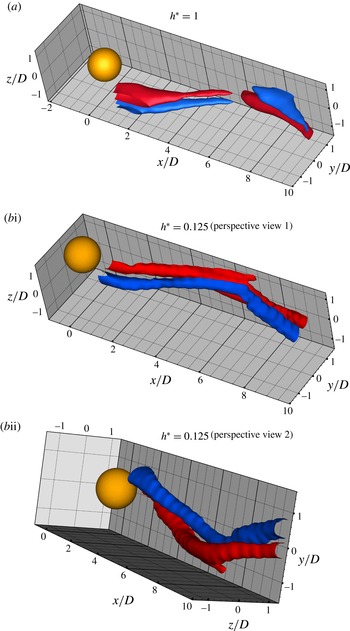
In order to obtain a better perspective of the wake structures, spatio-temporal reconstructions of the sphere wake at a Reynolds number of
 ${\sim}Re=1.5\times 10^{4}$
are shown in figure 26, employing 24 cross-stream vorticity fields, each phase-averaged over more than 100 sphere oscillation cycles. A convection velocity of
 $U$
(free-stream velocity of
 $0.196~\text{ms}^{-1}$
) was assumed to build the three-dimensional images. As is evident in figure 26(a), the wake comprises a two-sided chain of streamwise vortex loops. Govardhan & Williamson (Reference Govardhan and Williamson2005) also reported similar wake structures for the sphere wake, but at a lower Reynolds number of
 $Re=3000$
. On the other hand, for the case when the sphere is much closer to the free surface, at
 $h^{\ast }=0.125$
in figure 26(bi), the loops twist to attach to (and diffuse into) the free surface alternatively. This observation is clearer in figure (bii), which shows the same structures but from a different perspective view (zoomed in view from the bottom).
Spatio-temporal reconstructions of the streamwise vorticity crossing the transverse plane at a distance
 $1.5D$
from the sphere rear surface for (a)
 $h^{\ast }=1$
, and (b)
 $h^{\ast }=0.125$
, based on the phase-averaged streamwise vorticity. Figures (bi) and (bii) show two different perspective views of the same case,
 $h^{\ast }=0.125$
. The wake is shown for
 $U^{\ast }=10$
, corresponding to a Reynolds number of
 ${\sim}1.5\times 10^{4}$
. Blue indicates anticlockwise vorticity, and red clockwise vorticity (both in the
 $x$
–
 $y$
plane). The
 $x$
–
 $y$
plane at the
 $z/D=1.5$
boundary of the visualisation box indicates the location of the free surface. A convection velocity of
 $U$
(free-stream velocity) of
 $0.196~\text{ms}^{-1}$
was used for the reconstructions.

7.2 Some comments on surface patterns and deformations
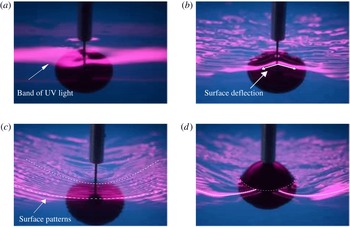
In order to gain some qualitative insight into the free-surface deformation patterns, an ultraviolet lamp was placed just above the water channel facing downwards towards the wake. A Nikon D7000 camera was placed upstream to capture the free-surface patterns. In quiescent water, the UV lamp reflection appeared as a straight horizontal band, and as the free surface deforms, this deformation can be captured by visualising the UV reflection patterns.
Images showing the surface distortion for
 $h^{\ast }=0$
at
 $U^{\ast }=5$
(a) and
 $U^{\ast }=12$
(b), and for
 $h^{\ast }=0.25$
(c) and
 $h^{\ast }=-0.25$
(d) at
 $U^{\ast }=15$
. The UV lamp was placed above the water channel facing downwards towards the wake. The free-surface patterns were viewed using a Nikon camera placed upstream.

Figure 27(a) shows the UV lamp pattern for
 $h^{\ast }=0$
and
 $U^{\ast }=5$
. In this case, there is minimal free-surface deformation, hence the UV reflection appears as a horizontal band with little distortion that would be caused by surface waves. However, at a relatively higher
 $U^{\ast }$
value of 12 (figure 27
b), small surface ripples are clearly visible with a standing wave at the front of the surface. On the other hand, for
 $h^{\ast }=0.25$
, as shown in figure 27(c), there is very small deformation (unlikely to be significant); however, patterns resembling Kelvin-type waves are visible on the surface, which are probably due to the piercing support rod. For a piercing sphere case, as shown in figure 27(d), the patterns are very different, with appreciable surface deformation seen as a standing wave structure.
In most of these cases, the surface wave structures are of low amplitude of less than two per cent of the sphere diameter. However, for
 $h^{\ast }=0.125$
, they exceeded
 ${\sim}4\,\%$
for
 $U^{\ast }\gtrsim 15$
. The limiting case of
 $h^{\ast }=0$
had deformations in the vicinity of the submerged sphere of
 ${\sim}10\,\%$
at
 $U^{\ast }\gtrsim 15$
. The surface deformations were estimated by measuring the approximate dip in the free surface in close proximity to the sphere using scaled images similar to those shown in figure 27. The observation of generally small surface deformation over most of the parameter space investigated is consistent with the relatively small effect of Froude number observed in § 5.3. Much higher Froude numbers are expected to lead to significantly larger surface deformations, in turn leading to nonlinear wave–wake interactions and complicated dynamics; however, even for the small Froude numbers examined in this paper, the proximity to the free surface has a strong effect on the VIV and the wake dynamics.
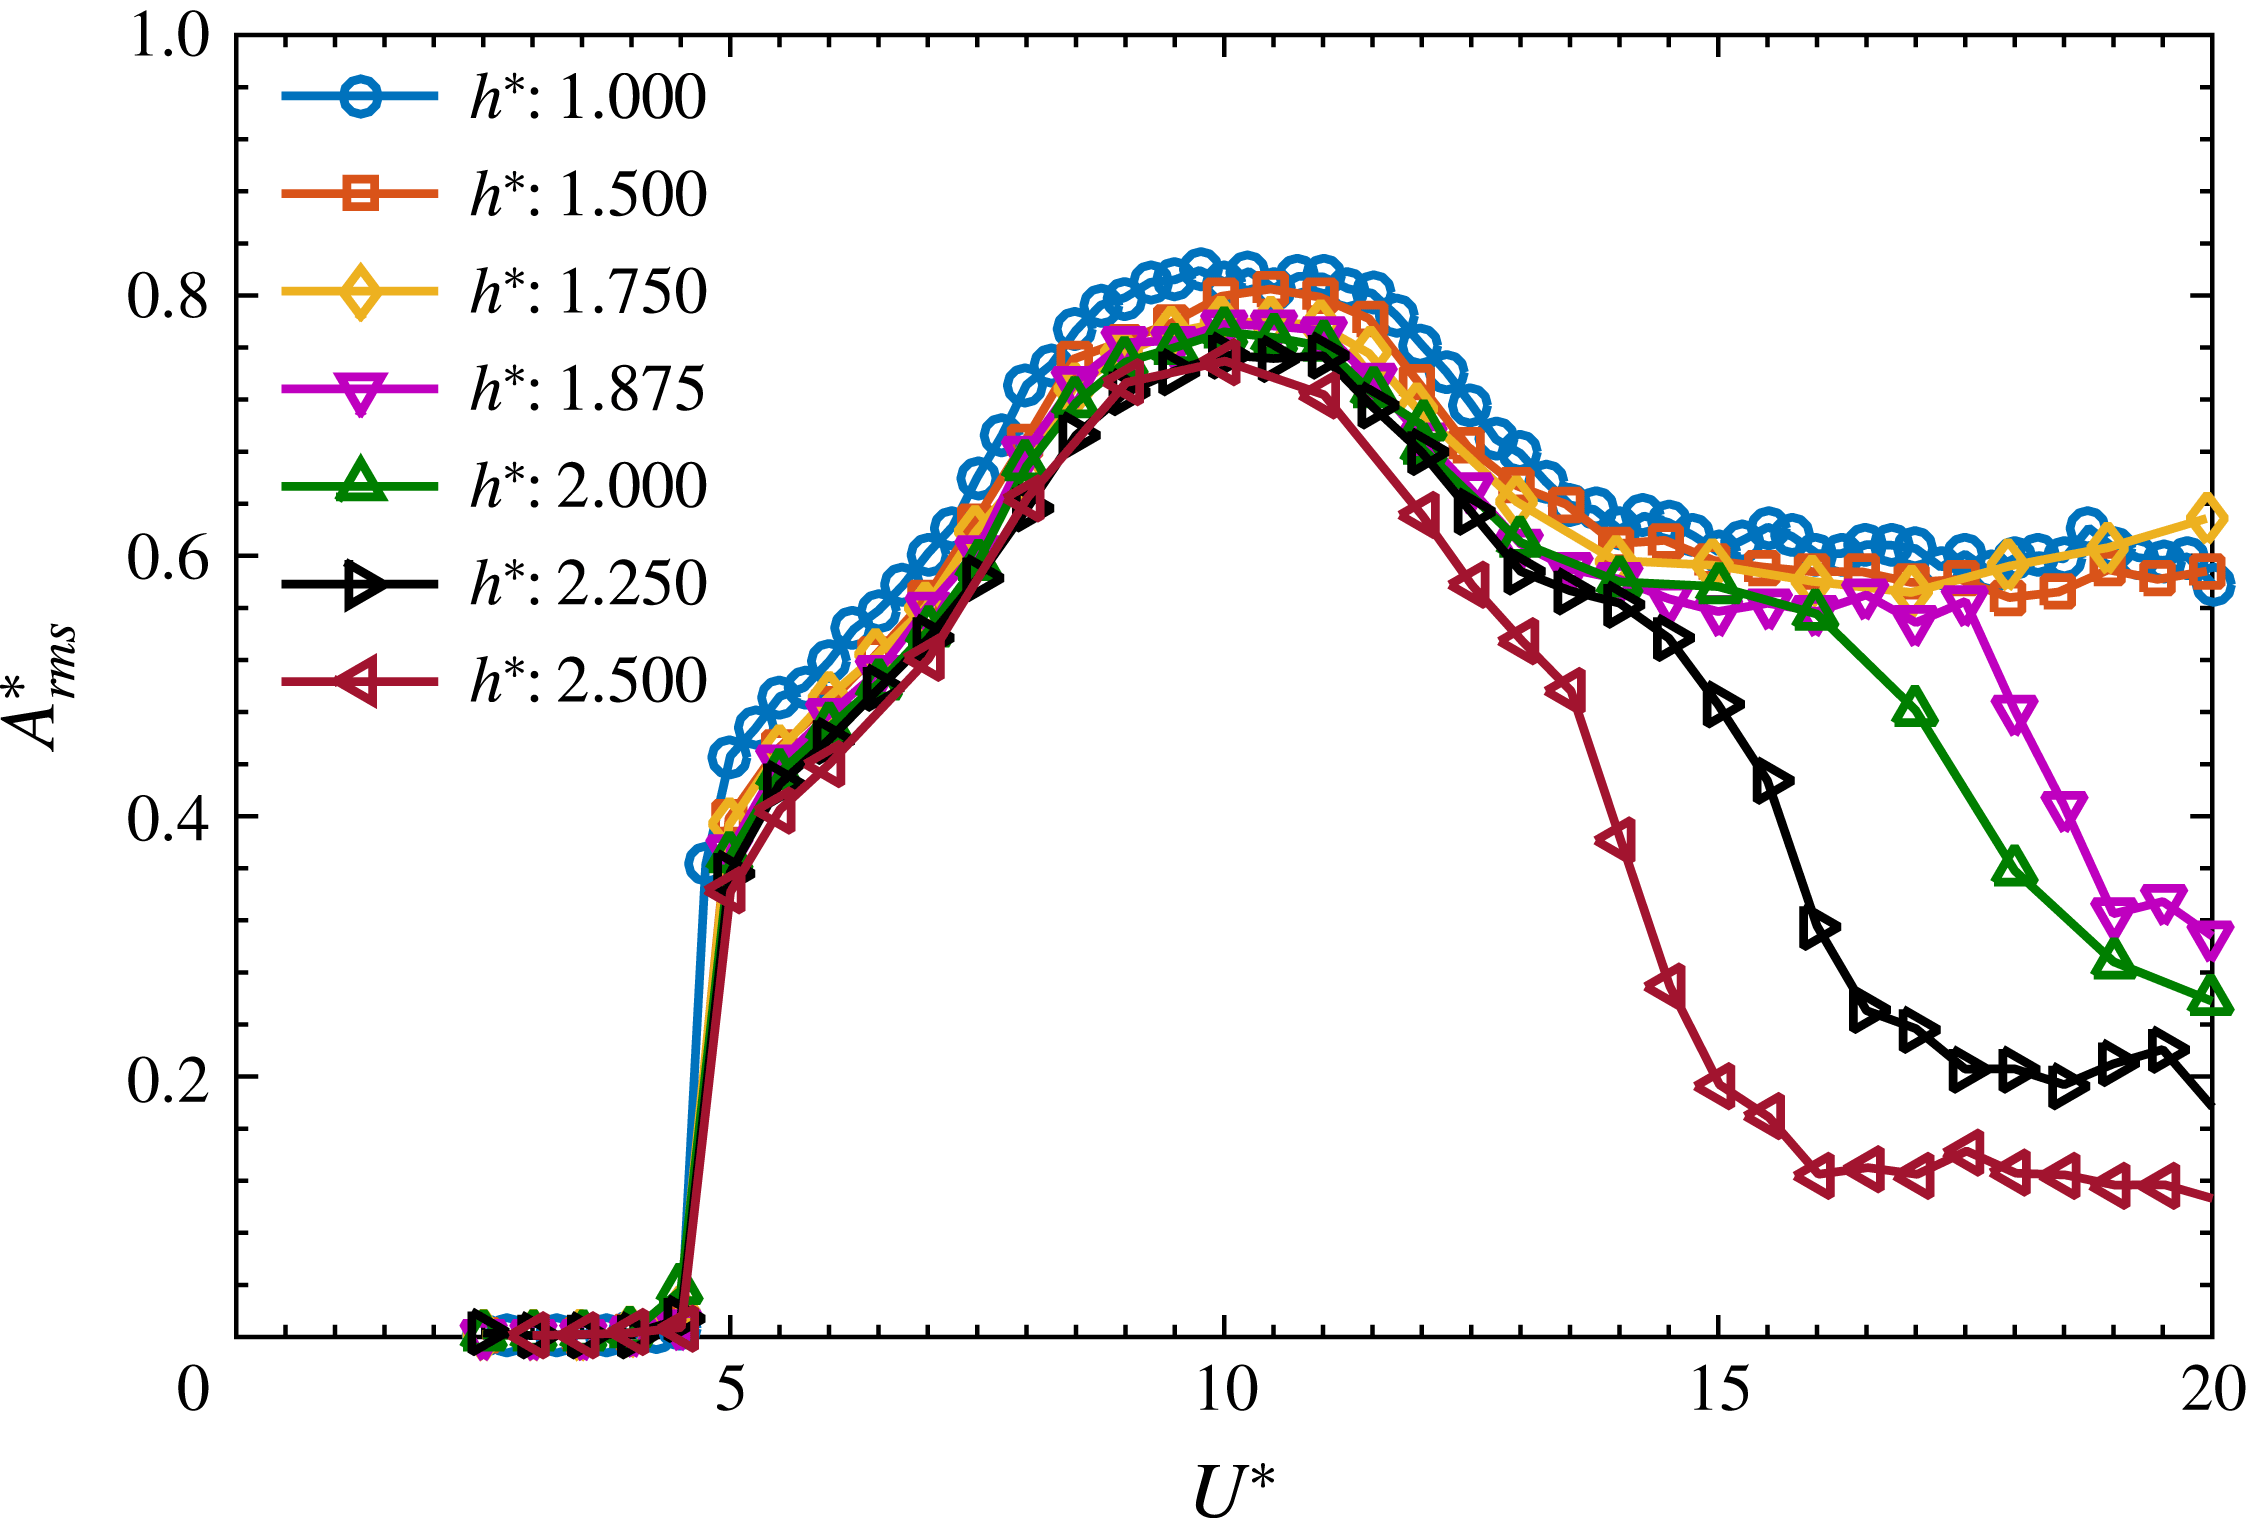
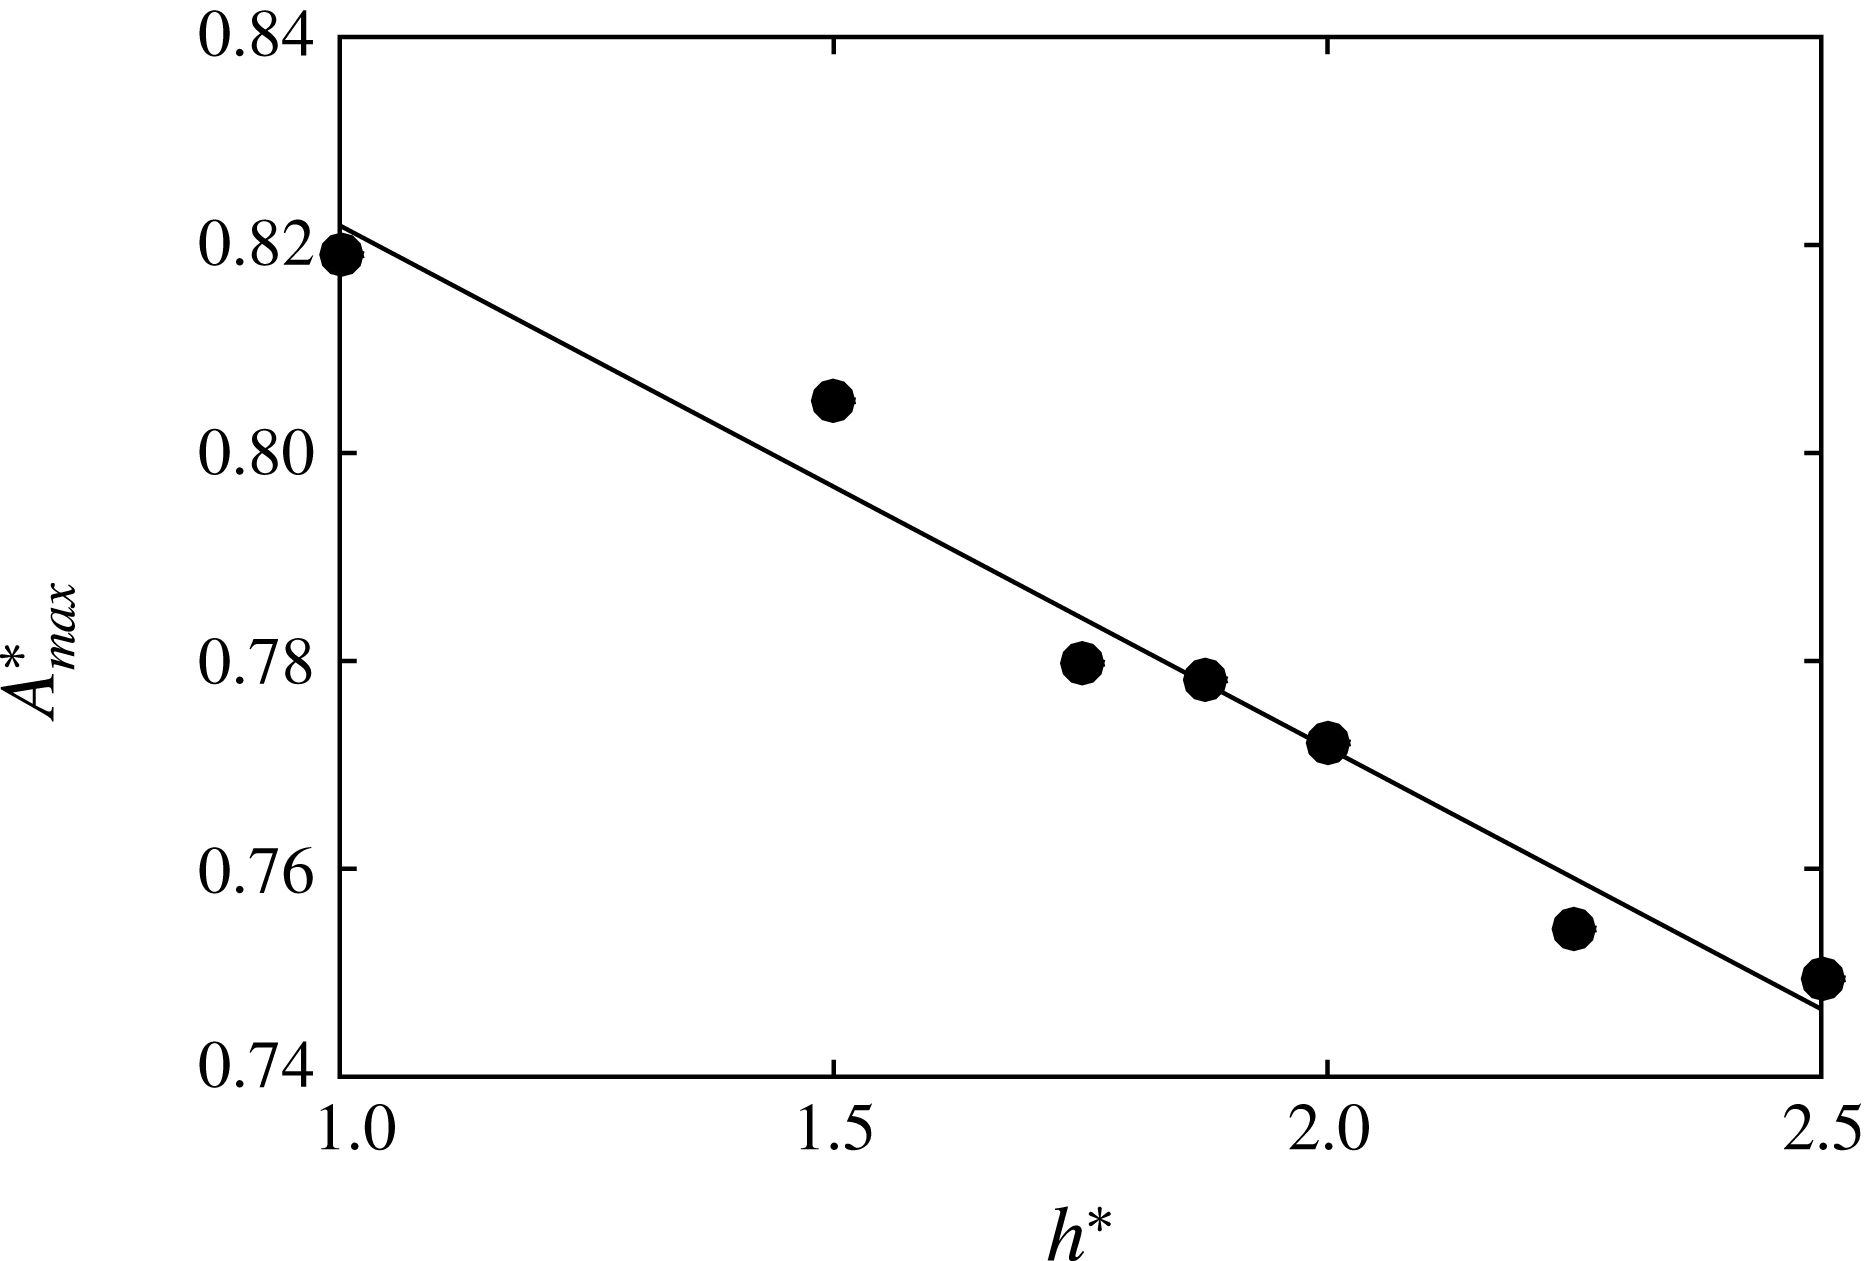
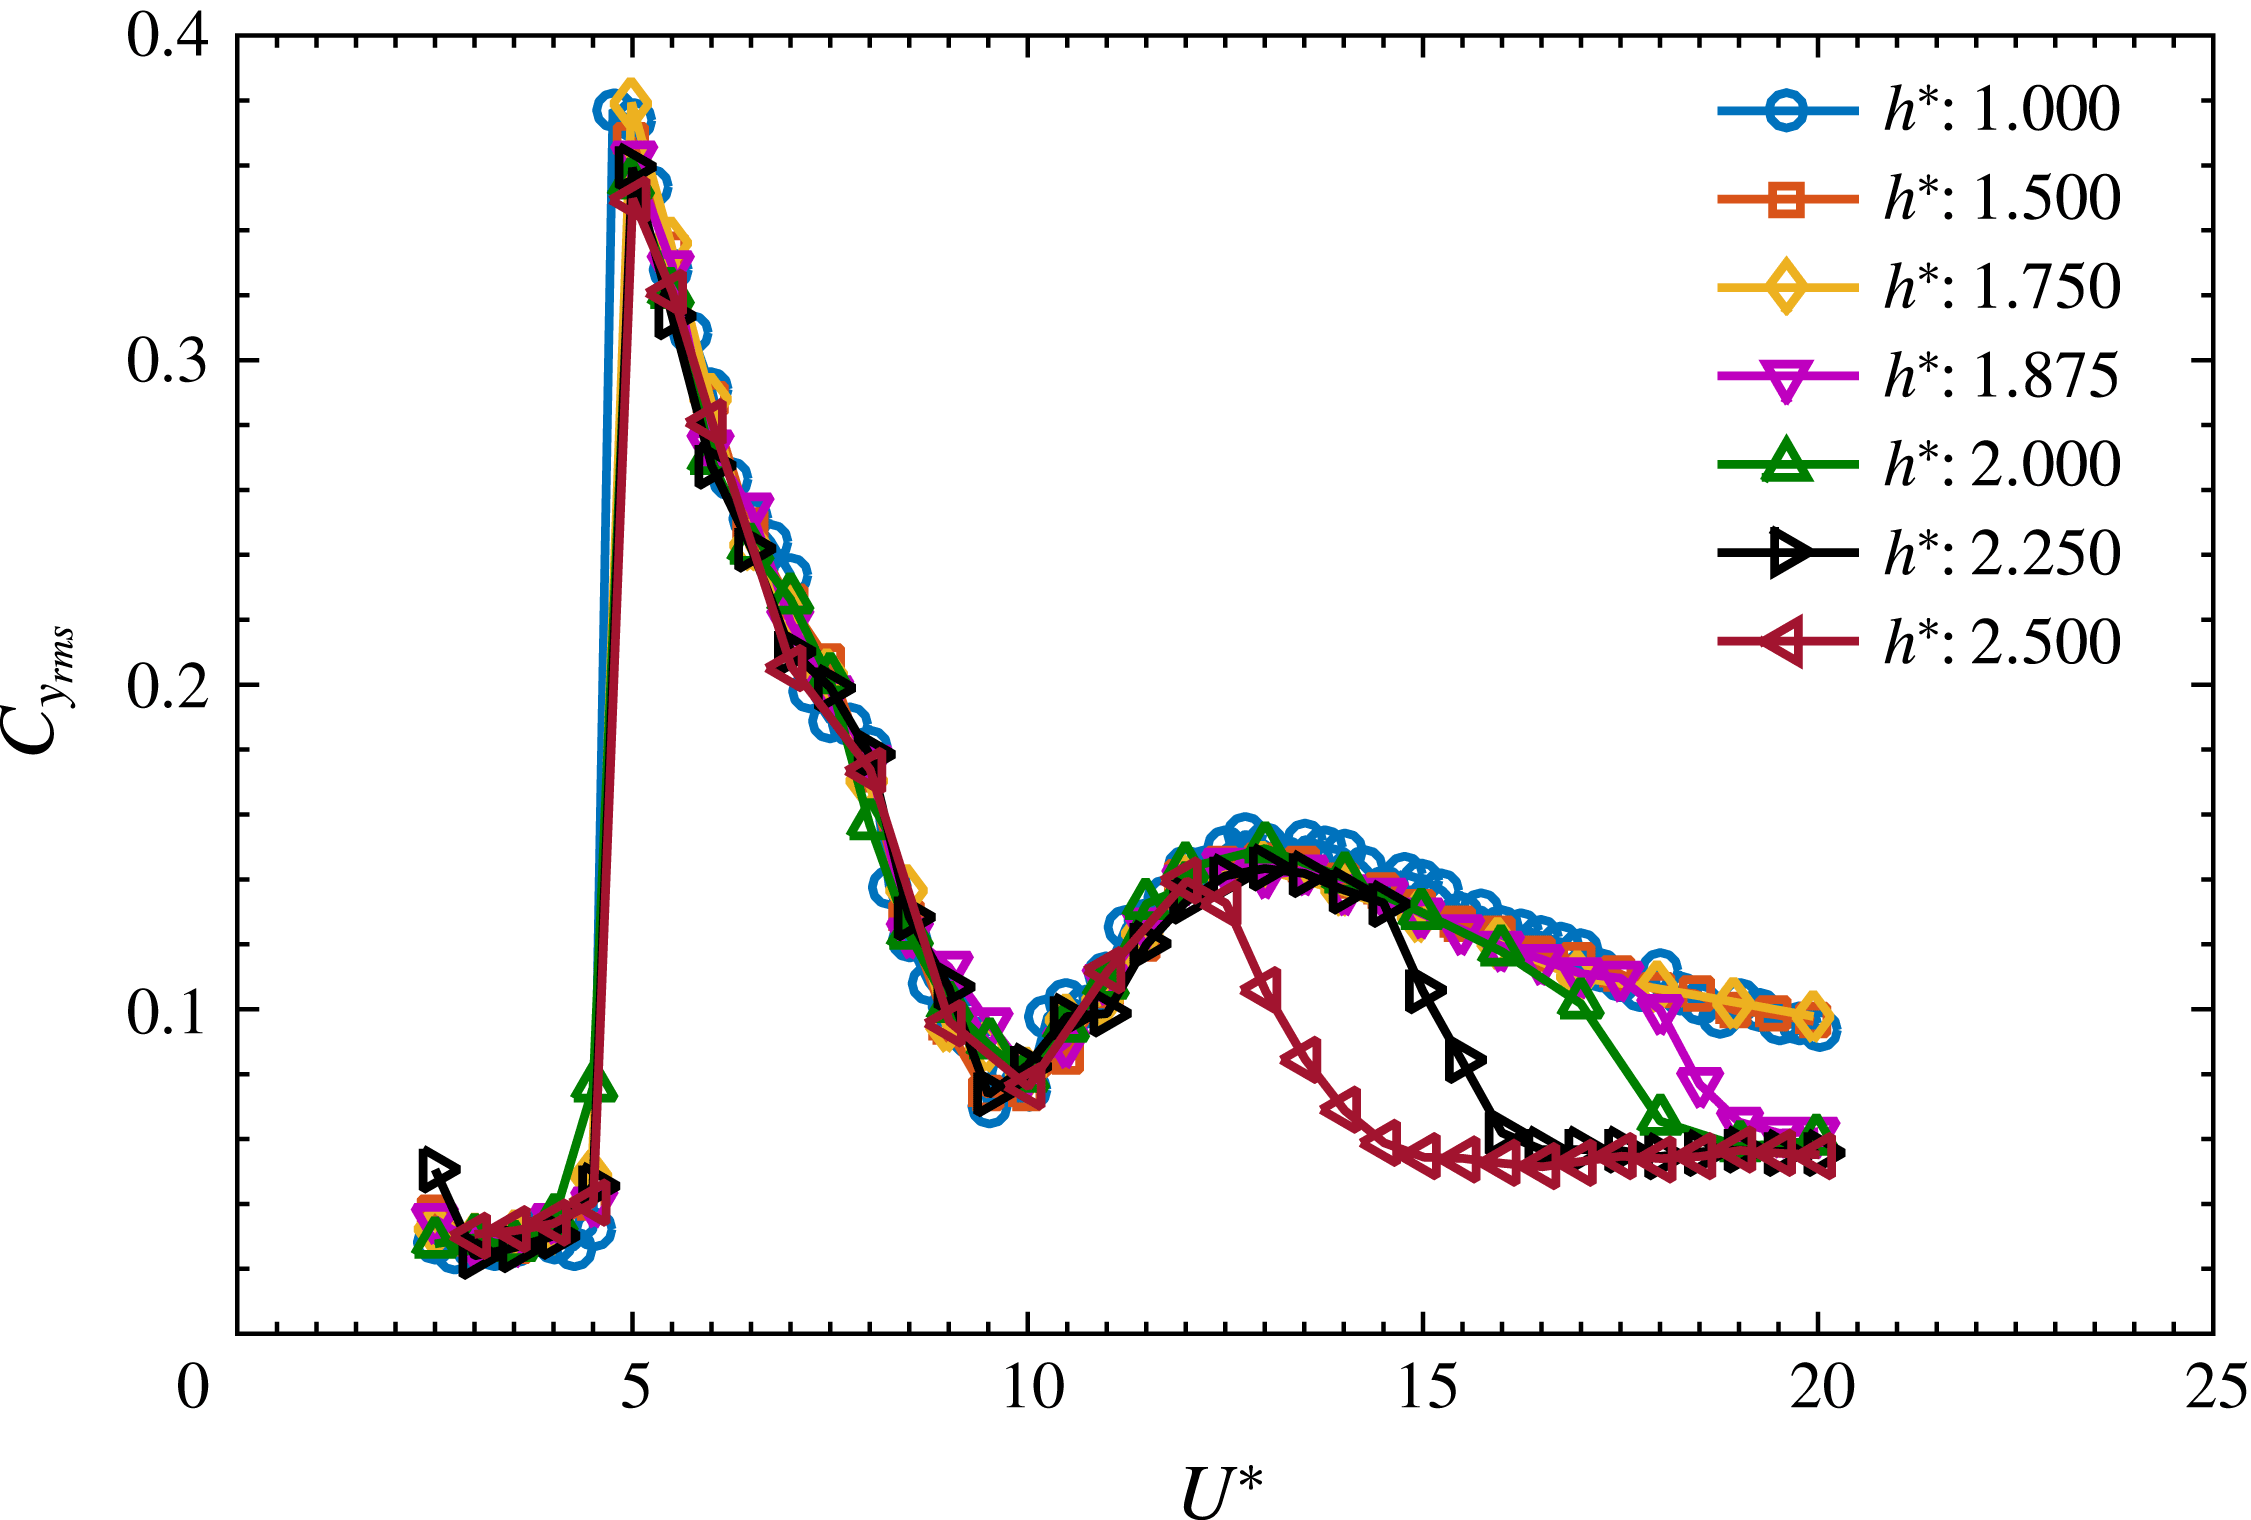
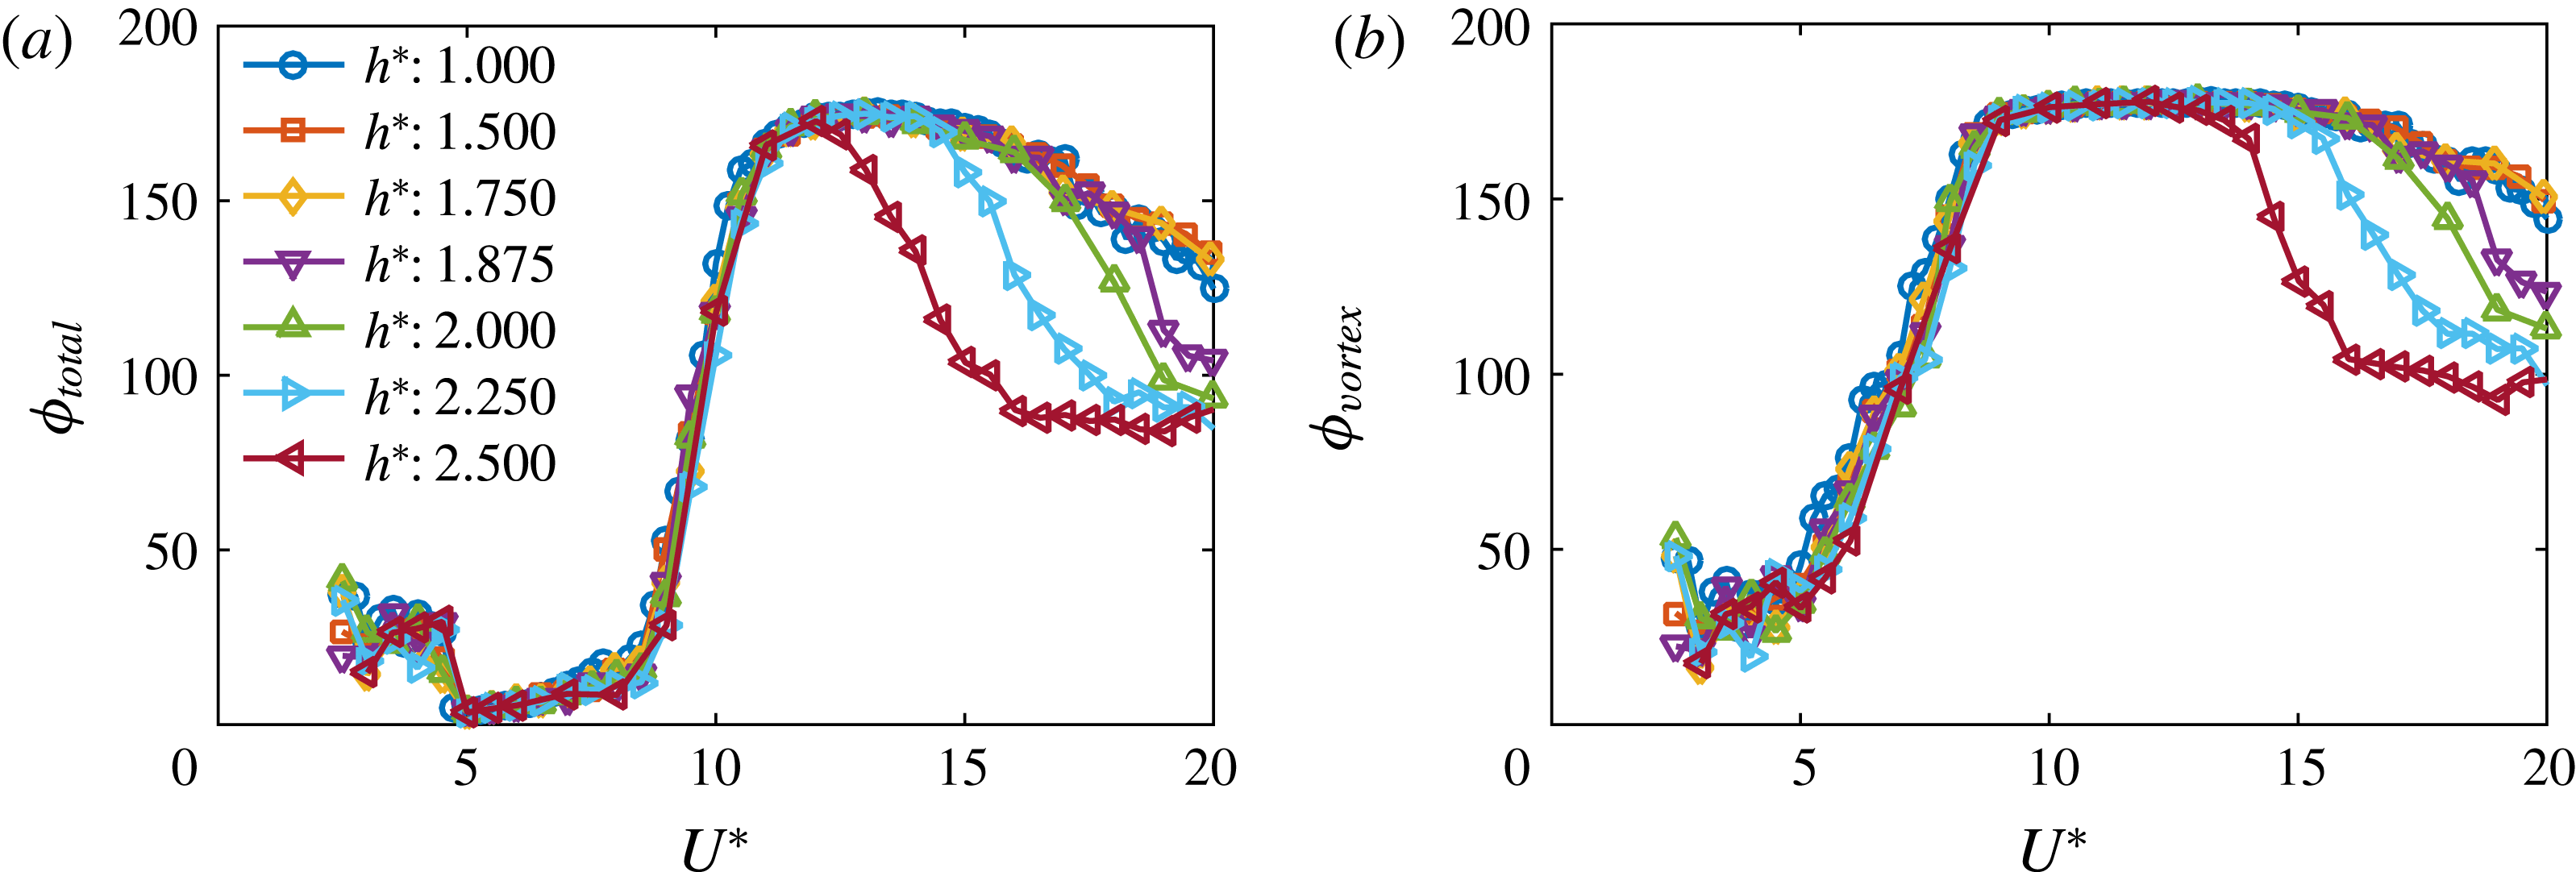
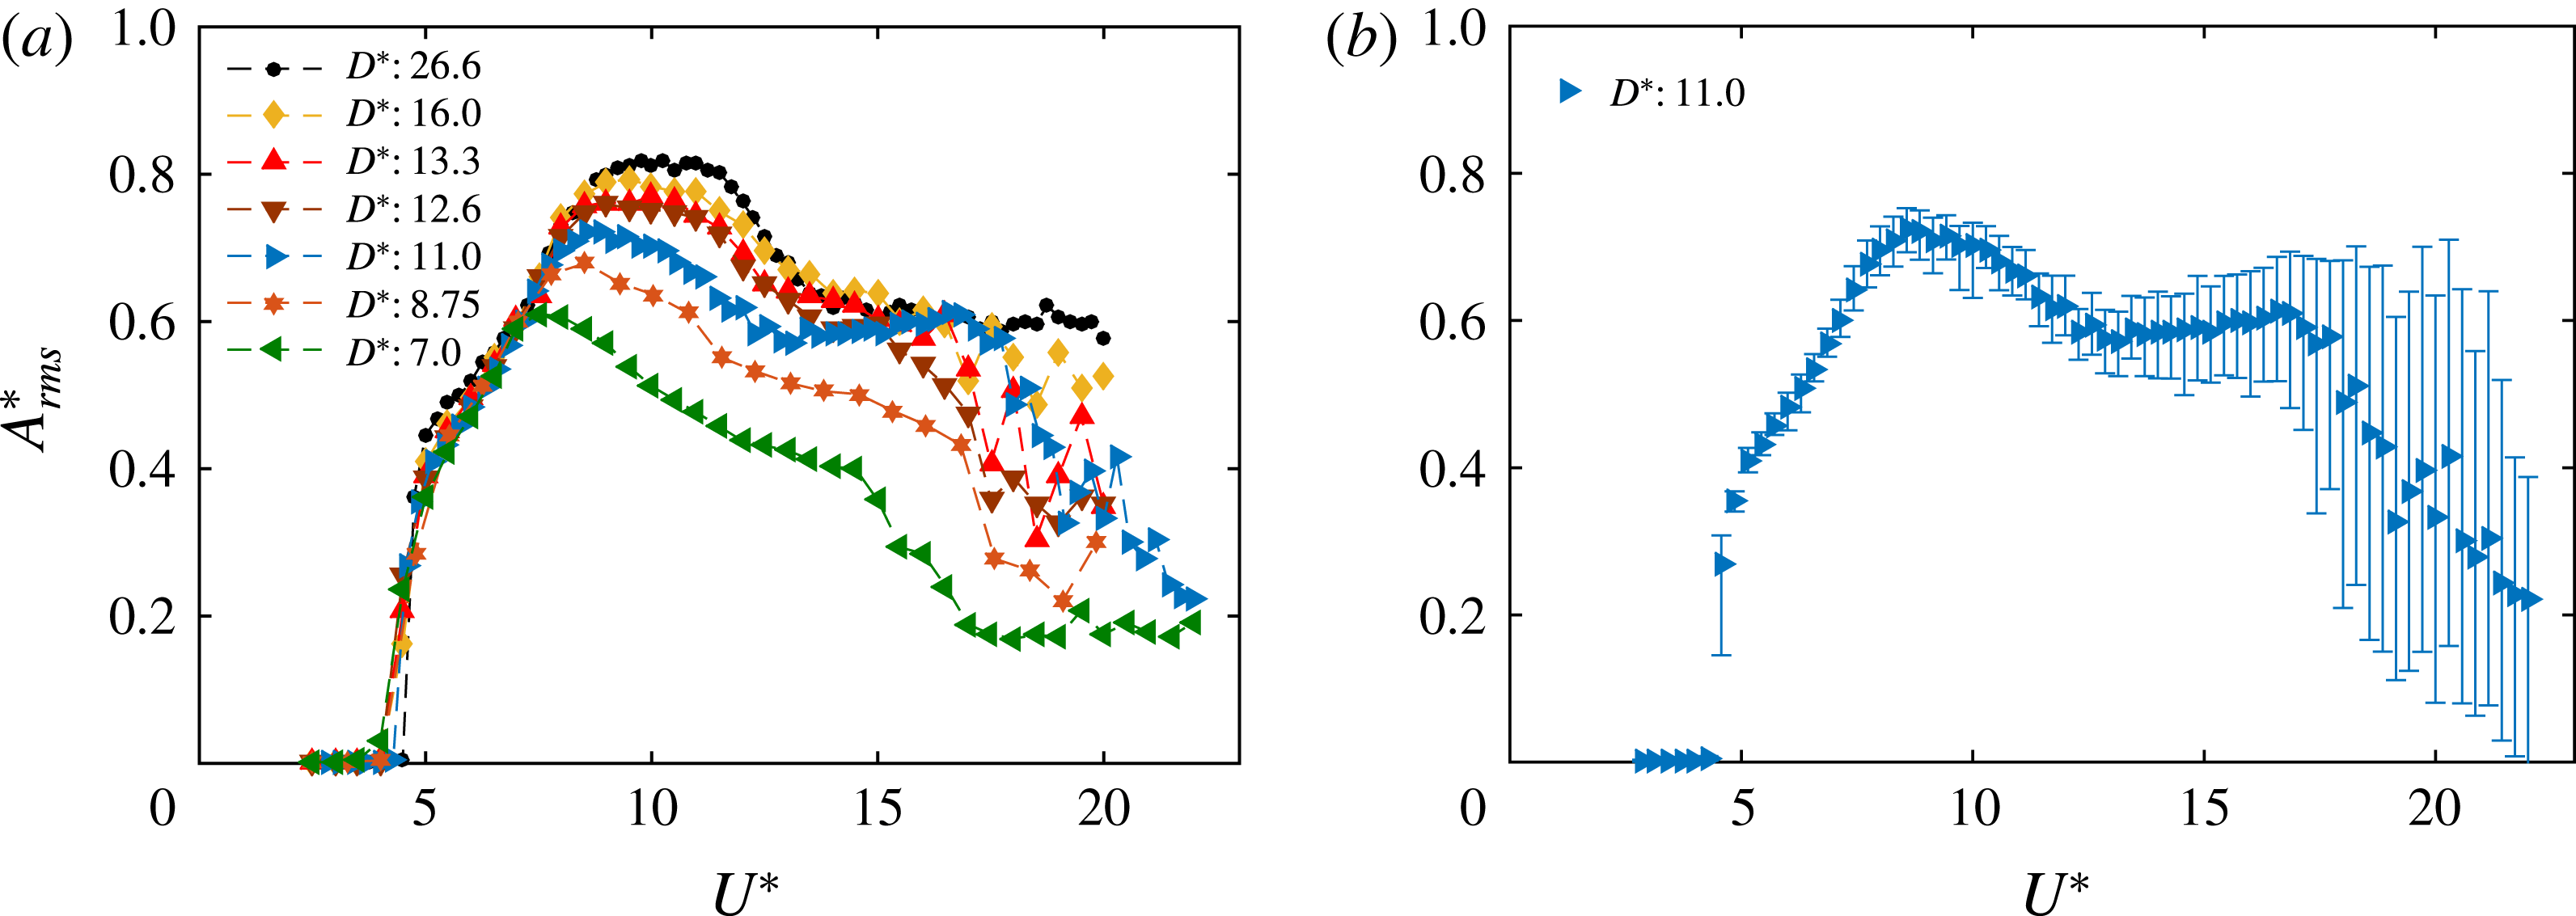
8 Conclusions
A comprehensive series of experiments and wake measurements have been performed to investigate the effect of proximity to the free surface on the VIV response of fully and semi-submerged spheres. The response was studied over a wide range of reduced velocities,
 $3\leqslant U^{\ast }\leqslant 20$
, capturing the initial resonance band, and immersion ratios of
 $0\leqslant h^{\ast }\leqslant 1$
for the fully submerged sphere and
 $0<h^{\ast }<-1$
for the semi-submerged sphere. For a fully submerged sphere, the vibration amplitude decreased and the synchronisation region narrowed gradually with the decrease in the immersion ratio. Mode II occurred for progressively lower
 $U^{\ast }$
values with decreasing
 $h^{\ast }$
.
In contrast, for the semi-submerged sphere, different dynamics was observed. Two regimes were identified, depending on the immersion ratio showing different characteristic responses. In regime
 $\text{I}$
, covering (
 $-0.5<h^{\ast }<0$
), the synchronisation region widened and the vibration amplitude increased. However, in regime
 $\text{II}$
, the vibration amplitude decreased with a decrease in
 $h^{\ast }$
, accompanied with a very sharp reduction beyond
 $h^{\ast }<-0.65$
. The amplitude response in regime II was characterised by two distinct peaks corresponding to mode I and mode II of the vibration response observed for a fully submerged sphere.
The response was found to be relatively insensitive to the Froude number in the range tested,
 $0.05\leqslant Fr\leqslant 0.45$
, with the response curve shape unaffected, although increasing the Froude number did lead to a slight reduction in the peak amplitude. It was also found that the immersion ratio and the diameter ratio (
 $D^{\ast }$
 $=$
sphere diameter/support-rod diameter) of the support can have significant influences on the VIV response of a sphere. These effects were quantified.
PIV wake measurements in the cross-plane
 $1.5D$
downstream from the rear of the sphere revealed reduction in vorticity of the upper vortex of the longitudinal vortex pair that was closer to the free surface. This is consistent with vorticity diffusion into the free surface. Since this reduces the circulation in the upper vortex, the vortex pair twists towards the free surface as it propagates downstream due to mutual induction. For the piercing sphere case, only the lower vortex of the pair was visible at
 $1.5D$
downstream; it appears that the upper vortex was effectively lost through diffusion into the free surface. This changes the wake dynamics substantially and indeed a larger oscillation amplitude than the fully submerged case is observed. Surface flow visualisations of the free surface revealed different surface patterns for the fully submerged and the semi-submerged cases; however, the total surface distortion was relatively minor, in line with the lower Froude numbers covered by this study.
Acknowledgements
A.S. acknowledges the support of a Monash Graduate Scholarship (MGS) and Monash International Postgraduate Research Scholarship (MIPRS). The research was supported by Australian Research Council Discovery Project grants: DP150102879 and DP170100275. J.Z. also acknowledges post-doctoral salary support through the latter grants.
Appendix A
The presence of a sting or trip wire near the boundary layer of a bluff body is known to alter the boundary layer transitions and hence the wake and its size. This leads to changes in the drag coefficient and heat transfer measurements. Mostly, previous experimental studies on the flow past spheres were performed with spheres supported using either tethers or stings. The location of the sphere support systems can also have remarkable influences. Raithby & Eckert (Reference Raithby and Eckert1968) studied the effect of the support position on the flow near the surface of a sphere using flow visualisation techniques. They concluded that in the case of a cross-flow support position, the boundary layer is still attached when it meets the support rod with ensuing violent interactions, leading to an altered wake near the sphere. However, at subcritical Reynolds numbers, the boundary layer is already separated when it encounters the support. It was shown that no significant general disturbance was produced for these Reynolds numbers. In the current study, the Reynolds number regime is well below the critical
 $Re_{c}$
, i.e. in the subcritical regime, and the sphere is supported at the cross-flow support position. Although significant changes in the wake are not expected in the current study, it is shown by systematic experiments that the immersion ratio (
 $h^{\ast }$
) and the diameter ratio (
 $D^{\ast }=D/D_{r}$
), with
 $D_{r}$
the support-rod diameter, can have significant influences on the vibration amplitude response.
This short study essentially follows on from the work of Govardhan & Williamson (Reference Govardhan and Williamson2005), who found that a support rod with a diameter ratio of 1 : 30 was sufficiently thin not to strongly affect the amplitude response curve. However, the selection of the rod diameter and submergence depth involves a compromise between a number of competing factors: providing sufficient structural stiffness, minimising the direct effect on the sphere wake, reducing the resonant response of the rod, reducing sphere and cylinder wake interaction, avoiding free-surface effects; it was therefore decided that documenting these influences would be worthwhile.
A.1 Effect of the immersion ratio
Variation of
 $A_{rms}^{\ast }$
with
 $U^{\ast }$
for various immersion ratios.

Variation of the peak saturation amplitude
 $A_{max}$
with
 $h^{\ast }$
.

Figure 28 shows the response curves for a sphere supported with a circular cross-section cylindrical rod for various immersion ratios
 $h^{\ast }$
. In this case, the sphere of diameter
 $D=80~\text{mm}$
is supported with a rod of
 $D_{r}=3~\text{mm}$
, equating to a diameter ratio of
 $D^{\ast }=26.6$
. Also, the change in damping with the change in the support-rod length was found to be negligible.
When the immersion ratio was increased from 1 to 1.75, there were no significant changes in the responses. On the other hand, increasing
 $h^{\ast }$
to 1.875 led to a sudden drop in the amplitude at higher
 $U^{\ast }$
values. This trend was observed for
 $h^{\ast }\geqslant 1.875$
. The
 $U^{\ast }$
value at which the sudden drop is observed, decreased progressively with increasing
 $h^{\ast }$
. Nonetheless, for
 $U^{\ast }\leqslant 10$
, the response shape remained similar, although there was a not insignificant decrease in the peak amplitude, by approximately 10 %, as
 $h^{\ast }$
was increased from 1 to 2.5. Also, it is evident from the figure that increasing
 $h^{\ast }$
does not shift the position of the peak to the left; they are aligned for all cases examined. However, the peak vibration amplitude
 $A_{\max }^{\ast }$
decreases almost linearly with the immersion ratio
 $h^{\ast }$
, as shown in figure 29.
Variation of the displacement amplitude (
 $y/D$
) with non-dimensional time (
 $t/T$
) for two
 $U^{\ast }$
values at an immersion ratio of 2.25.

The displacement time trace for one of the
 $h^{\ast }$
values (
 $h^{\ast }=2.25$
in this case), for which the amplitude is strongly affected at higher
 $U^{\ast }$
values, is shown in figure 30. At
 $U^{\ast }=10$
, the signal is highly periodic; on the other hand, at
 $U^{\ast }=16$
, where the amplitude has dropped substantially, the signal is no longer periodic and instead consists of intermittent small bursts of vibration. Figure 31 shows that there is an associated drop in the transverse force coefficient with the corresponding decrease in the amplitude response shown in the figure 28. The vortex and the total phases for all the
 $h^{\ast }$
values follow a similar trend in mode I; however, in mode II, both the phases drop to lower values at
 $U^{\ast }$
values, progressively decreasing with the increasing
 $h^{\ast }$
, as shown in figure 32.
Variation of the r.m.s. cross-stream force coefficient
 ${C_{y}}_{rms}$
with reduced velocity
 $U^{\ast }$
for varying immersion ratios
 $h^{\ast }$
.

Variation of the total phase
 $\unicode[STIX]{x1D719}_{total}$
(a) and the vortex phase
 $\unicode[STIX]{x1D719}_{vortex}$
(b) with
 $U^{\ast }$
for a series of different immersion ratios.

A.2 Effect of the diameter ratio
For all the above cases, the diameter ratio,
 $D^{\ast }$
, was fixed at 26.6 and only the immersion ratio was varied.
 $D^{\ast }$
is another important parameter that can influence the amplitude response. Hence, the effect of
 $D^{\ast }$
was studied by keeping the immersion ratio fixed at unity (where free-surface effects are insignificant) while varying the diameter ratio. Figure 33(a) shows the amplitude response of a sphere supported by a rod with
 $D^{\ast }$
varying in small steps from 26.6 to 7. Figure 33(b) shows the fluctuation in the amplitude response for
 $D^{\ast }=11$
. Note here that the error bars are delimited by the mean of the top 10 % of the peaks and the mean of the bottom 10 % of the peaks of the displacement signal. It can be clearly seen that there are large fluctuations in the displacement signal, i.e. the displacement signal is highly non-periodic, for higher
 $U^{\ast }$
values. This behaviour was typical of all the cases tested in the current study.
Another interesting point to note is that, unlike the previous case discussed above where all the response curves were essentially aligned, the peak responses here shift to the left gradually with increasing
 $D^{\ast }$
. In fact, the initial part of the response curve seems almost the same for each case, but the amplitude begins to be reduced at a smaller reduced velocity as the diameter ratio is lower. This suggests different underlying dynamics compared to the previous one. Although not undertaken here, a study of the wake interactions from the cylindrical rod and the sphere would be informative, and help to determine the physical basis of this substantial effect. Nevertheless, the current investigations quantify substantial effects on the amplitude response, and suggest some care is necessary with body mounting and positioning for sphere VIV experiments.
(a) Variation of
 $A_{rms}^{\ast }$
with
 $U^{\ast }$
for a range of support-rod diameter ratios. (b) Example of the fluctuations in the oscillation amplitude for the case of
 $D^{\ast }=11.0$
through error bars delimiting the range of amplitude variation from cycle to cycle.