INTRODUCTION
Ruminal phosphorus (P) is provided mainly by endogenous P coming from saliva (Tomas Reference Tomas1973), which functions as a buffer to the volatile fatty acids produced when feed is fermented by microbes, thereby favouring the rumen environment (McDougall Reference Mcdougall1948). Microbial P requirements are relatively high, as this mineral is essential to rumen micro-organisms and necessary for the digestion of plant cell walls (Durand & Komisarczuk Reference Durand and Komisarczuk1988; Bravo et al. Reference Bravo, Sauvant, Bogaert and Meschy2003a). In the rumen, P may also affect the absorption of other minerals such as calcium and magnesium (Beardsworth et al. Reference Beardsworth, Beardsworth and Care1989).
Although endogenous P represents an important source contributing to the maintenance of rumen micro-organisms, its determination is not easily accomplished. Isotopic dilution methods may provide specific data on P kinetics, and hence can be considered an interesting tool to quantify endogenous P flow to the rumen. For instance, although it has been commonly accepted that saliva is the main source of endogenous P entering the rumen, studies using 32P have shown that endogenous P can also pass from blood to rumen (Lofgreen et al. Reference Lofgreen, Kleiber and Smith1952; Smith et al. Reference Smith, Kleiber, Black and Baxter1955).
The current concern about P pollution necessitates research aimed at understanding the consequences of reducing P intake upon P metabolism in ruminants. For instance, it is well established that endogenous P is essential to the maintenance of a healthy rumen environment. Therefore it seems of interest to investigate the responses in endogenous P supply and P concentration in the rumen to different levels of P intake.
The present work was conducted with the aim of improving understanding of the relationship between P intake and endogenous salivary and ruminal P, and to assess the effect of level of P intake upon ruminal P. The data elicited should contribute to current knowledge concerning P metabolism in ruminants.
MATERIAL AND METHODS
Animals and diets
The experiment was conducted using a protocol approved by the Animal Care Committee of the Centre of Nuclear Energy in Agriculture (CENA, University of São Paulo). Twelve male sheep of Santa Inês breed, initial live weight 36±0·5 kg and aged 8 months, were randomly allocated to one of the four experimental groups (three animals per treatment). Each lot was housed in a separate stall and received the assigned experimental diet for 10 days. Thereafter, the animals were placed in individual cages designed for isotopic studies.
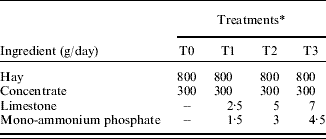
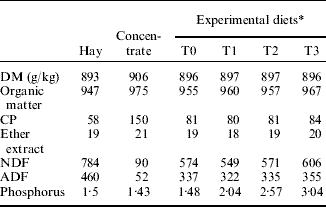
The basal diet was a mixed ration with coast cross (Cynodon dactylon L. (Pers.) cv. ‘coast cross’) grass hay as roughage, and a concentrate mixture composed of (per kg concentrate): 820 g cassava meal, 130 g soya bean meal, 30 g urea and 20 g of a mineral premix (containing, per g of mixture, 0·4 g S, 0·337 g NaCl, 0·161 g MgO, 45·7 mg FeSO4, 32 mg ZnSO4, 14·8 mg MnSO4, 9 mg CuSO4, 0·9 mg KI, 0·1 mg Na2SeO3 and 0·08 mg CoSO4). The treatments consisted of the basal diet supplemented with different amounts of mono-ammonium phosphate (0, 1·5, 3 and 4·5 g/day) and limestone to provide increasing P (1·5, 2·0, 2·5 and 3·0 g P/kg dry matter (DM); representing experimental treatments T0, T1, T2 and T3, respectively) and Ca levels respectively (Table 1). The chemical composition of hay, concentrate and experimental diets is presented in Table 2. Feed (1100 g/day equivalent to 30·6 g feed/kg live weight) was offered twice daily and feed refusals were collected daily and weighed to determine DM intake (DMI).
Feed ingredients and composition of experimental diets
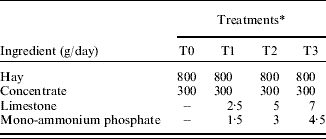
* T0, T1, T2 and T3 correspond to treatments providing 1·5; 2·0; 2·5 and 3·0 g P/kg DM.
Chemical composition of hay, concentrate and experimental diets (g/kg DM unless otherwise stated).
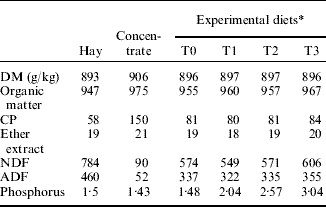
* T0, T1, T2 and T3 correspond to treatments providing 1·5; 2·0; 2·5 and 3·0 g P/kg DM.
Following an adaptation period of 1 week, a single dose of 7·4 MBq of 32P in 1 ml of saline solution (8·5 g NaCl/l distilled water) was injected into the jugular vein, and subsequently samples of plasma were collected every morning before feeding. Blood samples (10 ml) were taken (collected in Vacutainer® tubes) from the left jugular vein every 24 h for the 6 days after injection of 32P dose. Saliva and rumen fluid samples were taken during the morning before feeding on days 4 and 6 after injection. No more samples of saliva or rumen fluid were collected so as to minimize possible stress caused to the animals. Before feeding the animals, saliva was collected on small pieces of plastic sponge placed directly into the animal's mouth and held by a pair of pincers, without impairing chewing movements. After a short time, soaked sponges were squeezed and a sample of 10 ml of saliva was gathered and thereafter frozen and stored until further analysis. Rumen contents were withdrawn using an oesophageal tube (10 mm diameter) and a syringe to pump out 50 ml of sample at each time of collection. Rumen fluid was obtained after filtering the rumen sample using gauze, and centrifuging the filtrate at 3000 rpm for 15 min.
Animals were slaughtered on the last day of collection, following which rumen contents were weighed and ruminal volume was estimated (‘physiological volume’). Thereafter the carcasses were disposed of in specially designed concrete holes.
Analysis of samples
Samples of feed and feed refusals were analysed for DM, crude protein (CP), P and acid detergent fibre (ADF) following recommendations of the Association of Official Analytical Chemists (1995). Neutral detergent fibre (NDF) was determined according to Mertens (Reference Mertens2002), without using amylase or sodium sulphite (Table 2).
Blood samples were diluted in a solution of trichloroacetic acid (TCA; 100 g TCA/l distilled water) mixing 1 ml with 9 ml TCA, and then centrifuged at 1100 g for 10 min for plasma separation and protein precipitation. Concentration of inorganic P in plasma was determined by colorimetry (Fiske & Subbarow Reference Fiske and Subbarow1925). Samples of saliva and rumen fluid were diluted in a solution of TCA (100 g TCA/l distilled water) for protein precipitation (0·5 ml saliva+9·5 ml TCA and 0·5 ml rumen fluid+4·5 ml TCA), and then inorganic P was measured by colorimetric analysis (Fiske & Subbarow Reference Fiske and Subbarow1925).
Radioactivity of 32P was measured in a Packard Liquid Scintillation Spectrometer (model 2450B) using Cerenkov radiation. For estimation of specific radioisotope activity, a standard 32P solution (7·4 MBq 32P diluted in 1 litre distilled water) was prepared, and then 1 ml of standard solution was transferred to a counting vial for radioactivity measurement. The value recorded for this solution (standard radioactivity=278 245 dpm) was used as the reference for the specific activity (SA) calculations. For 32P measurements, 1 ml of liquid samples (plasma, saliva or rumen fluid) was diluted with 19 ml of distilled water into counting vials and radioactivity (32P) measured in the scintillation counter.
Calculations
Specific activities of 32P in plasma, rumen and saliva (SAp, SAr and SAs) were calculated as proportion of standard radioactivity/g of P, where proportion activity is calculated from the relation between activity measured in samples of plasma, rumen fluid or saliva and that determined in the standard solution, and the value was expressed per g of P in the corresponding sample (Roque et al. Reference Roque, Dias, Vitti, Silva Bueno, Cunha, Santos and Bueno2007).
The calculations proposed by Smith et al. (Reference Smith, Kleiber, Black and Baxter1955) were used to estimate flow of endogenous P into the rumen and P turnover time in the rumen. Secretion rate of endogenous P into the rumen (S r; g/day) was calculated as
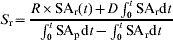
where R is the pool size of P in the rumen (grams of P), t is the time after 32P injection, SAr(t) is the value of SAr recorded at 6 days after 32P injection and D is the dietary P intake (g/day). Measured values of rumen volume (litres) and of P concentration in rumen fluid (C r; g/l) were used to estimate R. The SA of the ruminal and plasma P over time following tracer administration ( and
 , respectively) was calculated from the corresponding SA v. time curves. Turnover time of rumen P (T; day) was

In order to calculate S r, SAr and SAp, data at different times post-injection were used. Data reported by Smith et al. (Reference Smith, Kleiber, Black and Baxter1955) were adjusted for dose and combined with SAr and SAp data measured in the present study for the purposes of curve fitting. Thereafter the areas under the curve were calculated for each animal. Based on the plots of SAr against time, a linearly increasing trend was assumed from 0 to 8 h, and then a negative exponential curve was fitted to the assembled SAr data to describe the period 8 to 144 h after 32P injection. As for SApv. time curves, the initial segment between 0 and 4 h was assumed to follow a decreasing linear trend, and thereafter the same negative exponential curve was fitted to the assembled SAp data for the period beyond 4 h post-injection (4–144 h).
Statistical analysis
Experimentally measured data (P intake, saliva, rumen and saliva P concentrations and isotopic SA in saliva, rumen and plasma) and estimated values of endogenous P entering the rumen and P turnover time were analysed by one-way analysis of variance (ANOVA) according to a completely random design. Data were obtained from 12 animals, three for each treatment (P level). A completely random design with treatments assigned to subjects (parallel design) was appropriate and sufficient for the objectives of the present study, assuming that there were no systematic differences between the groups of subjects, and any differences can be attributed to treatment effects. A repeated measurements design (crossover, changeover or Latin-square) could, in theory, be an alternative to reduce the error variance and the individual subject differences from the overall treatment effect, because in these crossover designs each subject (experimental unit) is sequentially exposed to all treatments. However, such designs could not be used in a study of this nature because the animals had to be slaughtered at the end of a treatment and residual radioactivity in animal organs or tissues would affect measurements in following experimental periods when another treatment was applied to the same subject. The statistical analysis was performed using the GLM procedure (SAS 1999a), with level of P intake as the only source of variation (degrees of freedom of the error=8). Standard error of means was obtained using the SAS LSMEANS procedure.
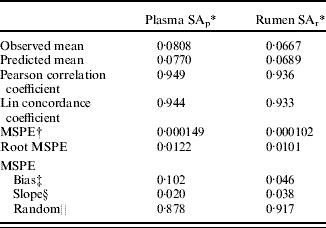
For the integrals in the S r formula, the area under the curve (AUC) was calculated using a SAS macro (SAS 1999b; Yeh Reference Yeh2002). To build up the SA v. time curves to an acceptable number of data points, data measured in our experiment were merged with those reported by Smith et al. (Reference Smith, Kleiber, Black and Baxter1955). To validate this approach, a negative exponential function was fitted to the pooled dataset, and SAr and SAp values predicted from the fitted curves were compared with those measured experimentally (SAr at 4 and 6 days, and SAp at 4, 5 and 6 days after 32P injection) using the concordance or reproducibility coefficient (Lin Reference Lin1989) and the analysis of mean square prediction error (MSPE) (Table 3), calculated as
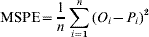
where n is the number of observations, Oi is the observed value and Pi is the predicted value. Root MSPE expressed as a proportion of the observed mean gives an estimate of the overall prediction error. The MSPE was decomposed into error due to random variation, error due to deviation of the regression slope from unity, and error due to central (mean) bias (Bibby & Toutenburg Reference Bibby and Toutenburg1977). High correlation and concordance coefficients between observed and predicted values (Table 3) indicate a high degree of reproducibility between both values. The MSPE analysis also showed that predicted values of SAp and SAr were close to observed values (Table 3) and, in both cases, random variation was the major source of error (Table 3).
Observed and predicted SA of P in plasma and rumen
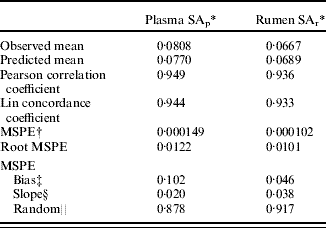
* SA expressed as proportion of standard radioactivity/g of P; values corresponding to mean from 4, 5 and 6 days after 32P injection for SAp and 4 and 6 days after 32P injection for SAr.
† Mean square prediction error.
‡ Error due to central bias expressed as a proportion of MSPE.
§ Error due to slope bias expressed as a proportion of MSPE.
∥ Error due to random variation expressed as a proportion of MSPE.
RESULTS
DMI was not significantly different among treatments (P>0·05) with average daily intakes of 972, 943, 971 and 1017 g DM/day (s.e.m.=47·5) for T0, T1, T2 and T3, respectively. Average daily intake was 27·1 g DM/kg live weight (s.e.=0·60).
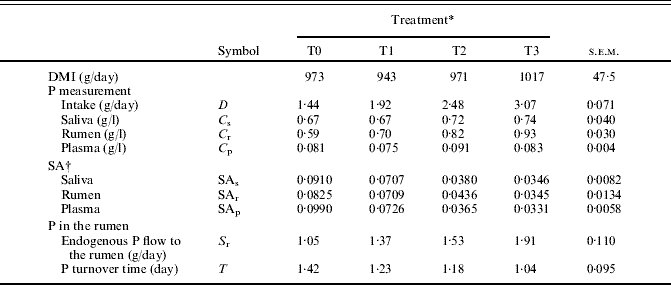
There were significant differences between treatments in daily P intake (Table 4), which increased, as expected, with increased amounts of P provided as mono-ammonium phosphate. The concentration of P in feed DM was below National Research Council (NRC) (1985) recommended allowances in treatments T0 and T1 (1·5 and 2·0 g/kg DM), while T2 was close (2·5 g/kg DM) to the recommended value (2·4 g/kg DM) and T3 was above (3·0 g/kg DM) requirements established by NRC (1985).
Phosphorus measurements, specific activities and estimated values of endogenous secretion and turnover time of P in the rumen
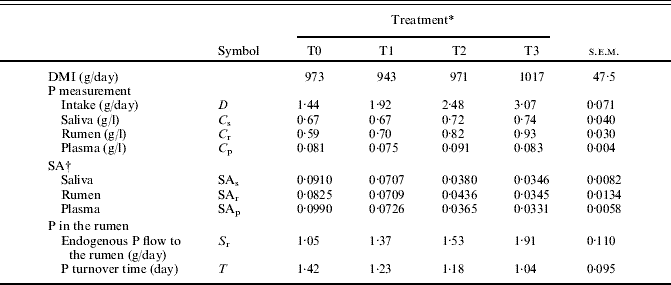
* T0, T1, T2 and T3 correspond to treatments providing 1·5; 2·0; 2·5 and 3·0 g P/kg DM.
† SA expressed as proportion of standard radioactivity/g of P; values corresponding to 6 days after 32P injection.
Salivary P concentration (C s; g/l) values are for mixed saliva, due to the method used for saliva collection. In studying ruminant saliva, McDougall (Reference Mcdougall1948) observed that mixed saliva usually consists largely of parotid saliva. Average C s values were similar for all treatments (P>0·05) (Table 4), with a significant linear correlation between C s and DMI (g/day):

Mean rumen volume was 5·9, 5·7, 5·8 and 5·5 litres (s.e.m.=0·37) representing 0·16, 0·15, 0·16 and 0·15 kg/kg live weight for T0, T1, T2 and T3, respectively.
Phosphorus concentration in rumen fluid (C r; g/l) was different among treatments (P<0·05) and was significantly correlated with P intake (D; g/day):

Specific activities of isotope 32P in saliva (SAs), rumen (SAr) and plasma (SAp) decreased with increasing P levels in diet (P<0·05; Table 4). SA values in the three compartments were significantly correlated with each other (Pearson correlation coefficients of 0·89 (SAs−SAr); 0·81 (SAs−SAp) and 0·82 (SAr−SAp)).
Mean values for secretion rate of endogenous P into the rumen (S r; g/day) were different among treatments (P<0·05; Table 4), and this secretion rate was related to P intake (D; g/day), P in rumen fluid (C r; g/l) and P turnover time (T; day):

The mean values of P turnover time (T; day) are shown in Table 4, and were significantly different among treatments. S r increased and T decreased as P intake became higher.
DISCUSSION
Phosphorus intake increased with addition of mono-ammonium phosphate for treatments T1, T2 and T3, whereas in treatment T0 animals did not receive this mineral source of P. Increased levels of Ca corresponding to increased levels of P were established with the aim of maintaining the Ca:P ratio equal to 2:1 for all treatments. Several researchers have shown Ca may affect P metabolism (Challa et al. Reference Challa, Braithwaite and Dhanoa1989; Dias et al. Reference Dias, Kebreab, Vitti, Roque, Bueno and France2006), therefore keeping the Ca:P ratio similar among treatments precludes possible influence of Ca upon P.
Mean values of salivary P concentration (C s) ranged between 0·67 and 0·74 g/l, only slightly higher than values reported by McDougall (Reference Mcdougall1948) but noticeably higher than those reported by Bailey (Reference Bailey1961). Differences in the procedures for saliva collection may explain these discrepancies (Kincaid & Rodehutscord Reference Kincaid, Rodehutscord, Pfeffer and Hristov2005). The current method was similar to that of McDougall (Reference Mcdougall1948).
A relationship between C s and DMI was observed. This was in agreement with Bravo et al. (Reference Bravo, Sauvant, Bogaert and Meschy2003b) who showed that DMI affected salivary P concentration. Karn (Reference Karn2001) suggested that whereas saliva secretion is related to DMI, salivary P concentration is related to plasma P concentration. According to Durand & Kawashima (Reference Durand, Kawashima, Ruckebush and Thivend1979), there is a relationship between salivary P concentration and rate of secretion in saliva. Therefore, DMI may be also related to salivary P concentration. The relationship between P intake and salivary P concentration remains uncertain, although it has been suggested that at higher P intakes salivary P flow decreases whereas at lower P intakes salivary P flow remains constant (Coats & Wright Reference Coats and Wright1957; Bravo et al. Reference Bravo, Sauvant, Bogaert and Meschy2003b).
The relationship between salivary and plasma P concentrations is well known, as demonstrated by several researchers (Scott & Beastall Reference Scott and Beastall1978; Mañas-Almendros et al. Reference Mañas-Almendros, Ross and Care1982; Challa et al. Reference Challa, Braithwaite and Dhanoa1989). The lack of differences in concentration of salivary P between treatments may be related to the similar values of plasma P concentration between treatments. The ratio of salivary to plasma P varied from 6·2:1 to 10·5:1, with most values ranging between 8 and 9:1. These ratios are close to those reported by Tomas et al. (Reference Tomas, Moir and Somers1967) but lower than the ratio 15:1 reported by McDougall (Reference Mcdougall1948) in sheep.
Some researchers have proposed that salivary P is not under homeostatic regulation, and that P intake rather than DMI or salivary flow rate is the major factor influencing changes in endogenous P secretion (Scott et al. Reference Scott, Rajaratne and Buchan1995). Although in the current study P intake and salivary P concentration were not correlated, there was, however, a significant effect of P intake on the rate of endogenous P secreted into the rumen (S r).
Phosphorus concentration in rumen fluid (C r) was different between treatments (P<0·05) and was correlated with dietary P intake, in agreement with Tomas et al. (Reference Tomas, Moir and Somers1967) and Nel & Moir (Reference Nel and Moir1974) who observed a similar relationship in their studies. When C r (mg/l) was plotted against dietary P (g P/kg DM), the relationship was linear (C r=282·3 dietary P+175·4; n=12; R 2=0·87) and closely matched the relationship obtained by Witt & Owens (Reference Witt and Owens1983). Those authors found that with 1 g P/kg DM in the diet the concentration of P in ruminal fluid was 417 mg/l, whereas according to the equation in the present study for 1 g P/kg DM in diet the ruminal P concentration would be 457 mg/l. The present results also indicate that at higher P intakes, ruminal P concentrations would be expected to increase linearly. Mean C r found for animals fed 1·44 g P/kg DM in the diet was 595 mg/l, a value close to 619 mg/l reported by Witt & Owens (Reference Witt and Owens1983) for sheep fed a diet containing 1·66 g P/kg DM. Conversely, Evans & Davis (Reference Evans and Davis1966) reported a positive relationship between dietary and rumen P concentrations, up to a plateau immediately above 1·6 g dietary P/kg DM.
Although Tomas (Reference Tomas1973) suggested that most of the inorganic P in rumen fluid originates from saliva secretion, in the present study salivary and ruminal P concentrations were not correlated, in agreement with Tomas et al. (Reference Tomas, Moir and Somers1967). Concentration of P in the rumen seemed to be determined mainly by P intake. Kincaid & Rodehutscord (Reference Kincaid, Rodehutscord, Pfeffer and Hristov2005) suggested that rumen P is directly affected by dietary P concentration and indirectly by a subsequent salivary effect. The concentration of P in the rumen can also be affected by the rate of phosphate absorption from the rumen and by phosphate solubility (Bailey Reference Bailey1961). Both processes are influenced, in turn, by the chemical form of dietary P, what could explain some of the differences in C r between T0 (all dietary P is organic) and the other treatments (a significant amount of dietary P is from a mineral salt).
In order to calculate S r (endogenous P secreted into the rumen), SAp and SAr data measured in the current study were combined with those reported by Smith et al. (Reference Smith, Kleiber, Black and Baxter1955). The predicted values of SAp and SAr were in close agreement with current observed values, given the low MSPE and high correlation and concordance coefficients between both values (Table 3). This agreement may be explained by the fact that data reported by Smith and co-workers were also measured in growing sheep (4 and 10 months) and, although in the present work different levels of P were supplied to animals, the level of dietary P does not affect the decay rate of 32P in plasma and rumen (unpublished data) validating the combination of data from both studies. Random variation was the main source of error indicating that there was no major bias in the predictive ability of the equations used in the current study and the predicted SAp and SAr can be used with confidence to calculate S r.
Measurements of SAs, SAr and SAp were statistically different between treatments as a result of increasing P ingestion. When compared within each treatment, SAr was in most cases higher than SAs and SAp, suggesting that a possible endogenous source other than saliva may have contributed to total endogenous P flowing to the rumen. The significant relationship between SAs and SAr would confirm that saliva is the main source of endogenous P flowing into rumen, although the contribution of endogenous P coming from other sources may not be ruled out. In agreement, Smith et al. (Reference Smith, Kleiber, Black and Baxter1955) reported that salivary secretion could not account for the quantity of endogenous P that entered the rumen and suggested that part of endogenous P is not of salivary origin, probably entering directly through the rumen wall. Scarisbrick & Ewer (Reference Scarisbrick and Ewer1951), studying the absorption of inorganic phosphate from the rumen in sheep, observed that 32P injected into the rumen appeared in the carotid artery to a lesser extent than in the ruminal vein, indicating that absorption of inorganic phosphate from the rumen is plausible. In addition, Scarisbrick & Ewer (Reference Scarisbrick and Ewer1951) reported that inorganic phosphate could also flow from blood to the rumen. Supporting these observations, Parthasarathy et al. (Reference Parthasarathy, Garton and Phillipson1952) demonstrated that movement of inorganic P may occur in both directions across the rumen epithelium. Breves et al. (Reference Breves, Holler, Packheiser, Gabel and Martens1988) concluded that the reticulo-rumen wall is permeable to inorganic phosphate, which can pass though in either direction, with a significant relationship between the concentration of inorganic phosphate in the fluid and its net flux across the wall.
The proportion of S r relative to P intake tended to decrease from T0 to T3 (0·73, 0·71, 0·62 and 0·62 for T0, T1, T2 and T3, respectively), suggesting a compensation for the lower P contribution to the rumen when P intake is lower. As P intake is increased, S r will also increase, but its relative contribution to total P reaching the rumen will gradually decrease.
Turnover time of P in the rumen (T; day) was calculated according to Smith et al. (Reference Smith, Kleiber, Black and Baxter1955). The turnover times obtained in the current study (Table 4) are comparable with the value (27·7 h or 1·15 day) obtained by Smith et al. (Reference Smith, Kleiber, Black and Baxter1955) in sheep aged 10 months, who also suggested that turnover time could be shorter in younger animals. Guyton et al. (Reference Guyton, McKinney and Knowlton2003) reported shorter ruminal P turnover times as P intake was increased in lactating cows fed phytic acid, in agreement with current results. The longest turnover time was observed in sheep fed the diet with the lowest P level, and decreased in response to supplementation with inorganic P. Increasing levels of dietary P and, in particular, of inorganic P may have favoured P fluxes into and out of the rumen, shortening the turnover time. Rumen P turnover could be important in providing P to ruminal micro-organisms to match their requirements, as the element is essential for the maintenance and growth of ruminal microbes (Durand & Komisarczuk Reference Durand and Komisarczuk1988), and this is one of the key targets of P metabolism in ruminants. Nel & Moir (Reference Nel and Moir1974) concluded that hardly any P deficiency can possibly be so severe as to cause a P deficiency in the rumen as far as the requirements of the rumen microbes are concerned.
The present results indicate that both dietary and endogenous provisions of P to the rumen are increased with higher P intakes. However, the relative contribution of endogenous P secretion to the total flow of P entering the rumen decreases gradually as P intake becomes higher, indicating that this endogenous secretion is relatively more important at lower P intakes, as a means of ensuring a minimum supply of this mineral to the rumen. It would be of interest to ascertain at what metabolic expense P is supplied to rumen micro-organisms without impairing overall P metabolism in the animal.
The authors thank Fundação de Amparo a Pesquisa do Estado de São Paulo (FAPESP Proc. 2004/14532-5) for financial support. Funding was provided, in part, by the Canada Research Chairs Program.