Introduction
Wheat (Triticum aestivum Linnaeus; Poaceae) is one of the most important cereal crops in the United States of America, with over 20.2 million ha planted every year from which more than five million are planted in the state of Montana, United States of America (United States Department of Agriculture, National Agricultural Statistics Service 2016). The wheat midge, Sitodiplosis mosellana Géhin (Diptera: Cecidomyiidae) is a serious pest of spring wheat and can be found throughout the Northern Great Plains of North America (Barnes Reference Barnes1956; Barnes et al. Reference Barnes, Miller and Arnold1959; Barnes and Arnold Reference Barnes and Arnold1960; Roberts and Bragg Reference Roberts and Bragg2012). Early reports indicate that this species was introduced into North America during the mid-1800s and subsequently spread throughout the wheat growing areas of western Canada and northern United States of America (Reeher Reference Reeher1945; Barnes Reference Barnes1956).
Damage to the crop is caused by the midge larva feeding on the seed during early stages of development, thus reducing yield and grain quality (Olfert et al. Reference Olfert, Mukerji and Doane1985; Lamb et al. Reference Lamb, McKenzie, Wise, Barker and Smith2000a; Smith et al. Reference Smith, Wise, Fox, Vera, DePauw and Lukow2014). Damage may be variable and depend on the number of larvae present as well as when feeding begins relative to the development of the kernel (Dexter et al. Reference Dexter, Preston, Cooke, Morgan, Kruger, Kilborn and Elliott1987; Helenius and Kurppa Reference Helenius and Kurppa1989; Smith et al. Reference Smith, Wise, Fox, Vera, DePauw and Lukow2014). In addition, loss of seed biomass due to midge injury is well documented (Dexter et al. Reference Dexter, Preston, Cooke, Morgan, Kruger, Kilborn and Elliott1987; Helenius and Kurppa Reference Helenius and Kurppa1989; Lamb et al. Reference Lamb, Tucker, Wise and Smith2000b). However, while loss in seed weight can be significant, compensation by an increase in biomass in uninfested seed may occur (Helenius and Kurppa Reference Helenius and Kurppa1989). Damaged seed may lead to downgrading at the point of sale, due to a reduction in test weight and falling number. Historically, low population densities of the wheat midge have been reported in northeastern Montana (Shanower Reference Shanower2005). Similarly, anecdotal observations suggest that this pest has been present for several years in the northwestern portion of the state, including Flathead County. Further, an outbreak that occurred during 2006 caused an estimated economic loss of over 1.5 million USD (Stougaard et al. Reference Stougaard, Bohannon, Picard, Reddy, Talbert, Wanner and Weaver2014). Surveys conducted in recent years reveal severe infestations can be observed in this area (E.R.E., unpublished data).
Efforts to manage wheat midge populations have resulted in extensive investigation into host plant resistance, which now represents one of the most important management options for farmers. However, pesticides and biological control are also used (Oakley Reference Oakley1994; Elliott et al. Reference Elliott, Olfert and Hartley2011).
Resistant wheat cultivars reduce wheat midge populations by negatively affecting larval performance or killing the larva through production of antibiotics (antibiosis) (Barker and McKenzie Reference Barker and McKenzie1996; Ding et al. Reference Ding, Lamb and Ames2000; Lamb et al. Reference Lamb, McKenzie, Wise, Barker and Smith2000a; McKenzie et al. Reference McKenzie, Lamb, Aung, Wise, Baker and Olfert2002). Currently, the source of antibiosis resistance to the wheat midge is derived from a single gene (Sm1), which impedes larval development, resulting in high levels of mortality. In addition to antibiosis resistance, some wheat cultivars reduce wheat midge preference through antixenotic traits (Lamb et al. Reference Lamb, Wise, Smith, McKenzie and Thomas2002; Gharalari et al. Reference Gharalari, Fox, Smith and Lamb2009, Reference Gharalari, Smith, Fox and Lamb2011; Blake et al. Reference Blake, Stougaard, Weaver, Sherman, Lanning and Naruoka2011). Lamb et al. (Reference Lamb, Wise, Smith, McKenzie and Thomas2002) demonstrated that antixenosis in six wheat lines resulted in a twofold reduction in midge preference relative to susceptible checks.
The extent to which spring wheat cultivars adapted to Montana vary for the nonpreference trait is unknown. Furthermore, although the midge is a recurrent wheat pest in northwestern Montana, economic thresholds for infestation have not been determined. This information will be beneficial for affected spring wheat producers. Concurrently, understanding the relationship between wheat agronomic traits and midge infestation may be important by providing insights for breeding and selection programmes. As an example, wheat cultivars may escape infestation by reaching the heading stage before midge emergence, a phenomenon that has been referred to as “pseudo-resistance” or avoidance (Kurppa Reference Kurppa1989; Lamb and Wise Reference Lamb and Wise1999). Therefore, planting early maturing cultivars is recommended in hope to prevent high infestations.
Understanding which individual traits can influence midge infestation levels is required to initiate a targeted breeding programme directed at the development of wheat midge resistant spring wheat varieties.
The specific objectives of this study were to: (1) determine the level of susceptibility to wheat midge infestation in commercial hard red spring wheat cultivars under field conditions; (2) evaluate the effect of selected agronomic variables on wheat midge infestation; and (3) determine yield loss and the economic injury level (EIL) associated with wheat midge infestations in northwestern Montana.
Materials and methods
Field plots and data collection
Wheat midge infestation among spring wheat cultivars was examined by evaluating entries in the Montana State University Advanced Spring Wheat Yield Trial (AYT). The Advanced Spring Wheat Yield Trial consists of 64 entries, with specific entries varying annually. However, a subset of 16 entries was consistently grown from 2006 through 2011. It was from this subset that evaluations were conducted to evaluate for susceptibility to the midge. Evaluations were conducted at the Northwestern Agricultural Research Center, located near Kalispell, Montana (48°15'N, 114°15'W). The studies were established as a randomised complete block design with three replications per year. All plots were evaluated for yield, heading date, and plant height. Plots from the first replication were used to determine grain protein, test weight and midge infestation. Individual plots were 5 m long, with seven rows spaced 15 cm apart, and were planted at a seeding rate of 90 kg/ha with a double-disk drill to a depth of 4 cm. The soil type each year was a Creston silt loam (coarse silty, mixed, Pachic Haploxeroll) with 4.5% organic matter and a pH of 7.5. Experiments were established under non-irrigated conditions using conventional tillage practices and fertilised based on soil test results. Yield data were adjusted to 13% moisture. Mean heading date was estimated when ~50% of the plot had headed.
Determination of the Sitodiplosis mosellana infestation level
Midge infestation was determined by randomly selecting three wheat spikes per plot from the first replication during the first two weeks of August when the larvae had matured and before they had dropped to the soil. Wheat spikes were stored at room temperature (25 °C on average) until they could be dissected. The number of seeds and the number of larvae were counted from each spike and the mean of the three spikes was recorded. The only observable damage to seed was caused by midge attack. As such, midge-damaged seed was assessed during the first three years of the study by visually estimating the proportion of damaged seeds. All damaged seed was considered harvestable (individual seed weight >8 mg following Lamb et al. (Reference Lamb, Tucker, Wise and Smith2000b) and Smith et al. (Reference Smith, Wise, Fox, Vera, DePauw and Lukow2014)).
Calculation of yield loss and the economic injury level
The potential yield was determined for all the cultivars combined based on the per cent damaged seed and the grain yield for 2006, 2007, and 2008, as described in Olfert et al. (Reference Olfert, Mukerji and Doane1985). The economic injury level was estimated based on the equation EIL=C/VIDK, where C is the cost of control, V the market value of hard red spring wheat at 14% protein, I the injury caused per insect, D the damage per injury unit, and K the proportion of reduction in insect damage, which in this case is 100% or 1.0 (Pedigo and Rice Reference Pedigo and Rice2009). The injury per insect (I) was determined by regressing the per cent seed damage versus the number of midge larvae per spike. The slope of the regression line represents the per cent seed damage per midge larva. Concurrently, the damage per injury unit (D) was determined by regressing yield (adjusted for years) versus the per cent seed damage. The slope of the regression line represents the reduction in yield per injury unit (1% seed damage per spike). The cost of control includes the insecticide (lambda-cyhalothrin) plus application cost for a total of USD $37/ha. We assume 100% insect mortality. The wheat market price was USD $0.16 in 2006, USD $0.26/kg in 2007, and USD $0.27 in 2008 (United States Department of Agriculture, National Agricultural Statistics Service 2016). Per cent yield loss associated with the economic-injury-level values was calculated from the equations of the two regression lines indicated above and considering a yield potential of 3946 kg/ha.
Statistical analysis
All statistical analysis was performed using R version 3.3.0 (R Core Team 2016). All models were constructed using the “lme” function in the “nlme” package (Pinheiro et al. Reference Pinheiro, Bates, DebRoy and Sarkar2016). Graphical displays were constructed using the “ggplot2” package (Wickham Reference Wickham2009). To account for dependencies of measurements within the same year, models included a random effect for year. As residual plots showed that errors for midge larva per spike were skewed to the right and exhibited heteroscedastic variation, models were fit using the square-root transformation of the original measurements. The back-transformed least-squares means associated with midge infestation are presented in Table 1.
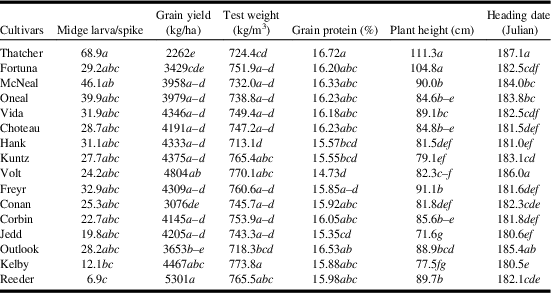
Least-squares means and compact letter display (using an α=0.05 Tukey–Kramer adjustment on all pairwise differences) for differences in wheat midge larvae (square-root) and agronomic traits across 16 spring wheat cultivars for six years combined, from 2006 to 2011.

Note: Cultivars with no common letters are detectably different on the specific parameter. For midge/spike, the model and compact letter display were constructed on the square-root scale, and the displayed least-square means were back-transformed for interpretability.
Differences in midge counts and agronomic variables across cultivars were explored using analysis of variance (ANOVA). Where a cultivar effect was statistically significant, differences between cultivars were further explored using pairwise 95% confidence intervals and a Tukey–Kramer adjustment using the “glht” and “cld” functions in the “multcomp” package (Hothorn et al. Reference Hothorn, Bretz and Westfall2008).
Relationships between agronomic variables and midge infestation were examined using multiple linear regression models with a random effect for year. Heading date and plant height were used to predict midge infestation. Midge infestation was used to predict yield, test weight, and grain protein. Model goodness-of-fit was examined with the conditional R
2 metric (
 $R_{c}^{2} $
) (Nakagawa and Schielzeth Reference Nakagawa and Schielzeth2013), which quantifies the proportion of model variation explained by the fixed and random effects.
Results
Differences between cultivars and effect of agronomic traits on wheat midge
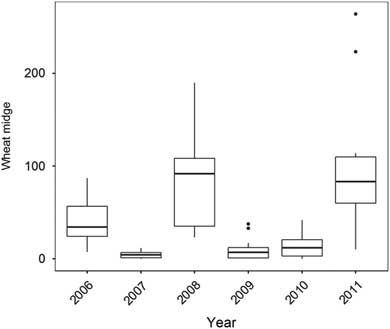
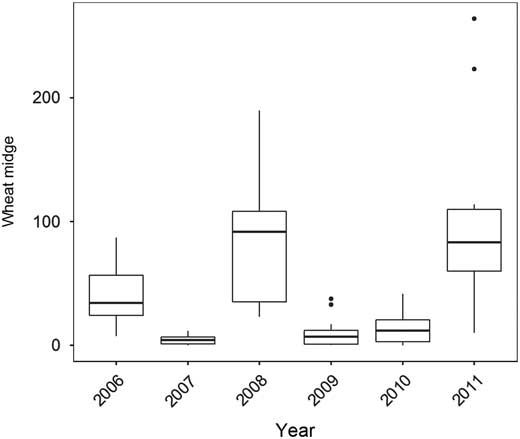
There was high variability in infestation levels within a single year and between years (Fig. 1). Averaged over cultivars, the annual infestation level during 2006–2011 ranged between five and 96 midge larvae per spike, with the lowest infestations (<15 larvae/spike) in 2007, 2009, and 2010 and the highest (>80 larvae/spike) in 2008 and 2011, while there was an intermediate infestation level (40 larvae/spike) in 2006 (Fig. 1).
Boxplots of wheat midge larvae per spike per plot across years of the study (2006–2011).
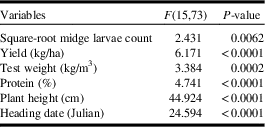
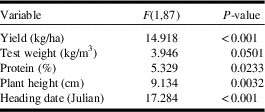
There were statistically significant cultivar effects on larvae number (Table 2). The highest larva number was associated with “Thatcher” (68.9) and the lowest with “Reeder” (6.9) (Table 1). Pairwise comparisons indicated differences in larva numbers between “Reeder” and “Thatcher”, “Kelby”, and “Thatcher” and between “Reeder” and “McNeal”. Concurrently, the cultivar effects on yield, test weight, grain protein, plant height, and heading date were statistically significant (Table 2). “Reeder” had the highest yield (5301 kg/ha) and “Thatcher” the lowest (2262 kg/ha). “Thatcher” produced yields similar to “Conan”, “Fortuna”, and “Outlook”. In turn, “Reeder” produced higher yields than “Conan”, “Fortuna”, “Outlook”, and “Thatcher”. Likewise, “Volt” produced yields greater than “Conan”, “Fortuna”, and “Thatcher”. However, no yield differences existed among the other cultivars.
Analysis of variance F-statistics for cultivar effects (after accounting for year-to-year variation) on midge-larvae (square root), yield, test weight, grain protein, plant height, and heading date.
“Hank” had the lowest test weight (713.1 kg/m3) and “Kelby” had the highest (773.8 kg/m3). “Kelby” produced higher test weight than “Hank”, “Outlook” (718.3 kg/m3), and “Thatcher” (724.4 kg/m3). “Volt” (770.1 kg/m3) also produced higher test weight than “Hank” (Table 1). At the same time, “Volt” produced the lowest protein (14.7%) while “Thatcher” had the highest protein content (16.7%). “Thatcher” also produced higher protein than “Jedd” (15.3%), “Kuntz” (15.5%), and “Hank” (15.5%) (Table 1). “Thatcher” and “Fortuna” were the tallest cultivars (111.3 and 104.8 cm, respectively), whereas “Jedd” (71.6 cm) and “Kelby” (77.5 cm) were the shortest.
The latest maturing cultivars, as measured by heading date, were “Thatcher”, “Volt”, and “Outlook” (187.2, 186.0, and 185.4 days, respectively). “Kelby” was the earliest maturing cultivar, heading at 180.5 days. However, the heading date for “Kelby” was statistically equivalent to that of “Conan”, “Corbin”, “Choteau”, “Freyr”, “Jedd”, and “Reeder”.
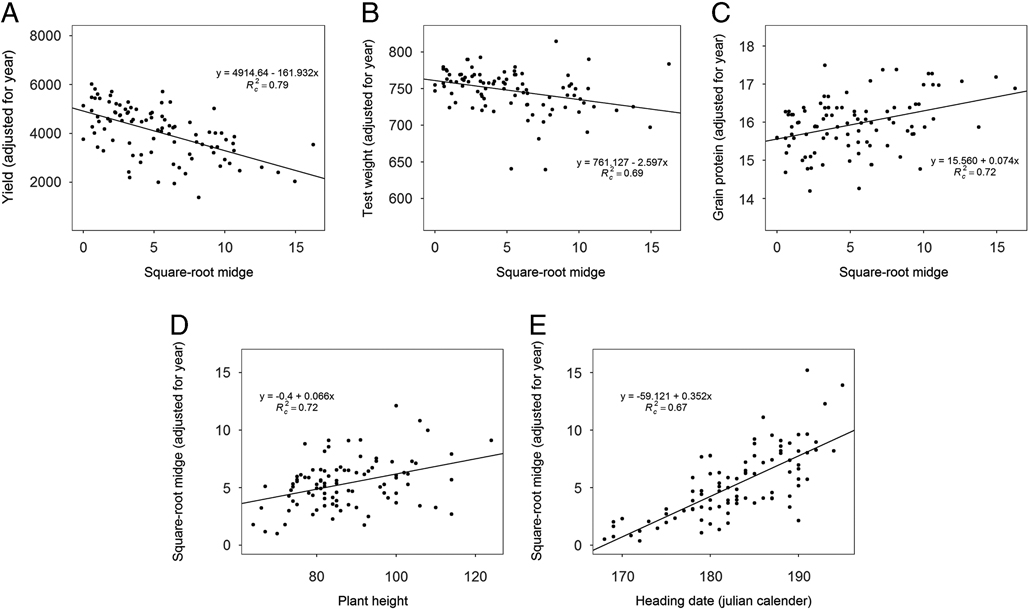
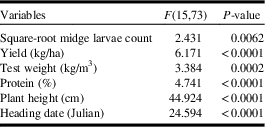
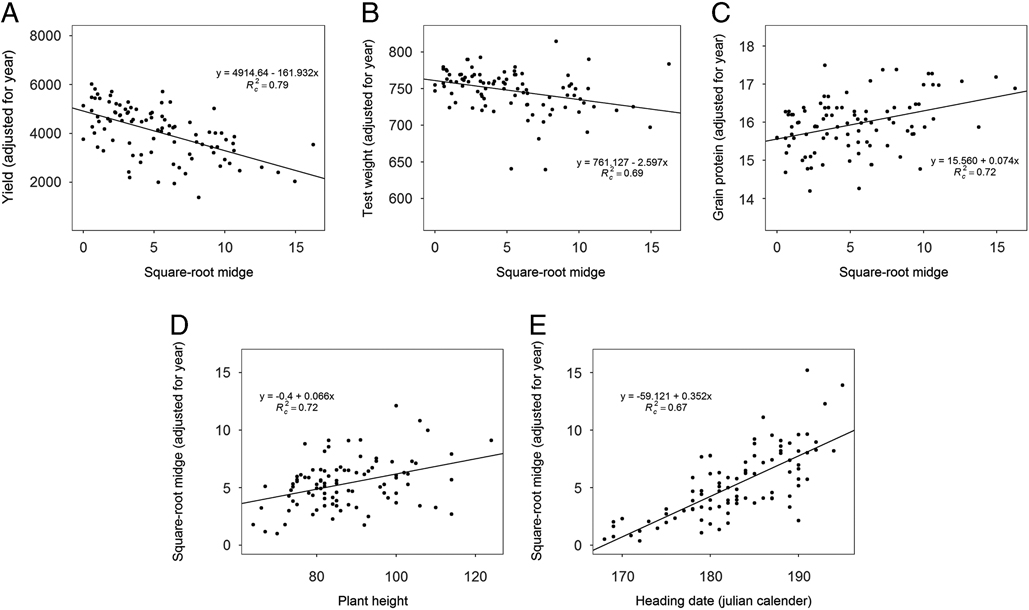
Overall, there was a statistically significant association between the midge population and yield, test weight and grain protein (Table 3). Regression analysis revealed a negative relationship between midge infestations and yield (Fig. 2A) and test weight (Fig. 2B). In contrast, there was a positive relationship with grain protein (Fig. 2C). Evidence of associations between heading date and plant height on midge infestation were also found (Table 3). There was a positive relationship between midge population and plant height (Fig. 2D) and heading date (Fig. 2E), where midge populations increased as plant height increased and as heading date increased.
Relationship between wheat midge larvae per spike (square root) and A, yield; B, test weight; C, grain protein; D, plant height; and E, heading date. The depicted lines represent the estimated regression lines between each pair of variables assuming a random effect for observations within the same year. In each plot, the estimated year effects have been subtracted from the observations on the y-axis, allowing for a visual representation of the relationship between the agronomic parameters after accounting for the year. The conditional R
2 metric (
 $R_{c}^{2} $
) is displayed as a goodness-of-fit measure.
F-statistics and P-values for regression coefficients examining associations between wheat midge (square-root) and yield, test weight, grain protein, plant height, and heading date.
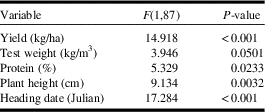
Note: Wheat midge was used to predict yield, test weight, and grain protein, whereas plant height and heading date were used to predict wheat midge counts.
Calculation of yield loss and the economic injury level
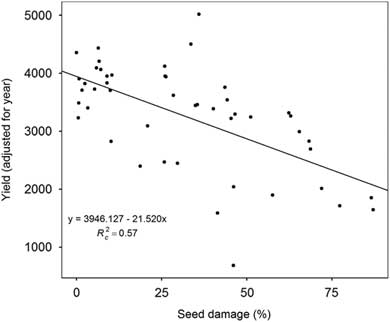
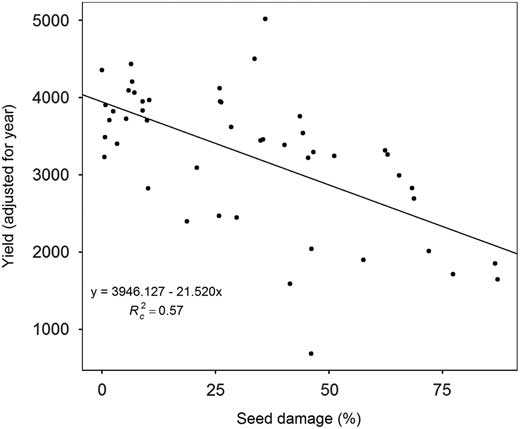
Based on the relationship between yield and the per cent seed damage (Fig. 3), the potential yield assuming no infestation (per cent damaged seed=0) was 3946 kg/ha, with yields of 3300, 2655, and 2009 kg/ha associated with 30%, 60%, and 90% seed damage, respectively. The slope of the regression line shown in Figure 3 (21.52) and the slope for the per cent seed damage per midge larva (0.53) represented the damage per injury unit (D) and the injury per insect (I), respectively, in the economic-injury-level equation. Thus, economic injury level=(37)/(0.27)(0.53)(21.52)(1)=12 larvae per spike considering a wheat market price of USD $0.27/kg and 20 larvae/ spike for a market price of USD $0.16/kg, which represents a yield reduction of 8.6–10.8%.
Relationship between per cent seed damage and yield. The depicted line represents the estimated regression line assuming a random effect for observations within the same year. The estimated year effect has been subtracted from the yield values, allowing for a visual representation of the relationship between the per cent seed damage and yield after accounting for the year. The conditional R
2 metric (
 $R_{c}^{2} $
) is displayed as a goodness-of-fit measure.
Discussion
The levels of infestation reported here are similar to previous research, where one to three larvae were found in most infested seeds (Lamb et al. Reference Lamb, Tucker, Wise and Smith2000b; Berzonsky et al. Reference Berzonsky, Ding, Haley, Harris, Lamb and McKenzie2003). However, it is important to note that during 2011, as many as 223 and 264 larvae/spike (~6–7 larvae per seed) were found in “Thatcher” and “Fortuna”, whereas only 10 larvae/spike (less than one larva per seed) was found in “Reeder”. Our results indicate that cultivar differences exist with respect to midge infestation. Further, for the six years combined, “Reeder” had less than 12 larvae/ spike and a 23% higher yield compared with all the other cultivars, while the highest infestation (>60 larvae/spike) was detected in “Thatcher” and “Fortuna”. Differences in larval infestation across cultivars could be explained by differential oviposition preference in response to the nonpreference trait. Thus, further studies on female oviposition and egg survival may be warranted. Also, differences can be attributed to the compactness of the ear as described by Kurppa (Reference Kurppa1989). Low midge infestation in “Reeder”, however, appears to be associated with “Reeder” genetic constitution. A genetic analysis of a population derived from a “Reeder”/”Conan” cross suggest that this nonpreference phenomenon can be explained by the presence of alleles for low infestation contained by “Reeder” at quantitative trait loci on chromosomes 1A and 6A (Blake et al. Reference Blake, Stougaard, Weaver, Sherman, Lanning and Naruoka2011). Reduced preference has also been studied in the Canadian cultivars “Roblin” and “Superb” (Lamb et al. Reference Lamb, Wise, Smith, McKenzie and Thomas2002, Reference Lamb, Sridhar, Smith and Wise2003; Gharalari et al. Reference Gharalari, Smith, Fox and Lamb2011).
Previous research reveals wheat midge damage as a major cause of yield reduction. Oakley et al. (Reference Oakley, Cumbleton, Corbett, Saunders, Green, Young and Rodgers1998) report a 68 kg/ha yield reduction per larva per spike in the United Kingdom, while one or two larvae per spike have been associated with a yield reduction of 100 kg/ha in Canada (Olfert et al. Reference Olfert, Mukerji and Doane1985). This is the first report of wheat midge infestations affecting yield in northwestern Montana.
In this study, yield and test weight decreased as midge density, measured as the number of larvae per spike, increased. According to our results, yield loss caused by a single larva was similar regardless of the midge density. In contrast, Chavalle et al. (Reference Chavalle, Censier, San Martin y Gomez and De Proft2015) observed a higher yield loss per larva at low midge density compared to high midge density in Belgium.
In general, semi-dwarf cultivars such as “Jedd” and “Kelby” (<80 cm) appear to exhibit lower infestation levels than standard height cultivars such as “Thatcher” and “Fortuna” (>90 cm). Our results differ from Blake et al. (Reference Blake, Stougaard, Weaver, Sherman, Lanning and Naruoka2011), where plant height was negatively correlated with midge numbers per seed. Similarly, plant height weakly influences Hessian fly (Mayetiola destructor (Say); Diptera: Cecidomyiidae) infestation (Schotzko and Bosque-Perez Reference Schotzko and Bosque-Perez2002). In a separate study, midge infestation levels were consistent across varieties regardless of plant height (Vera et al. Reference Vera, Fox, DePauw, Smith, Wise and Clarke2013), which suggests that in order to detect differences in the field, plots need to be well separated and test plants need to exhibit a high variability in height (Smith and Lamb Reference Smith and Lamb2001). Although in our study there was a positive relationship between plant height and the number of larvae per spike (
 $R_{c}^{2} $
=0.72), this might be an artefact associated with confounding factors such as antixenosis in “Reeder” (89.7 cm) or differences in heading date among cultivars. These results suggest further investigation is needed to determine the influence of this factor on midge infestation.
Differences in the level of infestation is partially influenced by degree of synchronisation between the heading date of the wheat plant and adult midge emergence (Wright and Doane Reference Wright and Doane1987; Helenius and Kurppa Reference Helenius and Kurppa1989; Kurppa Reference Kurppa1989; Lamb and Wise Reference Lamb and Wise1999). Studies in Canada indicate that early seeding can help wheat to escape midge infestations while late seeding may result in higher seed damage (Wright and Doane Reference Wright and Doane1987; Vera et al. Reference Vera, Fox, DePauw, Smith, Wise and Clarke2013). In our study, higher midge numbers were favoured in late heading cultivars such as “Thatcher” and “McNeal” as opposed to early heading cultivars including “Kelby” and “Jedd” (
 $R_{c}^{2} $
=0.67) (Fig. 2E). Similarly, early maturing cultivars exhibit lower infestations than late maturing cultivars in the saddle gall midge (Skuhravy et al. Reference Skuhravy, Skuhravá and Brewer1983).
There was a positive relationship between protein and the level of larval infestation. Results from this study corroborate the findings of Dexter et al. (Reference Dexter, Preston, Cooke, Morgan, Kruger, Kilborn and Elliott1987), where high protein levels were found in midge-damaged seed. These results are not surprising given the inverse relationship between wheat yield and protein (Slafer et al. Reference Slafer, Andrade and Feingold1990; Sadras and Lawson Reference Sadras and Lawson2013; Martre et al. Reference Martre, He, Le Gouis and Semenov2015). This negative relationship is due to the protein portion of seed biomass being diluted as carbohydrate content increases (Stewart and Dwyer Reference Stewart and Dwyer1989; Nuttall et al. Reference Nuttall, O’Leary, Panozzo, Walker, Barlow and Fitzgerald2016). Conversely, as starch content decreases due to larva feeding, per cent protein content increases (Oakley Reference Oakley1994). This association appears to be influenced by the level of infestation. Thus, our results differ from Miller and Halton (Reference Miller and Halton1961) and Helenius and Kurppa (Reference Helenius and Kurppa1989), where protein was not directly influenced by midge infestation.
The yield reduction calculated here is higher to that reported by Lamb et al. (Reference Lamb, Tucker, Wise and Smith2000b), where a 4–9% yield loss was estimated for spring wheat in Canada. In addition, we calculated a economic injury level of 12 larvae/spike for a market price of USD $0.27/kg, which coincides with the findings reported by Basedow and Schütte (Reference Basedow and Schütte1973) in Germany, and a economic injury level of 20 larvae/spike for a market price of USD $0.16/kg. However, midge infestation levels and the proportion of seed damage may vary across cultivars and years, therefore, multi-year data may be necessary to improve our estimates.
To our knowledge, this is the first study assessing differential susceptibility of currently available spring wheat cultivars in northwestern Montana to the wheat midge. In conclusion, these results showed differences in the level of midge infestation among cultivars. Further, midge infestations negatively affected yield and test weight, though there was a positive influence on wheat protein content. In addition, infestations were positively associated with plant height and heading date. Results from this study will help growers in selecting cultivars that are less susceptible to midge infestations.
Acknowledgements
The authors thank Dr. Lillian S. Lin, Director of the Statistical Consulting and Research Services, Montana State University, for discussions of the statistical approaches used and Dr. O. Olfert for his review of the manuscript.