Global expenditure trends, 2005-2020
The two phases: fiscal expansion (2008-09) and austerity or fiscal consolidation (2010-20)
Methodology
The analysis of government expenditure trends is based on International Monetary Fund (IMF) fiscal projections contained in the World Economic Outlook database (April 2015), the main source of comparable, cross-national fiscal data. In terms of the methodology, total government spending is analysed using two measures: (i) public expenditure as a percentage of GDP; and (ii) the real value of public expenditure (the nominal value adjusted by inflation). Both of these measures are applied to the 187 countries that have estimates during the 2005-20 period, which are examined across three distinct periods: 2005-07 (pre-crisis), 2008-09 (crisis phase I: expenditure expansion), 2010-20 (crisis phase II: expenditure contraction).
Results
Analysis of IMF expenditure projections shows two distinct phases of spending patterns since the onset of the global economic crisis. In the first phase of the crisis, from 2008 to 2010, most governments introduced fiscal stimulus programmes and ramped up total spending. Overall, 137 countries (roughly three-quarters of the sample) expanded spending during 2008 and 2009 by an average annual increase of 3.3 per cent of GDP. About fifty high and middle-income countries announced fiscal stimulus packages totalling US$2.4 trillion, of which approximately a quarter was invested in counter-cyclical social sector/protection measures (Zhang et al., Reference Zhang, Thelen and Rao2010).
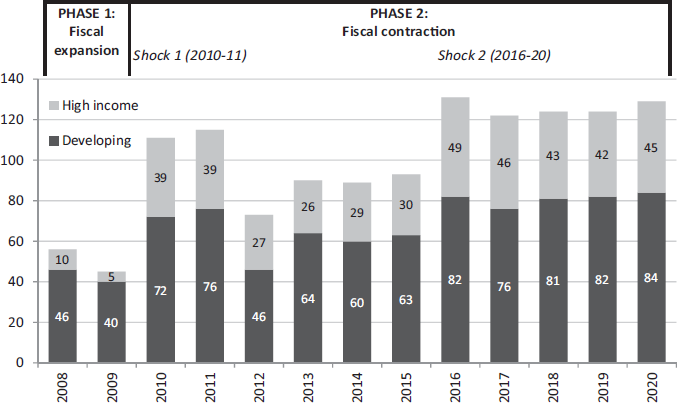
In 2010, however, governments started to scale back fiscal stimulus programmes and reduce spending in a second phase of the crisis that is ongoing and expected to continue at least until 2020, despite the urgent need of vulnerable populations for public support, and despite the multiple national and international development commitments. As depicted in Figure 1, the expenditure contraction phase of the crisis is characterised by two shocks, the first occurring in 2010 and 2011 and the second taking off in 2016.
Number of countries contracting public expenditure as a percentage of GDP, 2008-20.
Source: Authors’ calculations based on the IMF’s World Economic Outlook (April 2015).

In terms of the first shock, the number of countries reducing their budgets as a per cent of GDP increased rapidly between 2009 and 2010, impacting 113 countries by 2011 (or about 60 per cent of the sample). The average contraction size during this period amounted to 2.3 per cent of GDP, on average, confirming that the change in fiscal position in most countries was both sudden and severe.
According to IMF projections, 2016 marks the beginning of a second, major period of expenditure contraction globally. Overall, budget reductions affected 132 countries in 2016 in terms of GDP and hovered around this level until 2020. One of the key findings is that the developing world will be the most severely affected. Overall, eighty-one developing countries, on average, are projected to cut public spending during the forthcoming shock versus forty-five high-income countries.
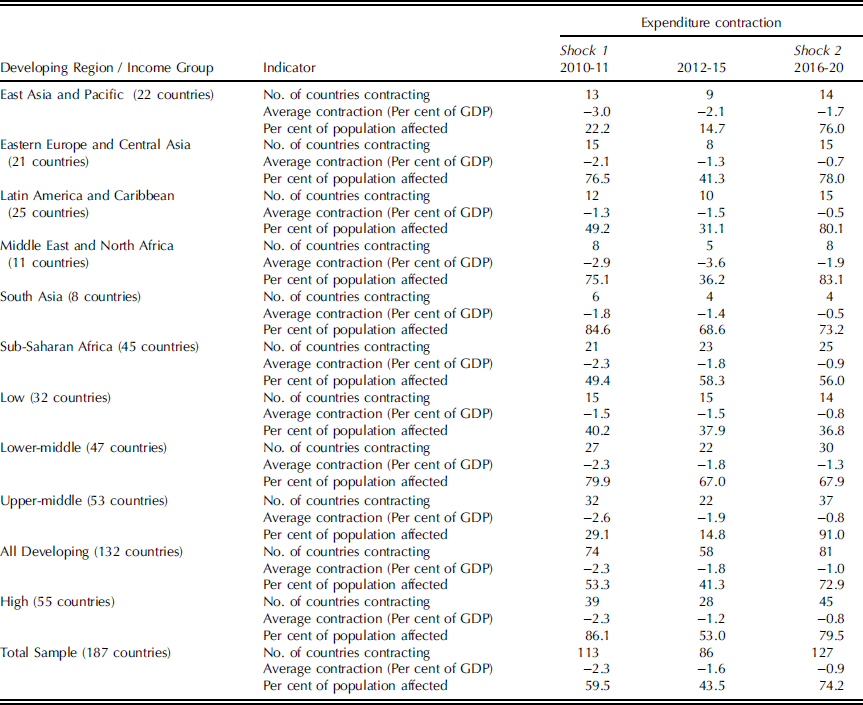
Turning to populations affected, expenditure projections indicate that austerity will affect more than 6.1 billion persons or nearly 80 per cent of the global population by 2020 (Table 1). The populations of several developing regions are expected to be hit exceptionally hard, including more than 80 per cent of the inhabitants of the Middle East and North Africa, Latin America and the Caribbean, Eastern Europe and Central Asia. Looking at income groups, more than 90 per cent of the persons living in upper middle-income countries will be affected by austerity during the second shock. This underscores one of the more alarming findings, which, in stark contrast to public perception, verifies that austerity is increasingly a developing country phenomenon. In the year 2020, 83 per cent of persons living in developing countries are projected to be impacted by budget cuts, compared to 61 per cent of persons living in high-income countries.
Number of countries and population affected by expenditure contraction, 2010-2020 (period averages, percentage of GDP)

Source: Authors’ calculations based on the IMF’s World Economic Outlook (April 2015) and United Nations (UN) (2011b). World Population Prospects: The 2010 Revision.
High Levels of Austerity
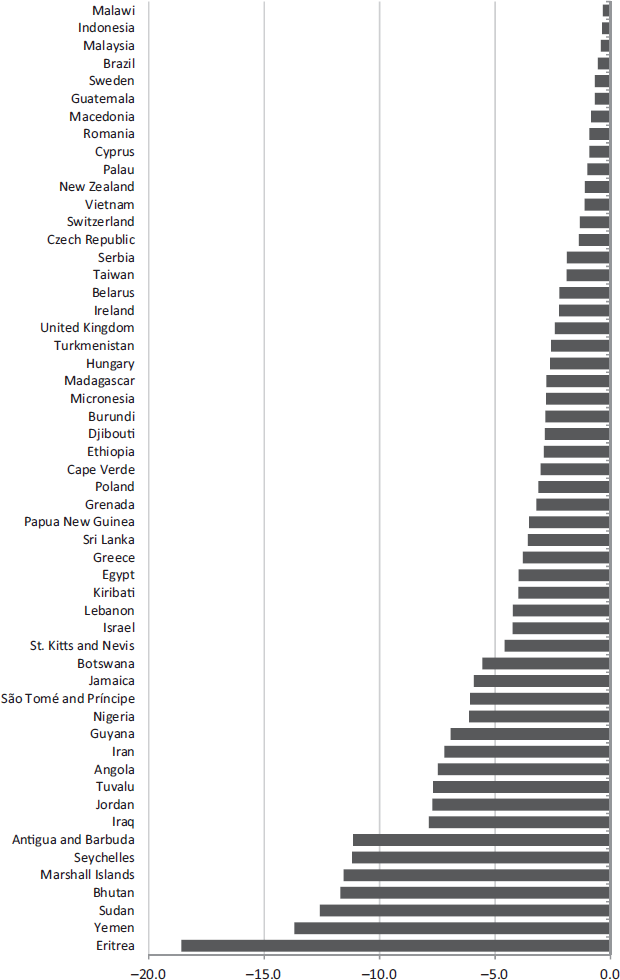
Comparing the average level of public spending during the period of the second expenditure contraction shock (2016-20) with the average level of public spending during the pre-crisis period (2005-07) shows that fifty-five governments may be slashing their budgets below pre-crisis levels during 2016-20 (Figure 2). Seventeen of these countries are expected to be spending more than 5.0 per cent of GDP less, on average, during the second shock than compared to expenditure levels during the pre-crisis period.
Excessive contraction: change in total government spending, 2016-20 avg. over 2005-07 avg., in percentage of GDP.
Source: Authors’ calculations based on the IMF’s World Economic Outlook (April 2015).

This should make us question if the projected fiscal contraction trajectory – in terms of timing, scope and magnitude – as well as the specific austerity measures being considered are conducive to socio-economic recovery and development commitments such as the Sustainable Development Goals (SDGs).
What prompted governments to abandon fiscal expansion in 2010 and embrace expenditure contraction? The conventional answer is to address debt and fiscal deficits. However, this seemingly straightforward explanation deserves further exploration, especially given the fragile state of recovery in 2010 and the clear, negative impacts that fiscal retrenchment would have on economic activity and societies.
Early in 2010, IMF advice underwent a major change (later supported by the OECD and ultimately also by the G20). Two IMF Board papers approved in February 2010 – ‘Exiting from crisis intervention policies’ and ‘Strategies for fiscal consolidation in the post-crisis world’ – called for large-scale fiscal adjustment ‘when the recovery is securely underway’ and for structural reforms in public finance to be initiated immediately ‘even in countries where the recovery is not yet securely underway’ (IMF, 2010a; 2010b). Reforms of pension and health entitlements were called for, accompanied by ‘strengthened safety nets’ for the poorest (IMF, 2010a: 15-32). On the composition of fiscal adjustment, it was advised that most of it could come from unwinding the previously adopted fiscal stimulus packages; reforming pension and health entitlements to reduce the long-term financial obligations of the state by way of avoiding ‘a rise in spending as a share of GDP’ (IMF, 2010a: 16); containing other spending, by means such as eliminating subsidies, and increasing tax revenues.
Thus the second phase of the crisis, beginning in 2010, saw a total policy reversal, a 180-degree shift in governments’ public expenditure. The sovereign debt crisis in Europe turned public attention to government spending, as if it were the cause of the crisis. Rising debts and deficits at this point resulted from bank bailouts to rescue the financial sector from bankruptcy, stimulus packages and lower government revenues due to the slowdown in economic activity. In other words, government debt and deficits were symptoms of the crisis, not its cause. Yet fiscal consolidation prescribed to cut back on public policies and downsize state budgets as the main ways to reduce deficits, calm the markets and revive the economy. Following this logic, the social welfare state was depicted as an unaffordable and burdensome impediment to competitiveness and output growth (Molina, Reference Molina2010; Van Waeyenberge et al., Reference Van Waeyenberge, Bargawi and McKinley2010; CESR, 2012; Weisbrot and Jorgensen, Reference Weisbrot and Jorgensen2013; ILO, 2014; Ortiz et al., Reference Ortiz, Cummins, Capaldo and Karunanethy2015).
Main austerity measures
How are governments achieving fiscal adjustment? And what are the main adjustment measures that have direct social impacts? To answer these questions, this section looks at policy discussions and other information contained in 616 IMF country reports that appeared between February 2010 and February 2015 covering 183 countries.Footnote 1
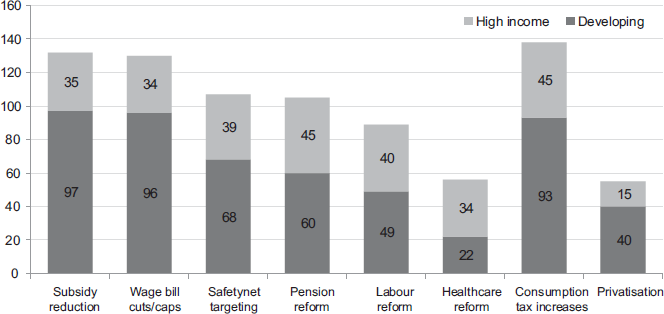
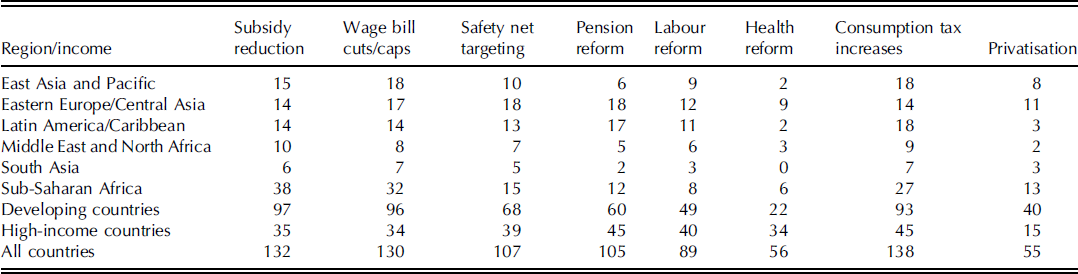
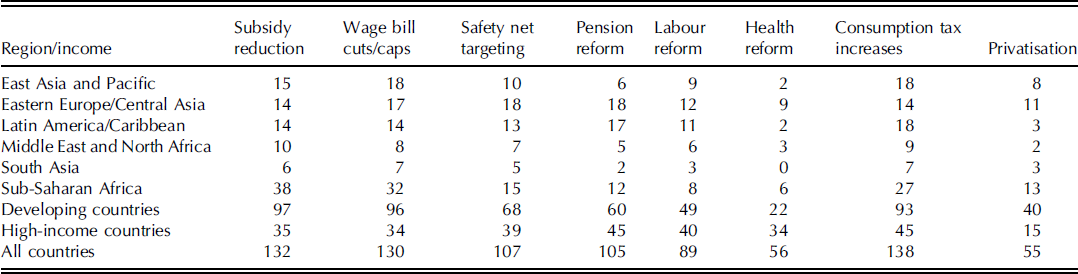
The review of IMF country reports indicates that seven main policies are being considered by governments worldwide to consolidate budgets, along with two policy measures to boost revenues (Figure 3). TheseFootnote 2 are:
Incidence of Austerity Measures in 183 Countries, 2010-1 (number of countries).
Source: Authors’ analysis of 616 IMF country reports published from February 2010 to February 2015.

Eliminating or reducing subsidies
Overall, 132 governments in ninety-seven developing and thirty-five high-income countries appear to be limiting subsidies, predominantly on fuel, but also on electricity, food and agricultural inputs, which makes this the most widespread adjustment measure.
Cutting or capping the public wage bill
As recurrent expenditure, like civil servants’ salaries, tends to be the largest component of national budgets, an estimated 130 countries are considering reducing their wage bill, which is often carried out or planned as a part of civil service reforms. In total, ninety-six developing and thirty-four high-income countries are considering this policy stance.
Rationalising and targeting social assistance or safety nets
The review indicates that 107 governments in sixty-eight developing and thirty-nine high-income countries are considering rationalising spending on safety nets and welfare benefits, often by revising eligibility criteria and targeting to the poorest, which is a de facto reduction of social protection coverage.
Reforming old-age pensions
Approximately 105 governments in sixty developing and forty-five high-income countries are discussing different changes to their pension systems, such as raising contribution rates, increasing eligibility periods, prolonging the retirement age and/or lowering benefits, among others.
Labour flexibilisation reforms
Some eighty-nine governments in forty-nine developing and forty high-income countries are considering some form of labour flexibilisation.
Healthcare system reforms
These are being considered by fifty-six governments in twenty-two developing and thirty-four high-income countries and can include raising fees and co-payments for patients as well as introducing cost-saving measures in public healthcare centres.
At the same time, commonly adopted measures to increase government revenues are:
Increasing consumption taxes on goods and services
This can be achieved either through increasing or expanding VAT rates or sales taxes or by removing exemptions. Some 138 governments in ninety-three developing and forty-five high-income countries are employing some form of change to their consumption-based taxes, making this the most prominent revenue side being considered in response to fiscal pressure.
Privatisation of public assets and services
This is another option being pursued to increase short-term revenues which, according to IMF reports, is being considered by fifty-five governments in forty developing and fifteen high-income countries.
Contrary to public perception, an examination of IMF country reports indicates that austerity measures are not limited to Europe. In fact, many adjustment measures emerge more frequently in developing countries (Table 2). For instance, while pension and labour reforms are dominant in high-income countries, developing countries exhibit a higher incidence of wage bill cuts/caps and lower subsidies. In contrast, consumption tax increases and privatisation are equally common in both groups.
Main adjustment measures by region, 2010-15 (number of countries)
Source: Authors’ analysis of 616 IMF country reports published from February 2010 to February 2015 (IMF, April 2015).
Another interesting finding relates to the scale of austerity measures being adopted by individual countries. Overall, at least two policy options are being discussed in 169 countries, three or more in 145 countries, four or more in 122 countries, five or more in ninety-one countries, six or more in fifty-six countries and seven or more in fifteen countries: Barbados, Belarus, Belgium, Bulgaria, Croatia, Cyprus, Czech Republic, Egypt, Fiji, France, Greece, Hungary, Iceland, India, Ireland, Italy, Jamaica, Jordan, Kuwait, Latvia, Lebanon, FYR Macedonia, Malta, Moldova, Montenegro, Netherlands, Palau, Poland, Portugal, Romania, Russia, Serbia, Slovak Republic, Slovenia, Spain, Turkey, Tuvalu and the United Kingdom.
Impacts on jobs and welfare
More than ten years after the global crisis and Great Recession started, the world economy is still not running at full capacity, growth is sluggish and decent work deficits remain massive. Year after year, the IMF lowers its growth forecasts, and the latest World Economic Outlook calls for supportive policies to redress sluggish patterns (IMF, 2019). At the same time, the International Labour Organization’s (ILO) latest figures (ILO, 2019) show that only about half of global workers are wage and salaried employees, while a staggering two billion are in informal employment – nearly three in five (61 per cent) of the world’s workforce – most of whom are without social protection (ILO, 2017). Around 700 million workers live in extreme or moderate poverty worldwide,Footnote 3 just as labour force participation rates and employment-to-population rates continue to decline across all regions. The ILO also estimates that more than 200 million workers are unemployed across the globe, which is 30 million more than before the onset of the crisis (ILO, 2015). The pattern of job creation in recent years has been characterised by increased labour insecurity, ‘jobless growth’, and segmented labour markets with large wage differentials.
The short-term adjustments presented in earlier sections are affecting a number of public expenditures, primarily social protection and welfare. This should make us question whether the timing and scope of the current fiscal consolidation trend are conducive to socio-economic recovery and the achievement of the SDGs. This is well documented for high-income countries that have already reduced a range of social protection benefits. Together with persistent unemployment, lower wages and higher taxes, these measures have contributed to increases in poverty, now affecting 86 million people in the European UnionFootnote 4 , representing more than 17 per cent of the population, many of them children, women and disabled people. The number of children in Europe living in poverty and social exclusion grew by 467,000 from 2007 to 2014 (Cantillon et al., Reference Cantillon, Chzhen, Handa and Nolan2017; Eurostat, 2017). The ILO estimates that future old-age pensioners will receive lower pensions in at least fourteen European countries (ILO, 2014; 2017). Several national courts have found the cuts unconstitutional. The achievements of the European social model, which dramatically reduced poverty and promoted prosperity and social cohesion in the period following the Second World War, have been eroded by these short-term adjustment reforms. Further, depressed household income levels are leading to lower domestic consumption and lower demand, slowing down recovery.Footnote 5
While the impacts of austerity or fiscal consolidation are better documented in Europe, they are also affecting a majority of developing countries whose governments are considering the following adjustment measures:
a. Eliminating or reducing subsidies
These include food, agricultural and fuel subsidies. This policy is particularly prevalent in the Middle East and Northern Africa along with sub-Saharan Africa. Removing food and agricultural subsidies is particularly concerning, as food security remains a critical issue in many countries, and families across the globe have reported eating fewer meals, smaller quantities and less nutritious foods since the onset of the global crisis (Compton et al., Reference Compton, Wiggins and Keats2010; Hossain and Green, Reference Hossain and Green2011; Heltberg et al., Reference Heltberg, Hossain, Reva and Turk2012). When basic fuel subsidies are withdrawn, food and transport prices increase and can become unaffordable for many households. This net welfare loss has led to protests and riots in many countries.Footnote 6 Higher energy prices also tend to slow down economic activity and thus generate unemployment. This is why the elimination of subsidies has often been accompanied by the development of a safety net as a way of compensating the poor; however, targeting only the poorest is insufficient as it does not compensate vulnerable low and middle-income households who also lose out with the withdrawal of universal subsidies. While reducing fuel subsidies may be a good opportunity to gain fiscal space, it is important that the large cost savings resulting from reductions in subsidies are used to develop comprehensive social protection systems, including floors.
b. Wage bill cuts/caps
Because recurrent expenditures such as the salaries of teachers, health staff, social workers and local civil servants tend to be the largest component of national budgets, this adjustment measure has high social impact. Low pay is a key factor behind absenteeism, informal fees and brain drain. This measure affects most countries in Eastern Europe and Central Asia, the Middle East and North Africa, South Asia, East Asia and Sub-Saharan Africa. This policy stance may translate into salaries being reduced or eroded in real value, payments in arrears, hiring freezes and/or employment retrenchment, all of which can adversely impact the delivery of public services to the population. Particularly in rural areas and urban slums where poverty is prevalent, a teacher or a nurse can be the deciding factor to whether or not a child has access to education and health services; as a result, employing and retaining service staff at local levels, and ensuring that they are sufficiently paid to provide for their own families, is key to social progress (Cornia et al., Reference Cornia, Jolly and Stewart1987; Fedelino et al., Reference Fedelino, Schwartz and Verhoeven2006; Marphatia et al., Reference Marphatia, Moussié, Ainger and Archer2007; UNICEF, 2010; Reinsberg et al., Reference Reinsberg, Kentikelenis, Stubbs and King2019).
c. Rationalising and targeting social assistance benefits
Many countries are considering rationalising their spending on welfare by revising eligibility criteria and targeting to the poorest, often reducing social protection coverage. IMF reports generally associate targeting social programmes to poverty reduction; targeting is discussed even in low income countries such as the Gambia, Haiti, Mali, Mauritania, Nicaragua, Senegal, Sudan, Timor-Leste, Togo and Zambia, where on average about half of the population is below the national poverty line, and the rationale to target to the poorest is weak. Given the large number of vulnerable households above the poverty line, universal policies may better serve developmental objectives. Targeting to the poor should not be viewed as a panacea, since there are major problems associated with means-testing: It is costly – means testing absorbs an average of 15 per cent of total programme costs; it is administratively complex and requires significant civil service capacity, which is often lacking in lower income countries; and it tends to result in large under-coverage, leaving many vulnerable persons excluded by design from receiving benefits when their need for public assistance is high. In most developing countries, targeting to the poor increases the vulnerability of the ‘middle classes’ – the majority of whom earn very low incomes – along with those who sit just above official poverty lines (Mkandawire, Reference Mkandawire2005; Cummins et al., Reference Cummins, Dublin, Engilbertsdottir, Evans, Martins, Murthy and Yablonski2013; Kidd et al., Reference Kidd, Gelders and Bailey-Athias2017; Stubbs and Kentikelenis, Reference Stubbs and Kentikelenis2018). Rather than targeting and scaling down social protection to achieve cost savings over the short term, there is a strong case for scaling up in times of crisis and building social protection systems for all.
d. Reforming old-age pensions
Countries are discussing changes to their pension systems such as reducing employers’ contribution rates, increasing eligibility periods, prolonging the retirement age and lowering benefits, freezing pension indexation, cutting pension subsidies or increasing taxes on benefits, indexing the retirement age to increases in life expectancy, sometimes with structural reform of contributory social security pensions. As a result, future pensioners are expected to receive lower benefits. These adjustments, often driven by a fiscal objective, are affecting the adequacy of pension systems and general conditions of retirement. In several countries, these reforms are putting at risk the fulfilment of the minimum standards in social security, and eroding the social contract. This is as prevalent in developing countries as in Europe; for example, countries like Brazil, India, Indonesia, Japan, Malaysia, Moldova, Morocco, Nigeria, Rwanda, Senegal, Viet Nam and Zambia, are among the most recent countries to announce reforms aimed at the downward adjustment of pension benefits (ILO, 2014; 2017).
e. Labour reforms
Labour reforms generally include revising the minimum wage, limiting salary adjustments to cost-of-living benchmarks, decentralising and weakening collective bargaining, easing retrenchment and flexibilising employment protection procedures (ILO, 2012). This measure affects most countries in the Middle East and North Africa, as well as in Latin America. Labour market reforms are supposedly aimed at increasing competitiveness and supporting businesses during recessions, partially intending to compensate for the underperformance of the financial sector. The available evidence suggests, however, that many of these labour reforms will not generate decent jobs; on the contrary, in a context of economic contraction they are likely to generate labour market ‘precaritisation’, depress domestic incomes and ultimately hinder recovery efforts. Women workers are particularly hard hit by such measures (Howell, Reference Howell2005; van der Hoeven, Reference Van der Hoeven2010; Ghosh, Reference Ghosh2013; Berg, Reference Berg2015; Jaumotte and Osorio Buitron, Reference Jaumotte and Osorio Buitron2015).
f. Reforming health systems
This is generally through increasing fees and co-payments as well as introducing cost-saving measures in public health centres; lower quality and availability of health service provision have led to worse health outcomes (Karanikolos et al., Reference Karanikolos, Mladovsky, Cylus, Thomson, Basu, Stuckler, Mackenbach and McKee2013; Kentikelenis, Reference Kentikelenis2017). The risks of reducing healthcare benefits are obvious: vulnerable groups are excluded from or receive less critical assistance at a time when their needs are greatest. Weakened mental health, increased substance abuse and higher suicide rates have all been linked with fiscal consolidation measures (Mladovsky et al., Reference Mladovsky, Drivastava, Cylus, Karanikolos, Evetovits, Thomson and McKee2012; Stuckler and Basu, Reference Stuckler and Basu2013). Moreover, since women are more dependent on public support and more likely to face poverty in old-age than men, pension and health cuts are likely to have a disproportionate negative impact on women and increase gender disparities (UNWOMEN, 2015).
g. Increasing consumption taxes on goods and services to boost revenue
Increasing the cost of basic goods and services can erode the already limited incomes of vulnerable households and stifle economic activity. Since this policy does not differentiate between consumers, it can be regressive, shifting the tax burden to vulnerable families and exacerbating inequalities. Alternatively, progressive tax approaches should be considered, such as taxes on income, inheritance, property and corporations, including taxing the financial sector (Ortiz et al., Reference Ortiz, Cummins, Capaldo and Karunanethy2015; Schenk and Oldman Reference Schenk and Oldman2007).
h. Privatisation of public assets and services
This is another source of short-term revenue source considered by many governments. Sales proceeds produce short-term gains, but also long-term losses given the lack of future revenues; additionally, privatisation risks include layoffs, tariff increases, unaffordable and low quality goods and public services (Hall, Reference Hall1999; Birdsall and Nellis, Reference Birdsall, Nellis and Nellis2005; Reinsberg et al., Reference Reinsberg, Kentikelenis, Stubbs and King2019).
The United Nations agencies have pointed out the negative social and economic impacts of austerity or fiscal consolidation (UNCTAD, 2011; 2016; 2017; UN, 2012; ILO, 2014). Wage restraint and fiscal austerity in most developed economies have lowered global aggregate demand, negatively affecting the developing world. These short-term adjustment measures must be additionally questioned in terms of their high human costs and the fact that they are not conducive to the achievement of the SDGs. Ill-designed fiscal consolidation measures threaten not only the human right to food, social security, health, education, but also other essential goods and services (UN, 2011a; Ortiz and Cummins, Reference Ortiz and Cummins2012; OHCHR, 2013; UNWOMEN, 2015).
Fiscal consolidation policies are driven by a cost-saving logic, and their negative social impacts on women, children, older persons, the unemployed, migrants or disabled people, are viewed as collateral damage in the quest for fiscal balance and debt service (Seguino, Reference Seguino2009; CESR, 2012). The UN High Commissioner for Human Rights has warned that ‘austerity measures endanger social protection schemes, including pensions, thereby dramatically affecting the enjoyment of the rights to social security and to an adequate standard of living’ (OHCHR, 2013: paragraph 13), particularly for vulnerable and marginalised groups, pointing to states’ obligation to safeguard human rights, as well as the obligation to ensure the satisfaction, at the very least, of minimum essential levels of all economic, social and cultural rights, including the right to social security (OHCHR, 2013).
It did not need to be a decade of adjustment. In such difficult times, both pre- and post- Covid19, the imperative should be that countries aggressively explore all possible alternatives to promote national socio-economic development with jobs and social protection. There are several options that all governments have to expand fiscal space, even in the poorest countries (UNDP, 2007; UN, 2009; Hall, Reference Hall2010; Ortiz and Cummins, Reference Ortiz and Cummins2017). These options, supported by policy statements of the UN and international financial institutions, include: re-allocating public expenditures, increasing tax revenues, expanding social security coverage and contributory revenues, lobbying for aid and transfers, eliminating illicit financial flows, using fiscal and foreign exchange reserves, borrowing or restructuring existing debt, and adopting a more accommodative macroeconomic framework. An adequate policy mix would allow for public investments to boost employment and sustainable growth, improve living standards and reduce inequalities. Expenditure decisions are too important to be taken behind closed doors in the Ministries of Finance: national social dialogue is best to articulate optimal solutions in macroeconomic and fiscal policy, the need for jobs and investments in people.