1. Introduction
After the dissolution of the Soviet Union, an ongoing and mutually agreeable relationship with Europe became a fundamental part of Russian foreign policy. Russia’s proposed and presumed transition into democracy and a market economy was supported by the European Community, which would contribute to economic cooperation and stability on the continent. The so-called ‘Dialogue’ with the EU seeking an EU–Russian strategic partnership demonstrated a shared willingness to cooperate over a broad spectrum of issues for the sake of mutual socio-economic, technological and industrial development.
The European Security Strategy of 2003 was the first official document where the EU highlighted its intention of developing strategic partnerships with those countries that would concur with EU’s norms and values. It was in this document that the EU stressed the necessity of establishing closer relations with Moscow for ensuring the security and prosperity of Europe while hoping that a respect for common values would reinforce progress toward a strategic partnership. In fact, the first reference to strategic partnership appeared in the official documents of the EU in 1998, when the EU confirmed the necessity of considering Russia as a strategic partner. Therefore, the EU already had at least a theoretical relationship with Moscow when it used this term for the first time (and the last time during the 1990s). Initially the phrase ‘strategic partnership’ didn’t even appear in transatlantic relations, which were the most important for the EU (Podadera and Garashchuk Reference Podadera and Garashchuk2016).
In the Report on the Implementation of the European Security Strategy (2008, 10) it was highlighted:
Our relations with Russia have deteriorated over the conflict with Georgia. The EU expects Russia to honour its commitments in a way that will restore the necessary confidence. Our partnership should be based on respect for common values, notably human rights, democracy, and rule of law, and market economic principles as well as on common interests and objectives.
Nevertheless (and despite this stern-sounding admonishment), Russia continued to be an important partner on global issues. Moreover, the parties seemed to overcome that conflict completely and, in 2009, Russia was included in the EU’s list of strategic partners.Footnote 1 On 22 February 2011 it was highlighted in Brussels that not only were the EU and Russia neighbours but also strategic partners.Footnote 2
Regarding the expectations of a Euro–Russian strategic partnership in the new redaction of the Russian Foreign Policy Conception confirmed by Vladimir Putin in February of 2013, the main strategic objective toward the EU consisted of creating a common economic and humanitarian space from the Atlantic to the Pacific Ocean. The ex-President (finished in October 2014) of the European Commission, José Manuel Durão Barroso, also confirmed this expectation in his own words:
The case for European Union–Russia engagement is overwhelming. Clearly, we have a strong interest in building upon our economic interdependence and working ever-closer together in so many areas from trade and investment to energy and mobility, to good governance, human rights, humanitarian and world security issues … We already share a vision for such a Partnership, the long-term vision, and I think it is important, even when we take concrete decisions be it in daily life, in politics or business, to have a long-term vision. The long term vision is a common economic and human space from Lisbon to Vladivostok with free travel of people, free exchange of goods and services, very close overall cooperation.Footnote 3
However, after the conflict in Ukraine and subsequent annexation of Crimea, the Euro–Atlantic Community tried to isolate Russia from its principal institutions and restrict access to its financial resources. Thus, Russia was excluded from the Group of Eight, and the negotiations on its accession to the Organisation for Economic Co-operation and Development (OECD) were suspended. The majority of EU–Russian projects and events such as summit annual meetings,Footnote 4 Roadmaps on Four Common Spaces,Footnote 5 negotiation on abolishing the visa regime and New Basic Agreement (NBA)Footnote 6 among others, were either postponed or suspended. Moreover, the parties then started imposing sanctions against each other. And, to top it off, Mogherini (Reference Mogherini2014) announced in September that Russia was not EU’s strategic partner any more.Footnote 7
Nonetheless, according to Voynikov (Reference Voynikov2015, 20–21) the freezing of relations did not mean the cancellation of common projects. Voynikov went on to define the current EU–Russia ‘cooperation’ as a ‘forced strategic partnership’, concluding that the partnership between them continues to exist – ‘but in a frozen state’.
Moreover, it should be mentioned that the EU’s Concept of Strategic Partnership has been criticized for its ambiguity and the lack of clear criteria.Footnote 8 In this regard, the strategic partnership has been perceived more as a political category than a science-based concept of the EU’s Foreign Policy. In addition, very little empirical evidence of the strategic partnership is available. In this regard, this article aims to fill the gap by applying an econometric analysis of this term.
Even though, for more than 15 years, Strategic Partnership was the political label accepted by both parties to frame their relations and develop a number of institutional channels of dialogue and cooperation, a critical question has always remained: did the inherent problems from the very beginning of the EU–Russia strategic partnership actually contribute to increasing bilateral trade?
To address this question effectively, we first provide a literature review concerning the EU–Russia strategic partnership and the most meaningful current evidence available in this regard; second, we furnish empirical analysis by applying the Gravity Model with a view toward estimating the impact of the strategic partnership together with other variables, such as the distance between countries, the EU’s and Russia’s GDPs per capita, the devaluation of the Russian rouble, mutual sanctions and oil prices on EU–Russia bilateral trade; third, we identify and evaluate the results obtained by the model; and, finally, we construct a scenario-simulation of what would have happened had the strategic partnership between parties continued until 2018 and if, consequently, the sanctions had not been imposed – all this with a view toward estimating the impact of strategic partnership both on EU–Russia trade flow in general and on trade flow between Russia and EU’s member states individually by country. After this, we will present our conclusions and offer a conclusive discussion with respect to the EU–Russia on-again off-again ‘strategic partnership’.
2. Literature Review
Speaking about an EU–Russia strategic partnership, we should first mention the asymmetry of such a relationship. In this regard, Vahl (Reference Vahl2001, 4) argues that it is difficult to consider the EU and Russia as equal partners, inasmuch as he believes that the asymmetric nature of their relationship acts as a serious obstacle to the emergence of a ‘strategic partnership’. Haukkala (Reference Haukkala2010, 134) points out that ‘Russia chose to opt out of the European Neighbourhood Policy and demanded “a more privileged status as a strategic partner based on equality”’. Blanco (Reference Blanco2016, 49) highlights that
for Russia, ‘strategic partnership’ was an attractive conceptual framework that could be used to neutralize the asymmetries of EU–Russia relations at the end of the twentieth century. The problem was that the EU and Russia did not share a common understanding of what their ‘strategic partnership’ should entail.
Although the EU’s leaders share a wide range of common interests with Russia, especially related to energy and economic issues, initially the collaboration with Russia was based on its understanding of Russia as a ‘normative’ power – a term first popularized by Manners (Reference Manners2002).Footnote 9 In this area, the EU as a matter of form vehemently promotes itself and its policies as being a force for good in the world (Aggestam Reference Aggestam2008, 1). However, DeBardeleben (Reference DeBardeleben and Kanet2011) highlights that the EU may have misunderstood the Russian agenda in treating Russia as an object of its policy rather than an equal partner. Trenin (Reference Trenin2014, 11) stresses that there was no chance that Russia – viewed in the West as a lesser international actor, whose power and importance were also declining – would be recognized as a ‘co-equal’ of the EU. Razvan-Alexandru (Reference Razvan-Alexandru2015) points out that the EU cannot force Russia to follow its rules and norms and should search for a special approach in order to develop positive bilateral relationships with this partner. The Minister for Foreign Affairs of Russia Lavrov (Reference Lavrov2013, 7) underlined the need to move from a ‘partnership of necessity’Footnote 10 to a ‘partnership of choice’, criticizing the EU’s general tradition of developing ties with neighbouring countries only if they approach EU standards and follow EU policies. Taking into account that Russia does not seek membership in the EU, he assumes that such an approach is inappropriate in dealing with Russia.
It is worth mentioning that, from the very beginning, the EU–Russian strategic partnership has been problematic in regard to shared values. Thus, the usage of the term to address a relationship that lacked the characteristics of a strategic alliance and could not be defined as such due to the ‘gap of values’ has been criticized in most quarters and by the majority of knowledgeable observers (Medvedev Reference Medvedev2006; Krastev Reference Krastev2007). Danilov and De Spielgeleire (Reference Danilov and De Spielgeleire1998) have stressed that there was an inflation and devaluation of the strategic partnership concept in EU–Russia relations while Smith and Timmins (Reference Smith and Timmins2003), in fact, deny the existence of a real strategic partnership between Russia and the EU and state that a more precise terminology to define this relationship would be to consider it a pragmatic partnership. De Wilde and Pellon (Reference De Wilde and Pellon2006, 123) argue that ‘the strategic partnership between the EU and Russia is a real challenge from the point of view of common values’, which seems to suggest that common values are a necessary element in a relationship defined as a strategic partnership. Kempe and Smith (Reference Kempe and Smith2006) also point out the existence of a gap in matters relating to the structure of democratic institutions, the rights of civil society and the concept of sovereignty of States. Belokurova (Reference Belokurova and Vasilache2011, 117) argues that, regarding EU–Russia relations, a ‘strategic partnership’ concept was developed due to both the mutual understanding of the necessity to cooperate and the permanent political conflicts and crises, which resulted from the mismatch of interests and values. Blanco (Reference Blanco2010, 23) believes that although Putin’s ‘sovereign democracy’ doesn’t fit properly the model of traditional Western democracies, the Russian economy is likely to honour its idiosyncrasies; and as long as Russia openly acknowledges its great power ambitions, the degree of value-sharing necessary to develop a pragmatic relationship of strategic relationship is unlikely to come into being. However, it should be recalled that this statement had been made before the Ukrainian crisis erupted.
Nevertheless, when we speak about a ‘gap in values’ the EU–Russia strategic partnership can hardly be viewed as ‘exceptional’ when we take into consideration the EU–China strategic partnership, and, in this regard, Blanco (Reference Blanco2016, 47) argues that
though not totally removing values from its foreign policy discourse, the use of ‘strategic partnership’ by the EU can be seen as a ‘pragmatic move’ through which the clashes on norms and values that could undermine cooperation with a group of ‘key partners’ can be neutralized.
Regarding the methodology, the strategic partnership studies are usually full of descriptive statistics but rarely contain original research, such as, for example, interviews, detailed case studies, econometric analysis or any other innovative methodology. Nevertheless, some of the research can be distinguished in this way. Thus, Gupta and Azad (Reference Gupta and Azad2011) applied the Hierarchy Model for the selection of India’s strategic partners based on the Analytic Hierarchy Process, putting forward the following criteria of evaluation: Economics; Politics; Defence; Technology; People to People. Blanco (Reference Blanco2016, 41) proposes a theoretical framework to assess ‘strategic partnership’ based on assumptions drawn from ‘language in use approaches’ consequently discussing ‘three functions of “strategic partnership”: as a label and mechanism of differentiation and hierarchization; as a normative instrument to advance a “structural foreign policy”; and as a constitutive speech and positioning act’ (Blanco, Reference Blanco2016, 36).
Podadera and Garashchuk (Reference Podadera and Garashchuk2019) have developed the Strategic Partner’s Attractiveness Index for the EU by applying the Categorical Principal Component Analysis and, as a result, Russia reached a high position on the ranking of EU’s strategic partners. Thanh Binh et al. (Reference Thanh Binh, Viet Duong and Manh Cuong2014) seem to be the first who, while analysing Vietnam’s trade flows, added the dummy variable ‘strategic partnership’ to the Gravity Model. However, in this study case the variable came out as insignificant. In our research, by contrast, we aim to justify the strategic partnership as a significant variable for the Euro–Russian relationship. The methodology of the research is presented next.
3. Methodology and Data
Regarding our research, its empirical analysis is based on the Gravity Model which, according to Head and Mayer (Reference Head and Mayer2014), is one of the most stable empirical interrelationships in the econometric analysis. Proposed for the first time by Danish economist Timbergen in 1962, the model borrows its logic from Newton’s Law of Universal Gravitation and applies it to the economic field, to analyse trade flows between two geographical points by measuring ‘body masses’ as GDP, and population and the distance between them in physical terms. Subsequently, researchers have added different dummy variables to the basic variables such as, for example, common language, common border, affiliation to the particular integration group, and so on.
For our model we used the standard variables for Gravity Models, such as GDPs per capita of Russia and the EU nations in order to measure the size of their markets and the distance between their capitals. We also added variables related to the geopolitical situation, such as oil-prices, exchange rates (euro to rouble) and ‘dummy’ variables, such as the current sanctions between Russia and the EU, and the ‘strategic partnership’ officially started in 2009 and suspended in 2014. It is noteworthy that Cyprus, Malta, the Netherlands and the Czech Republic were omitted from the model due to distortion of the results. In the end, 24 of the EU‘s members were selected for consideration. The current study covers the period from 2001 to 2018.
Based on the literature related to the Gravity Model’s application, the following hypotheses are advanced:
-
Hypothesis 1: There is a positive effect gained from increasing Russia’s and EU’s GDPs per capita on bilateral trade.
-
Hypothesis 2: There is a negative effect of geographical distance on bilateral trade.
-
Hypothesis 3: There is a negative effect of sanctions on bilateral trade.
-
Hypothesis 4: There is a positive effect of petrol price increase on bilateral trade.
-
Hypothesis 5: There is a positive effect of rouble devaluation on bilateral trade.
-
Hypothesis 6: There is a positive effect of strategic partnership on bilateral trade.
For this paper it was decided to apply a Dynamic Panel with a view to capture both short and long-term relations between involved variables by means of the following specification of the Error Correction Model (ECM).Footnote 11 This model was applied for the first time in the analysis of time-series by Sargan (Reference Sargan, Wallis and Hendry1984):
 $$\Delta {y_{it}} = \delta \Delta {y_{it - 1}} + \Delta X_{it}^'{\beta _X} - {\alpha _j}[{y_{it - 1}} - {\delta _i} - Z_i^'\beta _Z^* - X_{it}^'\beta _X^*] + \Delta {\varepsilon _{it}}$$
where y
it
refers to the itth observation of the endogenous variable; X′
it
refers to the itth observation in the k
x
explanatory (regarded as exogenous) variables; Z′
i
refers to the ith observation in the k
z
variables, which take the same value over time; δ
i
captures the specific unobservable effects in the cross-sectional units. The variable ϵ
it
represents the idiosyncratic shocks, which should fulfil basic assumptions in the regression model. The short-term parameters are given by β
X
while the long-term parameters by
 $\beta^*_Z
and
 $\beta^*_X
. The Cointegrating VectorFootnote
12
is in square brackets.
In our application the endogenous variable is given by trade flow between Russia and EU member states, Log(TRADE
it
). X′
it
is given by the fallowing variables: Log(GDP_P
it
/POP_P
it
), Log(GDP_RUS
it
/POP_RUS
it
), SP
it
, Log(PP
it
), SANCT
it
and Log(EXCH
it
). Finally,
 $Z^\prime_i
is just given by the only variable, Log(DIST
i
). The description of the variables is presented in Table 1.
Variables.

Source: Own elaboration.
To come up with specification (1) it is necessary to follow three steps:
-
First, to check that the time-series (non-stationary) are integrated to the order 1 (Dickey and Fuller, Reference Dickey and Fuller1979, Unit RootFootnote 13 Test). In this case, the applied contrasts (to the time series) have been adapted to the Panel Data.
-
Second, to estimate the Cointegrating Vector or Vectors and to verify that the residues of corresponding vectors are stationary (Engle and Granger, Reference Engle and Granger1987, Test). On this occasion, the Unit Root Test should be applied again to the residues of the Cointegrating Vectors.
-
Third, to specify the ECM with variables in differences or increments while incorporating the Cointegrating Vector (specification (1)). It is necessary that the Cointegrating Vectors or Vector are significant. This three-step analysis and the obtained results are presented next.
4. Results and Discussion
With regard to the first stage, the graphs of the respective variables that don’t change over time are provided in Appendix A. In these figure we can appreciate the evolutive character of the variables, which implies the necessity for establishing the cointegrating relationships in order to avoid spurious relations (which is quite common for dealing with time series). In Appendix B we present tests for unit roots for all variables, which change over time applied to the levels. In all the cases, the null hypothesis of the unit root is accepted. Hence, it has been proved that the existence of two unit roots is rejected.
In the second stage, three Cointegrating Vectors, which represent long-term relationships, have been put forward. The fact of using three Cointegrating Vectors allows us to alleviate the multicollinearity problem. All three relationships permit explicating the trade flow between Russia and EU member states, which we call log(TRADE it ).
The first Cointegrating Vector (LP_1) establishes a long-term relationship between log(TRADE it ) and variables LOG(PIB_RUS/POP_RUS) and SANT. The second Cointegrating Vector (LP_2) implies a long-term relationship between log(TRADE it ) and the variables SP and LOG(EXCH). Finally, the third Cointegrating Vector (LP_3) determines a long-term relationship between log(TRADE ij /POP_P it ) and the variables LOG(PIB_CURRENT_P/POP_P), LOG(DIST) and LOG(PP). All three relationships have been determined with different versions of the Static Panel by checking that there are not any unit roots in the residues of the Models and the signs of the coefficients are the right ones.
To obtain an estimation of the first two Cointegrating Vectors, the Fixed Effects Model has been applied, i.e. it has been assumed that the heterogeneity between countries is correlated with the explanatory variables. In the case of the third Cointegrating Vector, its estimation has been carried out by applying the Random Effects Model in order to measure the effect of the Variable Log(DIST i ), which does not change over time. In this regard, the White’s matrix of variance and covariance for temporal units (corrected according to the degrees of freedom) has been used with a view to ensure the estimators’ robustness of standard error coefficients. Furthermore, the testing for unit roots on the residues of the static Fixed Effects and Random Effects Models were applied (see Appendix B, Tables B7, B8 and B9, respectively). In neither case has a unit root, being common or specific for every country, been admitted. In this regard, we can confirm all three of our hypotheses mentioned under the previous heading.
Part of the estimation results of the static panels (Cointegrating Vectors) is presented in Tables 2, 3 and 4. In these tables the t-student and p-value are provided. In all cases the coefficients show the correct signs, and they are clearly significant to 5%. In the case of the static panel estimated by Random Effects, the null hypothesis of no correlation between random effects and the explanatory variables (Test de Hausman) is accepted.
Cointegrating Vector LP_1 (fixed effects model).

Note: Cluster-Robust Standard Errors (White period) and Cross-section Weight. R 2 = 0.9790.
Cointegrating Vector LP_2 (fixed effects model).

Note: Cluster-Robust Standard Errors (White period) and Cross-section Weight. R 2 = 0.8996.
Cointegrating Vector LP_3 (random effects model).

Note: Cluster-Robust Standard Errors: (White period). Prob (Hausman-Test) = 0.6864. R 2 = 0.7542.
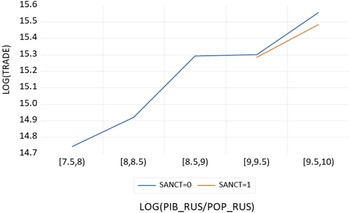
Figure 1 shows the negative effect of sanctions in a growing relationship on trade flow between Russia and EU member states. We would be talking about a reduction of about 25% in the trade flow.
Mean of LOG(TRADE) by LOG(PIB_CURRENT_RUS/POP_RUS) and SANCT. (To view this figure in colour please see the online version of this journal.)
Source: Own elaboration.

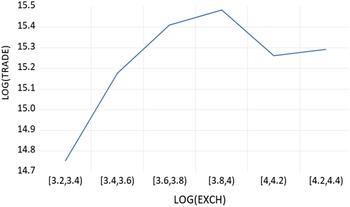
Figure 2 shows that the trade flow is experiencing growth relative to the devaluation of Russian currency with respect to the euro (the estimated elasticity is 0.7%). Figure 3 points out that the existence of strategic partnership between parties favours trade flow between Russia and EU member states. The estimations indicate an increase of 0.5% in trade flow.
Mean of LOG(TRADE) by LOG(EXCH).
Source: Own elaboration.

Mean of LOG(TRADE) by SP.
Source: Own elaboration.

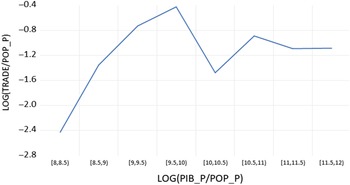
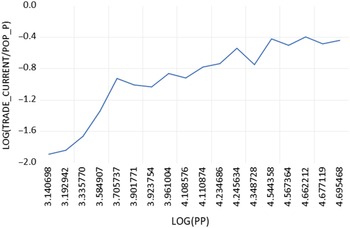
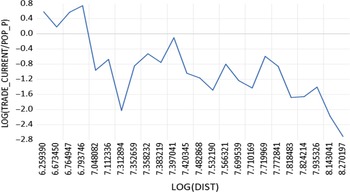
Figure 4 shows that the trade flow per capita is experiencing growth relative to an increase of EU member states’ GDP per capita. Likewise, an increase of 1% of oil price may augment approximately 0.8% the flow of trade between Russia and EU member states (see Figure 5). On the other hand, the trade flow tends to decrease with the distance between trade partners (see Figure 6).
Mean of LOG(TRADE/POP_P) by LOG(PIB_P/POP_P).
Source: Own elaboration.

Mean of LOG(TRADE/POP_P) by LOG(PP).
Source: Own elaboration.

Mean of LOG(TRADE/POP_P) by LOG(DIST).
Source: Own elaboration.

In the third stage, the ECM, which initially incorporates the three Cointegrating Vectors, was formulated. In this regard, the next step was to check if the mentioned relationships work in the ECM and its respective coefficients are significant and negative.
Tables 5 and 6 give the two ECMs considered for reproducing the generating process of the appropriate data of the trade flow. Such models respond to specification (1). The difference between these two models lies in the fact that the first model includes the Cointegrating Vectors LP_1 and LP_3 while the second model contains the Cointegrating Vectors LP_2 and LP_3. The model was estimated by the Generalized Method of Moments (GMM), applying a difference to the specification (1), similar to the Arellano-Bond estimator while using as an additional tool ∆LOG(TRADE it–1) besides the variables, which are presented in the model. Note in this regard that the difference to specification (1) would equate to modelling the acceleration of Annual rates of trade flow between Russian and EU member states. This supra-differentiation favours the stationarity of variables even though it may reduce the efficiency.
Error Correction Model (1): panel generalized method of moments.

Note: J-Statistic = 23.51072. Prob (J-Statistic) = 0.215594. R 2 = 0.9170 (in levels). SE = 0.258267.
Error Correction Model (2): panel generalized method of moments.

Note: J-Statistic = 23.67122. Prob (J-Statistic) = 0.209068. R 2 = 0.9170 (in levels). SE = 0.258873.
Regarding the first ECM (see Table 5) the R 2 is high and there are no problems of specification. It is worth mentioning that the tools we used are orthogonal according to the J-Statistic contrast. Likewise, if the model is correct with specification (1), the Arellano-Bond Test permits verifying that there is first-order (but not second-order) autocorrelation in the residues of the model (see Table B10 of Appendix B).
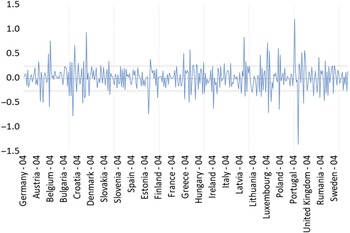
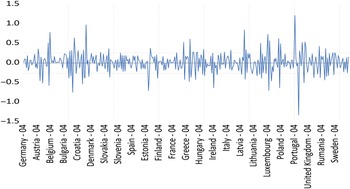
In this ECM the Cointegrating Vector LP_2 – which relates the trade flow with the devaluation of Russian currency and the fact of strategic partnership between parties – is not significant. However, the GDP per capita of the EU’s member states (PIB_P/POP_P) and oil prices (PP) are variables, which have influence both over the short term and the long term. Nonetheless, the distance between countries (DIST) and sanctions (SANCT) has influence over the long term. In Figure 7 the model residues are given where we can clearly appreciate that they are stationary.
Residues of Error Correction Model (1).
Source: Own elaboration.

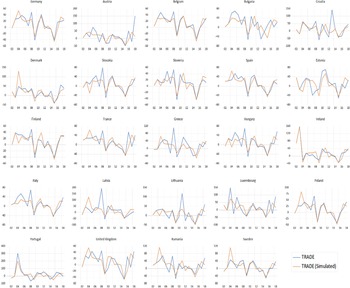
In Figure 8 the results of simulating the variable TRADE it with the ECM for 24 counties are given.
Interannual Rates Simulations of TRADE (24 countries) with ECM (1). (To view this figure in colour please see the online version of this journal.)
Source: Own elaboration.

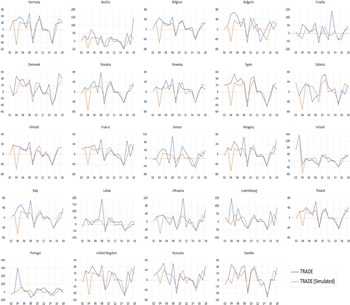
Regarding the second ECM (see Table 6), which incorporates the Cointegrating Vectors LP_2 and LP_3, the results resemble those that were obtained by the first model. Figures 9 and 10 show the results of simulating the interannual rates and stationary residues given by the second model.
Interannual rates simulations of TRADE (24 countries) with ECM (2). (To view this figure in colour please see the online version of this journal.)
Source: Own elaboration.

Residues of Error Correction Model (2).
Source: Own elaboration.

Finally, it is worth mentioning that although the Cointegrating Vector LP_2, which relates the trade flow with the devaluation of Russian currency and the fact of strategic partnership between parties, is not significant in the first ECM, it does not mean that there is no relationship between variables. This relationship does work long-term, but it is not required while incorporating the LP_1 and LP_3 to the model. In fact, this relationship works over the long term in the second ECM when we excluded the LP_1.
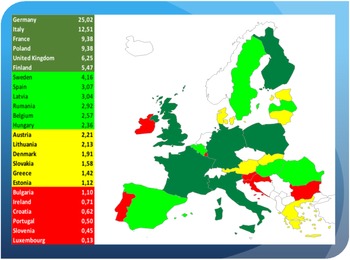
In closing, an exercise of simulation was made for estimating what the impact on EU–Russia trade flow would have been if the strategic partnership between parties had continued up until and through 2018. To complete the simulation, it was assumed that from 2014 the parties had not imposed sanctions against each other. To carry out such simulations we used the two Error Correction Models described in the previous paragraphs. The first ECM helps us evaluate the impact of the strategic partnership while the second estimates the absence of sanctions. The results of simulation show that if the parties had continued being strategic partners the trade flow of the 24 EU member states with Russia would have increased by about 3%. Figure 11 provides the percentage, which represents the average annual impact by every country with regard to the total average impact per year.
Absolute average impact (by country) of strategic partnership on the trade flow (%). (To view this figure in colour please see the online version of this journal.)
Source: Own elaboration.

Observing Figure 11, we can conclude that the countries that would have benefited most from the strategic partnership with Russia in absolute terms are Germany, Italy, France, Poland, the UK and Finland.
Figure 12 shows the impact of strategic partnership with Russia by country in proportion to its trade flow during the period 2014–2018, i.e. in relative terms it means that we do not take into consideration the benefits of trade volume with Russia.
Relative average impact (by country) of strategic partnership on the trade flow (%). (To view this figure in colour please see the online version of this journal.)
Source: Own elaboration.

Thus, observing Figure 12, we can conclude that, for example, the increase on its trade flow could have exceeded 4% in countries such as Sweden, Romania, Austria and Luxembourg, while in countries such as Belgium and Slovakia it barely represents 2% of their trade flow.
5. Conclusion and Discussion
Although the EU–Russia strategic partnership seemed to be problematic from the very beginning, with regard to shared values and the asymmetrical nature of this relationship, both parties advocated this concept of cooperation until the conflict in Ukraine put an end to it. However, the relatively high longevity of the EU–Russia Strategic Partnership has given us an opportunity to carry out an empirical analysis of this concept.
In spite of the many experts who have published their opinions remaining sceptical about the EU’s concept of strategic partnership toward its key partners – as well as being doubtful about the future existence of a strategic partnership between Russia and the EU – in this article it has been empirically proved that the EU–Russia strategic partnership had a positive impact on bilateral trade. This validation was achieved by means of applying the Gravity Model. In this regard, we can conclude that the EU’s concept of strategic partnership represents a science-based category of Foreign Policy, which should be estimated in accordance with every case in particular. Moreover, by using this model, we also analysed the impact of such variables as the growth of Russian and EU GDPs per capita, the geographical distance between parties, the devaluation of Russian currency, and the rise in oil prices on EU–Russia trade flow. In order to collect both long-term and short-term relationship data based on significant variables, the Dynamic Panel Data was utilized. With a view to avoiding any multicollinearity between variables, three implementations were administered. In this regard, by constructing the three Cointegrating Vectors, the negative effect of distance and sanctions on bilateral trade was confirmed. On the other hand, the model also validated the positive effect of devaluation of Russian currency and the growth of Russian and EU GDPs per capita, plus the rise in oil prices on bilateral trading.
During the last stage of our three-step analysis, the two Error Correction Models (ECM) were formulated by incorporating three vectors of cointegration. The ECM improves the explanatory capacity of trade due to the fact that not only does it take into consideration the long-term dynamic (vectors of cointegration) but also the short-term dynamic with a view to minimizing the variability size of the term of disturbance. According to the results of the first model, the second vector, which links trade with the devaluation of Russian currency and strategic partnership, was not significant. However, it does not mean the absence of a relationship between the variables. In fact, this relationship does exist in the long term, provided we don’t incorporate the other two vectors. This means that we shouldn’t use all three vectors at the same time because there is multicollinearity between them. Actually, the second Cointegrating Vector became significant in the second ECM when we omitted the first Vector from the model.
Moreover, the Error Correction Models permitted us to estimate the impact of strategic partnership by country on EU–Russia trade flow both in absolute and relative terms, assuming that the parties would have continued being strategic partners and, consequently, the sanctions would not have been imposed. In this regard, it is not surprising that, in absolute terms, the countries that receive the most benefit from the strategic partnership with Russia are its largest trade partners. However, if we estimate the impact of strategic partnership on the bilateral trade in relative terms it can be concluded that even Russia’s smaller trading partners are incurring significant welfare losses from sanctions along with Russia itself. On the other hand, the loss of a failed strategic partnership and sanctions provides for an average of roughly 3% per year. Even though this number represents a significant sum of money, we argue that this result is quite far from a critical loss: that is to say, despite sanctions and a failed strategic partnership, the EU and Russia continue actively trading with each other. Which begs the question, why do the parties continue this sanction war and for how long will it remain?
Finally, it is worth mentioning that the negative experience of the EU–Russia strategic partnership not only provides useful lessons for other powerful agents on the international stage but also can help parties to avoid past mistakes in rebuilding their relationships in the future once the precedent with Ukraine is resolved.
Acknowledgement
The authors would like to thank Eric Richard Le Roy for editorial assistance.
About the Authors
Anna Garashchuk is a researcher in the Jean Monnet Center of Excellence on European and Global Studies and Research, Universidad de Málaga, Spain, and has a PhD in Economics and Business, Universidad de Málaga, Spain. She has a Master’s in International Cooperation and Politics of Development. Recent publications include Podadera P and Garashchuk A (2016) The Eurasian economic union: prospective regional integration in the post-Soviet space or just geopolitical project? Eastern Journal of European Studies (EJES) 7(2), 91–110; Podadera P and Garashchuk A (2019) Strategic partner’s attractiveness index for the European Union. Can the Eurasian economic union headed by Russia become a strategic partner for the EU? Revista de economía mundial 51, 207–228; Podadera P and Garashchuk A (2020) Heterogeneity of the European Union’s strategic partners: can they still be compatible? European Review 28(2), 202–224.
Fernando Isla Castillo has a PhD in Business Administration and Management from the University of Malaga (1998), and is a professor at the University of Malaga, Department of Applied Economics (Statistics and Econometrics). He has taught various Econometrics subjects in Undergraduate and Postgraduate degrees. He is director of the Economic Forecast Chair at the University of Malaga (2019–), and a member of the HISPALINK-Andalusia Team that is integrated into the HISPALINK network formed by different Spanish universities dedicated to the economic forecasts of the regions in Spain (1995–). His publications and research projects cover: regional modelling, prediction and simulation techniques with econometric models, Monte Carlo simulation methods applied to econometrics, input–output tables modelling and multiplier analysis.
Pablo Podadera Rivera has a PhD in Economics from the University of Malaga (1998), and a Master’s Degree in European Studies (European Initiative EUROFORM), 1995. He is Professor at the University of Malaga (Department of Economic Policy of the Faculty of Economics), in which he teaches various undergraduate and graduate subjects, including ‘Economics and Politics of the European Union’ and ‘European Union and Development’. He is Jean Monnet ‘Ad Personam’ of European Economy and Economic Policy (2012–) and Director of the Jean Monnet Center of Excellence (UMA-JMCE) of the University of Malaga (2017–). In addition, he is Director of the Research Group: Economic Policy, European Union and Global Studies (SEJ-108) (2017–), a member of ECSA-SPAIN (Spanish Association of University Professors and Researchers Specializing in European Integration) (2002–), a member of the Association for Evolutionary Economics (AFEE) (2012–), a member of the executive committee of the International Association of Applied Economics (ASEPELT) (2015–), a member of the editorial board of the magazine Derecho y Economía de la Integración, Juri-Dileyc, Alcalá De Henares (2015–), and a member of the editorial board of the Juruá editorial house (Lisbon, Brazil) (2005). His publications and research projects are on: local development; economy and politics of the European Union; technological innovation and territorial development; international cooperation; economic, social and territorial cohesion in the EU; EU and globalization.
Appendix A. Graphs
Log(TRADE/POP_RUS).
Source: Own elaboration.

Log(TRADE/POP_P).
Source: Own elaboration.

Log(PIB_RUS/POP_RUS).
Source: Own elaboration.

Log(PIB_P/POP_P).
Source: Own elaboration.

Log(PP).
Source: Own elaboration.

Log(EXCH).
Source: Own elaboration.

Appendix B. Statistical Results
Panel unit root test (summary): Log(TRADE).

Note: Probabilities for Fisher tests are computed using an asymptotic Chi-square distribution. All other tests assume asymptotic normality. Individual intercept and trend in test equation.
Panel unit root test (summary): Log(TRADE/POP_P).

Note: Probabilities for Fisher tests are computed using an asymptotic Chi-square distribution. All other tests assume asymptotic normality. Individual intercept and trend in test equation.
Panel unit root test (summary): Log(PIB_RUS/POP_RUS).

Note: Probabilities for Fisher tests are computed using an asymptotic Chi-square distribution. All other tests assume asymptotic normality. Individual intercept and trend in test equation.
Panel unit root test (summary): Log(PIB_P/POP_P).

Note: Probabilities for Fisher tests are computed using an asymptotic Chi-square distribution. All other tests assume asymptotic normality. Individual intercept and trend in test equation.
Panel unit root test (summary): Log(PP).

Note: Probabilities for Fisher tests are computed using an asymptotic Chi-square distribution. All other tests assume asymptotic normality. Individual intercept and trend in test equation.
Panel unit root test (summary): Log(EXCH).

Note: Probabilities for Fisher tests are computed using an asymptotic Chi-square distribution. All other tests assume asymptotic normality. Individual intercept and trend in test equation.
Panel unit root test (summary). Residual Static Panel 1.

Note: Probabilities for Fisher tests are computed using an asymptotic Chi-square distribution. All other tests assume asymptotic normality. Individual intercept in test equation.
Panel unit root test (summary). Residual Static Panel 2.

Note: Probabilities for Fisher tests are computed using an asymptotic Chi-square distribution. All other tests assume asymptotic normality. Individual intercept in test equation.
Panel unit root test (summary). Residual Static Panel 3.

Note: Probabilities for Fisher tests are computed using an asymptotic Chi-square distribution. All other tests assume asymptotic normality. Individual intercept in test equation.
Arellano-Bond Serial Correlation Test: Residual ECM.

Source: Own elaboration.