1 Introduction
We revisit the classical but as yet unresolved problem of predicting the breaking strength of 2-D and 3-D gravity water waves. The most commonly used approach is the Phillips (Reference Phillips1985) spectral framework for the mean breaking crest length per unit area with speeds in the range (
 $\boldsymbol{c},\boldsymbol{c}+\text{d}\boldsymbol{c}$
). This is combined with the Duncan (Reference Duncan1983) scaling argument for the wave energy dissipation rate per unit length of breaking crest,
 $\unicode[STIX]{x1D716}$
, given by
 $$\begin{eqnarray}\unicode[STIX]{x1D716}=\frac{\tilde{\unicode[STIX]{x1D716}}}{\unicode[STIX]{x1D70F}l}=b\unicode[STIX]{x1D70C}g^{-1}c_{b}^{5},\end{eqnarray}$$
where
 $\tilde{\unicode[STIX]{x1D716}}$
is the total wave energy dissipation due to wave breaking,
 $\unicode[STIX]{x1D70F}$
is the averaging period and is of the order of the active breaking period,
 $l$
is the mean length of the breaking crest during the averaging period,
 $\unicode[STIX]{x1D70C}$
is the density of the liquid phase,
 $g$
is the gravitational acceleration,
 $c_{b}$
is the phase speed of the breaking wave and
 $b$
is the dimensionless constant of proportionality, hereafter referred to as the breaking strength parameter.
Field and laboratory data have shown a strong dependence of
 $b$
, within the scatter of data, on the global wave steepness
 $S$
calculated on the basis of spectral information for wave packets (Romero, Melville & Kleiss Reference Romero, Melville and Kleiss2012). Derakhti & Kirby (Reference Derakhti and Kirby2016) provided a new scaling for
 $b$
based on the spectrally averaged global steepness of a wave field, where the scatter of estimates of
 $b$
based on numerical computations was considerably decreased compared with the existing formulations (Romero et al.
Reference Romero, Melville and Kleiss2012). The formulations of Romero et al. (Reference Romero, Melville and Kleiss2012) and Derakhti & Kirby (Reference Derakhti and Kirby2016) provide estimates of
 $b>0$
for packets with
 $S>\sim 0.08$
. However,
 $S$
for non-breaking packets can reach values of 0.3 or higher. Thus, another criterion, based on additional information beyond that provided by parameter
 $S$
, is needed to distinguish between breaking and non-breaking packets. Moreover, although such a parameterization is adaptable via the spectral saturation for use in phase-averaged spectral wind–wave models, the evaluation of
 $S$
is problematic in phase-resolved models. Finally, we note that existing versions of the data analysis (e.g., Banner & Peirson Reference Banner and Peirson2007) give values of
 $b$
for multiple-breaking events that fall appreciably below values reported for single-breaking focused wave packets (Romero et al.
Reference Romero, Melville and Kleiss2012, figure 1), suggesting a significant physical difference between the mechanisms of breaking in the two types of events. However, this can be primarily attributed to different choices for averaging periods, as discussed in detail in § 4 below.
Barthelemy et al. (Reference Barthelemy, Banner, Peirson, Fedele, Allis and Dias2018) showed that highest non-breaking waves are clearly separated from marginally breaking waves by their normalized energy fluxes localized near the crest tip region, and that initial breaking instability occurs within a very compact region centred on the wave crest. On the surface, the expression for the normalized energy flux (denoted by the symbol
 $B$
) reduces to the ratio of the fluid velocity at the crest to the translational velocity of the crest for the tallest wave in the evolving group. Barthelemy et al. (Reference Barthelemy, Banner, Peirson, Fedele, Allis and Dias2018) found that a value of
 $B=0.85$
provides a robust threshold for breaking onset for 2-D wave packets propagating in deep or intermediate uniform water depths. Further targeted study of representative cases of the most severe laterally focused 3-D wave packets in deep and intermediate depth water showed that the threshold remains robust. These numerical findings for 2-D and 3-D cases were closely supported by the observations of Saket et al. (Reference Saket, Peirson, Banner, Barthelemy and Allis2017, Reference Saket, Peirson, Banner and Allis2018).
Our goal here is to find a robust and local parameterization to predict the breaking strength of 2-D and 3-D gravity water waves. We use a large-eddy-simulation (LES)/volume-of-fluid (VOF) model (Derakhti & Kirby Reference Derakhti and Kirby2014a
, Reference Derakhti and Kirby2016) to simulate nonlinear wave evolution, with a strong focus on breaking onset and postbreaking behaviour for representative cases of wave packets, and examine breaking due to dispersive focusing and modulational instability. Using these numerical results, we investigate the relationship between the breaking strength parameter
 $b$
and the breaking onset parameter
 $B$
proposed by Barthelemy et al. (Reference Barthelemy, Banner, Peirson, Fedele, Allis and Dias2018). While the results are potentially applicable more generally, in this paper, we concentrate on breaking events due to focusing or modulational instability in wave packets over flat bottom topography and for conditions ranging from deep to intermediate depth, with depth to wavelength ratios ranging from 0.68 to 0.13. Examination of depth-limited breaking or breaking due to strong opposing currents is left for future study.
2 Numerical experiments
A detailed description of the polydisperse two-fluid model and the boundary conditions used may be found in Derakhti & Kirby (Reference Derakhti and Kirby2014a , § 2). Demonstrations of model convergence and performance may be found in Derakhti & Kirby (Reference Derakhti and Kirby2014b , Reference Derakhti and Kirby2016). The model parameters for a polydisperse bubble phase are chosen as summarized in Derakhti & Kirby (Reference Derakhti and Kirby2014a , table 4). Here, the incident wave boundary condition and model set-up are discussed briefly.
We define the coordinate system
 $(x,y,z)$
such that
 $x$
and
 $y$
represent the along-tank and transverse directions respectively and
 $z$
is the vertical direction, positive upward and measured from the still water level. The reference time
 $t^{\ast }$
and
 $x$
-location
 $x^{\ast }$
are taken as the time and location at which
 $B$
following the crest tip reaches the threshold value of 0.85 for breaking packets, or its maximum for non-breaking packets, respectively, and are normalized by the local period and wavelength of the carrier wave respectively.
All model simulations are performed with the model initialized with quiescent conditions. An incident wave packet is then generated at the model upstream boundary. The input wave packet is composed of
 $N$
sinusoidal components of steepness
 $a_{n}k_{n}$
,
 $n=1,\ldots ,N$
, where
 $a_{n}=S/(Nk_{n})$
and
 $k_{n}$
are the amplitude and wavenumber of the
 $n$
th frequency component and
 $S=\sum _{n=1}^{N}a_{n}k_{n}$
is the linear prediction of the wave packet global steepness. Based on linear theory, the free-surface elevation for the 2-D (Rapp & Melville Reference Rapp and Melville1990; Derakhti & Kirby Reference Derakhti and Kirby2014a
) and 3-D (Wu & Nepf Reference Wu and Nepf2002; Kirby & Derakhti Reference Kirby and Derakhti2018) focused packets at the wavemaker is given by
 $$\begin{eqnarray}\unicode[STIX]{x1D702}(0,y,t)=\mathop{\sum }_{n=1}^{N}a_{n}\,\text{cos}\!\left[2\unicode[STIX]{x03C0}f_{n}(t-t_{f})+\frac{k_{n}x_{f}}{\cos \unicode[STIX]{x1D703}(y)}\right],\end{eqnarray}$$
where
 $f_{n}$
is the frequency of the
 $n$
th component,
 $x_{f}$
and
 $t_{f}$
are the predefined linear theory estimates of the location and time of the focal point respectively, and
 $\unicode[STIX]{x1D703}(y)$
is the angle of incidence of each wave component at various transverse locations, with
 $\cos \unicode[STIX]{x1D703}(y)=1$
in 2-D and
 $\cos \unicode[STIX]{x1D703}(y)=x_{f}/\sqrt{x_{f}^{2}+y^{2}}$
in 3-D breaking cases. The discrete frequencies
 $f_{n}$
are uniformly spaced over the band
 $\unicode[STIX]{x0394}f=f_{N}-f_{1}$
with a central frequency defined by
 $f_{c}=1/2(f_{N}+f_{1})$
. Following the set-up of the initially bimodal wave trains in Banner & Peirson (Reference Banner and Peirson2007), the free-surface elevation for a 2-D modulated wave train at the wavemaker is given by
 $$\begin{eqnarray}\unicode[STIX]{x1D702}(0,y,t)=a_{1}\cos (\unicode[STIX]{x1D714}_{1}t)+a_{2}\cos \left(\unicode[STIX]{x1D714}_{2}t-\frac{\unicode[STIX]{x03C0}}{18}\right),\end{eqnarray}$$
where
 $\unicode[STIX]{x1D714}_{1}=2\unicode[STIX]{x03C0}f_{1}$
,
 $\unicode[STIX]{x1D714}_{2}=\unicode[STIX]{x1D714}_{1}+2\unicode[STIX]{x03C0}\unicode[STIX]{x0394}f$
,
 $S=a_{1}k_{1}+k_{2}a_{2}$
and
 $a_{2}/a_{1}=0.3$
. Increase of the global steepness
 $S$
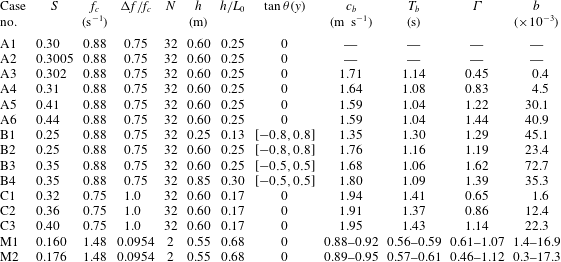
increases the strength of the resulting breaking event in both focused packets and modulated wave trains. Finally, the fluid velocities for each component are calculated using linear theory and then superimposed at the wavemaker. Table 1 summarizes the input parameters for all simulated cases.
Input parameters for the simulated alongcrest-uniform (2-D) and short-crested (3-D) focused wave packets and 2-D modulated wave trains. Here,
 $x_{f}$
and
 $t_{f}$
are 9 m and 20 s in 2-D and 5 m and 12 s in 3-D focused packets respectively.

3 A new parameterization for the breaking strength parameter
 $b$

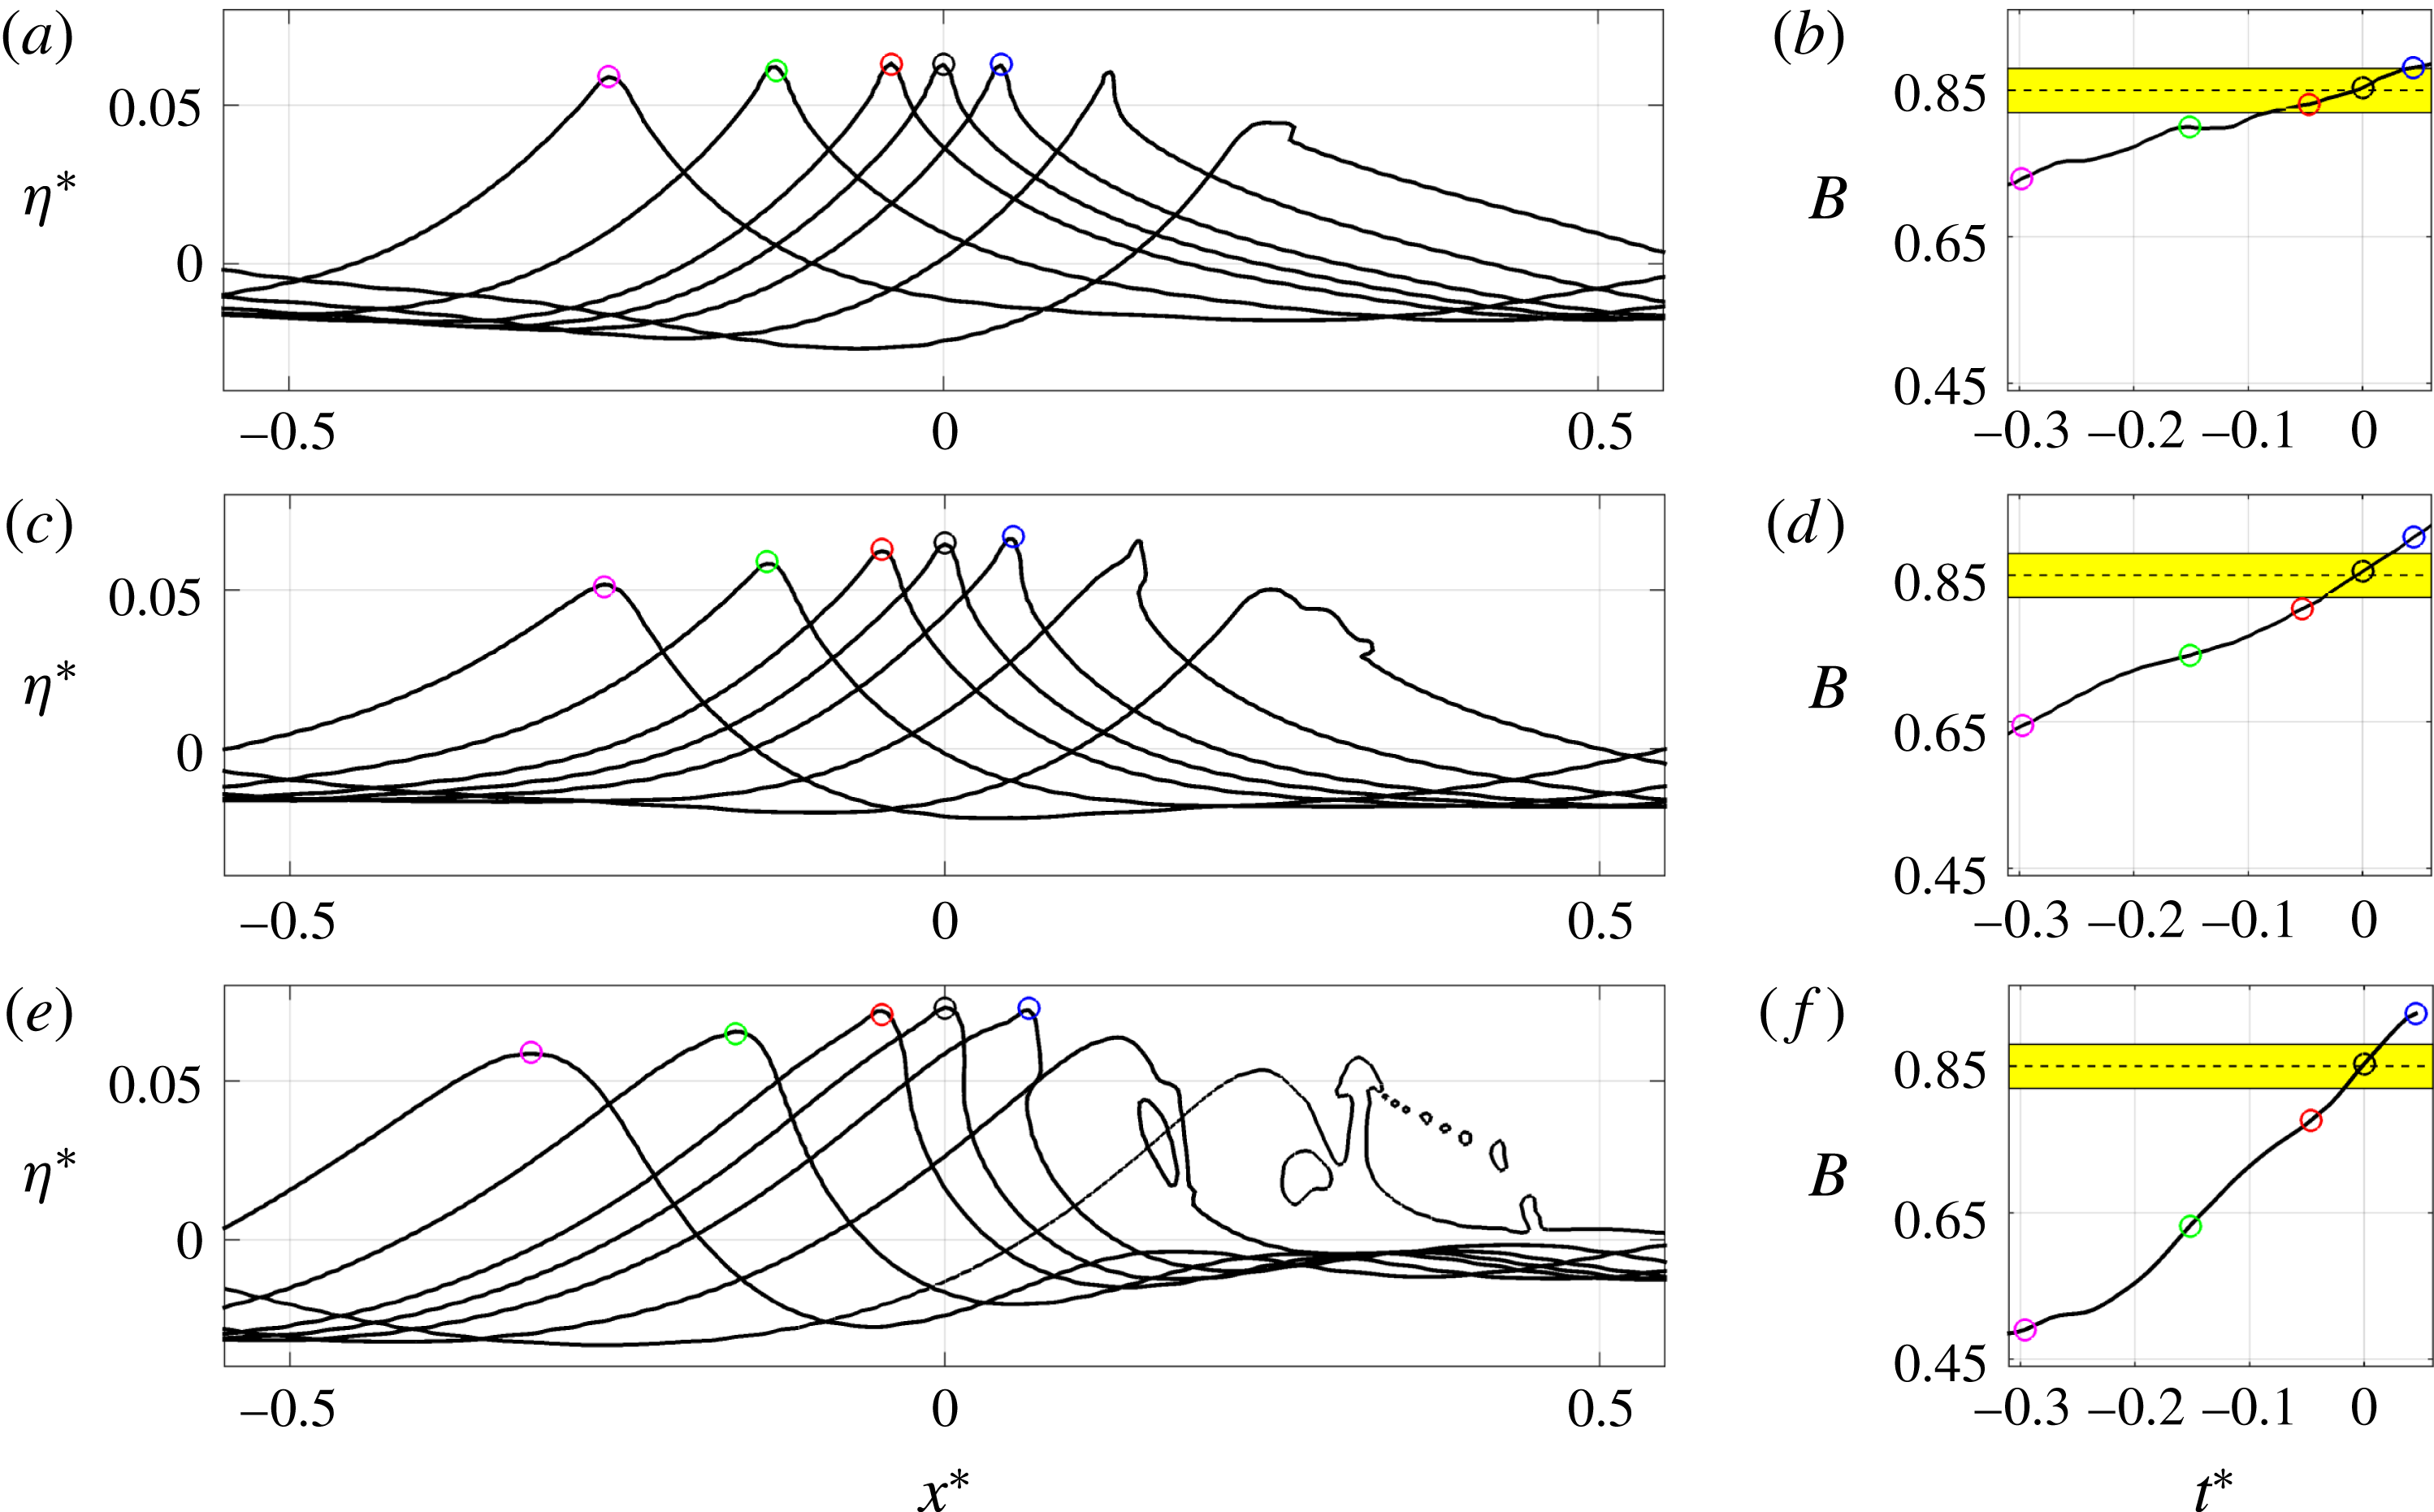
Figure 1 shows snapshots of free-surface elevations before and after breaking onset as well as the temporal variation of
 $B$
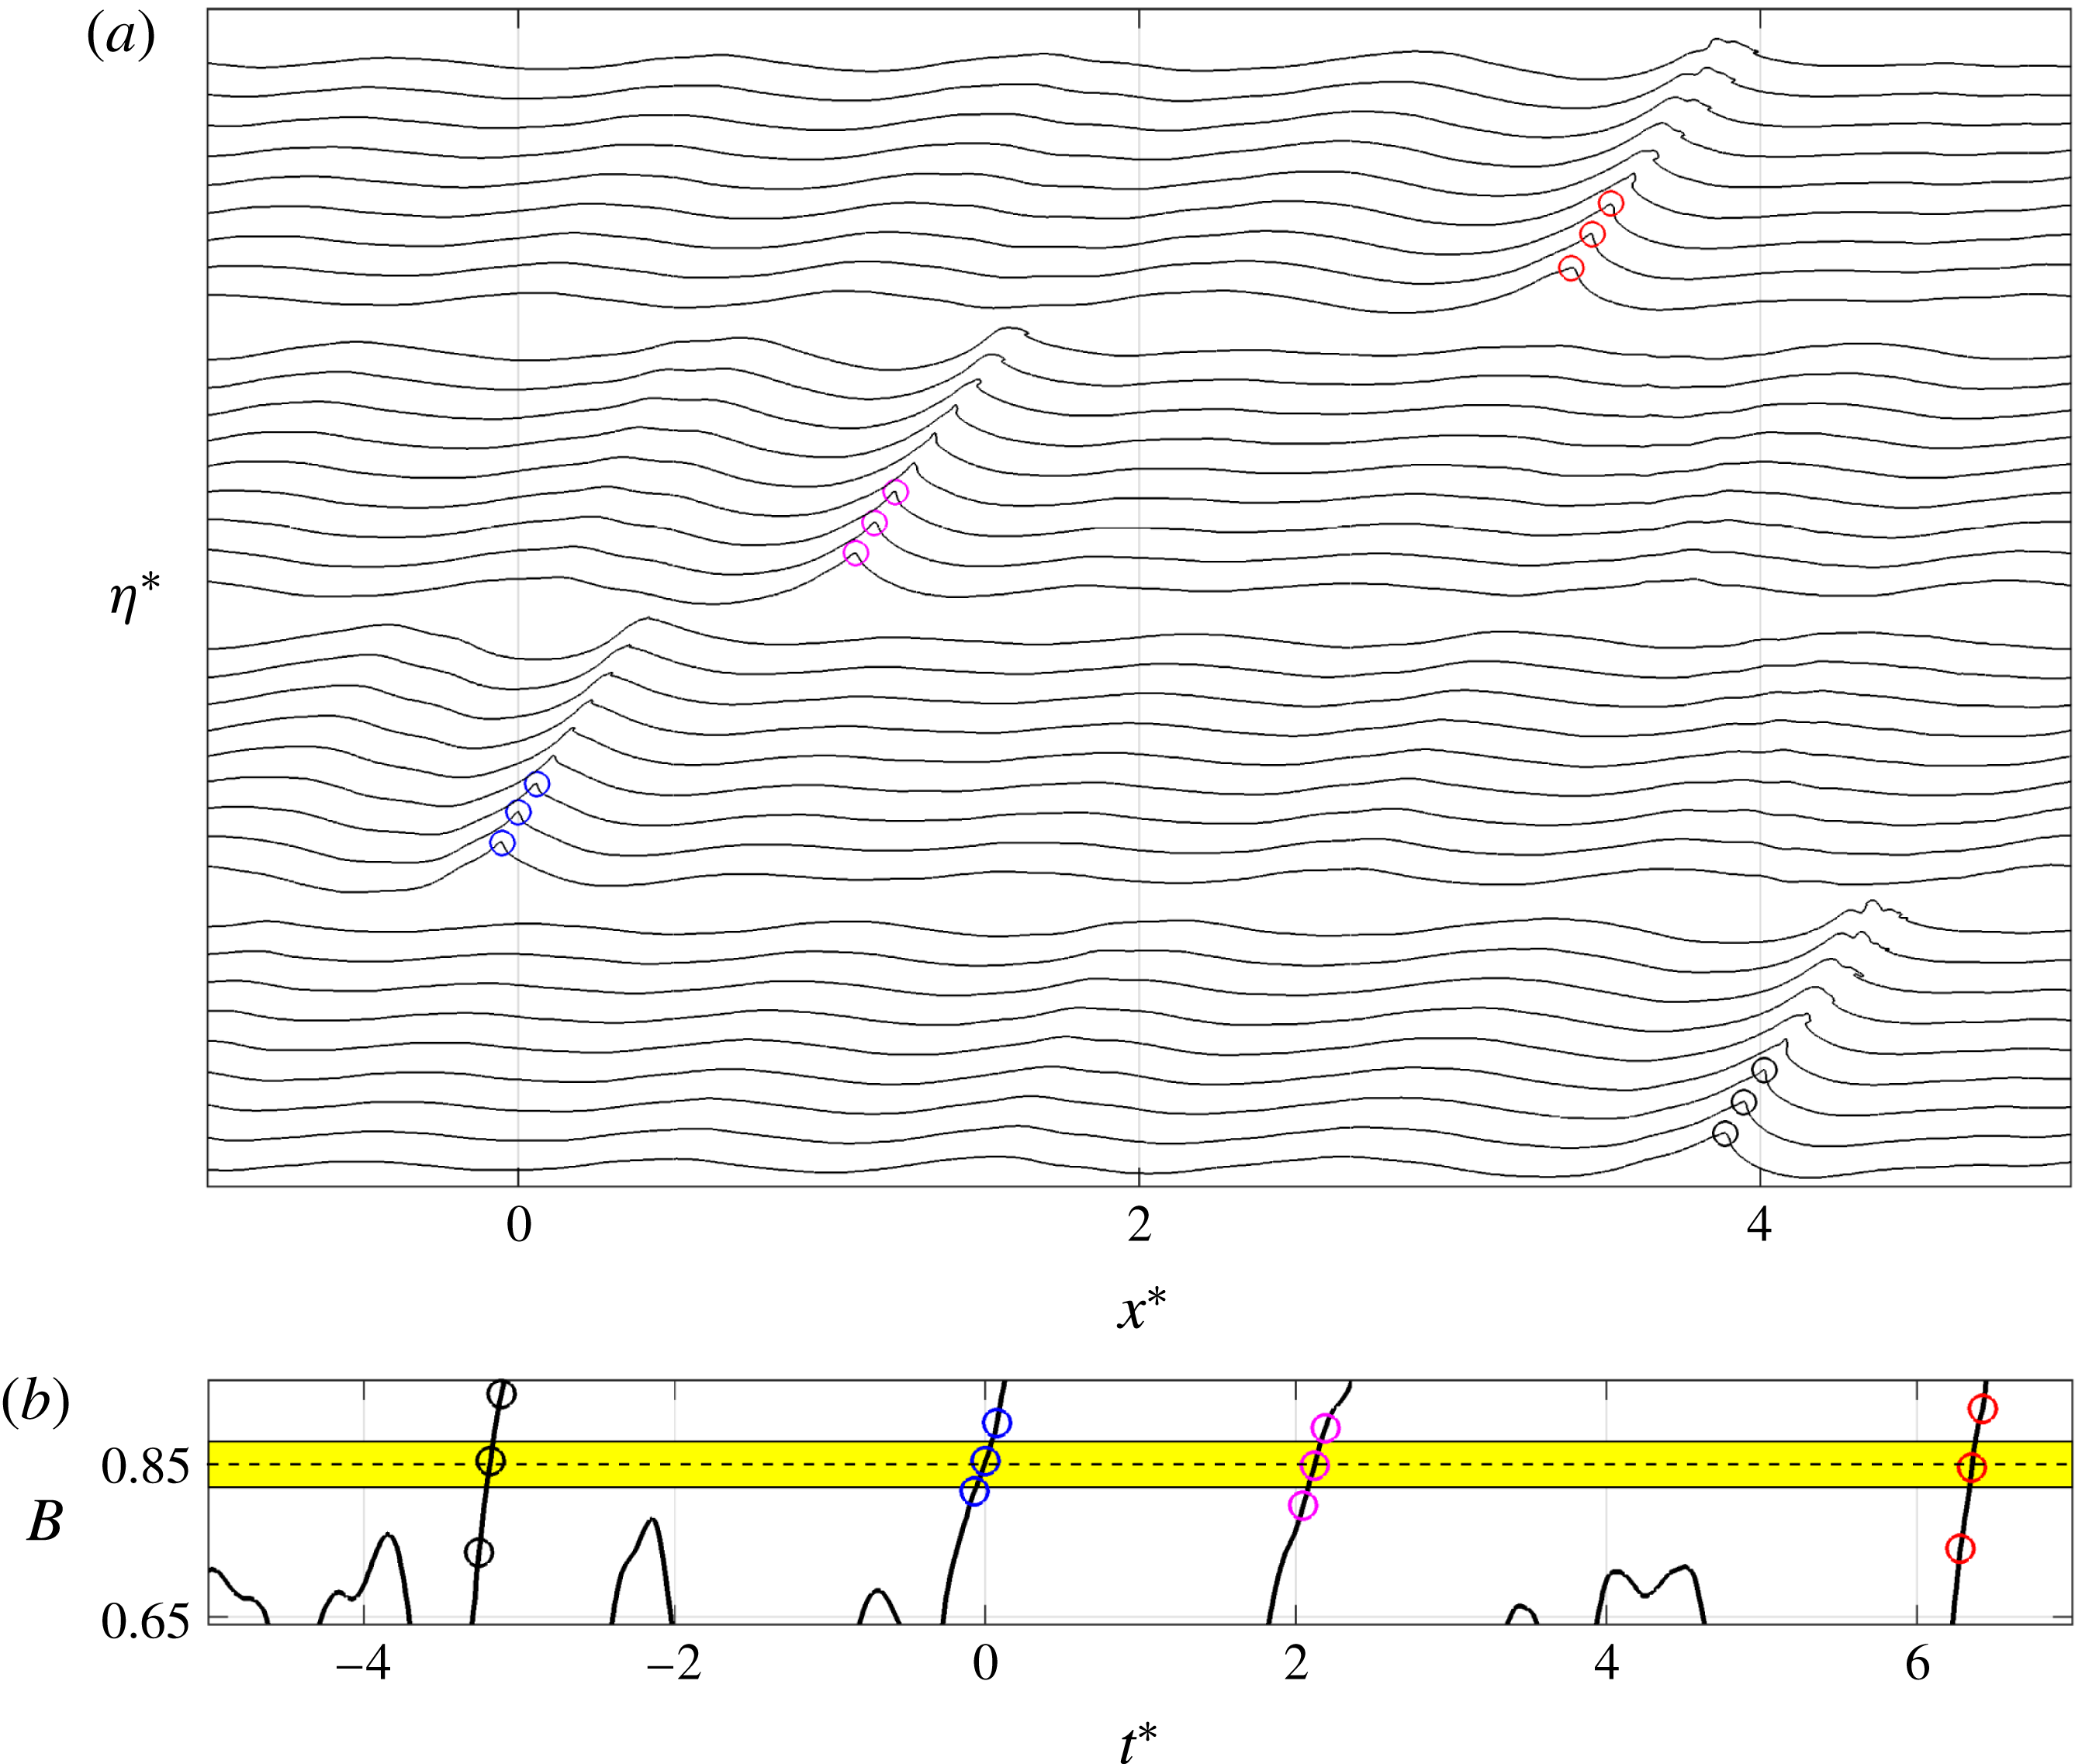
for the evolving wave crest for the single-breaking focused packets A3, A4 and A6. Figure 2 shows corresponding results for the multiple-breaking modulated wave train M2. The results show that, as the strength of breaking increases, the rate of change of
 $B$
near the threshold value,
 $\text{d}B/\text{d}t|_{B_{th}}$
, increases. Consistent with Barthelemy et al. (Reference Barthelemy, Banner, Peirson, Fedele, Allis and Dias2018), warning of imminent breaking onset (
 $t^{\ast }=0$
here) occurs up to a fifth of a carrier wave period prior to a breaking event. As a consequence, the wave form at
 $B=B_{th}$
is well defined and the free surface is single-valued.
(a,c,e) Snapshots of the spatial variation of the normalized free-surface elevations near the maximum crest and (b,d,f) the temporal variation of
 $B$
before and after the breaking onset for the weak-spilling A3, spilling A4 and strong-plunging A6 breaking 2-D focused packets.

(a) Snapshots of the spatial variation of the normalized free-surface elevations near the maximum crest and (b) the temporal variation of
 $B$
for four successive breaking events in the 2-D multiple-breaking modulated wave train M2.

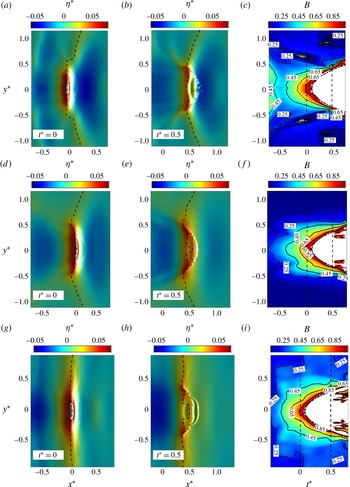
(a,d,g and b,e,h) Plan view of the spatial variation of the normalized free-surface elevations near the maximum crest at (a,d,g)
 $t^{\ast }=0$
and (b,e,h)
 $t^{\ast }=0.5$
, as well as (c,f,i) the spatio-temporal variation of
 $B$
for the 3-D focused packets, for (a,b,c) B1, (d,e,f) B2 and (g,h,i) B4. The corresponding crest locations of the two vertical dashed lines in (c,f,i) are shown by the dashed lines in (a,d,g and b,e,h) in each case. In (c,f,i), white colour shows regions where
 $B$
has exceeded a value of 1 or has become poorly defined due to breakdown of the smooth water surface. The dotted–dashed lines show
 $y^{\ast }=\pm \unicode[STIX]{x1D6FC}_{1}(t^{\ast }-\unicode[STIX]{x1D6FC}_{2})^{1/2}$
, where
 $\unicode[STIX]{x1D6FC}_{1}\approx 0.5$
and
 $\unicode[STIX]{x1D6FC}_{2}=0.09$
.

Figure 3 shows a plan view of the spatial distribution of the normalized free-surface elevations at
 $t^{\ast }=0$
, at which
 $B(y\sim 0)=B_{th}$
, and after breaking onset at
 $t^{\ast }=0.5$
, as well as the spatio-temporal variation of
 $B$
for the 3-D breaking focused packets B1, B2 and B4. The latter picture is constructed by displaying the corresponding
 $B$
curves at each transverse location. In each case, the dashed lines in figure 3(a,d,g and b,e,h) correspond to the two vertical dashed lines shown in figure 3(c,f,i) and show the location of the crest maximum at the associated times. Due to a strong 3-D focusing of the incident wave packet, the position of the crest maximum at each transverse location may experience rapid change even close to the breaking region, resulting in unrealistic
 $\text{d}B/\text{d}t$
values. Panel (a) demonstrates an example of such a jump in the location of the maximum crest at
 $|y^{\ast }|\sim 0.6$
. The corresponding high values of
 $B$
shown in panel (c) for
 $|y^{\ast }|\sim 0.6$
are then just an artifact of the postprocessing method. Figure 3 also shows that the breaking process starts around
 $y^{\ast }=0$
, with the breaking crest gradually growing in width during the active breaking period, and that
 $B$
has approximately the same temporal structure within the region close to the crest maximum location prior to breaking onset (
 $|y^{\ast }|<0.15$
,
 $-0.1<t^{\ast }$
). Further, the length of the breaking crest, as shown by the dotted–dashed line in figure 3(c,f,i), expands proportionally to
 ${\sim}(t-t_{o})^{1/2}$
, where
 $t_{o}$
is the time at which the crest overturning starts. Such a growth rate of the length of the breaking crest is consistent with theoretical work of Pomeau et al. (Reference Pomeau, Le Berre, Guyenne and Grilli2008). Hereafter, we choose
 $B(y^{\ast }=0)$
as the representative
 $B$
value for the 3-D cases to compare with the 2-D cases for the proposed parameterization discussed below.
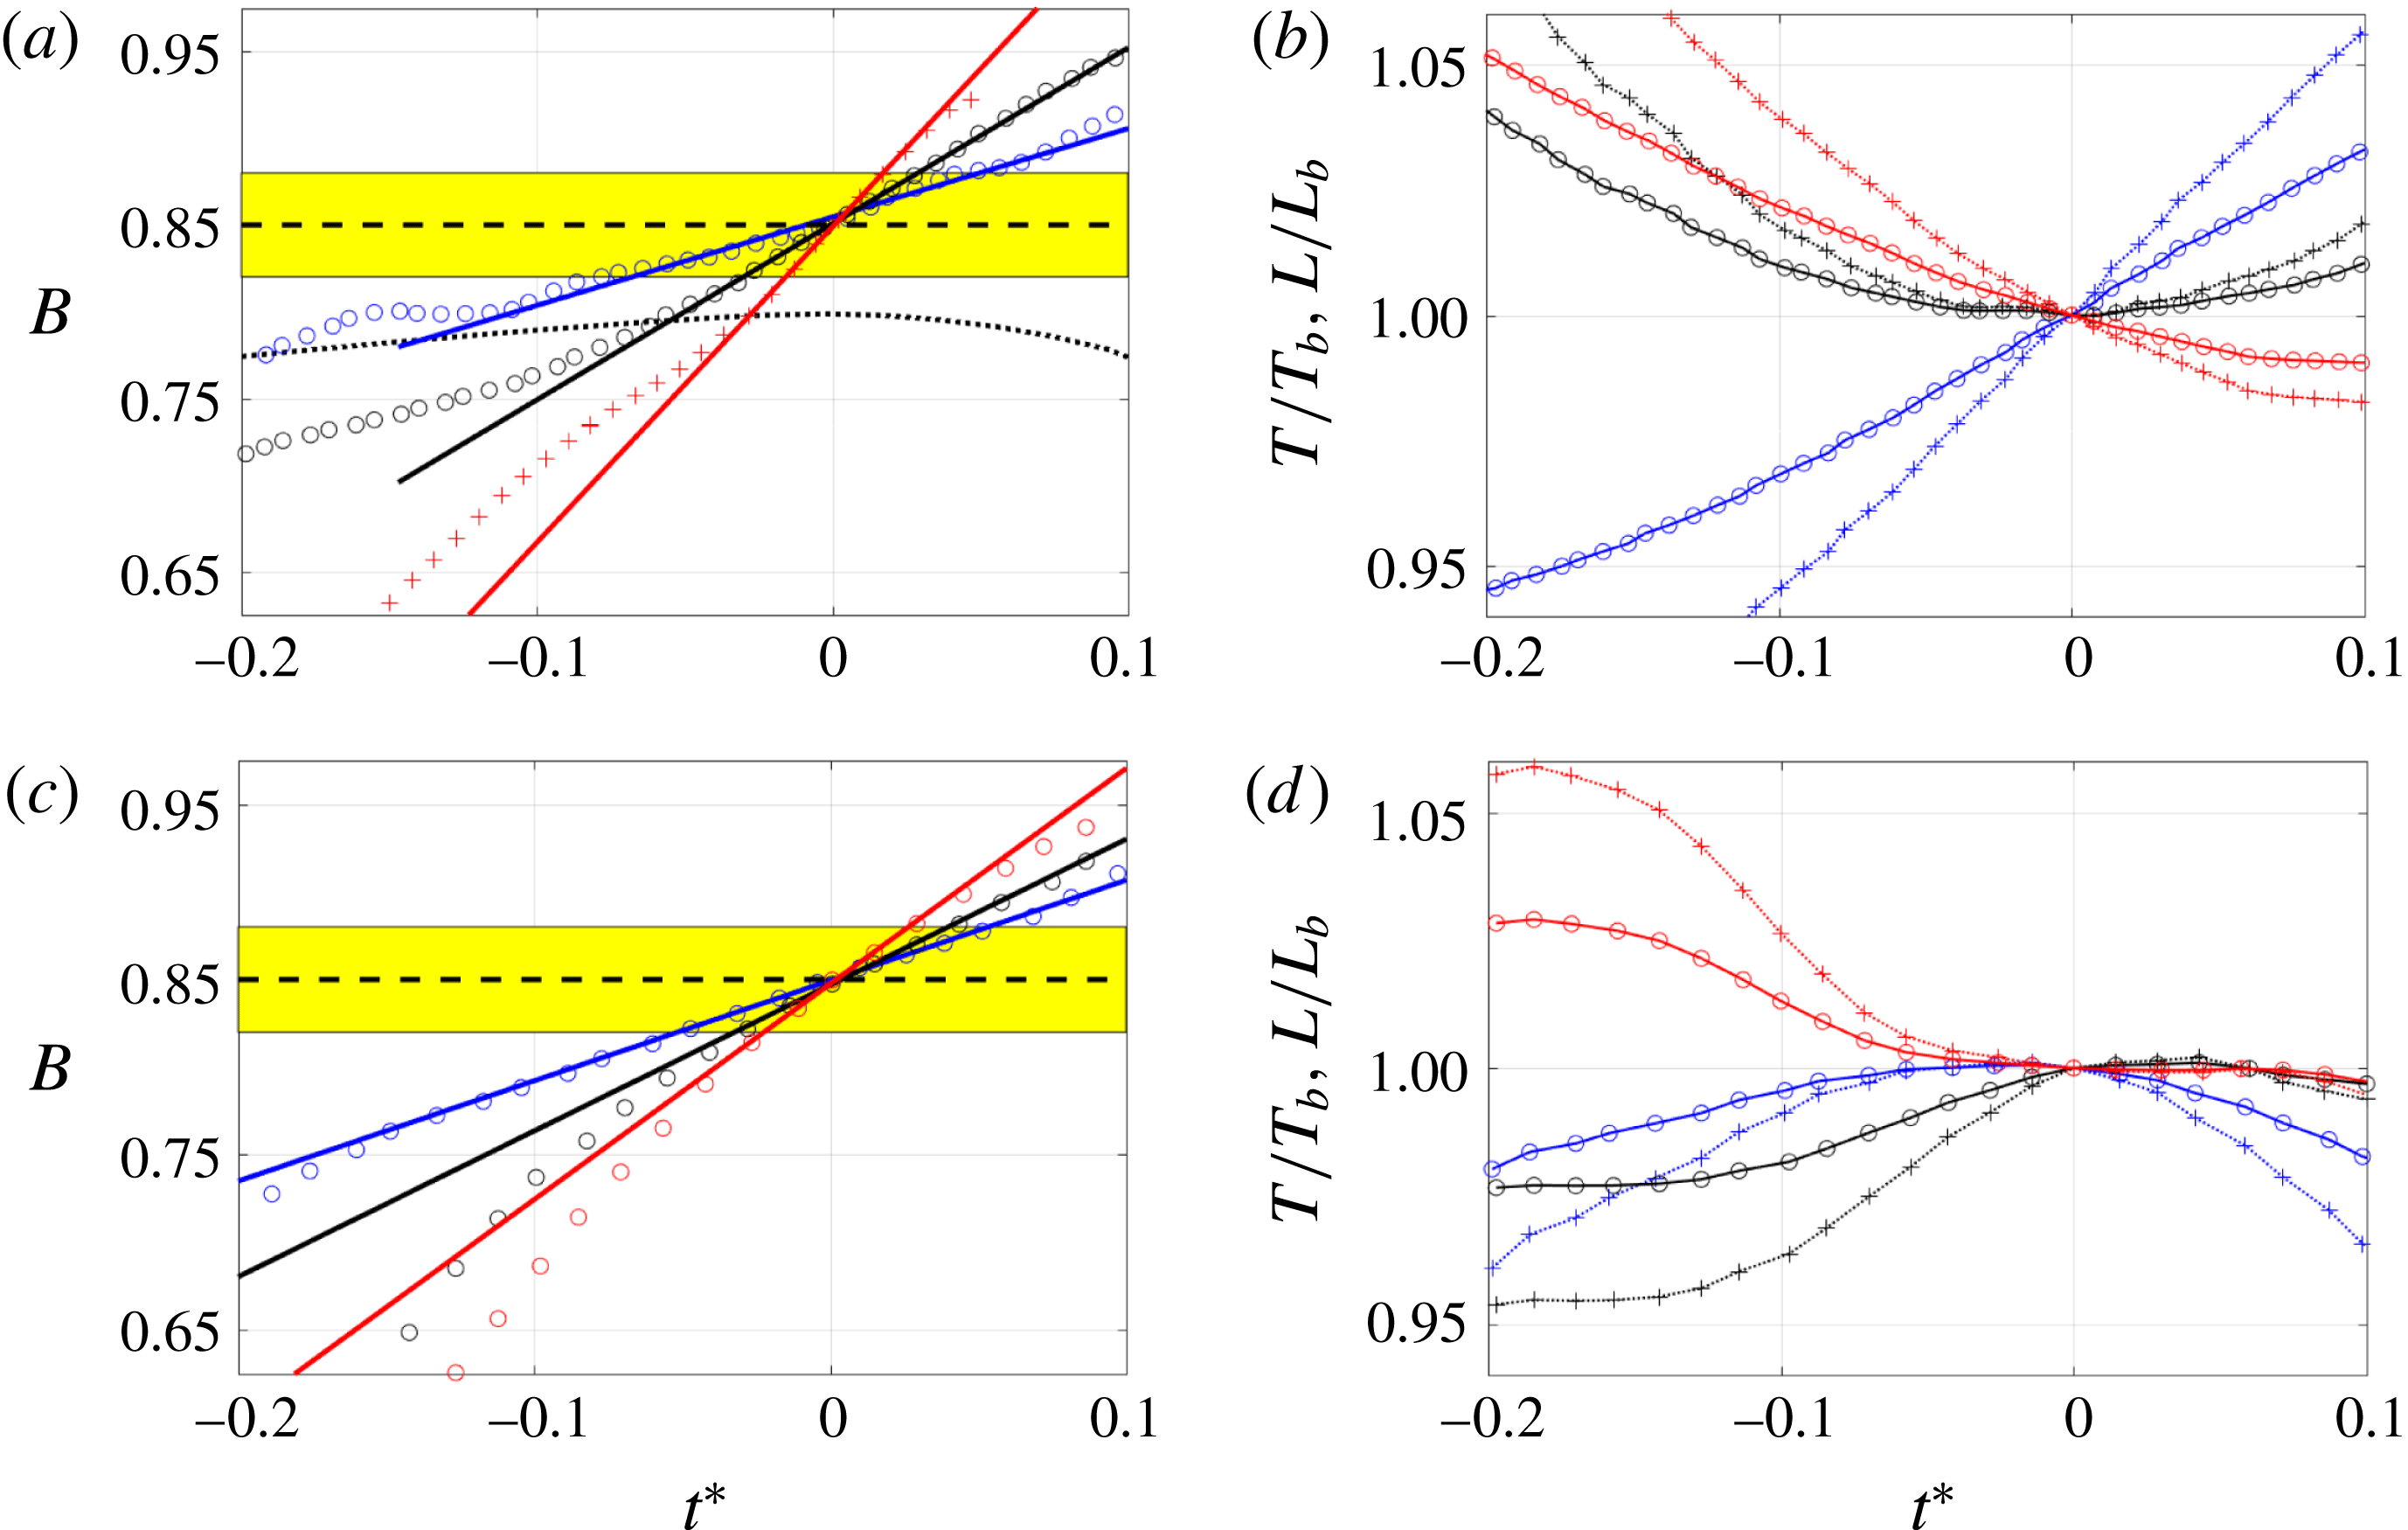
Figure 4(a,c) presents the temporal variation of
 $B$
for a number of breaking events (with various breaking strengths) due to dispersive focusing and modulational instability, together with a highly nonlinear non-breaking case A2 which has a global steepness slightly smaller than the weakest breaking focused packet A3 (see table 1). For breaking cases, a linear fit in the interval
 $|B-B_{th}|<\unicode[STIX]{x1D6FC}$
(
 $\unicode[STIX]{x1D6FC}=0.03$
in figure 4), shown by the yellow boxes, is also presented. The sensitivity of the results to the choice of
 $\unicode[STIX]{x1D6FC}$
will be examined below. The slope of each such fitted line, hereafter referred to as
 $\text{d}B/\text{d}t|_{B_{th}}$
, will be used to parameterize the breaking strength parameter
 $b$
.
The temporal variation of (a,c)
 $B$
and (b,d) (dotted lines with markers) the local wavelength
 $L$
and (solid lines with markers) the local wave period
 $T$
, normalized by their corresponding values at
 $B=B_{th}$
, for (a,b) various focused packets and (c,d) three successive breaking events in modulated wave train M2. In (a), the dotted line represents the highly nonlinear non-breaking case A2. In (a,c), the solid lines show the linear fit in the interval
 $|B-B_{th}|<0.03$
shown by the yellow boxes. Here,
 $L$
is defined by the two successive zero crossing points around the crest maximum (figure 6) and
 $T$
is obtained by using the linear dispersion relation (appendix A).

To construct a non-dimensional parameter, we also need to identify an appropriate time scale, for which we choose the local period,
 $T_{b}$
, of the carrier wave at
 $B=B_{th}$
, obtained by using the linear dispersion relation and the local wavelength
 $L_{b}$
defined based on the two successive zero up- and zero down-crossing points around the crest maximum (see figure 6). Figure 4(b,d) shows that estimates of
 $L$
and
 $T$
constructed in this manner have a small variation as the crest approaches breaking onset. Here,
 $L_{b}$
and
 $T_{b}$
refer to the associated values of
 $L$
and
 $T$
at
 $B=B_{th}$
respectively.
Variation in the breaking strength parameter
 $b$
with the new parameter
 $\unicode[STIX]{x1D6E4}=T_{b}\,\text{d}B/\text{d}t|_{B_{th}}$
which represents the normalized rate of change of
 $B$
as it transitions through the breaking onset. The dashed line indicates a fitted curve to the numerical data. The red line segments represent sensitivity to the choice of
 $\unicode[STIX]{x1D6FC}$
in the estimation of
 $\text{d}B/\text{d}t$
obtained by linear curve fitting in the interval
 $|B-B_{th}|<\unicode[STIX]{x1D6FC}$
.

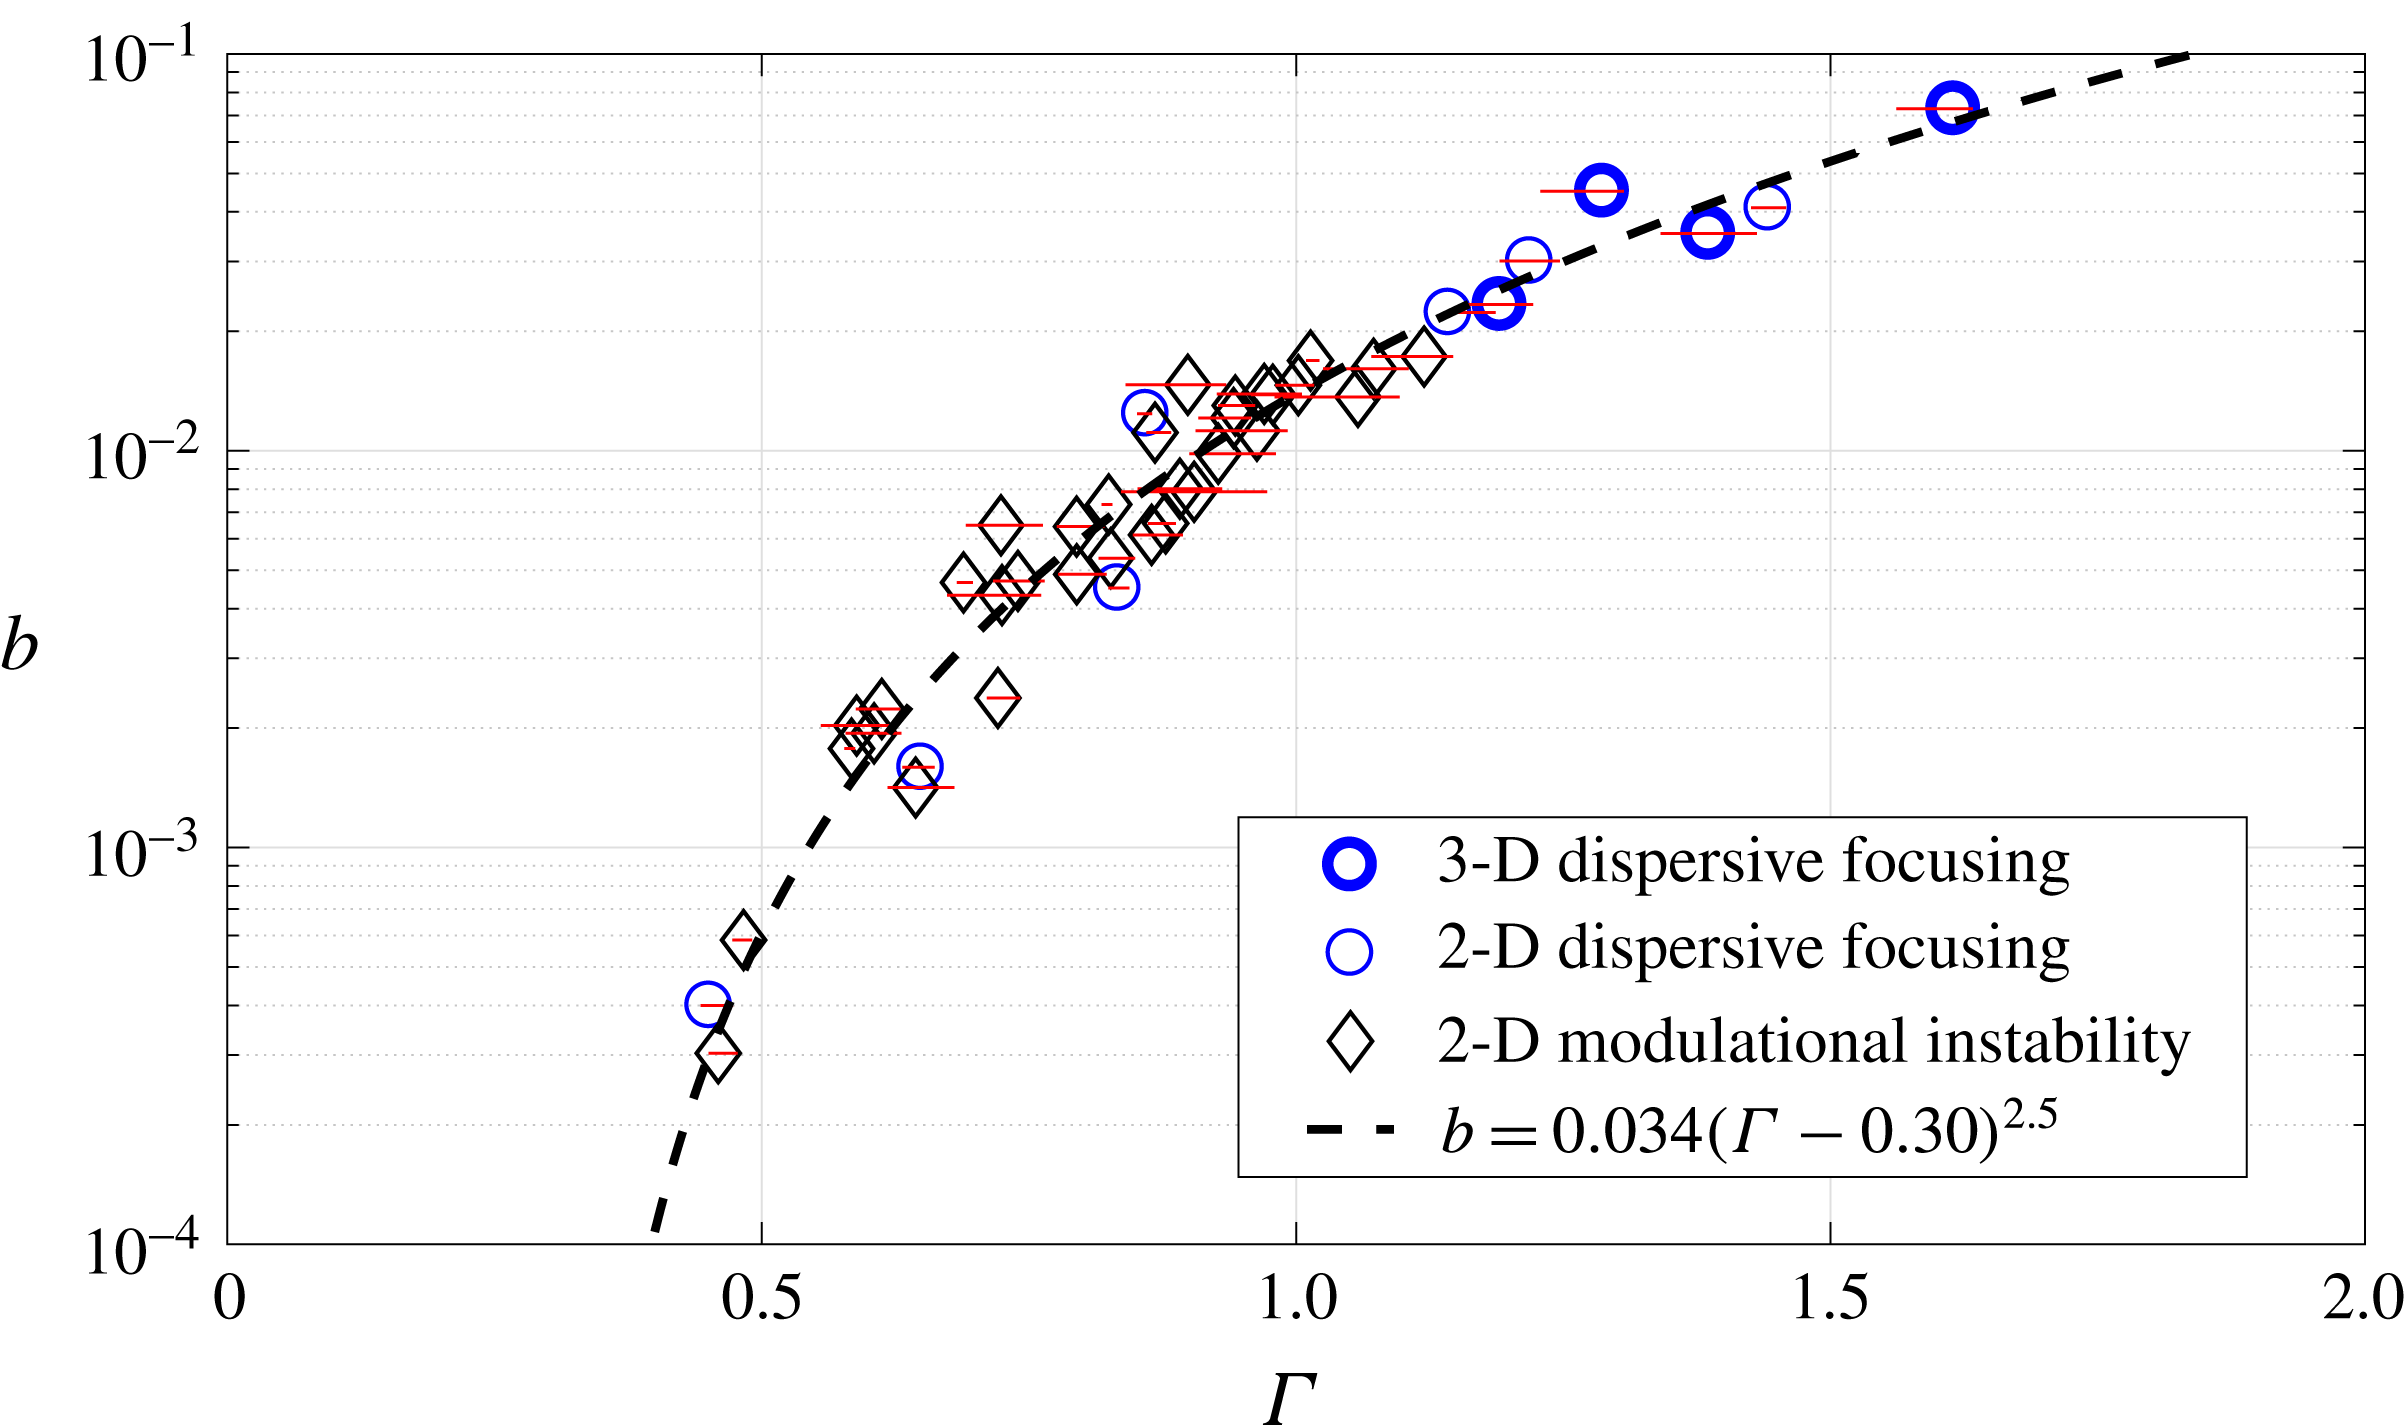
Figure 5 shows the variation of the breaking strength parameter
 $b$
with the new parameter
 $\unicode[STIX]{x1D6E4}=T_{b}\,\text{d}B/\text{d}t|_{B_{th}}$
for all simulated cases. Our methodology to calculate the breaking strength parameter
 $b$
is similar to that used in Derakhti & Kirby (Reference Derakhti and Kirby2016), with a modification explained in appendix A. The reader is referred to Derakhti & Kirby (Reference Derakhti and Kirby2014a
,Reference Derakhti and Kirby
b
, Reference Derakhti and Kirby2016) for the detailed examination of the model prediction of the total energy dissipation compared with corresponding measured data, as well as the sensitivity of the simulation results with respect to the selected grid resolution. In summary, we found that model estimates of the loss of total wave energy due to wave breaking are typically within 10 % of observed levels, after correcting for the change in the downstream group velocity following breaking (Derakhti & Kirby Reference Derakhti and Kirby2016). As a result, the uncertainty in the predicted
 $b$
values is expected to be less than 10 % for the cases considered here.
For each case, the horizontal red line segment in figure 5 shows the variation of
 $\unicode[STIX]{x1D6E4}$
with respect to the selected interval
 $|B-B_{th}|<\unicode[STIX]{x1D6FC}$
(with
 $0.02\leqslant \unicode[STIX]{x1D6FC}\leqslant 0.05$
) to perform the linear fit to obtain
 $\text{d}B/\text{d}t|_{B_{th}}$
, and the marker represents the associated averaged value of
 $\unicode[STIX]{x1D6E4}$
. The results show that the rate of change of
 $B$
following the crest tip as it transitions through the breaking onset, and thus the parameter
 $\unicode[STIX]{x1D6E4}$
, are not sensitive to a specific choice of
 $\unicode[STIX]{x1D6FC}$
for
 $\unicode[STIX]{x1D6FC}\leqslant 0.05$
. Finally, the results show that
 $\unicode[STIX]{x1D6E4}$
can successfully predict the breaking strength parameter
 $b$
. Assuming a formulation with the form
 $b\sim a_{1}(\unicode[STIX]{x1D6E4}-a_{2})^{a_{3}}$
and using the least-square curve fitting technique, we obtain
 $$\begin{eqnarray}b=0.034(\unicode[STIX]{x1D6E4}-0.30)^{2.5}.\end{eqnarray}$$
4 Discussion and conclusions
The results shown in figure 5 establish that the strength of individual breaking events in an irregular wave train, as well as the onset of breaking, can be estimated from properties of the wave crest as it approaches breaking. This is the centrepiece figure of this paper, and shows a systematic collapse of the proposed breaking strength predictor
 $\unicode[STIX]{x1D6E4}$
for a diverse range of representative 2-D water wave focused packets and modulated wave trains in deep and intermediate depth water, as well as several cases of 3-D dispersive focusing packets.
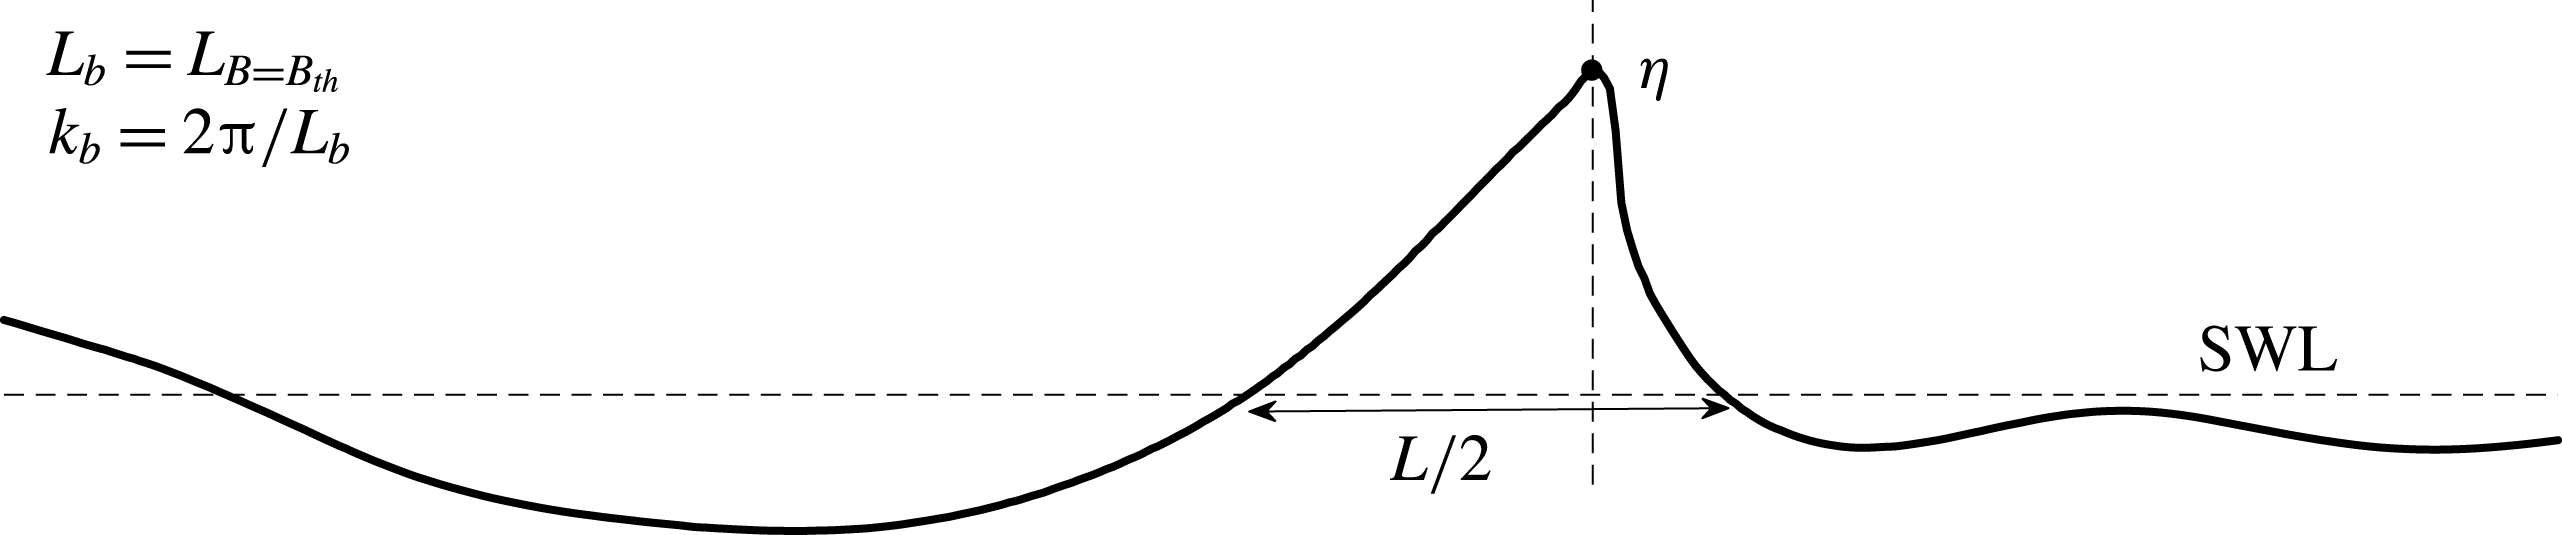
Definitions of the local wave parameters. Here,
 $L$
is the local wavelength,
 $L_{b}$
is the associated value of
 $L$
at breaking onset, at which
 $B=B_{th}=0.85$
, and
 $k_{b}=2\unicode[STIX]{x03C0}/L_{b}$
is the local wavenumber at breaking onset. SWL stands for the still water level.

A significant finding is that the results in figure 5 do not show a pronounced difference between values of
 $b$
obtained for focused packets or modulational events. This result contrasts with previous discussions of the two cases (e.g. Romero et al.
Reference Romero, Melville and Kleiss2012, figure 1), where reported
 $b$
values for modulational cases appear to be significantly smaller than values for focused packet breaking events. This discrepancy results from different choices of averaging procedures between investigators in the analysis of data for wave packets (usually of the order of the local carrier wave period
 $T_{b}$
) and modulated wave trains (usually of the order of the wave group period
 $T_{g}$
); in our modulated wave trains,
 $T_{g}/T_{b}\approx 12$
. Further, we found that the successive breaking events in our modulated wave trains (figure 2) have considerably different breaking strengths, or
 $b$
values. The
 $b$
values for the modulational cases in figure 5 represent
 $b$
for each successive breaking event, as opposed to an average over multiple events within a group (e.g. Banner & Peirson Reference Banner and Peirson2007; Allis Reference Allis2013). For example, we find that
 $b$
varies in the range
 $0.3\times 10^{-3}{-}17.3\times 10^{-3}$
for the case M2, with an ensemble value of
 ${\sim}6\times 10^{-3}$
. A recent comparison of this aspect of the
 $b$
methodology is shown in Derakhti & Kirby (Reference Derakhti and Kirby2016, figure 14).
Based on these findings, we conclude that there is no significant difference between the mechanics of breaking events in focused and modulated wave trains, in contrast to previous discussions based on inconsistent methods for estimating
 $b$
. This conclusion is strongly supported by the different sets of published
 $b$
measurements. These show that the dynamic range of reported
 $b$
values, from weak to strong breaking, is very similar for focused and modulation-induced breaking cases within each data set, based on the
 $b$
estimation methodology utilized.
The success of the parameterization for predicting breaking strength found here would make it possible to better describe breaking events in codes based on potential flow theory, such as high-order spectral (HOS) codes, where breaking is not predicted by the model itself (see Ducrozet, Bonnefoy & Perignon Reference Ducrozet, Bonnefoy and Perignon2017, for a recent review of the HOS approach). The development of criteria for the onset and strength of breaking in such models has long been a subject for investigation. Recently, Seiffert, Ducrozet & Bonnefoy (Reference Seiffert, Ducrozet and Bonnefoy2017) have investigated the use of the parameter
 $B$
as a breaking onset criterion in the HOS approach, while Seiffert & Ducrozet (Reference Seiffert and Ducrozet2018) have discussed the specification of an eddy viscosity model after the onset of breaking is identified. It is our belief that the specification of such a dissipation model should be based on the parameterization of the total dissipation in terms of the rate of change of
 $B$
developed here, which would provide a strong link between the present work and operational wave modelling.
The universality of the
 $B$
parameter and its rate of change as robust indicators of wave breaking onset and strength clearly warrant further study. We close by reiterating that the present work provides a first indication of a direct link between the local properties of a wave crest as it transitions through an apparently generic breaking threshold and the resultant overall energy dissipation resulting from the breaking event. The results are underpinned by fundamental energy flux considerations as proposed in Barthelemy et al. (Reference Barthelemy, Banner, Peirson, Fedele, Allis and Dias2018).
Acknowledgements
This work was supported by the National Science Foundation, Physical Oceanography Program grants OCE-1435147, OCE-1756040 and OCE-1756355, and through the use of computational resources provided by Information Technologies at the University of Delaware. M.B. also gratefully acknowledges support from the Australian Research Council for his breaking waves research. The LES/VOF code is based on the model code TRUCHAS, provided by the Los Alamos National Laboratory, Department of Energy.
Appendix A. Determination of the breaking strength parameter
$b$

By rearranging (1.1), the breaking strength parameter
 $b$
is written as
 $$\begin{eqnarray}b=\frac{g\tilde{\unicode[STIX]{x1D716}}}{\unicode[STIX]{x1D70C}c_{b}^{5}\unicode[STIX]{x1D70F}l},\end{eqnarray}$$
where
 $\tilde{\unicode[STIX]{x1D716}}$
is the total wave energy dissipation due to wave breaking,
 $\unicode[STIX]{x1D70F}\sim O(T_{b})$
is the averaging period and is usually of the order of the active breaking period, and
 $l$
is the mean length of the breaking crest during the active breaking period,
 $0<t-t_{b}<\unicode[STIX]{x1D70F}$
. Following Tian, Perlin & Choi (Reference Tian, Perlin and Choi2008) and Derakhti & Kirby (Reference Derakhti and Kirby2016), we estimate the local wavenumber at breaking onset,
 $k_{b}$
, defined based on the two successive zero up- and zero down-crossing points around the crest maximum, as shown in figure 6. Then, the linear dispersion relation is used to estimate the breaking wave phase speed and period as
 $c_{b}=(g/k_{b}\tanh k_{b}h)^{1/2}$
and
 $T_{b}=2\unicode[STIX]{x03C0}/k_{b}c_{b}$
respectively.
As described by Derakhti & Kirby (Reference Derakhti and Kirby2014a
, § 4.3), the dissipation rate during active breaking has a strong spatio-temporal variation, and thus
 $\unicode[STIX]{x1D716}=\tilde{\unicode[STIX]{x1D716}}/\unicode[STIX]{x1D70F}l$
may be interpreted as an averaged dissipation rate in the interval
 $0<t-t_{b}<\unicode[STIX]{x1D70F}$
. Following Derakhti & Kirby (Reference Derakhti and Kirby2014a
, Reference Derakhti and Kirby2016), we set
 $\unicode[STIX]{x1D70F}=0.75T_{b}$
.
Derakhti & Kirby (Reference Derakhti and Kirby2016) describe a methodology for computing
 $\tilde{\unicode[STIX]{x1D716}}$
in focused wave packet experiments that depends on the spatial isolation of breaking events and on the fact that the domain is essentially quiescent before and after passage of the wave train. For multiple-breaking cases, and particularly for the modulational instability cases considered here, the spatial extent of breaking events may overlap in time, rendering the integral-over-all-time approach described by Derakhti & Kirby (Reference Derakhti and Kirby2016) inapplicable. A modification to allow for localization of the total energy loss estimate in both space and time is described here. Starting from a local equation for the mechanical energy
 $e(x,y,z,t)$
and energy flux
 $\boldsymbol{f}=\boldsymbol{u}(p+e)$
per unit volume,
 $$\begin{eqnarray}e_{,t}+\unicode[STIX]{x1D735}\boldsymbol{\cdot }\boldsymbol{f}=\unicode[STIX]{x1D716}^{\prime },\end{eqnarray}$$
where
 $\unicode[STIX]{x1D716}^{\prime }$
represents dissipation/unit volume, we consider the breaking event to be isolated within a region
 $x_{1}\leqslant x\leqslant x_{2}$
,
 $y_{1}\leqslant y\leqslant y_{2}$
,
 $t_{1}\leqslant t\leqslant t_{2}$
. Integration of (A 2) over depth and then over
 $x$
,
 $y$
and
 $t$
gives
 $$\begin{eqnarray}\displaystyle & & \displaystyle \left[\int _{x_{1}}^{x_{2}}\int _{y_{1}}^{y_{2}}\int _{-h}^{\unicode[STIX]{x1D702}}e\,\text{d}z\,\text{d}y\,\text{d}x\right]_{t_{1}}^{t_{2}}+\left[\int _{y_{1}}^{y_{2}}\int _{t_{1}}^{t_{2}}\int _{-h}^{\unicode[STIX]{x1D702}}f_{x}\,\text{d}z\,\text{d}t\,\text{d}y\right]_{x_{1}}^{x_{2}}+\left[\int _{x_{1}}^{x_{2}}\int _{t_{1}}^{t_{2}}\int _{-h}^{\unicode[STIX]{x1D702}}f_{y}\,\text{d}z\,\text{d}t\,\text{d}x\right]_{y_{1}}^{y_{2}}\nonumber\\ \displaystyle & & \displaystyle \quad =\int _{x_{1}}^{x_{2}}\int _{y_{1}}^{y_{2}}\int _{t_{1}}^{t_{2}}\int _{-h}^{\unicode[STIX]{x1D702}}\unicode[STIX]{x1D716}^{\prime }\,\text{d}t\,\text{d}z\,\text{d}y\,\text{d}x=\tilde{\unicode[STIX]{x1D716}},\end{eqnarray}$$
where
 $t_{1}\leqslant t_{b}$
and
 $\unicode[STIX]{x1D70F}\ll t_{2}-t_{b}$
, where
 $t_{b}$
is the time of breaking onset as defined in § 2.