







1. Introduction
This paper focuses on the effect on wall turbulence of surface texture, which alters the flow and modifies the drag compared with a smooth surface. The most common example of surface texture is roughness (Colebrook & White Reference Colebrook and White1937; Schlichting Reference Schlichting1937; Jiménez Reference Jiménez2004; Chung et al. Reference Chung, Hutchins, Schultz and Flack2021), which generally increases drag, but there are also textures such as riblets (Walsh & Lindemann Reference Walsh and Lindemann1984), superhydrophobic surfaces (Rothstein Reference Rothstein2010) and anisotropic permeable substrates (Abderrahaman-Elena & García-Mayoral Reference Abderrahaman-Elena and García-Mayoral2017; Gómez-de-Segura & García-Mayoral Reference Gómez-de-Segura and García-Mayoral2019) that can reduce drag.
According to the classical theory of wall turbulence, for small textures the only effect of the surface on the outer flow is a uniform shift in the mean velocity profile,  $\Delta U^+$, compared with a smooth surface (Clauser Reference Clauser1956; Spalart & McLean Reference Spalart and McLean2011; García-Mayoral, Gómez-de-Segura & Fairhall Reference García-Mayoral, Gómez-de-Segura and Fairhall2019). The superscript ‘
 $+$’ indicates scaling in viscous units, i.e. normalisation by the the kinematic viscosity
 $\nu$ and friction velocity
 $u_{\tau } = \sqrt {\tau _w}$, where
 $\tau _w$ is the tangential stress at the wall. Throughout the paper, we consider upward shifts of the velocity profile, which occur for drag-reducing surfaces, as positive,
 $\Delta U^+ > 0$, and downward shifts of the velocity profile, which occur for drag-increasing surfaces, as negative,
 $\Delta U^+ < 0$, so our
 $\Delta U^+$ is the opposite of the usual ‘roughness function’ used for drag-increasing textures. The free-stream velocity,
 $U_{\delta }^+$, is then given by
 \begin{equation} U_{\delta}^+= \left( \frac{2}{c_f} \right)^{1/2} = \frac{1}{\kappa}\log \delta^++ B + \Delta U^+, \end{equation}
where  $c_f$ is the skin friction coefficient based on
 $U_{\delta }$,
 $\delta$ is the flow thickness and the von Kármán constant,
 $\kappa$, and the parameter
 $B$, which includes the smooth-wall logarithmic intercept and the wake function, remain unchanged. When considering boundary layers,
 $\delta$ is the boundary-layer thickness. For channels,
 $\delta$ is the channel half-height and we take the centreline velocity as
 $U_{\delta }$, to allow for direct comparison with boundary layers (García-Mayoral & Jiménez Reference García-Mayoral and Jiménez2011; García-Mayoral et al. Reference García-Mayoral, Gómez-de-Segura and Fairhall2019). Following (1.1), the relative change in drag compared with a smooth-wall flow at the same
 $Re_{\tau }$ is
 \begin{equation} \frac{\Delta c_f}{c_{f0}} = \frac{1}{(1+\Delta U^+{/}U_{\delta 0}^+)^2} - 1, \end{equation}
where the subscript ‘0’ denotes reference smooth-wall values and  $\Delta c_f = c_f - c_{f0}$.
In the limit where the size of the texture elements,  $L$, is vanishingly small compared with any length scales in the overlying flow, the background turbulence does not perceive the detail of each individual texture element, and only experiences the surface in an averaged sense. Such surfaces are well suited for homogenisation and can be characterised through uniform effective boundary conditions (Lāacis & Bagheri Reference Lāacis and Bagheri2017; Bottaro Reference Bottaro2019). Modelling textured surfaces by homogeneous boundary conditions is convenient and computationally cheap, since high resolution is not required near the surface to resolve the flow around the texture elements. However, homogenisation relies on a small-parameter expansion on the ratio of
 $L$ to the characteristic length scales in the flow, so it formally ceases to apply when
 $L$ becomes comparable to the size of the smallest eddies in the flow, which taking for the latter the diameter of quasi-streamwise vortices would be
 $L^+ \sim 10$. This limit would leave out most practical applications. Here, we aim to investigate the effect on turbulence of textures beyond this vanishingly small limit, i.e. once homogenisation breaks down. As a first step, in this paper, we focus on the particularly simple case of surface textures made of alternating slip/no-slip regions, which is a common model for superhydrophobic surfaces.
In this case, the resulting homogenised boundary conditions are  $v = 0$ in the wall-normal direction and
 $u = \ell _x (\partial u/\partial y)$ and
 $w = \ell _z (\partial w/\partial y)$ in the wall-parallel directions, where
 $\ell _x$ and
 $\ell _z$ are the streamwise and spanwise slip lengths (Philip Reference Philip1972). Gómez-de-Segura & García-Mayoral (Reference Gómez-de-Segura and García-Mayoral2020) and Ibrahim et al. (Reference Ibrahim, Gómez-de-Segura, Chung and García-Mayoral2021) showed that the effect of these homogenised boundary conditions is a mere offset of the origins perceived by different flow components, while turbulence remains essentially the same as over smooth walls. A streamwise slip shifts the mean velocity profile by the slip velocity, reducing the drag, while a spanwise slip allows quasi-streamwise vortices, an essential part of the near-wall turbulent cycle, to move closer to the surface (Luchini Reference Luchini1996; Min & Kim Reference Min and Kim2004), increasing the drag. Fairhall & García-Mayoral (Reference Fairhall and García-Mayoral2018) showed that for surfaces modelled using slip lengths,
 $\Delta U^+$ equals the offset of the virtual origin perceived by mean flow,
 $\ell _x^+$, and that perceived by turbulence,
 $\ell _T^+$. Gómez-de-Segura & García-Mayoral (Reference Gómez-de-Segura and García-Mayoral2020) and Ibrahim et al. (Reference Ibrahim, Gómez-de-Segura, Chung and García-Mayoral2021) showed that
 $\ell _T^+$ is governed by the interplay between the spanwise slip,
 $\ell _z^+$, and the transpiration. For surfaces with no transpiration, such as the cited slip/no-slip patterns, the virtual origin of turbulence only depends on the spanwise slip length, and Fairhall & García-Mayoral (Reference Fairhall and García-Mayoral2018) proposed
 \begin{equation} \ell_T^+\approx \frac{\ell_z^+}{1+ \ell_z^+{/}4}, \end{equation}
from an empirical fit of the results of Busse & Sandham (Reference Busse and Sandham2012).
Seo & Mani (Reference Seo and Mani2016) investigated the limits of slip-length models for slip/no-slip textures, and showed that for texture sizes  $L^+ \gtrsim 10$, the instantaneous correlation between velocity and shear at the surface was lost, which would appear to set the upper limit for the applicability of a slip-length model. Fairhall & García-Mayoral (Reference Fairhall and García-Mayoral2018) later investigated the correlation between surface velocity and shear using a spectral approach to discriminate between the slip lengths experienced by different length scales in the overlying flow. They found that even scales much larger than the texture size displayed an apparent loss of correlation. Fairhall & García-Mayoral (Reference Fairhall and García-Mayoral2018) argued that this observed loss of correlation of the slip length was due to the intensity of the texture-coherent flow, rather than the texture size, becoming significant. We note that Jelly, Jung & Zaki (Reference Jelly, Jung and Zaki2014) and Türk et al. (Reference Türk, Daschiel, Stroh, Hasegawa and Frohnapfel2014) reported that the texture-coherent flow becomes significant compared with the background turbulence for
 $L^+ \gtrsim 100$, while the effect discussed by Fairhall & García-Mayoral (Reference Fairhall and García-Mayoral2018) sets in for
 $L^+ \gtrsim 10$, and is caused by the discrete slip/no-slip pattern induced by the texture being broad-band in wavelength space, scattering the texture-coherent signal across the full range of length scales. In a follow-up work, Fairhall, Abderrahaman-Elena & García-Mayoral (Reference Fairhall, Abderrahaman-Elena and García-Mayoral2019) used the amplitude-modulated flow decomposition proposed by Abderrahaman-Elena, Fairhall & García-Mayoral (Reference Abderrahaman-Elena, Fairhall and García-Mayoral2019) to filter out the texture-coherent flow, and showed that the leftover background turbulence still exhibits a linear correlation between velocity and shear, so that a slip length can be meaningfully defined.
However, when replacing the texture by the homogeneous slip lengths perceived by the overlying turbulence, results differed for  $L^+ \gtrsim 25$, as the turbulent variables become no longer smooth-wall-like. Fairhall et al. (Reference Fairhall, Abderrahaman-Elena and García-Mayoral2019) suggested that the breakdown of the homogeneous slip-length model is not caused by the breakdown of the effective boundary conditions, but by a different mechanism. They showed that the difference in
 $\Delta U^+$ between the flows over their textures and the flows with equivalent homogeneous boundary conditions arose from modifications to the Reynolds stress above rather than directly at the surface. For the simple case of slip/no-slip textures, this is particularly clear because the zero-transpiration boundary condition (
 $v = 0$) yields zero Reynolds stress,
 $uv$, at the surface. For the textures of Fairhall et al. (Reference Fairhall, Abderrahaman-Elena and García-Mayoral2019), the differences in
 $uv$ occurred at heights
 $5 \lesssim y^+ \lesssim 25$ above the surface. Fairhall et al. (Reference Fairhall, Abderrahaman-Elena and García-Mayoral2019) argued that the extra Reynolds stress over textures was caused by the nonlinear interactions between the texture-coherent flow and the background turbulence, which modify the dynamics of the latter and result in degraded drag. We note that although these observations were made in the context of drag-reducing, zero-transpiration textures, we have also observed a similar behaviour for drag-increasing surfaces such as roughness (Abderrahaman-Elena et al. Reference Abderrahaman-Elena, Fairhall and García-Mayoral2019), small-size dense canopies (Sharma & García-Mayoral Reference Sharma and García-Mayoral2020b) and porous substrates (Hao & García-Mayoral Reference Hao and García-Mayoral2024), which suggests that this may be a common mechanism across a wide variety of textures. Abderrahaman-Elena et al. (Reference Abderrahaman-Elena, Fairhall and García-Mayoral2019) argued that a virtual-origin framework alone could only account for roughness functions up to
 $-\Delta U^+ \approx 2$, spanning the early stages of the transitionally rough regime. The same conclusion was reached in Habibi Khorasani et al. (Reference Habibi Khorasani, Lācis, Pasche, Rosti and Bagheri2022) using homogenised boundary conditions.
In this paper, we aim to identify and characterise the physical mechanism that causes the flow to depart from its dynamics under equivalent boundary conditions in the presence of actual, resolved textures for  $L^+ \gtrsim 25$. In particular, we assess if the effect of the texture can be captured by replacing it by its corresponding homogeneous boundary conditions plus, critically, the advective terms that arise from the existence of a texture-coherent flow and its interaction with the background turbulence. Compared with Navier–Stokes, the momentum equations for the background turbulence include then additional, ‘forcing’ cross-advective terms. We also explore preliminarily if this can be used for predictive modelling using a priori surrogates for the texture-coherent flow.
The paper is organised as follows. The decomposition of the flow field into background-turbulence and texture-coherent components, the resulting governing equations for the mean flow and background turbulence and the cross-nonlinear terms that we introduce in our texture-less model are presented in § 2. The numerical methods are outlined in § 3. The results from the model with forcing are presented, analysed and compared with those of texture-resolved and homogeneous-slip simulations in § 4. Conclusions are summarised in § 5.
2. Flow decomposition and governing equations
2.1. Amplitude-modulated triple decomposition
Conventional triple decomposition is often used to obtain a texture-coherent and a texture-incoherent flow component. It decomposes the flow into a space–time-averaged mean flow, a time-averaged component which is phase-locked to the texture, and the remaining time-space fluctuations. Taking for instance the streamwise component of the velocity, we have
 \begin{align} u(x,y,z,t) & = U(y) + u'(x,y,z,t)\nonumber\\ & = U(y) + \tilde{u}_u(\tilde{x},y,\tilde{z}) + u_T(x,y,z,t), \end{align}
where  $x$,
 $y$ and
 $z$ denote the streamwise, wall-normal and spanwise directions, respectively,
 $U(y)$ is the mean velocity profile and
 $u'(x,y,z,t)$ is the full fluctuating field. The latter is further decomposed into a texture-coherent component, or dispersive flow,
 $\tilde {u}_u(\tilde {x},y,\tilde {z})$, where
 $\tilde {x}$ and
 $\tilde {z}$ refer to the local coordinates within the texture period, and the remaining incoherent, background turbulent fluctuations
 $u_T (x,y,z,t)$. The texture-coherent component can be viewed as being driven by the existence of a large-scale (mean) streamwise flow, which we denote by the subscript in
 $\tilde {u}_u$. The decomposition of (2.1) has been commonly used to separate a texture-coherent contribution from the texture-incoherent, background turbulence (Cheng & Castro Reference Cheng and Castro2002; Coceal et al. Reference Coceal, Dobre, Thomas and Belcher2007; Nikora et al. Reference Nikora, McEwan, McLean, Coleman, Pokrajac and Walters2007).
Abderrahaman-Elena et al. (Reference Abderrahaman-Elena, Fairhall and García-Mayoral2019), however, showed that this conventional triple decomposition does not produce a  $u_T$ free of coherence with the surface texture. They argued that the texture-coherent flow occurs in response to the background flow, and for any given texture element it would then be driven by the full local signal of the overlying flow, which might be more or less intense than the mean
 $U(y)$. The texture-coherent flow would thus be modulated in intensity by the local background turbulence. In the above (2.1), the texture-coherent streamwise velocity,
 $\tilde {u}_u$, driven by an overlying streamwise velocity, would be modulated by the streamwise background turbulence, giving
 \begin{equation} u(x,y,z,t) \approx U(y)+ u_T(x,y,z,t) + \frac{U(y) + u_T(x,y,z,t) }{U(y)}\tilde{u}_u(\tilde{x},y,\tilde{z}). \end{equation}
In general, however, the overlying flow induces a velocity field around texture elements in all three directions, while itself has also components in all three directions. The spanwise background flow would for instance induce a texture-coherent, spanwise  $\tilde {w}_w$. Therefore, all three texture-coherent velocity components would have contributions induced by all three components of the overlying flow, such that (2.2) would have additional terms for
 $\tilde {u}_w$ and
 $\tilde {u}_v$, the streamwise velocities induced by the background
 $w_T$ and
 $v_T$. To illustrate this idea, figure 1 shows a sketch of the streamwise and spanwise overlying velocities inducing coherent flow. Applied to all velocity components, the amplitude-modulated triple decomposition of Abderrahaman-Elena et al. (Reference Abderrahaman-Elena, Fairhall and García-Mayoral2019) can be written as the product of a matrix and a vector,
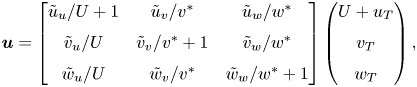 \begin{equation} \boldsymbol{u} = \begin{bmatrix} \tilde{u}_u/U +1 & \tilde{u}_v/v^* & \tilde{u}_w/w^* \\ \tilde{v}_u/U & \tilde{v}_v/v^* + 1 & \tilde{v}_w/w^* \\ \tilde{w}_u/U & \tilde{w}_v/v^* & \tilde{w}_w/w^* + 1 \end{bmatrix} \begin{pmatrix} U+u_T\\ v_T\\ w_T \end{pmatrix}, \end{equation}
where  $w^*$ and
 $v^*$ denote the direction-conditional averages of
 $w$ and
 $v$ over individual roughness elements, thus giving a norm for the intensity of the respective texture-coherent velocities. Abderrahaman-Elena et al. (Reference Abderrahaman-Elena, Fairhall and García-Mayoral2019) showed that this modified form of the triple decomposition was more effective at removing the footprint of the texture from
 $\boldsymbol {u}_{\boldsymbol {T}}$.
Sketch of the texture-coherent flow induced by an overlying velocity in the streamwise or spanwise direction. The blue lines represent streamlines of the induced flow.

2.2. Governing equations for the background turbulence in flows over textures
Let us now derive the governing equations for the background-turbulence component, and in particular the terms that account for the nonlinear interaction with the texture-coherent flow. In a texture-resolving direct numerical simulation (DNS), the incompressible flow within the channel is governed by continuity,  $\boldsymbol {\nabla } \boldsymbol {\cdot } \boldsymbol {u} = 0$, and the Navier–Stokes equations,
 \begin{equation} \partial_t \boldsymbol{u} + \boldsymbol{\nabla} \boldsymbol{\cdot} \boldsymbol{u} \boldsymbol{u} ={-}\boldsymbol{\nabla} p + \nu \nabla^2 \boldsymbol{u}, \end{equation}
where  $\boldsymbol {u}$ is the velocity vector with components
 $u$,
 $v$,
 $w$. Using the velocity decompositions introduced in § 2.1, the governing momentum equations for the background turbulence can be derived by subtracting the momentum equation for texture-coherent flow from the triple-decomposed Navier–Stokes equations. We apply this first for the case of conventional triple decomposition, as a simpler example that serves us to illustrate the concept, and then apply it for the case of amplitude-modulated decomposition.
2.2.1. Texture-coherent flow obtained from conventional triple decomposition
Using conventional triple decomposition, the velocity vector can be written as
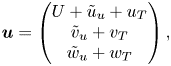 \begin{equation} \boldsymbol{u} = \begin{pmatrix} U+\tilde{u}_u+u_T\\ \tilde{v}_u+v_T\\ \tilde{w}_u+w_T \end{pmatrix}, \end{equation}
and the pressure as  $p = P + \tilde {p} + p_T$, where
 $P$ is the contribution that provides the mean pressure gradient driving the flow. Substituting the triple-decomposed velocities and pressure into the Navier–Stokes equations and taking the temporal and spatial average, we obtain the momentum equation for the mean flow
 $\boldsymbol {U} = (U, 0, 0)$:
 \begin{equation} \boldsymbol{\nabla} \boldsymbol{\cdot} \langle \overline{ \boldsymbol{u}_{\boldsymbol{T}} \boldsymbol{u}_{\boldsymbol{T}} } \rangle + \boldsymbol{\nabla} \boldsymbol{\cdot} \langle \tilde{\boldsymbol{u}}_{\boldsymbol{u}} \tilde{\boldsymbol{u}}_{\boldsymbol{u}} \rangle ={-} \boldsymbol{\nabla} P + \nu \nabla^2 \boldsymbol{U}, \end{equation}
where  $\langle ( {\cdot } ) \rangle$ denotes spatial averaging in the wall-parallel directions and
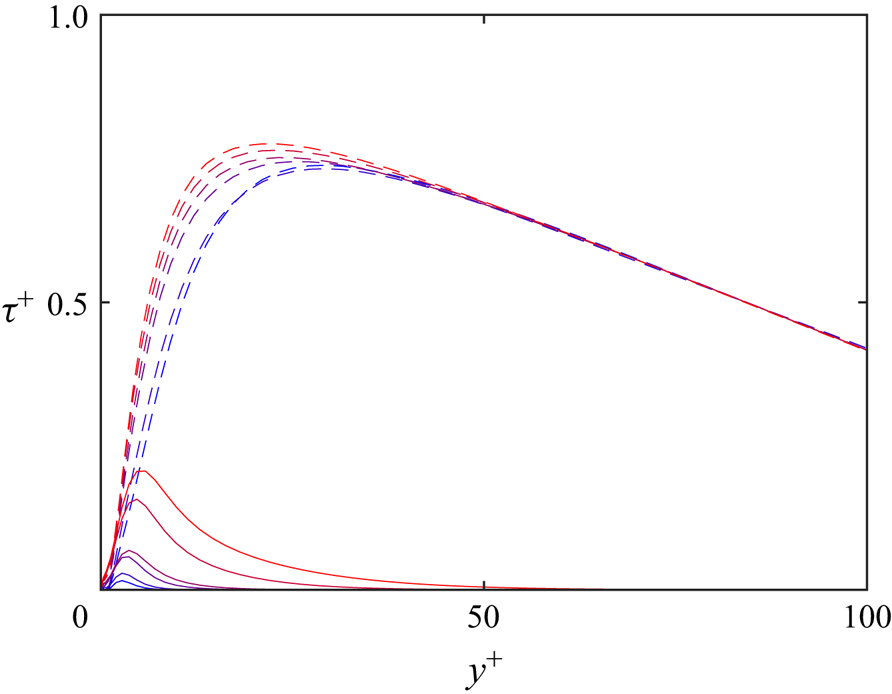
 $\overline {( {\cdot } )}$ denotes temporal averaging. This has the usual form of the mean-flow equation for rough-wall flows, with the Reynolds and the dispersive stress on left-hand hand side. While the dispersive stress can be significant for other textures, for the present slip/no-slip textures it is negligible compared with the Reynolds stress at least for
 $L^+ \lesssim 50$, only becoming relevant for texture sizes
 $L^+ \gtrsim 70$, as shown in figure 2.
Reynolds and dispersive stress for slip/no-slip collocated square posts at  $Re_{\tau } \approx 180$. Blue to red,
 $L^+ \approx 18$, 24, 35, 47, 71 and 94. - - -, total shear Reynolds stress; —, dispersive stress.
The momentum equation for the texture-coherent fluctuation,  $\tilde {\boldsymbol {u}}_{\boldsymbol {u}}$, can be obtained by taking the temporal average of the triple-decomposed Navier–Stokes equations and subtracting the momentum equation for
 $\boldsymbol {U}$, (2.6), which gives
 \begin{equation} \boldsymbol{N}_{\boldsymbol{c}} ={-}\boldsymbol{\nabla} \tilde{p} + \nu \nabla^2 \tilde{\boldsymbol{u}}_{\boldsymbol{u}}, \end{equation}
where
 \begin{equation} \boldsymbol{N}_{\boldsymbol{c}} = \boldsymbol{\nabla} \boldsymbol{\cdot} (\boldsymbol{U} + \tilde{\boldsymbol{u}}_{\boldsymbol{u}}) (\boldsymbol{U} + \tilde{\boldsymbol{u}}_{\boldsymbol{u}}) - \boldsymbol{\nabla} \boldsymbol{\cdot} \langle \tilde{\boldsymbol{u}}_{\boldsymbol{u}} \tilde{\boldsymbol{u}}_{\boldsymbol{u}} \rangle + \boldsymbol{\nabla} \boldsymbol{\cdot} \overline{\boldsymbol{u}_{\boldsymbol{T}} \boldsymbol{u}_{\boldsymbol{T}} } - \boldsymbol{\nabla} \boldsymbol{\cdot} \langle \overline{ \boldsymbol{u}_{\boldsymbol{T}} \boldsymbol{u}_{\boldsymbol{T}} } \rangle . \end{equation}
Given that the background turbulence is homogeneous in the wall-parallel directions and statistically steady in time, we have  $\boldsymbol {\nabla } \boldsymbol {\cdot } \overline { \boldsymbol {u}_{\boldsymbol {T}} \boldsymbol {u}_{\boldsymbol {T}} } - \boldsymbol {\nabla } \boldsymbol {\cdot } \langle \overline { \boldsymbol {u}_{\boldsymbol {T}} \boldsymbol {u}_{\boldsymbol {T}} } \rangle \approx 0$ in the nonlinear term
 $\boldsymbol {N}_{\boldsymbol {c}}$, and the resulting momentum equation for the texture-coherent fluctuation,
 $\tilde {\boldsymbol {u}}_{\boldsymbol {u}}$, simplifies then to
 \begin{equation} \boldsymbol{\nabla} \boldsymbol{\cdot} (\boldsymbol{U} + \tilde{\boldsymbol{u}}_{\boldsymbol{u}}) (\boldsymbol{U} + \tilde{\boldsymbol{u}}_{\boldsymbol{u}}) - \boldsymbol{\nabla} \boldsymbol{\cdot} \langle \tilde{\boldsymbol{u}}_{\boldsymbol{u}} \tilde{\boldsymbol{u}}_{\boldsymbol{u}} \rangle ={-}\boldsymbol{\nabla} \tilde{p} + \nu \nabla^2 \tilde{\boldsymbol{u}}_{\boldsymbol{u}}. \end{equation}
Finally, the momentum equation for the background turbulence can be obtained by subtracting the above momentum equation for  $\tilde {\boldsymbol {u}}_{\boldsymbol {u}}$ from the full triple-decomposed Navier–stokes equation, yielding
 \begin{equation} \partial_t \boldsymbol{u}_{\boldsymbol{b}} + \boldsymbol{\nabla} \boldsymbol{\cdot} \boldsymbol{u}_{\boldsymbol{b}} \boldsymbol{u}_{\boldsymbol{b}} + \boldsymbol{N}_{\boldsymbol{b}} ={-}\boldsymbol{\nabla} p_b + \nu \nabla^2 \boldsymbol{u}_{\boldsymbol{b}}, \end{equation}
where  $\boldsymbol {u}_{\boldsymbol {b}} = \boldsymbol {U} + \boldsymbol {u}_{\boldsymbol {T}}$ includes the mean
 $\boldsymbol {U}$ profile and the background turbulent fluctuations, and is thus the flow we are interested in solving for in our texture-less DNSs, and
 ${p_b}$ is the corresponding background pressure,
 ${p_b} = P + p_T$. The additional nonlinear terms,
 $\boldsymbol {N}_{\boldsymbol {b}}$, are
 \begin{equation} \boldsymbol{N}_{\boldsymbol{b}} = \boldsymbol{\nabla} \boldsymbol{\cdot} \tilde{\boldsymbol{u}}_{\boldsymbol{u}} \boldsymbol{u}_{\boldsymbol{T}} + \boldsymbol{\nabla} \boldsymbol{\cdot} \boldsymbol{u}_{\boldsymbol{T}} \tilde{\boldsymbol{u}}_{\boldsymbol{u}} + \boldsymbol{\nabla} \boldsymbol{\cdot} \langle \tilde{\boldsymbol{u}}_{\boldsymbol{u}} \tilde{\boldsymbol{u}}_{\boldsymbol{u}} \rangle , \end{equation}
where  $\boldsymbol {\nabla } \boldsymbol {\cdot } \tilde {\boldsymbol {u}}_{\boldsymbol {u}} \boldsymbol {u}_{\boldsymbol {T}} + \boldsymbol {\nabla } \boldsymbol {\cdot } \boldsymbol {u}_{\boldsymbol {T}} \tilde {\boldsymbol {u}}_{\boldsymbol {u}}$ are the nonlinear interactions of the background turbulence and the texture-coherent flow and
 $\boldsymbol {\nabla } \boldsymbol {\cdot } \langle \tilde {\boldsymbol {u}}_{\boldsymbol {u}} \tilde {\boldsymbol {u}}_{\boldsymbol {u}} \rangle$ is the dispersive stress, which acts only on the mean flow
 $\boldsymbol {U}$. The presence of surface texture thus modifies the background turbulence through these nonlinear terms.
2.2.2. Texture-coherent flow obtained from amplitude-modulated triple decomposition
Let us now derive the momentum equations for the background turbulence using the amplitude-modulated triple decomposition of (2.3). For the present case of slip/no-slip textures, we make the following simplifications. At the surface, the wall-normal velocity  $v$ is zero throughout, and therefore any flow induced by the background
 $v$ is small, as reported in Fairhall et al. (Reference Fairhall, Abderrahaman-Elena and García-Mayoral2019), so we neglect
 $\tilde {u}_v$,
 $\tilde {v}_v$ and
 $\tilde {w}_v$ in (2.3). Let us, however, note that this
 $v$-induced flow could be important for protruding textures such as pyramids, cones and roughness in general. In addition, we also neglect the flow induced by the background
 $w$, since the latter is weak compared with the background streamwise flow for slip/no-slip textures, as also reported in Fairhall et al. (Reference Fairhall, Abderrahaman-Elena and García-Mayoral2019). The dominant texture-coherent effect is then the flow induced by streamwise velocity
 $U+u_T$, and the modulated triple decomposition simplifies then to
 \begin{align} \boldsymbol{u} &= \left ( \boldsymbol{I} + \begin{bmatrix} \tilde{u}_u/U & 0 & 0\\ \tilde{v}_u/U & 0 & 0\\ \tilde{w}_u/U & 0 & 0 \end{bmatrix} \right ) \boldsymbol{\cdot} \begin{pmatrix} U+u_T\\ v_T\\ w_T \end{pmatrix}\nonumber\\ &= ( \boldsymbol{I} + \boldsymbol{C} ) \boldsymbol{\cdot} \boldsymbol{u}_{\boldsymbol{b}}, \end{align}
where we assume that  $\tilde {\boldsymbol {u}}_u$ can still be obtained by ensemble averaging (Abderrahaman- Elena et al. Reference Abderrahaman-Elena, Fairhall and García-Mayoral2019; Fairhall et al. Reference Fairhall, Abderrahaman-Elena and García-Mayoral2019) and is therefore still governed by (2.7). Similarly, the pressure is decomposed into
 \begin{equation} p = P + p_T + \frac{U+u_T}{U} \tilde{p}_u, \end{equation}
which can be further written as
 \begin{equation} p = p_b + \boldsymbol{Q} \boldsymbol{\cdot} \boldsymbol{u}_{\boldsymbol{b}}, \end{equation}
where  $\boldsymbol {Q} = [\tilde {p}_u/U \quad 0 \quad 0]$, corresponding to a linear expansion about
 $U$.
The Navier–Stokes equations can then be written as
 \begin{align} &\partial_t ( ( \boldsymbol{I} + \boldsymbol{C} ) \boldsymbol{\cdot} \boldsymbol{u}_{\boldsymbol{b}} ) + \boldsymbol{\nabla} \boldsymbol{\cdot} [ (( \boldsymbol{I}+\boldsymbol{C} ) \boldsymbol{\cdot} \boldsymbol{u}_{\boldsymbol{b}} ) ( ( \boldsymbol{I}+\boldsymbol{C} ) \boldsymbol{\cdot} \boldsymbol{u}_{\boldsymbol{b}} )]\nonumber\\ & ={-}\boldsymbol{\nabla} ( p_b + \boldsymbol{Q} \boldsymbol{\cdot} \boldsymbol{u}_{\boldsymbol{b}} ) + \nu \nabla^2 ( ( \boldsymbol{I}+ \boldsymbol{C} ) \boldsymbol{\cdot} \boldsymbol{u}_{\boldsymbol{b}}). \end{align}
Following the procedure in § 2.2.1, the momentum equation for the background flow can be obtained by subtracting the governing equation for texture-coherent flow, (2.7), from (2.15):
 \begin{equation} \partial_t \boldsymbol{u}_{\boldsymbol{b}} + \boldsymbol{\nabla} \boldsymbol{\cdot} \boldsymbol{u}_{\boldsymbol{b}} \boldsymbol{u}_{\boldsymbol{b}} + \boldsymbol{N}'_{\boldsymbol{b}} ={-}\boldsymbol{\nabla} p_b + \nu \nabla^2 \boldsymbol{u}_{\boldsymbol{b}} + \boldsymbol{R}, \end{equation}
where
 \begin{align} \boldsymbol{N}'_{\boldsymbol{b}} &= \boldsymbol{\nabla} \boldsymbol{\cdot} [ (\boldsymbol{C} \boldsymbol{\cdot} \boldsymbol{u}_{\boldsymbol{b}} ) \boldsymbol{u}_{\boldsymbol{b}} + \boldsymbol{u}_{\boldsymbol{b}} (\boldsymbol{C} \boldsymbol{\cdot} \boldsymbol{u}_{\boldsymbol{b}} )] + \boldsymbol{\nabla} \boldsymbol{\cdot} [ ( \boldsymbol{C} \boldsymbol{\cdot} \boldsymbol{u}_{\boldsymbol{b}} ) ( \boldsymbol{C} \boldsymbol{\cdot} \boldsymbol{u}_{\boldsymbol{b}} ) ]\nonumber\\ &\quad - \boldsymbol{\nabla} \boldsymbol{\cdot} (\boldsymbol{U} + \tilde{\boldsymbol{u}}_{\boldsymbol{u}}) (\boldsymbol{U} + \tilde{\boldsymbol{u}}_{\boldsymbol{u}}) + \boldsymbol{\nabla} \boldsymbol{\cdot} \langle \tilde{\boldsymbol{u}}_{\boldsymbol{u}} \tilde{\boldsymbol{u}}_{\boldsymbol{u}} \rangle \end{align}
and
 \begin{equation} \boldsymbol{R} = \partial_t ( \boldsymbol{C} \boldsymbol{\cdot} \boldsymbol{u}_{\boldsymbol{b}} ) + \boldsymbol{\nabla} ( \boldsymbol{Q} \boldsymbol{\cdot} \boldsymbol{u}_{\boldsymbol{b}} ) - \boldsymbol{\nabla} \tilde{p} - \nu \nabla^2 ( \boldsymbol{C} \boldsymbol{\cdot} \boldsymbol{u}_{\boldsymbol{b}} ) + \nu \nabla^2 \tilde{\boldsymbol{u}}_{\boldsymbol{u}} . \end{equation}
Here, we have drawn a parallel with the result using conventional triple decomposition of (2.10) by grouping the additional advective terms into  $\boldsymbol {N}'_{\boldsymbol {b}}$, and any other additional terms arising from the amplitude modulation into a residual
 $\boldsymbol {R}$. In Appendix A we report on the magnitude of the latter, and show that
 $\boldsymbol {N}'_{\boldsymbol {b}}$ is the dominant term. We thus neglect the residual
 $\boldsymbol {R}$ in our model.
Finally, we can derive the momentum equation for the mean velocity  $\boldsymbol {U}$ analogously to (2.6) by taking the temporal average of (2.16) particularised for the Fourier
 $x$–
 $z$ zero mode, that is, for the
 $x$–
 $z$ spatial average. This gives
 \begin{equation} \boldsymbol{\nabla} \boldsymbol{\cdot} \langle \overline{\boldsymbol{u}_{\boldsymbol{T}} \boldsymbol{u}_{\boldsymbol{T}}} \rangle + \boldsymbol{N_m}={-} \boldsymbol{\nabla} P + \nu \nabla^2 \boldsymbol{U}, \end{equation}
where the forcing term  $\boldsymbol {N_m}$ is
 \begin{equation} \boldsymbol{N_m} = \boldsymbol{\nabla} \boldsymbol{\cdot} \langle \tilde{\boldsymbol{u}}_{\boldsymbol{u}} \tilde{\boldsymbol{u}}_{\boldsymbol{u}} \rangle + \boldsymbol{\nabla} \boldsymbol{\cdot} \langle \boldsymbol{C} \boldsymbol{\cdot} \overline{\boldsymbol{u}_{\boldsymbol{T}} \boldsymbol{u}_{\boldsymbol{T}}} + \overline{\boldsymbol{u}_{\boldsymbol{T}} \boldsymbol{u}_{\boldsymbol{T}}} \boldsymbol{\cdot} \boldsymbol{C}^T \rangle + \boldsymbol{\nabla} \boldsymbol{\cdot} \langle \boldsymbol{C} \boldsymbol{\cdot} \overline{\boldsymbol{u}_{\boldsymbol{T}} \boldsymbol{u}_{\boldsymbol{T}}} \boldsymbol{\cdot} \boldsymbol{C}^T \rangle . \end{equation}
Here,  $\boldsymbol {u}_{\boldsymbol {T}} (\boldsymbol {C} \boldsymbol {\cdot }\boldsymbol {u}_{\boldsymbol {T}})$ has been rearranged as
 $\boldsymbol {u}_{\boldsymbol {T}} \boldsymbol {u}_{\boldsymbol {T}} \boldsymbol {\cdot }\boldsymbol {C}^T$ before averaging in time. Integrating the above mean momentum equation in
 $y$ gives the following stress balance:
 \begin{equation} \nu \frac{{\rm d} U}{{\rm d}\kern0.05em y} - \langle \overline{u_T v_T} \rangle - N_{m,x} = u_{\tau}^2 \frac{\delta'- y}{\delta'}, \end{equation}
where the role of the dispersive Reynolds stress in (2.6) is now played by an extended term  $N_{m,x}$:
 \begin{equation} N_{m,x} = \left\langle \tilde{u}_u \tilde{v}_u + \frac{\tilde{u}_u \tilde{v}_u }{U^2} \overline{u_T v_T} + \frac{\tilde{u}_u }{U} \overline{u_T v_T} + \frac{\tilde{v}_u }{U} \overline{u_T u_T} \right\rangle . \end{equation}
The term  $N_{m,x}$ includes contributions from the background turbulence, and can thus only be calculated from the results in § 4 a posteriori in order to verify that the sum of the three stresses in (2.21) is indeed linear. Results of such measurement are portrayed for reference in figure 3 for the collocated textures of sizes
 $L^+\gtrsim 50$, as for smaller textures the contribution of
 $N_{m,x}$ is negligible. For the sizes portrayed its intensity increases with
 $L^+$, although it remains small compared with the viscous and background Reynolds stress.
Comparison of viscous stress (yellow), shear Reynolds stress (blue), averaged forcing term (red) and total stress (black) for (a) FA47, (b) FA71 and (c) FA94.

3. Numerical method
To investigate the nonlinear interaction between background turbulence and texture-coherent flow, DNSs of turbulent channels were conducted. The numerical code is adapted from that of Fairhall et al. (Reference Fairhall, Abderrahaman-Elena and García-Mayoral2019), and is briefly summarised here. The three-dimensional incompressible Navier–Stokes equations are solved using a spectral discretisation in the streamwise and spanwise directions with the wall-normal direction discretised by second-order finite differences on a staggered grid. A fractional step method (Kim & Moin Reference Kim and Moin1985), combined with a three-step Runge–Kutta scheme, is used to advance in time, with a semi-implicit scheme used for the viscous terms and an explicit scheme for the advective terms (Le & Moin Reference Le and Moin1991). The simulations were run with constant mean pressure gradients, adjusted to achieve the desired friction Reynolds numbers, Re $_{\tau }$. The channel is of size
 $2{\rm \pi} \delta \times {\rm \pi}\delta \times 2 \delta$ in the streamwise, spanwise and wall-normal directions, respectively, where
 $\delta$ is the channel half-height. Once a statistically steady state was reached, statistics were obtained over 10 times the characteristic largest-eddy-turnover time,
 $\delta /u_\tau$.
Three sets of DNSs were conducted. The first set consists of texture-resolving simulations with patterns of alternating regions of slip/no-slip boundary conditions on the channel walls. The first set used the DNS code from Fairhall et al. (Reference Fairhall, Abderrahaman-Elena and García-Mayoral2019) unmodified. The surfaces are assumed rigidly flat, which leads to zero transpiration. This is a widely used idealisation for superhydrophobic surfaces, where the free-slip regions represent the gas pockets, and the no-slip regions the exposed tips of solid posts. The assumption of free slip is reasonable if the gas pockets are sufficiently deep (Schönecker, Baier & Hardt Reference Schönecker, Baier and Hardt2014). The assumption of flat, rigid interfaces is reasonable for  $L^+ \lesssim 30$ for typical applications (Seo & Mani Reference Seo and Mani2018). We note nevertheless that in this study we use this model to keep the surface texture as simple as possible, regardless of whether the model is a suitable representation or not of superhydrophobic textures. The latter question is out of the scope of this work.
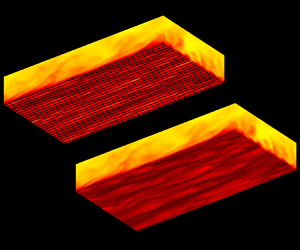
We consider texture elements consisting of periodic arrays of square posts, in both collocated and staggered arrangements, as illustrated in figure 4, with a solid fraction, the ratio of post area to total surface area,  $\phi _s \approx 1/9$. The texture unit is a square of side
 $L$, repeated periodically in the streamwise and spanwise directions. For our different simulations, the texture size ranges from
 $L^+ \approx 18$ to 94 for the collocated textures and
 $L^+ \approx 33$ to 66 for the staggered textures.
Schematic of collocated- and staggered-post arrangements for periodic textures.

The second set of DNSs replaces the textured surfaces by their corresponding homogeneous slip lengths, obtained a posteriori from the corresponding texture-resolving simulations. This set also used the DNS code from Fairhall et al. (Reference Fairhall, Abderrahaman-Elena and García-Mayoral2019) unmodified. The last set of DNSs are homogeneous-slip simulations with added forcing terms, with the same slip boundary conditions of the second set. The governing momentum equations have the additional nonlinear forcing terms introduced in § 2.2, with the texture-coherent velocities obtained from ensemble-averaging in the texture-resolving simulations.
In order to reduce the computational cost of the texture-resolving simulations, the code uses a multiblock layout, where the near-wall regions have finer grids compared with the channel centre. This is done in order to resolve fully not just the channel turbulence but also the texture-coherent flow, which typically requires higher resolution. In the blocks containing the walls, each texture element is resolved by  $24 \times 24$ grid points in the
 $x$ and
 $z$ directions. In the central block, the grid resolution is
 $\Delta x^+ \approx 8.8$ and
 $\Delta z^+ \approx 4.4$. The latter resolution is also used throughout in the simulations with homogeneous slip. In the wall-normal direction, the grid is stretched, with resolution
 $\Delta y_{min}^+ \approx 0.3$ at the surfaces and
 $\Delta y_{max}^+ \approx$ 3 in the channel centre, and with the fine-
 $x$–
 $z$-resolution blocks extending a height
 $\approx L$ into the channel from the wall, which was verified a posteriori to exceed the height at which any fine, texture-induced flow became vanishingly small. Overall, this resulted for instance in roughly
 $10^8$ grid points for case TX18 or
 $2\times 10^7$ for TX47, which can be compared with
 $2\times 10^6$ for the corresponding smooth-wall and texture-less simulations, or
 $4\times 10^8$ for TX18 if uniform resolution in
 $x$ and
 $z$ had been applied throughout.
The texture-resolving and homogeneous-slip simulations with collocated elements with sizes  $L^+ \approx 18$ to 47 are from Fairhall et al. (Reference Fairhall, Abderrahaman-Elena and García-Mayoral2019). Additional simulations with
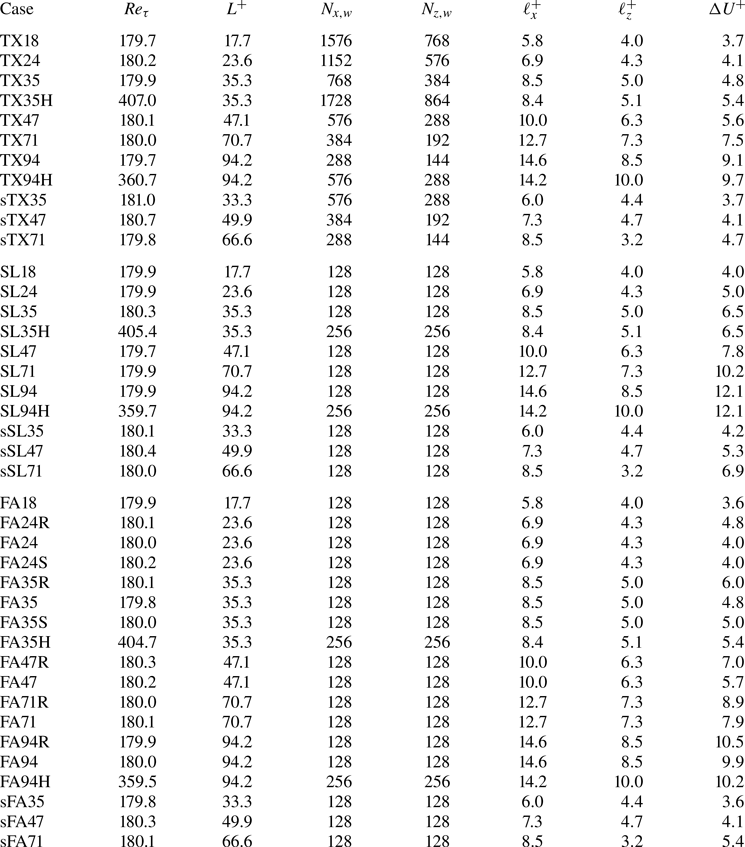
 $L^+ \approx 71$ and 94, as well as the simulations with staggered elements, have been conducted to complete and expand the database. Simulations with homogeneous slip and added forcing have been conducted matching all the above cases to investigate the effect of the nonlinear interaction. The parameters of all three sets of simulations are listed in table 1.
Simulation parameters for the texture-resolving, slip-only and slip-plus-forcing simulations. For the case names, TX and sTX indicate resolved collocated and staggered textures, SL and sSL slip-only simulations and FA and sFA simulations with forcing. The number in the case name is approximately the texture size in wall units,  $L^+$, listed also for texture-less simulations as a reference to the corresponding textured ones. An appended R indicates forcing based on conventional triple decomposition; otherwise the forcing is based on amplitude-modulated decomposition. An appended S indicates the use of an a priori surrogate model for the texture-coherent flow. An appended H indicates higher friction Reynolds number,
 $Re_{\tau }$. Parameters
 $N_{x,w}$ and
 $N_{z,w}$ are the number of grid points in the streamwise and spanwise directions in the refined blocks that contain the channel walls. Lengths
 $\ell _x^+$ and
 $\ell _z^+$ are the streamwise and spanwise slip lengths, and
 $\Delta U^+$ is the resulting velocity increment away from the wall.
3.1. Dealiasing for the forcing terms
When calculating the product of two variables, such as in the advective term, in discrete Fourier space, the problem of aliasing arises. The convolution of two discrete functions,  $\hat {f}_M$ and
 $\hat {f}_N$, containing
 $M$ and
 $N$ discrete modes, results in a function containing
 $M+N$ modes. However, if the product function allocated for the convolution,
 $\hat {f}_P$, is of size
 $P < M+N$, the excess modes cannot be correctly represented. This additional, high-frequency information is then reflected into the resolved modes of the product function.
The method typically used to address this aliasing is to pad  $\hat {f}_M$ and
 $\hat {f}_N$ with additional modes, with zero value, before the multiplication (Canuto et al. Reference Canuto, Hussaini, Quarteroni and Zhang2012). For the nonlinear term
 $(\boldsymbol {u}_{\boldsymbol {T}} \boldsymbol {u}_{\boldsymbol {T}} )$ in (2.11), we use the standard ‘2/3 rule’ for dealiasing. All functions have the same size,
 $M=N=P$, so they need to be padded with an additional
 $N/2$ modes to prevent aliasing in
 $\hat {f}_P$ in modes 0 to
 $N$. Aliasing still occurs from the reflection of modes greater than
 $3N/2$ into modes from
 $N$ to
 $3N/2$, but this is of no consequence as these modes are discarded once the convolution product has been calculated. In contrast with the standard advection, for the product
 $\tilde {\boldsymbol {u}}_{\boldsymbol {u}} \boldsymbol {u}_{\boldsymbol {T}}$, the convolution of the background turbulence and the texture-coherent flow, the sizes of the two components need not be the same. We have for instance
 $N = 128$ for
 $\boldsymbol {u}_{\boldsymbol {T}}$, with
 $M$ different for cases with different texture size, and typically
 $M \geq N$. Since we are interested in solving only the background turbulence, that is, modes up to
 $N$, for dealiasing in this case we need at least
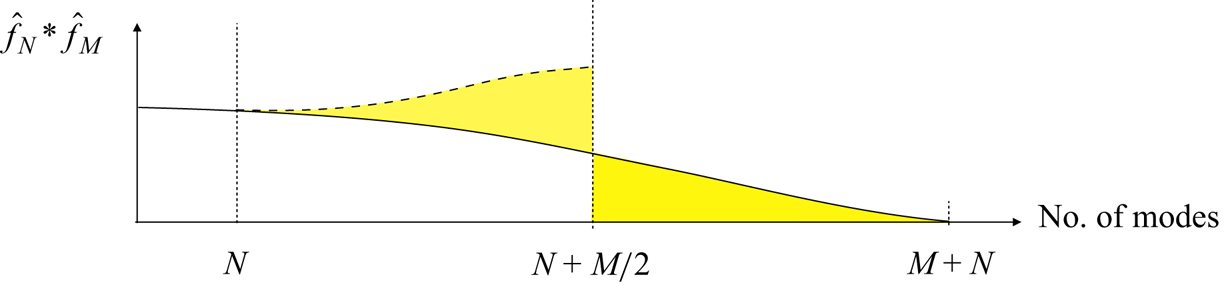
 $P = N + M/2$, as illustrated in figure 5. Taking case FA35 as an example, in the streamwise direction the texture-coherent component
 $\tilde {\boldsymbol {u}}_{\boldsymbol {u}}$ has
 $M = 768$ points in discrete Fourier space, so
 $X = 128 + 768/2 = 512$ is required for dealiasing.
Sketch of the dealiasing strategy for the forcing terms. The spectral region shaded in yellow with modes larger than  $N+M/2$ is reflected into the shaded region under the dashed line, which includes only modes larger than
 $N$, and thus avoids aliasing of modes below
 $N$.
4. Results and discussion
In this section, we present and discuss the results of the DNSs summarised in table 1. We first compare the drag predictions obtained from simulations with the texture resolved and those with its effect modelled. Figure 6 portrays those results in terms of the velocity increment  $\Delta U ^+$. For each simulation set-up, the figure shows the usual increase of
 $\Delta U^+$ with texture size
 $L^+$. The results with resolved textures and with the corresponding slip boundary conditions agree well only up to texture sizes
 $L^+ \approx 20$ (for smaller textures, see results in Fairhall et al. (Reference Fairhall, Abderrahaman-Elena and García-Mayoral2019)) for collocated layouts and
 $L^+\approx 35$ for staggered ones, although we note that the streamwise spacing between successive rows of posts is then
 $L_x^+ \approx 25$, close to the collocated value. For larger spacings, using the equivalent homogeneous slip increasingly overpredicts
 $\Delta U ^+$, by
 $\sim$35 % for
 $L^+\gtrsim 35$ in the case of collocated posts, and by a similar proportion for staggered ones. This difference was already reported by Fairhall et al. (Reference Fairhall, Abderrahaman-Elena and García-Mayoral2019). They argued that, given that the effective boundary conditions perceived by the overlying turbulence were the same for texture-resolved and slip simulations, the difference in drag had to arise from differences in the overlying flow. Introducing the forcing terms without amplitude modulation from § 2.2.1 improves the prediction of
 $\Delta U ^+$ for slip-only simulations partially, as shown in figure 6. The error remains, however, large, and is only reduced by 30 %–50 %. In turn, introducing the forcing terms with amplitude modulation from § 2.2.2 yields values of
 $\Delta U ^+$ in good agreement with those of texture-resolved simulations at least up to texture sizes
 $L^+\approx 70$. As the texture size increases further to
 $L^+\approx 100$, the results begin to depart. Although the deviation remains below 10 %, we already expected the forcing model to break down in this range of
 $L^+$, as the assumption gradually ceases to hold that there is sufficient separation of scales between the overlying shear and the texture-coherent flow it induces, rendering the flow decomposition used in the forcing model invalid. This is further discussed in § 4.1.
Comparison of  $\Delta U^+$ obtained from texture-resolved, slip-only and slip-plus-forcing simulations. Filled symbols are for
 $Re_{\tau } \approx 180$ and open symbols for
 $Re_{\tau } \approx 350\unicode{x2013}400$. Solid and dashed lines are for simulations with collocated and staggered texture arrangements, respectively. Black circles, texture-resolved simulations; red circles, simulations with homogeneous-slip boundary conditions only; light blue triangles, simulations with homogeneous slip plus forcing based on conventional triple decomposition; blue triangles, simulations with homogeneous slip plus forcing based on amplitude-modulated triple decomposition.

For the staggered-post layouts, the values of  $\Delta U ^+$ are lower than for collocated layouts with the same
 $L^+$. This is in agreement with the Stokes-flow predictions for small textures of Sbragaglia & Prosperetti (Reference Sbragaglia and Prosperetti2007). They argued that collocated textures channel the flow through streamwise-aligned channels between posts, while staggered arrangements obstruct this channelling effect, reducing the mean slip velocity. This obstruction was also important in the simulations of Seo & Mani (Reference Seo and Mani2018), who observed that the slip lengths measured from DNSs of surfaces with randomly distributed texture elements were reduced by approximately 30 % compared with collocated elements. In any event, the results for texture-resolved, slip-only and slip-plus-forcing simulations for staggered posts follow generally the same trends observed for collocated posts, albeit with lower values of
 $\Delta U ^+$ for the same
 $L^+$, and are therefore not presented in the remainder of this section. They are nevertheless included for completeness in Appendix B.
The agreement exhibited by the roughness function between texture-resolved simulations and texture-less simulations with amplitude-modulated forcing extends to other flow properties. This is the case for instance of one-point turbulent statistics. Figures 7 and 8 portray the root-mean-square (r.m.s.) velocity fluctuations and the shear Reynolds stress and mean velocity profile for texture-resolved, slip-only and slip-plus-forcing simulations, using both amplitude-modulated and conventional triple decomposition, across the range  $L^+ \approx 20\unicode{x2013}100$. For
 $L^+ \approx 20$, even slip-only simulations show good agreement with fully resolved ones. This was reported by Fairhall et al. (Reference Fairhall, Abderrahaman-Elena and García-Mayoral2019) as the limit size for which slip lengths alone could capture the effect of the texture, as the texture-coherent flow is small in amplitude and confined to the immediate vicinity of the surface, and therefore does not alter the background turbulence significantly. The latter remains then smooth-wall-like, other than by a shift in apparent origins (Ibrahim et al. Reference Ibrahim, Gómez-de-Segura, Chung and García-Mayoral2021). In agreement with this, adding forcing to model the effect of the texture-coherent fluctuations in this
 $L^+$ range has little effect and essentially does not alter the flow. As the texture size increases from
 $L^+ \approx 20$, though, the flow begins to depart from the smooth-wall-like behaviour that slip boundary conditions yield, as shown in figures 7 and 8, with a decrease of the streamwise fluctuation intensity above
 $y^+ \approx 10$, and an increase throughout of the spanwise and wall-normal intensities and of the shear Reynolds stress. We note that the latter is in all cases zero at the surface, a unique feature of slip/no-slip textures caused by the zero transpiration at
 $y=0$. In general, the above modifications, which tend to decay sufficiently away from the wall, roughly at
 $y^+ \approx 50$, are observed over slip/no-slip textures (Seo, García-Mayoral & Mani Reference Seo, García-Mayoral and Mani2015; Fairhall et al. Reference Fairhall, Abderrahaman-Elena and García-Mayoral2019) but also over rough surfaces (Orlandi & Leonardi Reference Orlandi and Leonardi2006; Abderrahaman-Elena et al. Reference Abderrahaman-Elena, Fairhall and García-Mayoral2019).
The r.m.s velocity fluctuations for collocated textures of sizes  $L^+ \approx 20\unicode{x2013}100$ at
 $Re_{\tau } \approx 180$. Black, texture-resolved simulations; red, slip-only simulations; blue dashed, simulations with forcing based on conventional triple decomposition; blue solid, simulations with forcing based on amplitude-modulated decomposition.

Shear Reynolds stress and mean velocity profile for collocated textures of sizes  $L^+ \approx 20\unicode{x2013}100$ at
 $Re_{\tau } \approx 180$. Line styles are as in figure 7.
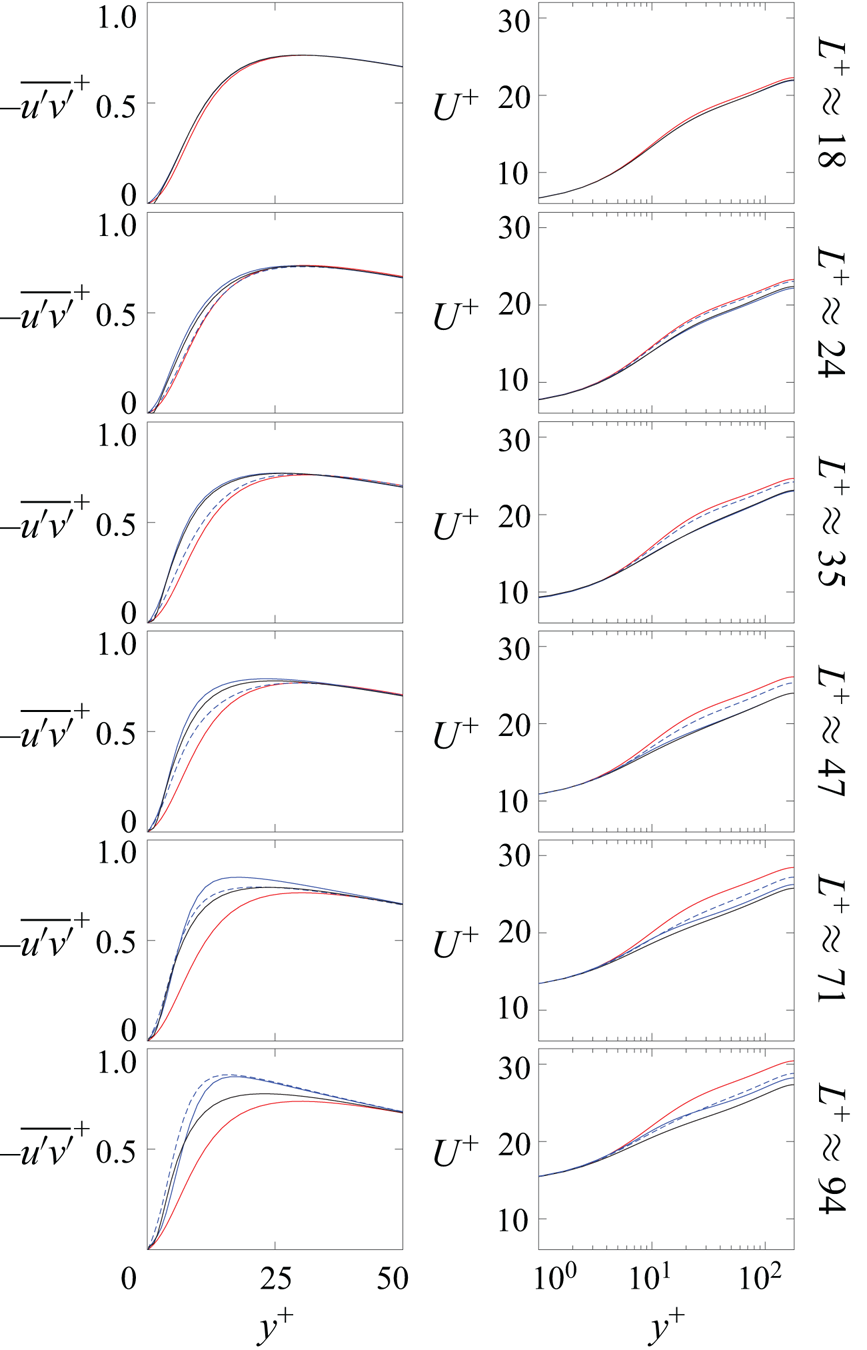
The addition of forcing using conventional triple decomposition can reproduce some of the departures from smooth-wall-like flow mentioned above for textured simulations, but forcing with amplitude modulation shows much better agreement with the resolved-texture cases. The agreement is excellent up to  $L^+ \approx 50$ and first begins to break down for the spanwise velocity. This was to be expected given the simplifications made in (2.12), and has little effect on the Reynolds stress and, therefore, on the mean velocity profile and the drag. The agreement breaks down further for
 $L^+ \approx 70$, for which it begins to propagate into
 $\Delta U ^+$, although it is still reasonable. For
 $L^+ \approx 100$ the departures become significant. We therefore identify this as the limit beyond which the model proposed here fails.
As mentioned in § 1, the differences in the Reynolds stress profile shown in figure 8 are caused by the changes in the background turbulence. The latter are what the forcing models ultimately aim to capture. The increased Reynolds stress causes a downward shift of the mean velocity profile away from the wall, and a corresponding reduction in  $\Delta U^+$. This relationship can be quantified by integrating the streamwise momentum equation. Here we follow Gómez-de-Segura & García-Mayoral (Reference Gómez-de-Segura and García-Mayoral2019). A first integral gives
 \begin{equation} \frac{\mathrm{d} U^+}{\mathrm{d} y^+} + \tau_{uv}^+= \frac{\delta'^+- y^+}{\delta'^+}, \end{equation}
where  $\tau _{uv}$ is the shear Reynolds stress, including any dispersive stress, and
 $\delta ' = \delta + \ell _T$ is the effective half-height of the channel, which accounts for the background turbulence perceiving a virtual origin at
 $y=-\ell _T$. Integrating (4.1) once more in the wall-normal direction, from the surface to a height
 $H$ sufficiently far above for all surface effects to have vanished, gives
 \begin{equation} U^+ (H^+ ) - U^+_{slip} + \int_{0}^{H^+} \tau_{uv}^+(y^+ ) \,\mathrm{d} y^+= f, \end{equation}
where  $U_{slip}=U(y^+=0)$ is the slip velocity and
 $f$ is a simple function of
 $H^+$,
 $\delta '^+$ and
 $\ell _T^+$. The same integral can be repeated for a reference smooth-wall flow at the same friction Reynolds number
 $\delta '^+$ between the corresponding heights,
 $y=\ell _T$ and
 $y=H+\ell _T$, yielding
 \begin{equation} U_{S}^+ (H^++ \ell_T^+) - U_\mathrm{S}^ + (\ell_T^+) + \int_{\ell_T^+}^{H^++ \ell_T^+} \tau_{uv,{S}}^+(y_S^+)\, \mathrm{d} y_S^+= f, \end{equation}
where the subscript  $S$ denotes smooth-wall flow. The roughness function
 $\Delta U^+$ can then be obtained by subtracting (4.2) and (4.3):
 \begin{align} \Delta U^+ &= U^+ (H^+ ) - U_{S}^+ (H^++ \ell_T^+) \end{align}
 \begin{align} & = U^+_{slip} - U_{S}^+ (\ell_T^+) + \int_{0}^{H^+} [ \tau_{uv}^+(y^+ ) - \tau_{uv,{S}}^+ (y^++ \ell_T^+ )] \,\mathrm{d} y^+. \end{align}
For slip-only simulations, turbulence is smooth-wall-like and the integral in (4.5) is essentially zero (Fairhall et al. Reference Fairhall, Abderrahaman-Elena and García-Mayoral2019; Ibrahim et al. Reference Ibrahim, Gómez-de-Segura, Chung and García-Mayoral2021). Near the wall,  $\mathrm {d} U^+/\mathrm {d} y^+\approx 1$, so for
 $\ell _x^+ \lesssim 10$ we have
 $U^+_{slip} \approx \ell _x^+$. From (1.3), we have
 $\ell _T^+ \lesssim 4$, so also
 $U_{S}^ + (\ell _T^+)\approx \ell _T^+$. The roughness function reduces then to the offset between the apparent origins for the mean flow and for turbulence,
 $\Delta U^+ \approx \ell _x^+ - \ell _T^+$ (Luchini Reference Luchini1996). For texture-resolved simulations, however, in addition to this origin offset, the increase in Reynolds stress causes further modifications to the mean velocity profile and the roughness function. Fairhall et al. (Reference Fairhall, Abderrahaman-Elena and García-Mayoral2019) observed that for the present slip/no-slip textures, with zero transpiration and dispersive stress at
 $y=0$, the contribution from the latter to
 $\tau _{uv}$ is negligible up to at least texture sizes
 $L^+ \approx 50$, as shown in figure 2. Those modifications would then be essentially caused by changes in the background, texture-incoherent turbulence alone. Figure 8 shows that the forcing model with amplitude modulation is able to capture the effect of these changes on the Reynolds stress, and thus on
 $\Delta U^+$, while that with conventional triple decomposition captures those changes only partially.
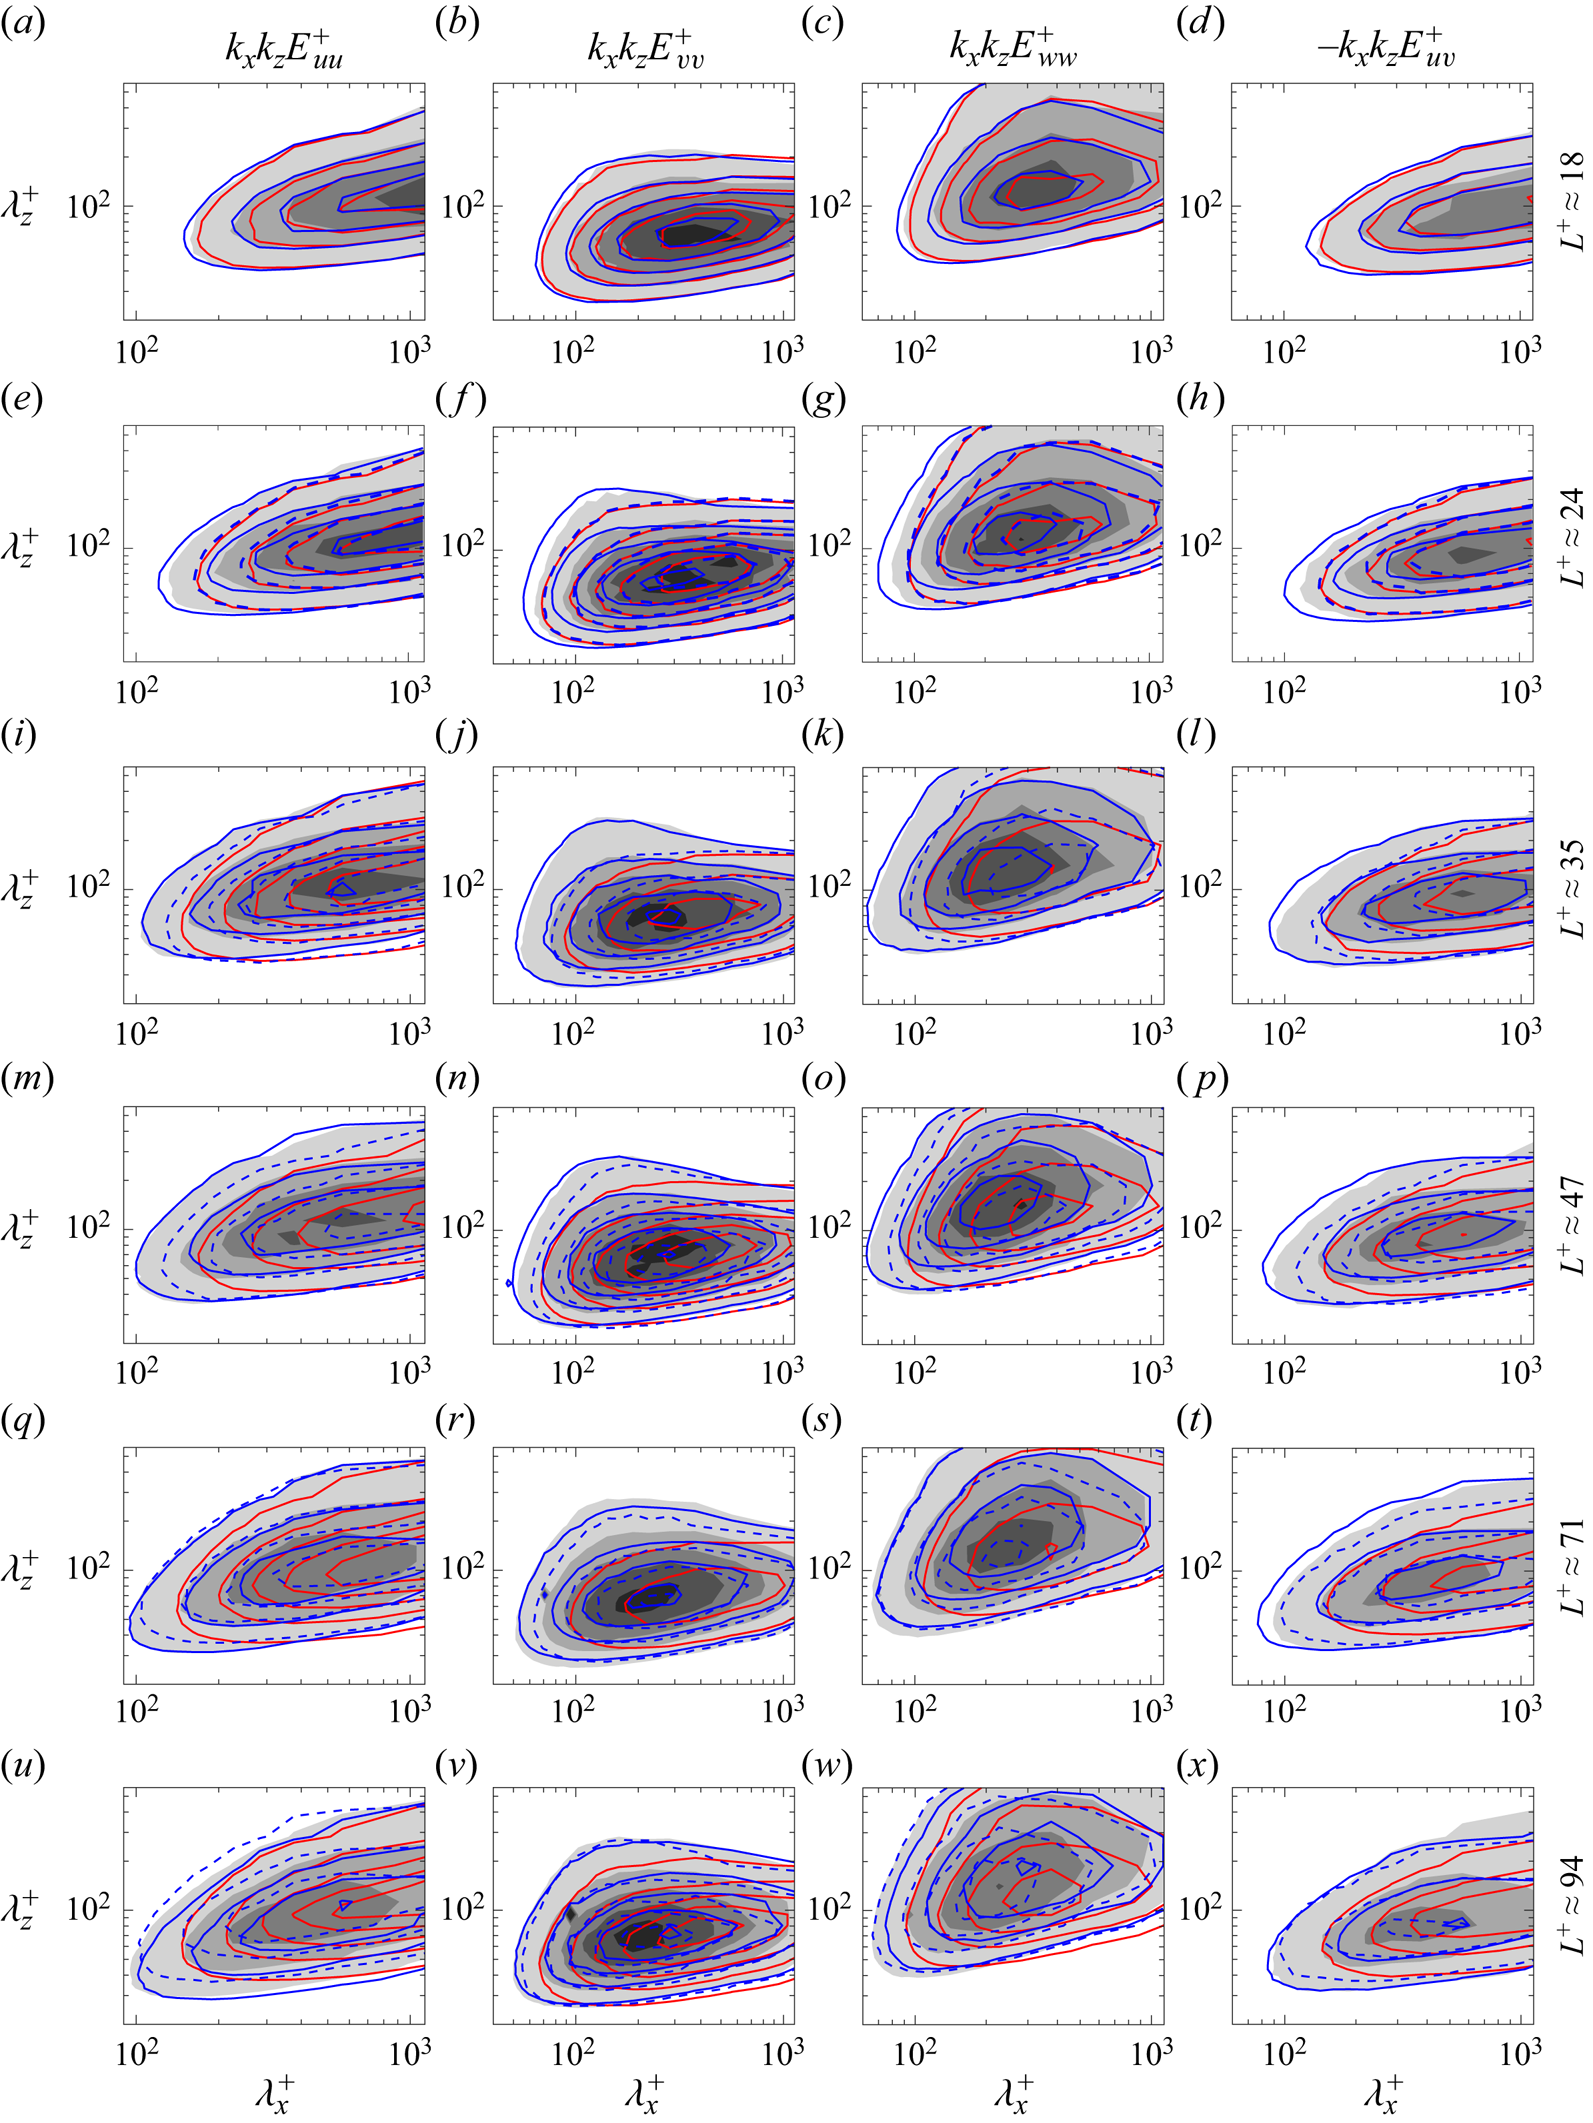
The modifications in the background turbulence can be observed in more detail in the spectral density maps of the different variables, as those portrayed in figure 9. Such maps show the contributions to the statistics shown in figures 7 and 8 at a given height  $y$ from different streamwise and spanwise length scales. Figure 9 displays the energy densities at
 $y^+ \approx 15$, a height of intense r.m.s. fluctuations of the background turbulence and also sufficiently above the surface for the texture-coherent flow to be negligible. As observed by Ibrahim et al. (Reference Ibrahim, Gómez-de-Segura, Chung and García-Mayoral2021), the signature of turbulence in slip-only simulations is essentially the same as over smooth walls. Compared with those cases, for fully resolved textures there is additional energy in shorter streamwise scales, and also in wider spanwise scales particularly for
 $v$. This effect is negligible for
 $L^+ \lesssim 20$, but becomes increasingly marked for greater
 $L^+$. Figure 9 shows that slip-only models fail to capture this gradual change in the dynamics of the background turbulence for
 $L^+ \gtrsim 25$. The forcing model based on conventional triple decomposition is able to generate some additional energy in shorter and wider scales, but not to the full extent observed in texture-resolved simulations. In contrast, the forcing model based on amplitude modulation can generate energy in all the necessary scales, and results in a good overall collapse of the spectra with that for resolved textures up to
 $L^+ \approx 70$. For larger
 $L^+$, deviations appear first in the core regions of the maps for
 $v$ and
 $w$ and in streamwise long scales of
 $u$ and
 $uv$. These spectra indicate again that the additional forcing terms based on the amplitude-modulated decomposition can capture the effect of the texture on the background turbulence, while forcing based on conventional triple decomposition shows only a limited improvement compared with slip-only simulations.
Spectral energy densities of the velocity fluctuations and the shear Reynolds stress at  $y^+ \approx 15$ for collocated textures of sizes
 $L^+ \approx 20\unicode{x2013}100$ at
 $Re_{\tau } \approx 180$. Shaded contours, texture-resolved simulations; red, slip-only simulations; blue dashed, simulations with forcing based on conventional triple decomposition; blue solid, simulations with forcing based on amplitude-modulated decomposition.
To illustrate the general appearance of the flow, instantaneous realisations of the three velocity components for texture-resolved, slip-only and amplitude-modulated forcing simulations are shown in figure 10 at a height  $y^+ \approx 15$ for texture size
 $L^+ \approx 50$. This size is large enough to exhibit significant differences across models, yet not so large that the forcing model begins to fail. While the slip-only simulation exhibits canonical, smooth-wall-like turbulence structures, both the texture-resolving and the forcing-model simulations show a similar disruption of the latter, with a reduction in the coherence of the streamwise velocity for scales of order 1000 wall units, as indicated also by the energy spectra. For the wall-normal and spanwise velocities, the length scales of the turbulent eddies are also shorter compared with those over homogeneous slip. At this
 $L^+ \approx 50$, the length scales and magnitude of the texture-coherent flow near the wall become comparable to those of the background turbulence. The spectra and instantaneous flow fields suggest a modification of the near-wall dynamics through the disruption of streaks and quasi-streamwise vortices by this texture-coherent flow. The similarity of the amplitude-modulated forcing flow field and the texture-resolved one suggests that the alteration of the background turbulence by the presence of the texture can also be captured by the forcing model.
Instantaneous realisations of the fluctuating  $u$ (a,d,g),
 $v$ (b,e,h) and
 $w$ (c, f,i) velocity components at
 $y^+ \approx 15$ for
 $L^+\approx 50$. (a–c) Texture-resolved simulation, TX47; (d–f) slip-only simulation, SL47; (g–i) simulation with amplitude-modulated forcing, FA47. From blue to yellow, values are from
 $-$4.0 to 4.0 for
 $u$, from
 $-$1.2 to 1.2 for
 $v$ and from
 $-$2.2 to 2.2 for
 $w$, all in viscous units.

Finally, to verify that the expected scaling in viscous units for textures whose effect is confined to the vicinity of the wall (García-Mayoral & Jiménez Reference García-Mayoral and Jiménez2012) also holds for the corresponding models, in addition to the simulations at  $Re_{\tau } \approx 180$ we have conducted simulations at
 $Re_{\tau } \approx 400$ for the collocated textures of size
 $L^+ \approx 35$ and
 $L^+ \approx 100$. The results support this scaling, and are presented and discussed in Appendix C.
4.1. The limit of the forcing model
The preceding discussion has shown how the model based on the amplitude-modulated decomposition works well up to  $L^+ \approx 70$, and how for
 $L^+ \approx 70$ and
 $L^+ \approx 100$ deviations from the fully resolved simulations are increasingly apparent. We have also mentioned that this is to be expected, as the assumption of separation of scales between the two flow components ceases to hold. The decomposition hinges on the idea that one component, the overlying background turbulence, excites the other, the texture-coherent signature, as the response flow in the immediate vicinity of the texture, which does not necessarily cease to hold once the length scales of the two become comparable. The algebraic form, however, as laid out in (2.2) or more generally in (2.3), assumes that the exciting overlying flow is on a much larger scale than the excited one, in the spirit of Luchini, Manzo & Pozzi (Reference Luchini, Manzo and Pozzi1991). As
 $L^+$ increases, the breakdown of scale separation occurs first for the cross-flow components, as these are mainly produced by the overlying quasi-streamwise vortices, with length and span of order
 $200\times 20$ wall units, while the streamwise component is mainly produced by the streamwise streaks, with length and span of order
 $1000\times 100$ wall units (Kline et al. Reference Kline, Reynolds, Schraub and Runstadler1967; Blackwelder & Eckelmann Reference Blackwelder and Eckelmann1979; Smith & Metzler Reference Smith and Metzler1983).
This difference can be observed in the earlier loss of correlation at the wall between velocity and shear in the spanwise direction. Fairhall et al. (Reference Fairhall, Abderrahaman-Elena and García-Mayoral2019) showed that the correlation held well for the background turbulence up to  $L^+ \approx 50$ for both
 $u$ and
 $w$. Figures 11–14 extend their analysis to the textures of size
 $L^+ \approx 70$ and
 $L^+ \approx 95$. The figures show that the decomposition using (2.3) still results in an excellent recovery of the correlation between
 $u$ and
 $\partial u/\partial y$ for both texture sizes, in terms of both proportion and phase between them, which makes the value of
 $\ell _x$ estimated from this data meaningful. The same is, however, not true for the correlation between
 $w$ and
 $\partial w/\partial y$, which exhibits a considerable scatter in terms of both phase and magnitude. As a result, it is difficult to define a spanwise slip length
 $\ell _z$ meaningfully. We note nevertheless that this is of minor importance with regards to setting the effective boundary condition for
 $w$. At these large texture sizes, we have
 $\ell _z^+\gtrsim 7$, and thus the effect of the slip length in the boundary condition for
 $w$ in (1.3) is significantly saturated, with variations in
 $\ell _z$ not resulting in significant variations in
 $\ell _T$. In any event, the loss of correlation is indicative of the background turbulence component obtained still being contaminated by some amount of texture-induced signal, and thus of the decomposition produced using (2.3) breaking down.
Correlation over multiple instantaneous realisations of the streamwise velocity  $u$ and shear
 $\partial u/\partial y$ for texture size
 $L^+ \approx 70$, for wavelengths
 $\lambda _x^+\approx 110$ to
 $1100$ and
 $\lambda _z^+\approx 110$ to
 $550$ from red to blue. (a,d) Magnitudes of
 $u$ and
 $\partial u/\partial y$; and phases between the two in (b,e)
 $x$ and (c, f)
 $z$. (a–c) Full velocity signal. (d–f) Background turbulence component. Dashed lines mark slip lengths obtained from linear regression of the data displayed.

Correlation over multiple instantaneous realisations of the streamwise velocity  $w$ and shear
 $\partial w/\partial y$ for texture size
 $L^+ \approx 70$, for wavelengths
 $\lambda _x^+\approx 110$ to
 $1100$ and
 $\lambda _z^+\approx 110$ to
 $550$ from red to blue. (a,d) Magnitudes of
 $w$ and
 $\partial w/\partial y$; and phases between the two in (b,e)
 $x$ and (c, f)
 $z$. (a–c) Full velocity signal. (d–f) Background turbulence component. Dashed lines mark slip lengths obtained from linear regression of the data displayed.

Correlation over multiple instantaneous realisations of the streamwise velocity  $u$ and shear
 $\partial u/\partial y$ for texture size
 $L^+ \approx 95$, for wavelengths
 $\lambda _x^+\approx 110$ to
 $1100$ and
 $\lambda _z^+\approx 110$ to
 $550$ from red to blue. (a,d) Magnitudes of
 $u$ and
 $\partial u/\partial y$; and phases between the two in (b,e)
 $x$ and (c, f)
 $z$. (a–c) Full velocity signal. (d–f) Background turbulence component. Dashed lines mark slip lengths obtained from linear regression of the data displayed.
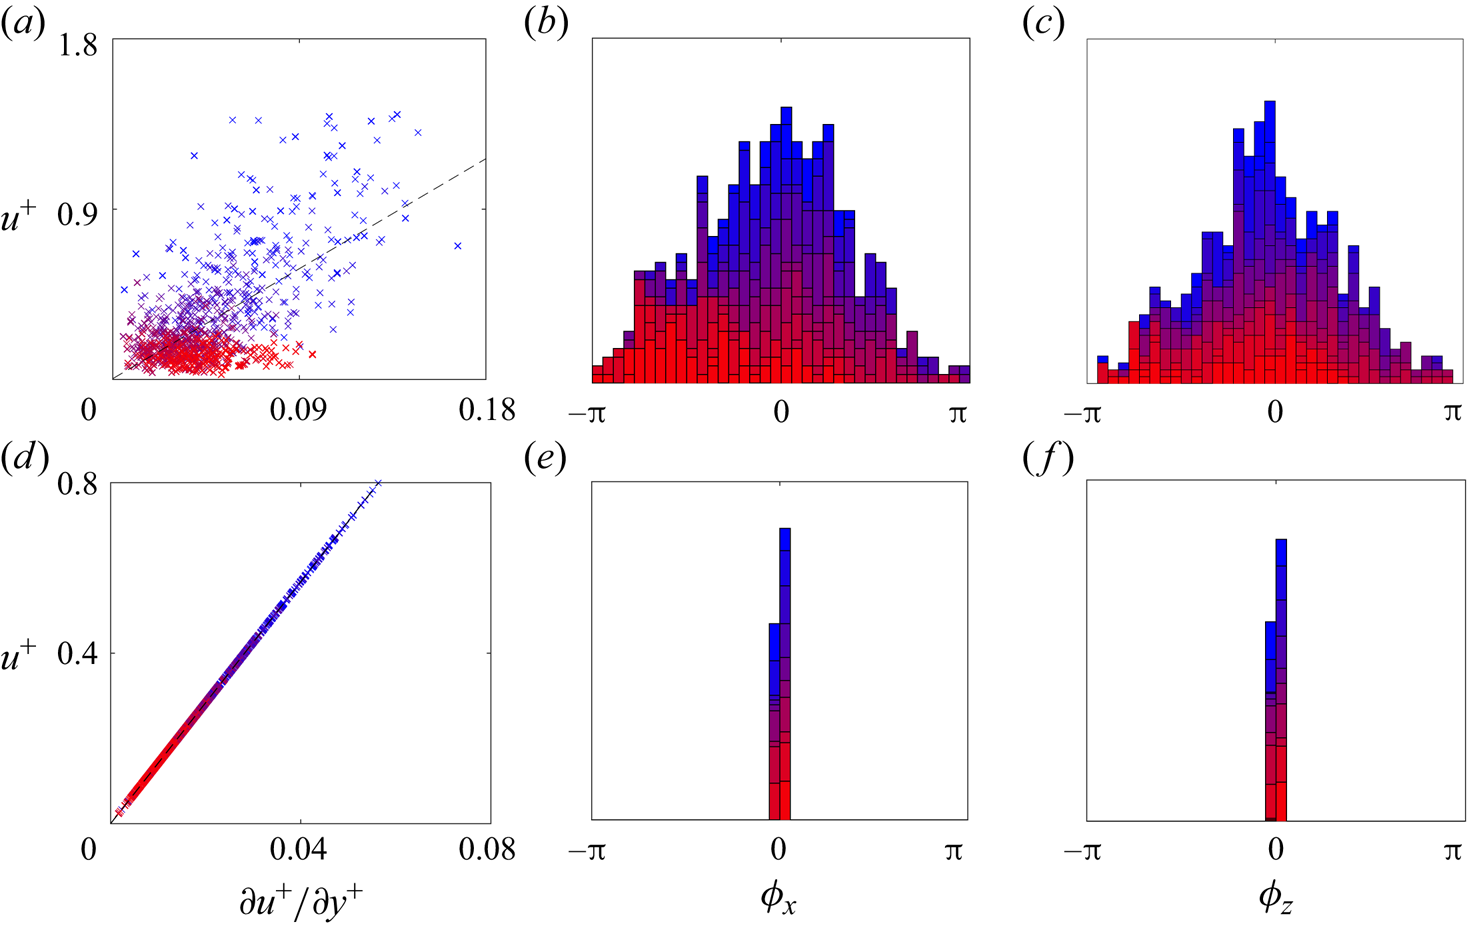
Correlation over multiple instantaneous realisations of the streamwise velocity  $w$ and shear
 $\partial w/\partial y$ for texture size
 $L^+ \approx 95$, for wavelengths
 $\lambda _x^+\approx 110$ to
 $1100$ and
 $\lambda _z^+\approx 110$ to
 $550$ from red to blue. (a,d) Magnitudes of
 $w$ and
 $\partial w/\partial y$; and phases between the two in (b,e)
 $x$ and (c, f)
 $z$. (a–c) Full velocity signal. (d–f) Background turbulence component. Dashed lines mark slip lengths obtained from linear regression of the data displayed.

This breakdown is perhaps even clearer in the spectral densities of the tangential velocity components in the immediate vicinity of the texture, for both the background turbulence and the full texture-resolved flow, as portrayed at  $y=0$ in figure 15. Up to texture size
 $L^+ \approx 50$ the main energetic region that can be observed in the spectra of
 $u$ and
 $w$ is recovered in the spectra of the background-turbulence components. However, for
 $L^+ \gtrsim 70$, the decomposition can successfully filter out the contributions in the vicinity of the texture harmonics, which is fully attributable to the texture-coherent flow and its modulation in amplitude (Abderrahaman-Elena et al. Reference Abderrahaman-Elena, Fairhall and García-Mayoral2019; Fairhall et al. Reference Fairhall, Abderrahaman-Elena and García-Mayoral2019), but the spectral signature of the background turbulence is visibly altered by the decomposition. This is indicative of (2.3) failing to produce the correct signal for the background turbulence in the latter size range. Figure 15 shows that this happens once the length scales of the harmonics induced by the texture begin to overlap significantly with the main spectral region of the background turbulence, that is, once scale separation ceases to hold.
Spectral energy densities at  $y=0$ for the full streamwise and spanwise velocity components,
 $u$ and
 $w$, and for the corresponding background turbulence components as obtained using the amplitude-modulated decomposition of (2.3),
 $u_T$ and
 $w_T$, for collocated square posts of sizes
 $L^+ \approx 35$, 47, 71 and 94.

The results for texture sizes  $L^+ \gtrsim 50$ portrayed in figures 6–9 indicate that the deviations from the texture-resolved results first occur for
 $w'$, and soon extend to the other velocity components. The contribution of long structures of
 $u'$ and
 $uv'$ is particularly overpredicted, ultimately leading to an overprediction of the shear Reynolds stress and an underprediction of the drag. We note, however, that, even at
 $L^+ \approx 100$, the amplitude-modulated model performs significantly better than the state-of-the-art slip-only models, even if they fail to capture fully the dynamics at play in texture-resolved simulations.
The present breakdown of the model for  $L^+ \gtrsim 70$ does not completely rule out its applicability for larger textures, and rather limits its validity in the present form of (2.12) and (2.16). It is entirely possible that a formulation of the flow decomposition not requiring scale separation could extend its validity to larger sizes. The present formulation also neglects any texture-coherent flow induced by cross-plane fluctuations. Such contributions to the texture-coherent flow would become increasingly important for larger texture sizes, leading to additional cross-advective forcing terms on the background turbulence. Their absence from the present formulation likely also contributes to its breakdown. Dropping the above simplifications would lead to a significantly more complex formulation, however, and is left for future work.
4.2. Using a priori estimates for the texture-coherent flow
The amplitude-modulated forcing model proposed in this paper shows good agreement with texture-resolved simulations at least up to texture sizes  $L^+ \approx 70$, in terms of both drag prediction and turbulent statistics and structure. This strongly suggests that the model has successfully identified the key physical mechanisms at play, i.e. the nonlinear interactions between the texture-coherent flow and the background turbulence, and is able to reproduce them without resolving the texture elements. Our central aim in the present work was to identify and understand this mechanism, but ultimately it would also be interesting to use this understanding to design predictive tools. The results presented thus far do not have a truly predictive character, as they require a posteriori information on the texture-coherent flow obtained by ensemble averaging of texture-resolved simulations. In order to be fully predictive, the model would instead need a priori estimates of the texture-coherent flow. Such estimates are readily available, and their use is discussed below. The results are good, but we note, however, that this does not add to the understanding of the physical mechanism, and its usefulness as a predictive tool is somewhat limited, as it would still require running DNS-resolution simulations, even if without the texture-related resolution requirements. This is nevertheless a useful first step for the development of future models that circumvent the need for DNS altogether.
As mentioned in § 1, Abderrahaman-Elena et al. (Reference Abderrahaman-Elena, Fairhall and García-Mayoral2019) observed that the ensemble average flow over small textures resembles the flow induced by a steady homogeneous overlying shear at matching  $L^+$, which can be obtained from laminar steady simulations of a single periodic unit of texture. This is in essence an extension of the Stokes-flow computations used by Luchini et al. (Reference Luchini, Manzo and Pozzi1991), Kamrin, Bazant & Stone (Reference Kamrin, Bazant and Stone2010) and Luchini (Reference Luchini2013) to predict protrusion heights or slip lengths, with the addition of inertial terms. The laminar computations of Abderrahaman-Elena et al. (Reference Abderrahaman-Elena, Fairhall and García-Mayoral2019) were extended for the slip/no-slip textures considered in this paper in Adams (Reference Adams2021). In the latter, a synthetic eddy viscosity obtained from smooth-wall DNS was added to represent the effect of the background turbulence on the shape of the mean velocity profile under a driving pressure gradient. This eddy viscosity was essentially used so that the laminar computations yielded mean profiles more realistic than Couette or Poiseuille ones, although this only had a marginal effect on the texture-coherent flow, in its weaker regions away from the surface. It is analogous to a Van Driest (Reference Van Driest1956) or Cess (see Reynolds & Tiederman Reference Reynolds and Tiederman1967) conventional model, but was used instead because the latter was found to produce a poor surrogate for the smooth-wall profile at our low
 $Re_{\tau } \approx 180$. Compared with the texture-resolved DNSs of Fairhall et al. (Reference Fairhall, Abderrahaman-Elena and García-Mayoral2019), the resulting flow fields for
 $L^+\approx 35$ overpredicted the coherent
 $\tilde {u}_u$ by roughly 20 %, and showed good agreement in
 $\tilde {v}_u$ and
 $\tilde {w}_u$, yielding overall a reasonable estimate for the texture-coherent flow.
Mean velocity profile, r.m.s velocity fluctuations and Reynolds shear stress for simulations with  $L^+ \approx 24$ (dashed lines) and
 $L^+ \approx 35$ (solid lines) at
 $Re_{\tau } \approx 180$. Black, texture-resolved simulations, TX24 and TX35; red, slip-only simulations, SL24 and SL35; blue, simulations with amplitude-modulated forcing, FA24 and FA35; light blue, simulations with amplitude-modulated forcing using an a priori surrogate for the texture-coherent flow, FA24S and FA35S.

As a first step to explore the predictive capabilities of the amplitude-modulated forcing model, we study its performance when the texture-coherent flow from DNSs is replaced by the a priori surrogates of Adams (Reference Adams2021) for  $L^+\approx 24$ and
 $L^+\approx 35$. Results are shown in figures 16 and 17. Figure 16 shows excellent agreement in the r.m.s. velocity fluctuations, the Reynolds shear stress and
 $\Delta U^+$, except for an overshoot in
 $u'$ for the larger texture
 $L^+\approx 35$ in the immediate vicinity of the wall,
 $y^+\lesssim 15$. This is likely caused by the excessive intensity in
 $\tilde {u}_u$ in the surrogate texture-coherent flow, as mentioned above. The overshoot does nevertheless not propagate into the Reynolds stress or any of the other velocity components, and is also confined to a narrow region near the texture, so it essentially does not alter the drag or the near-wall dynamics and dissipation, mainly governed by cross-plane velocities induced by bursts and quasi-streamwise vortices (Ibrahim et al. Reference Ibrahim, Gómez-de-Segura, Chung and García-Mayoral2021; Habibi Khorasani et al. Reference Habibi Khorasani, Lācis, Pasche, Rosti and Bagheri2022; Jiménez Reference Jiménez2022). Similar results can also be observed in the spectral densities, shown for the three velocity components and the Reynolds shear stress at
 $y^+\approx 15$ in figure 17 for
 $L^+\approx 35$. The surrogate texture-coherent flow is able to produce an energetic signature in the same short wavelengths exhibited by texture-resolved simulations and those with forcing based on the a posteriori texture-coherent flow, and not present for smooth-wall or slip-only simulations. Although there is room for improvement, especially in the prediction of the near-wall peak in
 $u'$, these results suggest that the need to conduct simulations that resolve the texture can be fully circumvented, and that it is possible to resolve the background turbulence, and predict the drag and other flow properties using only a priori data on the texture detail, significantly reducing computational costs.
Spectral energy densities of the velocity fluctuations and the Reynolds shear stress at  $y^+ \approx 15$ for
 $L^+ \approx 35$ at
 $Re_{\tau } \approx 180$. Filled contours, texture-resolved simulation, TX35; red, slip-only simulation, SL35; blue, simulation with amplitude-modulated forcing, FA35; light blue, simulation with amplitude-modulated forcing using an a priori surrogate for the texture-coherent flow, FA35S.

5. Conclusions
The simulation and prediction of turbulence over textured surfaces require a spatial resolution that can be more demanding than that needed to resolve the turbulence itself, and can become prohibitive for texture sizes in the range  $L^+\approx 5\unicode{x2013}100$. This is a relevant range for applications, and includes the working range for drag-reducing textures and the transitionally rough range for drag-increasing ones, beyond which the effect on drag usually asymptotes. In this paper we have investigated the effect of the texture detailed geometry on the background turbulence, with the ultimate aim to sidestep the need to resolve that geometry directly. As a first approach, we have focused on a particularly simple, idealised texture, consisting of a slip/no-slip pattern on an otherwise flat surface, a popular model for superhydrophobic surfaces. Such slip/no-slip textures have some unique properties that simplify their analysis, namely that the effective boundary conditions for the overlying turbulence are well known and characterised, reducing to slip, Robin conditions for the tangential velocities and zero transpiration; and that the wall-normal velocity and Reynolds stress are zero at the reference, interfacial plane, and remain negligible in its vicinity. This allowed Fairhall et al. (Reference Fairhall, Abderrahaman-Elena and García-Mayoral2019) to identify that drag degraded due to additional Reynolds stresses occurring above the surface, rather than arising at the surface and propagating into the flow above. They proposed that such Reynolds stresses had to originate from the nonlinear interaction of the texture-coherent flow with the background turbulence. This interaction became significant and could not be neglected for
 $L^+\gtrsim 25$, and would need to be accounted for in any model in addition to the effective slip boundary conditions, which still held up in this range of sizes and at least up to
 $L^+\approx 50$,
Following up from Fairhall et al. (Reference Fairhall, Abderrahaman-Elena and García-Mayoral2019), we have analysed how the decomposition of the flow into texture-coherent and background-turbulence components propagates into the governing equations of the two components separately. We have first decomposed the flow using conventional triple decomposition, which produces a much simpler set of governing equations. However, as observed by Abderrahaman-Elena et al. (Reference Abderrahaman-Elena, Fairhall and García-Mayoral2019), this decomposition results in a residual texture-coherent signature in the background turbulence. To separate fully the texture-coherent signal and obtain a texture-incoherent background turbulence, Abderrahaman-Elena et al. (Reference Abderrahaman-Elena, Fairhall and García-Mayoral2019) proposed a decomposition in which the latter modulates in amplitude the former. Here we have analysed the governing equations for the background turbulence that result from this decomposition. For both the conventional and the amplitude-modulated triple decomposition, we have argued that the background turbulence is governed by Navier–Stokes equations with additional, forcing terms, arising from the cross-advective terms between both flow components.
To assess the above hypothesis, we have conducted a series of simulations in which the background turbulence was fully resolved, but the texture was replaced by the corresponding effective boundary conditions plus the forcing terms in the momentum equations mentioned above. For the formulation based on conventional triple decomposition, the results are partially improved compared with using effective boundary conditions alone. For the formulation based on the amplitude-modulated decomposition, the results show excellent agreement up to texture sizes  $L^+\approx 50$, and begin to deviate for
 $L^+\approx 70$. This is the case both for the prediction of drag and
 $\Delta U^+$, and for the statistical properties of turbulence, including r.m.s. velocity fluctuations, Reynolds stresses and mean velocity profiles. In particular, the addition of forcing terms can accurately generate fluctuations at shorter wavelengths than smooth-wall flows, which are present for geometry-resolved simulations but which the effective boundary conditions are unable to generate on their own. Once deviations begin to occur, for texture sizes
 $L^+\gtrsim 70$, they first manifest in the spanwise velocity component. This is also the component for which the flow decomposition first begins to break down, likely due to the span of background-turbulence eddies becoming comparable to the texture size earlier than their length, which disrupts the implicit assumption of separation of scales embedded in the amplitude-modulated decomposition. Concurrently, the texture-coherent motions excited not only by the overlying streamwise velocity, but also by the cross-velocity components, cease to be negligible, and therefore our simplifications in the forcing also cease to hold.
The above results strongly suggest that the key effects of surface texture on the overlying turbulence are imposing a set of effective boundary conditions but, critically, also altering the momentum equations through the nonlinear interaction with the texture-coherent flow in the advective terms. While this is useful in terms of identifying physical mechanisms, it falls short in terms of predictive power, as quantifying that interaction requires prior knowledge of the texture-coherent flow, but the latter only becomes available from the post-processing of fully resolved flows. We have therefore also explored the possibility of using a priori surrogates for the texture-coherent flow, based on the laminar steady flow about a single periodic unit of texture. Preliminary results show good agreement, motivating further work.
The present study has only considered a particularly simple type of surface texture. The results are encouraging, but would need to be further tested in more complex and general textures, mainly roughness. Many of the simplifications possible here, e.g. the effective boundary conditions reducing to homogeneous slip and zero transpiration, or accounting only for the texture-coherent flow induced by the overlying streamwise velocity, will likely not apply in the general case, calling for a more complete and complex framework.
Acknowledgements
Computational resources were provided by the University of Cambridge Research Computing Service under EPSRC Tier-2 grant EP/P020259/1, and by the UK ‘ARCHER2’ system under PRACE (DECI-17) project pr1u1702 and EPSRC project e776.
Declaration of interests
The authors report no conflict of interest.
Appendix A. Magnitude of the forcing term and the residual in the momentum equations
This appendix portrays evidence of the relative importance of the forcing term  $\boldsymbol {N}'_{\boldsymbol {b}}$ and the residual
 $\boldsymbol {R}$ in (2.16). The residual is neglected in the governing equations of the simulations presented in § 4 with forcing based on the amplitude-modulated decomposition, and it therefore needs to be small for the proposed model to hold. Conversely, if the magnitude of
 $\boldsymbol {N}'_{\boldsymbol {b}}$ was small, we would expect that retaining this term had little effect on the dynamics of the background turbulence.
Time–r.m.s intensity  $\psi _x'$ of the terms in the streamwise component of the momentum equation derived for the background turbulence assuming amplitude-modulated texture-coherent flow, (2.16), for the case of collocated texture with
 $L^+\approx 35$. Blue, advective term; green, viscous term; light blue, pressure-gradient term; red, temporal-derivative term; magenta, nonlinear forcing term
 $\boldsymbol {N}'_{\boldsymbol {b}}$; thick black, residual
 $\boldsymbol {R}$.

Figures 18–20 portray the time–r.m.s. magnitude of the different terms in (2.16) from the texture-resolved simulation of collocated posts with texture size  $L^+\approx 35$ (case TX35). The figures portray results for the streamwise, wall-normal and spanwise components of the momentum equation, respectively, for a representative set of
 $x$–
 $z$ wavenumbers and as a function of height
 $y$. The figures show that the dynamics is mostly dominated by the interplay between temporal and advective terms, but in the vicinity of the wall, for
 $y^+ \lesssim 10$, the forcing term, which is neglected in slip-only simulations, can become comparable to, and even larger than, the latter two. This is particularly the case for the streamwise momentum equation, as illustrated by figure 18, and across the whole range of wavelengths. For the spanwise and wall-normal momentum equations, the explicit contribution of
 $\boldsymbol {N}'_{\boldsymbol {b}}$ appears to be less significant. In turn, the residual is also negligible in the spanwise and wall-normal momentum equations. It is typically a fraction of
 $\boldsymbol {N}'_{\boldsymbol {b}}$ of order 1/4–1/3 in the streamwise one, and thus reasonably smaller than the leading-order terms. These results back up neglecting
 $\boldsymbol {R}$ when implementing the amplitude-modulated forcing model in § 4.
Time–r.m.s intensity  $\psi _y'$ of the terms in the wall-normal component of the momentum equation derived for the background turbulence assuming amplitude-modulated texture-coherent flow, (2.16), for the case of collocated texture with
 $L^+\approx 35$. Blue, advective term; green, viscous term; light blue, pressure-gradient term; red, temporal-derivative term; magenta, nonlinear forcing term
 $\boldsymbol {N}'_{\boldsymbol {b}}$; thick black, residual
 $\boldsymbol {R}$.

Time–r.m.s intensity  $\psi _z'$ of the terms in the spanwise component of the momentum equation derived for the background turbulence assuming amplitude-modulated texture-coherent flow, (2.16), for the case of collocated texture with
 $L^+\approx 35$. Blue, advective term; green, viscous term; light blue, pressure-gradient term; red, temporal-derivative term; magenta, nonlinear forcing term
 $\boldsymbol {N}'_{\boldsymbol {b}}$; thick black, residual
 $\boldsymbol {R}$.

Appendix B. Simulations for staggered-post textures
Figures 21 and 22 portray results from the simulations for staggered-post configurations, as sketched in figure 4. The aim of these simulations was to verify if the forcing model using amplitude-modulated decomposition, first tested for a collocated-post texture, would also be applicable to other surface arrangements. In addition to simulations fully resolving the texture and simulations with forcing, we have also conducted simulations implementing slip boundary conditions alone, to serve as a benchmark for comparison. These simulations complement and expand the dataset of Fairhall et al. (Reference Fairhall, Abderrahaman-Elena and García-Mayoral2019).
The r.m.s. velocity fluctuations, shear Reynolds stress and mean velocity profile for staggered-post textures with  $L^+\approx 35\unicode{x2013}70$. Black, texture-resolved simulations; red, slip-only simulations; blue, simulations with forcing based on amplitude-modulated decomposition.

We have conducted simulations for texture sizes  $L^+\approx 35$,
 $50$ and
 $70$, aiming to span the size range for which slip-only simulations begin to deviate from texture-resolved ones, yet the texture size is not large enough for the decomposition and the forcing model to break down. The simulation parameters and resulting roughness functions are listed in table 1.
The results follow the same trends as for the collocated-textures cases. Figure 21 shows that the r.m.s. velocity fluctuations for texture-resolved simulations exhibit differences from the slip-only ones, which display smooth-wall-like turbulence (Fairhall et al. Reference Fairhall, Abderrahaman-Elena and García-Mayoral2019; Ibrahim et al. Reference Ibrahim, Gómez-de-Segura, Chung and García-Mayoral2021). These differences are small for  $L^+\approx 35$, but become increasingly pronounced for larger texture sizes. Their most salient features are a decrease in near-wall peak
 $u'$ and an increase in
 $v'$ and
 $w'$. These differences eventually result in a significant increase in the shear Reynolds stress, and a corresponding downward shift of the mean velocity profile away from the wall. The forcing model is able to accurately capture these differences, and produces results very close to those of texture-resolved simulations, with small deviations first appearing in
 $w'$, as discussed in § 4 for collocated textures.
The spectral densities portrayed in figure 22 are also consistent with the observations in § 4 for collocated textures. Compared with smooth-wall turbulence, texture-resolving simulations have additional energy particularly in shorter scales in the streamwise direction. Slip-only simulations are not able to produce this modification in turbulence, and their spectrum remains essentially smooth-wall-like as discussed in Fairhall et al. (Reference Fairhall, Abderrahaman-Elena and García-Mayoral2019) and Ibrahim et al. (Reference Ibrahim, Gómez-de-Segura, Chung and García-Mayoral2021). In contrast, the forcing model is able to produce the spectral energy densities of texture-resolved simulations with excellent agreement.
Appendix C. Effect of Reynolds number
The main set of simulations discussed in this paper were conducted at  $Re_{\tau } \approx 180$. To verify that our observations would scale out to other Reynolds numbers, we have conducted a reduced set of simulations at
 $Re_{\tau } \approx 400$, otherwise matching in inner scaling set-ups from the main set, with results shown in figures 23 and 24. We have chosen the collocated layouts with
 $L^+ \approx 35$ and
 $L^+ \approx 100$, as one texture size for which the texture-resolved and the forcing simulations show good agreement between them, but differences from the slip-only simulation, and one texture size for which the forcing model shows signs of breaking down.
Spectral energy densities of the velocity fluctuations and the Reynolds shear stress at  $y^+ \approx 15$ for staggered texture arrangements. Shaded contours, texture-resolved simulations; red, slip-only simulations; blue, simulations with forcing based on amplitude-modulated decomposition.
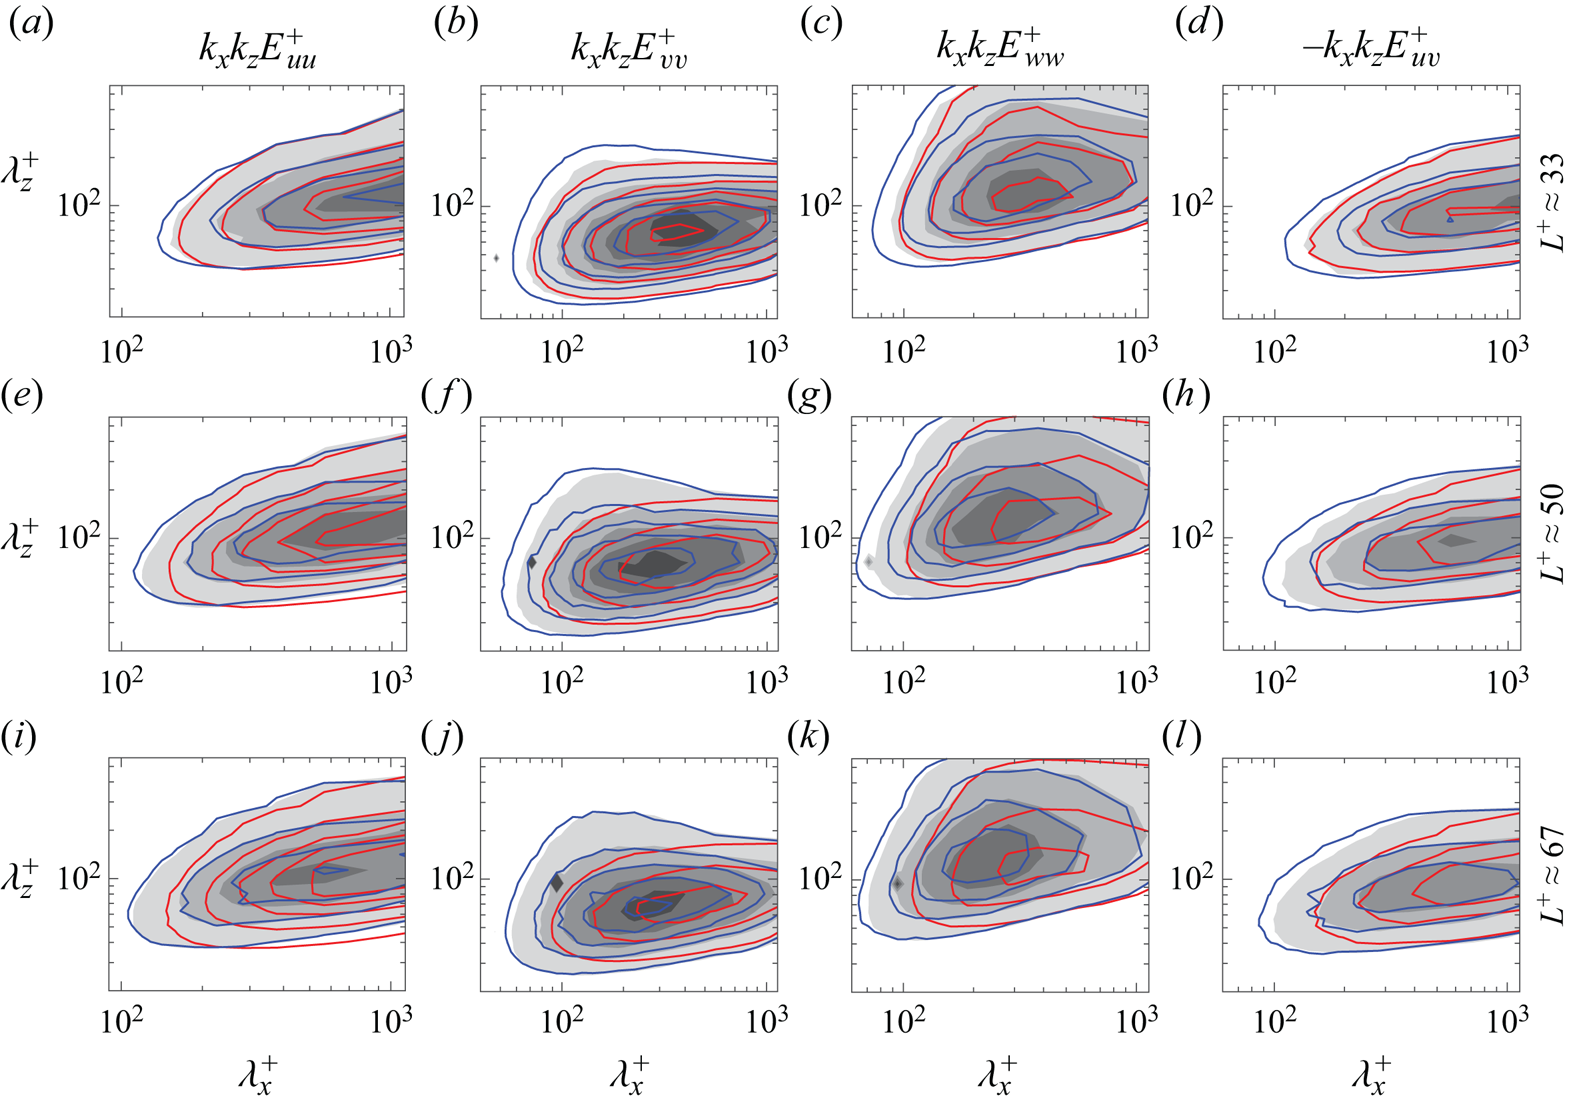
The r.m.s. velocity fluctuations, shear Reynolds stress and mean velocity profile for simulations at  $Re_{\tau } \approx 180$ (solid) and
 $Re_{\tau } \approx 400$ (dashed). Black, TX35; black dashed, TX35H; red, SL35; red dashed, SL35H; blue, FA35; blue dashed, FA35H.

Spectral energy densities of the velocity fluctuations and the Reynolds shear stress at  $y^+ \approx 15$ for
 $L^+ \approx 35$ and
 $L^+ \approx 100$ at different
 $Re_{\tau }$. Grey filled contours, texture-resolved simulations at
 $Re_{\tau } \approx 180$; black, at
 $Re_{\tau } \approx 400$. Blue filled contours, simulations with forcing based on amplitude-modulated decomposition at
 $Re_{\tau } \approx 180$; blue, at
 $Re_{\tau } \approx 400$.

The results are consistent with our usual observations for other surface topologies (García-Mayoral & Jiménez Reference García-Mayoral and Jiménez2012; Fairhall et al. Reference Fairhall, Abderrahaman-Elena and García-Mayoral2019; Sharma & García-Mayoral Reference Sharma and García-Mayoral2020a,Reference Sharma and García-Mayoralb; Hao & García-Mayoral Reference Hao and García-Mayoral2024). Near the wall, the same effects are produced in inner units for matching simulations, with results eventually collapsing to smooth-wall data at equal  $Re_{\tau }$ for
 $y^+\gtrsim 50$. Differences in this region are observable, but entirely attributable to the variations in
 $Re_{\tau }$, as they are the same observed for smooth-wall flows (Moser, Kim & Mansour Reference Moser, Kim and Mansour1999). These are evidenced for instance in the higher peak levels of the r.m.s. velocity fluctuations and the shear Reynolds stress near
 $y^+\gtrsim 25$, as shown in figure 23. The spectral densities portrayed in 24 confirm these results. The spectral energy content at each wavelength matches when scaled in inner units for corresponding simulations, with larger-scale content only resolved for the higher
 $Re_{\tau } \approx 400$, as made possible by the larger simulation domain. Overall, the results suggest that the effect of the model, like the effect of the texture, scales in inner units as expected, and can be extrapolated to and used at different Reynolds numbers.


 Open access

