INTRODUCTION
Foraging is an essential part of the natural history of any animal as it is directly associated with its own survival (Stephens et al. Reference STEPHENS, BROWN and YDENBERG2007). Foraging involves energy and time costs as well as predation and other risks and animals tend to optimize foraging behaviour by making an appropriate choice of food patch, time of visit, time spent on a patch and time division between feeding and vigilance (Beauchamp Reference BEAUCHAMP2003, Reference BEAUCHAMP2015; Frid Reference FRID1997, Parker & Maynard Smith Reference PARKER and MAYNARD SMITH1990, Treves Reference TREVES2000). A different set of vigilance behaviours might be needed while facing ambush hunters such as tiger or leopard versus cursorial/endurance hunters such as wild dog and wolf (Wikenros et al. Reference WIKENROS, KUIJPER, BEHNKE and SCHIMDT2015). Changes in vigilance of a few mammal and bird species have been studied in the presence or absence of natural predators, humans or degree of disturbance in habitat (Eisenberg et al. Reference EISENBERG, HIBBS, RIPPLE and SALWASSER2014, Hunter & Skinner Reference HUNTER and SKINNER1998, Li et al. Reference LI, ZHOU, XU, ZHAO and BEAUCHAMP2015, Wang et al. Reference WANG, LI, BEAUCHAMP and JIANG2011). However, it is not known whether a given herbivore population shows different sets of vigilance behaviours in habitats with different risks. Herbivores face trade-offs while being vigilant. Excessive vigilance decreases vulnerability but reduces feeding opportunities (Beauchamp Reference BEAUCHAMP2008, Frid Reference FRID1997). Vigilance required by an individual changes with herd size (Beauchamp Reference BEAUCHAMP2015, Frid Reference FRID1997, Namgail Reference NAMGAIL2007, Shorrocks & Cokayne Reference SHORROCKS and COKAYNE2005). Multiple factors including forage density, quality, interspecific and intraspecific competition and the nature of risk are likely to govern the foraging behaviour (Stephens et al. Reference STEPHENS, BROWN and YDENBERG2007).
A wide diversity of herbivores forage on agricultural lands adjacent to wild habitats (Bayani et al. Reference BAYANI, TIWADE, DONGRE, DONGRE, PHATAK and WATVE2016, Chiyo et al. Reference CHIYO, LEE, MOSS, ARCHIE, HOLLISTER-SMITH and ALBERTS2011, Fernando et al. Reference FERNANDO, WIKRAMNAYAKE, WEERKOON, JAYASINGHE, GUNAWARDENE and JANAKA2005, Hill Reference HILL1997, Rode et al. Reference RODE, CHIYO, CHAPMAN and MCDOWELL2006). This has been studied as a patch choice problem in optimal foraging (Watve et al. Reference WATVE, BAYANI and GHOSH2016a). The risks faced while foraging are an important determinant of patch choice. Animals are known to change feeding patches as per the photoperiod, and thereby showing significant change in habitat use during day and night (Brown Reference BROWN1999, Lashley et al. Reference LASHLEY, CHITWOOD, BIGGERSTAFF, MORINA, MOORMAN and DePERNO2014, Valeix et al. Reference VALEIX, LOVERIDGE, CHAMAILLE-JAMMES, DAVIDSON, MURINDAGOMO, FRITZ and MACDONALD2009). Herbivores change their activity patterns mainly to avoid predators (Bender et al. Reference BENDER, BAYNE and BRIGHAM1996, Brown et al. Reference BROWN, BRYNTESSON, COOPER, NYHOLM, ROBERTSON, BEDFORD, HENDRICKS, KLIPPENSTEIN, POTAPOV, DIVISION, COLLEGE and ATHYN2011, Cozzi et al. Reference COZZI, BROEKHUIS, MCNUTT, TURNBULL, MACDONALD and SCHMID2012, Penteriani et al. Reference PENTERIANI, KUPARINEN, DELGADO, DEL, LOURENÇO and CAMPIONI2011, Thaker et al. Reference THAKER, VANAK, OWEN, OGDEN and SLOTOW2010, Valeix et al. Reference VALEIX, LOVERIDGE, CHAMAILLE-JAMMES, DAVIDSON, MURINDAGOMO, FRITZ and MACDONALD2009). Species such as elephant (Elephas maximus Linn.), nilgai (Boselaphus tragocamelus Pallas), chital (Axis axis Erxleben), blackbuck (Antilope cervicapra Linn.), wild pig (Sus scrofa Linn.) and Indian wild ass/khur (Equus hemionus khur Lesson) visit agricultural lands almost exclusively at night (Bayani et al. Reference BAYANI, TIWADE, DONGRE, DONGRE, PHATAK and WATVE2016, Jhala Reference JHALA1993, Mehta Reference MEHTA2014, Shah & Qureshi Reference SHAH and QURESHI2007, Singh Reference SINGH1995, Sukumar Reference SUKUMAR1989). Nocturnal activity of herbivores is likely to be affected by lunar cycles and moonlight intensity (Beauchamp Reference BEAUCHAMP2007, Beauchamp & McNeil Reference BEAUCHAMP and McNEIL2003, Lashley et al. Reference LASHLEY, CHITWOOD, BIGGERSTAFF, MORINA, MOORMAN and DePERNO2014, Penteriani et al. Reference PENTERIANI, KUPARINEN, DELGADO, DEL, LOURENÇO and CAMPIONI2011). Higher predation of the snowshoe hare (Lepus americanus) was demonstrated on moonlit nights (Griffin et al. Reference GRIFFIN, GRIFFIN, WAROQUIERS and MILLS2005). The African elephant (Loxodonta africana) seems to feel safe for raiding crops on moonless nights (Barnes et al. Reference BARNES, DUBIURE, DANQUAH, BOAFO, NANDJUI, HEMA and MANFORD2006, Gunn et al. Reference GUNN, HAWKINS, BARNES, MOFULU, GRANT and NORTON2013). Nilgai is a major crop raiding species in northern peninsular India (Bayani et al. Reference BAYANI, TIWADE, DONGRE, DONGRE, PHATAK and WATVE2016, Chauhan & Sawarkar Reference CHAUHAN and SAWARKAR1989, Sekhar Reference SEKHAR1998). As nilgai forage in forests as well as on agricultural lands, its behaviour is likely to be different in different habitats. We studied the herding, time choice and vigilance behaviour of nilgai while foraging in the wild versus foraging on agricultural crops to see whether the nilgai exhibits behavioural plasticity in foraging optimization facing differential risk in the two habitats. The major predator of nilgai in forest is the tiger which is a low-density ambush predator and on agricultural lands the major threat is from humans who guard their farms at night in much higher densities than tigers and are more conspicuous. We hypothesize that in response to a higher encounter rate, the nilgai will show higher vigilance frequency while foraging on farms compared with forest but remain vigilant for shorter duration each time it looks for a threat.
STUDY SITE
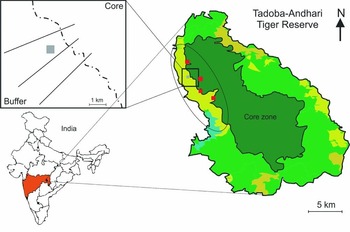
The Tadoba–Andhari Tiger Reserve (TATR, 19°59′–20°29′N, 79°11′–79°40′E) is located in Chandrapur district of Maharashtra, India. The Tiger Reserve extends over 1727 km2 out of which 625.5 km2 is the core zone (Figure 1). TATR is a teak- (Tectona grandis L.f.) dominated mixed forest of deciduous trees including Diospyros melanoxylon Roxb., Terminalia elliptica Willd., Butea monosperma (Lam.) Taub., Chloroxylon swietenia DC., Anogeissus latifolia Roxb. and bamboo (Dendrocalamus sp. and Bambusa sp.) supporting good faunal diversity. There are interspersed grasslands in the forested areas that are abundant in palatable grasses such as species of Aristida, Andropogon, Chrysopogon, Cynodon, Heteropogon, Ischaemum and Themeda. Certain peripheral areas also have good density of browsing species such as Acacia (Vachellia) nilotica (L.) P. J. H. Hurter & Mabb., Acacia (Vachellia) leucophloea (Roxb.) Maslin, Seigler & Ebinger and Prosopis juliflora (Sw.) DC. The nilgai co-exists with other medium- to small-sized herbivores like sambar deer (Rusa unicolor Kerr), chital or spotted deer (A. axis) and wild pig (S. scrofa). Carnivore species include tiger (Panthera tigris Linn.), leopard (Panthera pardus Linn.) and dhole (Cuon alpinus Pallas).
Study site: Tadoba-Andhari Tiger Reserve present in eastern part of Maharashtra state (shown by black dot in orange shaded area), India. Dark green area represents the core zone, light green and yellow area represents divisional forest areas of buffer zone, majority of which is agricultural lands, blue is backwater of dam on the river Erai. Total sampling area on the western boundary is denoted by ellipse, within which the wild foraging grounds (shown by red squares) of the nilgai and the experimental farm (shown by grey square in zoomed in square) lie. The lines in zoomed-in square show the three transects through agricultural areas.

We selected the western boundary buffer area of the reserve where through most of the length, the transition between forest cover and agriculture lands creates a sharp ecotone. No forest cover is available once the agricultural zone begins and the animals almost invariably retreat to the forest during daytime and forage on agricultural crops only at night.
Cropping patterns
Crops are cultivated in two seasons, viz. monsoon (July–October) and post-monsoon (November–March). Rice (Oryza sativa L.) and soybean (Glycine max (L.) Merr.) are the primary monsoon crops whereas wheat (Triticum aestivum L.) and chickpea (Cicer arietinum L.) are primary post-monsoon crops. Apart from these, cotton (Gossypium arboretum L.), turmeric (Curcuma longa L.), flax or linseed (Linum usitatissimum L.) and grass pea or sweet blue pea (Lathyrus sativa L.) are other secondary crops taken in comparatively lesser extent. Crops between the months March and May are not taken in the study area.
STUDY SPECIES
The nilgai is the largest antelope species in Asia. This endemic species is widespread in the northern peninsular of India and occupies a diversity of habitats (Ahrestani et al. Reference AHRESTANI, HEITKÖNIG, VAN LANGEVELDE, VAIDYANATHAN, MADHUSUDAN and PRINS2011, Leslie Reference LESLIE2008, Sankar Reference SANKAR1994, Singh Reference SINGH1995). It is usually seen distributed on the periphery of forests and frequently forages on agricultural lands (Bagchi et al. Reference BAGCHI, GOYAL and SANKAR2003a, Reference BAGCHI, GOYAL and SANKARb; Singh Reference SINGH1995). This species is also an important prey species for predators residing at the periphery of forest, constituting more than 15% of tiger diet as observed in the study area (unpubl. data). It is ranked highest as a crop raider, in a majority of the areas in India (Bayani et al. Reference BAYANI, TIWADE, DONGRE, DONGRE, PHATAK and WATVE2016, Karanth et al. Reference KARANTH, GOPALASWAMY, PRASAD and DASGUPTA2013, Watve et al. Reference WATVE, PATEL, BAYANI and PATIL2016b).
METHODS
Aspects of nilgai behaviour relevant to the question were observed using three methods of searching or detecting the herds.
General sampling methods
Transects
Three independent 4-km-long transects were laid which started from the forest edge and moved away into agricultural lands. Each transect was walked in night hours between 18h00 and 00h00 twice a month in November 2013–February 2014 and November 2014–February 2015 covering a total transect length of 192 km. GPS location was noted at every sighting (±2 m accuracy using Garmin60). Transect sampling was not possible during monsoon months and was not relevant in the non-crop months of the year. Along the same transects pellet heaps of nilgai were recorded along with the area of spread. Also, we counted the number of different detectable types of pellets in the given heap in terms of pellet size and shape.
Observations on frequented wild foraging grounds
Initial ad hoc observations identified four frequently used foraging grounds of nilgai in the wild, where they could be regularly observed without any obstacle or disturbance from cattle herders. These were used for documenting foraging behaviour in the forest during 13h00–19h00 in the period of November 2012–March 2013, November 2013–March 2014 and November 2014–February 2015.
Observations on an experimental farm
An experimental farm, marked to study the effect of wild herbivores on crop yields (see Bayani et al. Reference BAYANI, TIWADE, DONGRE, DONGRE, PHATAK and WATVE2016 for details), was used for studying foraging behaviour on agricultural lands. The experimental farm was a cultivated land of area 0.4 ha, c. 600 m away from the forest boundary and exposed to herbivores without any fencing or guarding. Nilgai herds were awaited every night between 18h00 and 01h00, and observed from a 3-m-tall wooden hide-cum-watchtower. Since no crops are cultivated between March and June in this area, and observations at night on farms during rains were often difficult to record, sufficient behavioural data could be recorded only during the post-monsoon seasons of the years 2012–2013, 2013–2014 and 2014–2015.
Since the general pattern of nilgai movement was that individuals spent the daytime in the forest cover and moved to agricultural lands at night, observations in the wild were possible between 13h00 and 19h00. After 19h00 sighting of animals on the wild foraging grounds was infrequent. The experimental farm was visited almost exclusively at night and observations were made between 18h00 and 01h00. For observations in forest as well as experimental farm, no artificial lights were used to avoid possible effects on behaviour. Search lights were used during transects but these data were used only for herd size and composition, and not for analysis of behaviour.
Behavioural sampling methods
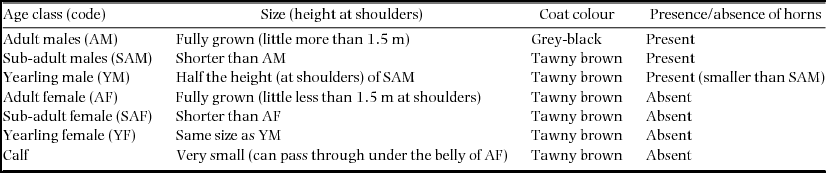
In all the three above approaches, instantaneous scans (Altmann Reference ALTMANN1973) were used on first detection of animals to record herd size, sex and age structure (Table 1), an index of ‘compactness’ (Ghuman Reference GHUMAN2009) and animal activity. For the nilgai herds observed on wild foraging grounds and experimental farm, we allowed a settling time of 5–10 min for every herd before beginning the observations. This was necessary to minimize a change in behaviour in response to possible detection of the observer.
Morphological key used for the nilgai herd composition.

For every herd observed in forest and on an experimental plot, sighting distance (from observer) to leftmost individual, rightmost individual, and sighting angle between those two arms were recorded using rangefinder and magnetic compass respectively. These measurements were used to calculate the diameter of the herd's spread and the area of the imaginary circle that can be thought of as the spread of a herd. The herd size divided by this calculated area of spread was used as an estimate of compactness to understand how closely the individuals are packed in a given herd at a given time. Higher compactness index reflected smaller inter-individual distance. Whenever possible, diameter was directly measured using measuring tape after individuals left the feeding place. Herding behaviour was studied during monsoon and post-monsoon seasons of years 2012, 2013 and 2014.
We followed focal-animal sampling (Altmann Reference ALTMANN1973) with continuous recording wherein one individual from a given herd was observed for 15 min or until the focal individual went out of sight, whichever occurred first. If a herd remained in the same place after 15 min, another instantaneous scan of the entire herd was performed followed by focal sampling of a different individual. This was done only on three occasions throughout the data. Any stance of animal with neck at or above shoulder level and not browsing was recorded as vigilance behaviour. Actual feeding included both grazing and browsing during which the time spent in feeding as well as bite counts was recorded. We abandoned observations whenever there was disturbance by other anthropogenic activities such as cattle herding. Time utilized for each behaviour was recorded using a digital wristwatch. The number of times the focal animal attained ‘head-up’ behaviour except browsing was recorded as the frequency of attaining an alert position per unit observation time (vigilance frequency). Unit scan duration, i.e. the time for which an alert position was retained was recorded. Since nilgai herds observed on agricultural lands were female-biased and occurrence of males on farms was relatively infrequent, we could not obtain sufficient sample size of male observations for comparison between forest and farm, and hence we compare here behaviour only of adult females. Based on the focal-animal sampling, we calculated proportion (%) of time utilized in vigilance, further expressed as total scan duration.
Lunar cycles and foraging during post-monsoon season
To study the effect of ambient light intensity on nocturnal activity of nilgai on agricultural lands, we studied crop-raiding frequencies as a function of moon phase (and in turn the ambient light intensity associated with each moon phase). All the moon phases were ranked 0 to 16, 0 representing no moon, whereas 16 was full moon. To avoid any bias and deficit in direct observations, we used indirect signs of presence/absence of nilgai by looking for fresh hoofmarks, fresh pellets (within 50 m in any direction) and visible damage the following morning. These observations were not made during the monsoon since moonlight is variably affected by clouds, night-time observations are difficult during rains and also the signs can be perturbed by rains.
Statistical analysis
Since the distribution of herd size is positively skewed, we used non-parametric methods to compare herd-related parameters across seasons and habitats. The frequency of acquiring vigilant position (i.e. vigilance frequency) was considered to be randomly distributed and therefore Poisson distribution was assumed. For large sample sizes the normal approximation of Poisson was used assuming mean and variance to be equal. Based on this distribution the vigilance frequency in forest versus farm foraging was compared with log likelihood ratios. The unit scan durations were compared using non-parametric tests.
RESULTS
Seasonal and habitat wise changes in the herding strategies
Herd size
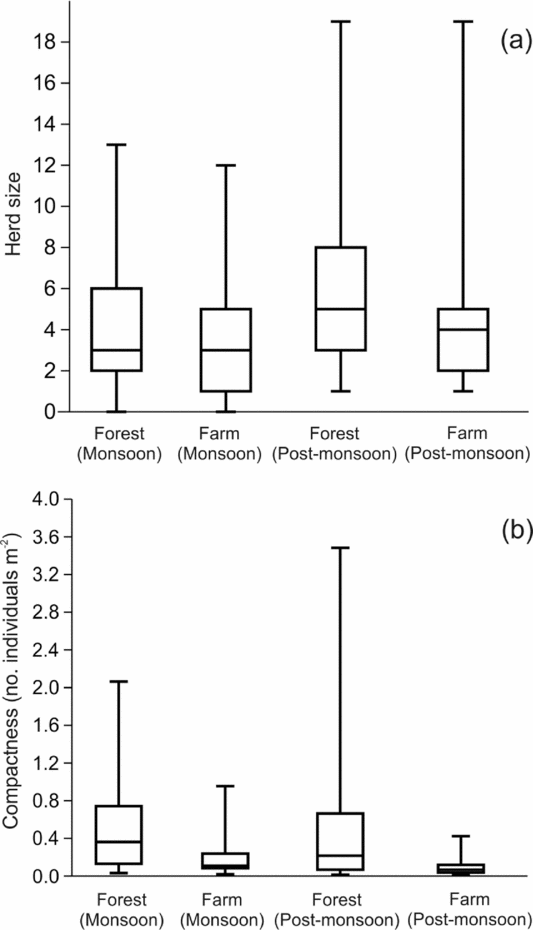
Herd size of nilgai in forest and farm across two seasons showed marked differences (Figure 2a). When comparing forest with farm after pooling from both the seasons, herd size was significantly larger in forest compared with farm (Mann–Whitney U-test, P < 0.0001, Medianforest = 5, nforest = 176, Medianfarm = 3, nfarm = 321). Similarly when pooled over two habitats, herd size was significantly larger in post-monsoon than in monsoon (Mann–Whitney U-test, P < 0.0002, Medianmonsoon = 3, nmonsoon = 146, Medianpost-monsoon = 4, npost-monsoon = 351). While foraging in forest the herd size was larger in post-monsoon compared with monsoon (Mann–Whitney U-test, P < 0.0003, Medianmonsoon = 3, nmonsoon = 64, Medianpost-monsoon = 5, npost-monsoon = 112) and the trend remained similar in farms (Mann–Whitney U-test, P < 0.002, Medianmonsoon = 3, nmonsoon = 82, Medianpost-monsoon = 4, npost-monsoon = 239). When compared for the season of monsoon, forest and farm do not show difference in median herd size, but by Mann–Whitney test the ranks for the forest are significantly higher than those in farm (Mann–Whitney U-test, P = 0.024, Medianforest = 3, nforest = 64, Medianfarm = 3, nfarm = 82). In the post-monsoon, herd sizes in forest were significantly larger than those on farms (Mann–Whitney U-test, P < 0.0001, Medianforest = 5, nforest = 112, Medianfarm = 4, nfarm = 239).
Herding behaviour of the nilgai observed in Tadoba-Andhari Tiger Reserve: Changes in herd size (number of individuals per herd) in monsoon, post-monsoon and forest, farm (a); difference in compactness index across seasons and habitats (b). The box represents interquartile range (IQR), middle line represents the median and whiskers represent range of the data.

Compactness across seasons and habitats
Nilgai herds seemed to keep greater inter-individual distance while foraging on crops compared with foraging in forests when pooled from both seasons, as reflected by the compactness index (Mann–Whitney U-test, P < 0.0001, Medianforest = 0.27 individuals m−2, Medianfarm = 0.09 individuals m−2, nforest = 83, nfarm = 117). This difference is not only evident across two different habitats, but also across seasons. The compactness was higher in the monsoon than in the post-monsoon (Mann–Whitney U-test, P < 0.0001, Medianmonsoon = 0.141 individuals m−2, Medianpost-monsoon = 0.095 individuals m−2, nmonsoon = 77, npost-monsoon = 123) (Figure 2b).
Spatial trends in herd size
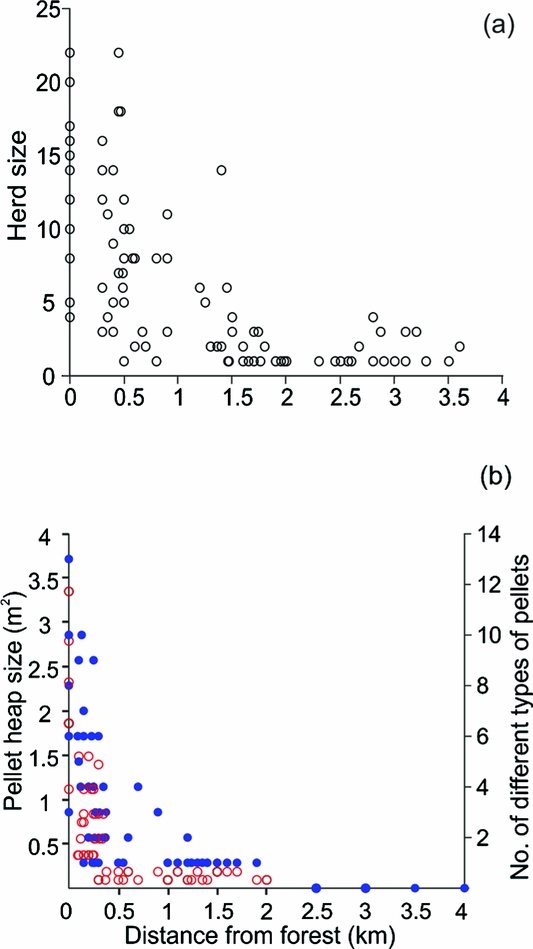
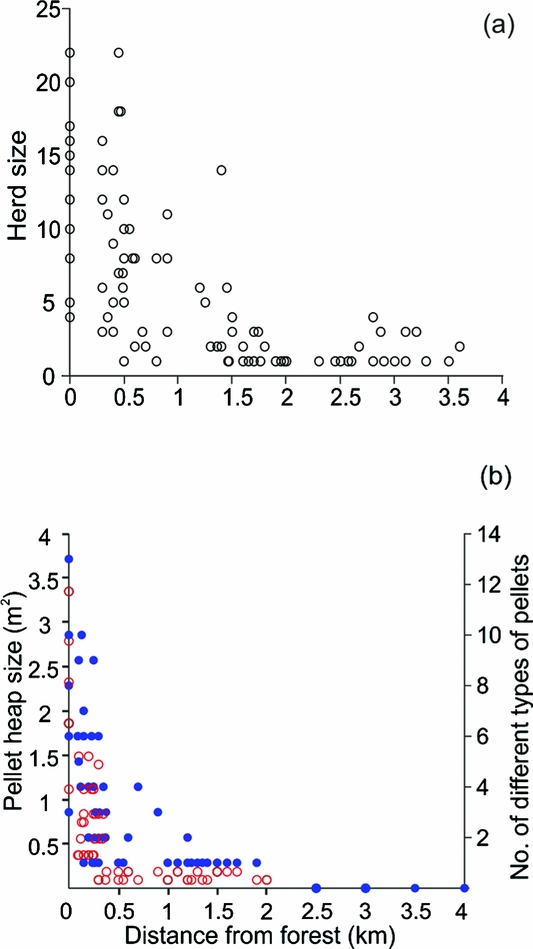
In the transect data, the herd size (Kendall's τ = −0.61, n = 123, P < 0.0001) (Figure 3a), heap size (Kendall's τ = −0.67, n = 69, P < 0.0001) and the number of different types of pellets observed in a heap (Kendall's τ = −0.69, n = 69, P < 0.0001) (Figure 3b) were observed to decline with distance from the forest.
Trends in the nilgai herd parameters with distance from forest in Tadoba–Andhari Tiger Reserve: Herd size (number of individuals) (Kendall's τ = −0.61, n = 123, P < 0.0001) (a); dung pellet heap size (Kendall's τ = −0.67, n = 69, P < 0.0001, open red circles), and number of different types of pellets per heap (Kendall's τ = −0.69, n =69, P < 0.0001, solid blue circles) (b).
Herd composition across seasons and habitats
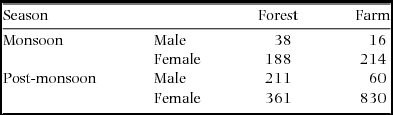
Nilgai population was always female-biased and the sex ratio was substantially different when compared across seasons and habitats (Table 2). When we compared sex ratio in two habitats we found that in monsoon, there were 4.94 females per male in forest and 13.4 females per male on farm (two-tailed Fisher's exact test, P = 0.001, nforest = 63 herds, nfarm = 81 herds). This difference was further more substantial in post-monsoon having 1.7 females per male in forest and 13.8 females per male on farm (two-tailed Fisher's exact test, P < 0.0001, nforest = 124 herds, nfarm = 238 herds). In forest there were 4.94 females per male in monsoon and 1.7 in post-monsoon (two-tailed Fisher's exact test P = 0.0001, nmonsoon = 63 herds, npost-monsoon = 124 herds). On farm alone, there were 13.4 females per male in monsoon compared with 13.8 in post-monsoon (two-tailed Fisher's exact test, P = 0.88, nmonsoon = 81 herds, npost-monsoon = 238 herds). This suggests that although males join female herds in post-monsoon, they seldom accompanied herds while raiding crops.
Adult sex ratio of the nilgai herds: number of males and females observed per herd in forest and on experimental farm in Tadoba–Andhari Tiger Reserve.

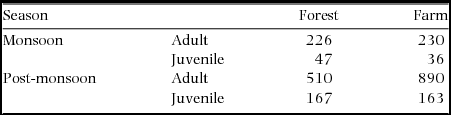
In the monsoon, the juveniles (yearlings and calves) and adults (adults and sub-adults) appear in farm in the same proportion as seen in forests (two-tailed Fisher's exact test P = 0.273, juvenile:adult ratio = 0.20 in forest and 0.15 in farm), however, this is substantially different in post-monsoon, in which juveniles visit farms less often (two-tailed Fisher's exact test, P < 0.0001, juvenile:adult ratio = 0.33 in forest and 0.18 in farm). In forest alone, the ratio of juvenile:adult in monsoon was 0.20 which was significantly lower than observed in post-monsoon i.e. 0.33 (two-tailed Fisher's exact test, P = 0.01). We observed no significant difference in this ratio when compared in farm alone between monsoon and post-monsoon, which in monsoon was 0.16 and in post-monsoon, 0.18 juveniles per adult individual (two-tailed Fisher's exact test, P = 0.5) (Table 3). Thus, it is evident that adults show a higher tendency of crop-raiding and presumably females with very young calves may avoid the risk.
Age class structure of the nilgai herds: Adults (adult + sub-adult) and juveniles (yearling + calf) observed per herd in forest and experimental farm in Tadoba–Andhari Tiger Reserve.

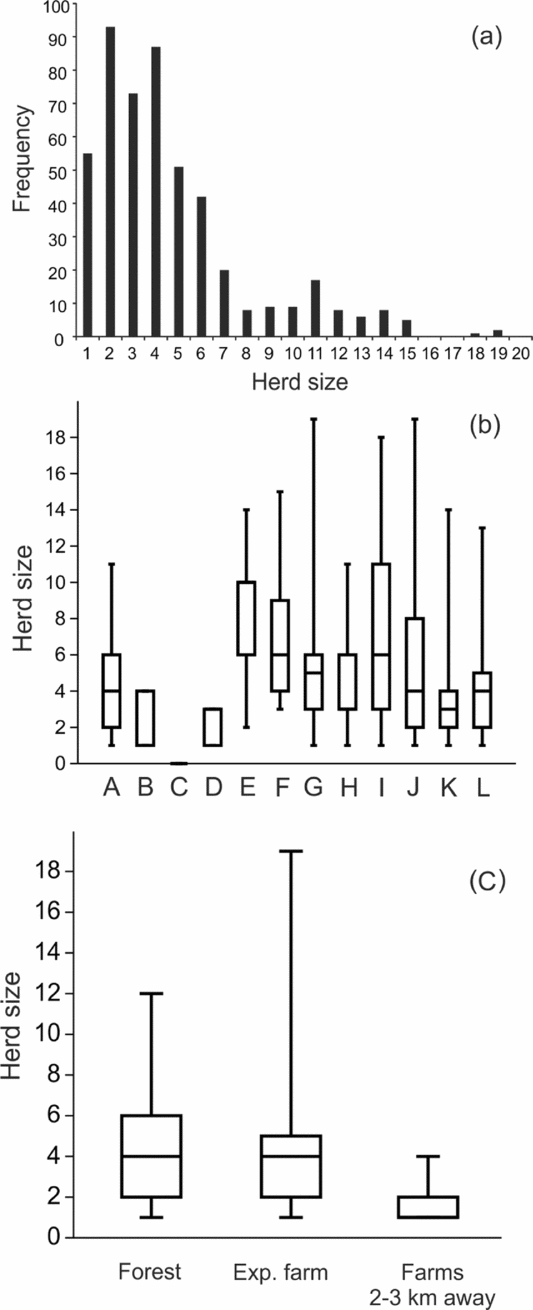
Although observation on the experimental farm and the frequented wild foraging grounds were confined to limited space and we did not make any attempt to identify individuals or herds, the large variance in the herd size across observations and absence of conspicuous bi- or multimodality in the distribution (Figure 4a) makes it unlikely that only one or a few herds were observed repeatedly. Since there was an inevitable difference in the time of observation in forest and farm it is also necessary to assess whether the observed difference in herd size was an effect of time or of habitat. The median herd size did have a significant temporal pattern (Figure 4b) showing larger herd sizes in daylight hours. In the time window between 18h00 and 19h00, we had sufficient observations in forest and agricultural lands and a comparison showed that the herd size difference remained significant (Figure 4c). Therefore, even if we assume that herd size differed with the time of the day, the effect of habitat was significant. It is likely on the other hand that the apparent effect of time on the herd size is contributed by the effect of habitat, since there is a temporal pattern in habitat use.
Distribution of the nilgai herds and effect of time and habitat observed in Tadoba-Andhari Tiger Reserve: Frequency distribution of herd sizes demonstrating wide variance and continuous distribution indicating diversity of herds under observation (a); herd sizes were significantly different at the different times of the day (A = 00h00–02h00, B = 02h00–04h00, C = 04h00–06h00, D = 06h00–08h00, E = 08h00–10h00, F = 10h00–12h00, G = 12h00–14h00, H = 14h00–16h00, I = 16h00–18h00, J = 18h00–20h00, K = 20h00–22h00, L = 22h00–00h00; Kruskal–Wallis test, H = 39.68, n = 462, P < 0.001) (b); herd sizes observed between 18h00 and 19h00 in forest, experimental farm and farms at 2–3 km from the forest show significant difference (Kruskal–Wallis test, H = 26.3, n = 127, P < 0.0001) showing that herd size varied according to habitats independent of time (c).

Variation in unit scan duration, total scan duration and vigilance frequency
In the instantaneous scan data, while foraging in forest, 78% of times (82 out of 105 scans) at least one individual was vigilant, compared with only 32% (28 out of 85 scans) on farms (two-tailed Fisher's exact test P < 0.0001). In instantaneous scans, on an average (± SD) 61.2% ± 26.8% individuals were seen feeding in forest, compared with 90.2% ± 19.3% on farm (n = 105 for forest, 86 for farm).
As observed in focal-animal sampling, the total scan duration (%) on farm was higher than in forest. The total scan duration of focal individuals in forest (Median = 38.9%, n = 91, IQR = 5–67.1%) was smaller than that observed on farms (Median = 53.1%, n = 52, IQR = 33.3–76.8%).
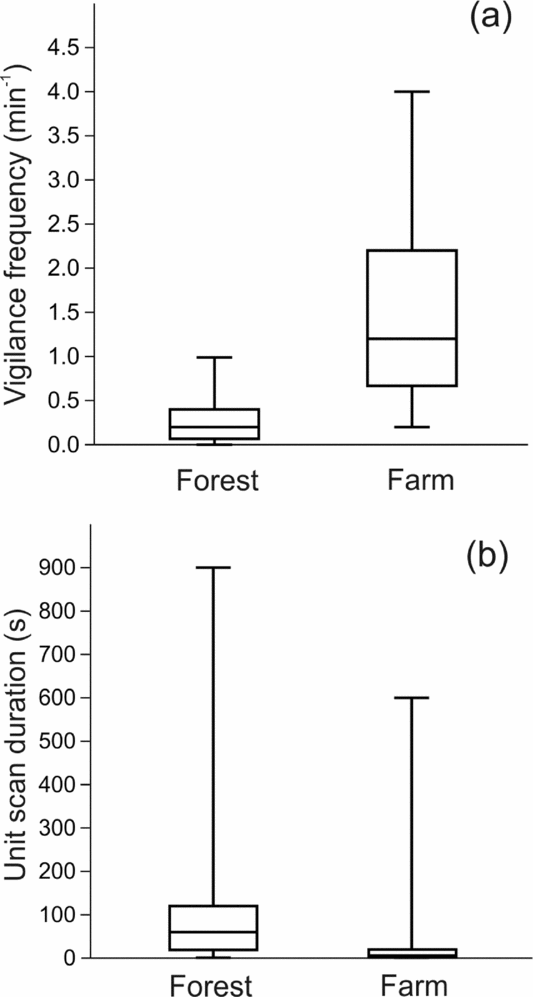
A marked difference in vigilance behaviour was that the median vigilance frequency was significantly greater on farms (1.4 min−1) as compared with forests (0.205 min−1) (Figure 5a), whereas the unit scan duration was significantly less on farm as compared with forest (Medianforest = 60 s, nforest = 269, Medianfarm = 6 s, nfarm = 403) (Figure 5b).
Difference in vigilance parameters of the nilgai observed in Tadoba–Andhari Tiger Reserve: Difference in vigilance frequency (min−1) (a); and unit time duration (s) in forest and farm in post-monsoon (b).

Since the time of the day when observations were made in forest and farm were not identical, the observed difference is likely to be contributed by the difference in time or that in habitats. In order to resolve between the two possibilities we compared the vigilance frequency and unit scan duration only during the overlapping time period i.e. between 18h00 and 19h00. We also tested whether the vigilance frequency and unit scan duration were significantly different in the forest or farms between the overlapping time and non-overlapping time. The vigilance frequency in forest was significantly less than that on farms not only when data were pooled over for all the time-periods (nforest = 260, frequencyforest = 0.205 min−1, nfarm = 406, frequencyfarm = 1.407 min−1, 2 × log likelihood ratio = 9.39, P = 0.002), but also in the overlapping time between 18h00 and 19h00 (nforest = 69, frequencyforest = 0.26 min−1, nfarm = 278, frequencyfarm = 1.44 min−1, 2 × log likelihood ratio = 9.39, P = 0.002). The difference in unit scan duration between farm and forest during the overlapping time window was also significant (medianforest = 60 s, medianfarm = 6 s, Mann–Whitney U = 3438.5, Z = −8.5, P = 0.0001). On the other hand, difference in vigilance frequency (n13h00–18h00 = 191, frequency13h00–18h00 = 0.19 min−1, n18h00–19h00 = 69, frequency18h00–19h00 = 0.26 min−1, 2 × log likelihood ratio = 3.39, P = 0.065) and unit scan duration (median13h00–18h00 = 60 s, median18h00–19h00 = 60 s, Mann–Whitney U = 6893.5, Z = −0.24, P = 0.8) was not significant in the forest during 13h00–18h00 versus 18h00–19h00. Similarly, difference in vigilance frequency (n19h00–01h00 = 128, frequency19h00–01h00 = 1.34 min−1, n18h00–19h00 = 278, frequency18h00–19h00 = 1.44 min−1, 2 × log likelihood ratio = 0.79, P = 0.37) and unit scan duration (median19h00–01h00 = 7 s, median18h00–19h00 = 6 s, Mann–Whitney U = 16875, Z = −0.46, P = 0.65) was also not significant on the farm during 19h00–01h00 versus during 18h00–19h00. This clearly shows that the difference in vigilance behaviour was an effect of habitat independent of the effect of time.
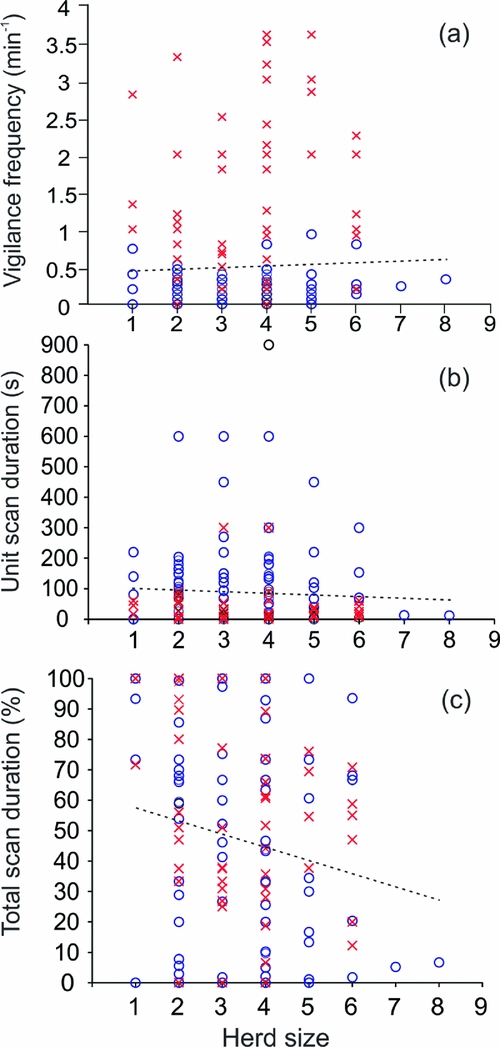
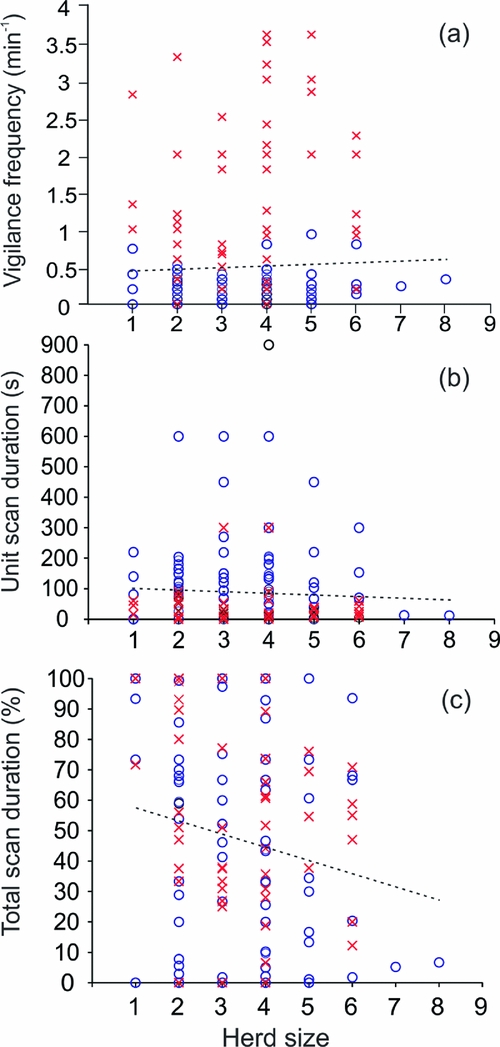
In order to test whether the difference in vigilance between habitats was a result of difference in herd size, we studied the relationship between herd size and vigilance behaviour in data pooled from the two habitats. Vigilance frequency and unit scan duration did not correlate to herd size significantly (Figure 6a, b). It can be clearly seen that the majority of the vigilance frequencies in forests lie below the best-fit regression line and those on farm above the line. Thus the difference in the two habitats exists independent of herd size. Unit scan duration had the opposite trend, the forest scan durations mainly lay above the line and farm scan durations below it. The total scan duration did correlate negatively to herd size (Figure 6c). In this case, there is no clear segregation along the y-axis according to habitat. It is possible therefore that the total scan duration is mainly influenced by herd size, but vigilance frequency and unit scan duration differ across the two habitats independent of herd size.
Effect of the nilgai herd size on vigilance parameters observed in Tadoba Andhari Tiger Reserve, open blue circles represents forest and red crosses represents farm. Dotted lines represent the regression lines. Vigilance frequency is not significantly correlated to herd size (Kendall's τ = 0.005, P = 0.9) (a); unit scan duration is not correlated with herd size (Kendall's τ = −0.08, P = 0.12) (b); total scan duration decreases significantly with herd size (Kendall's τ = −0.12, P = 0.03) (c).
Effect of moonlight on crop-raiding
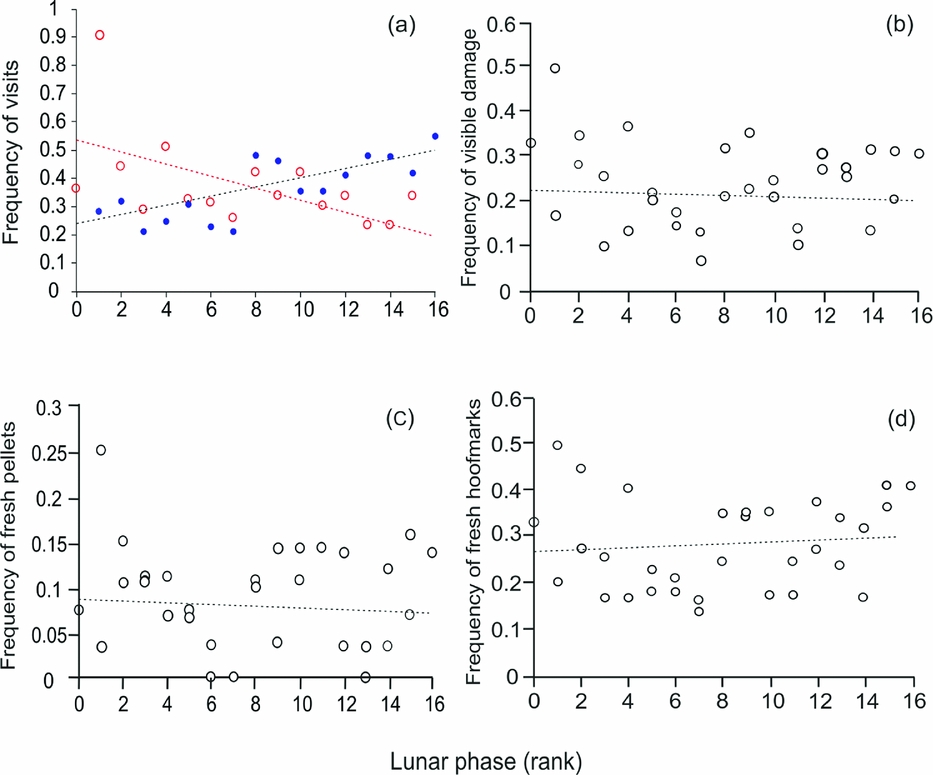
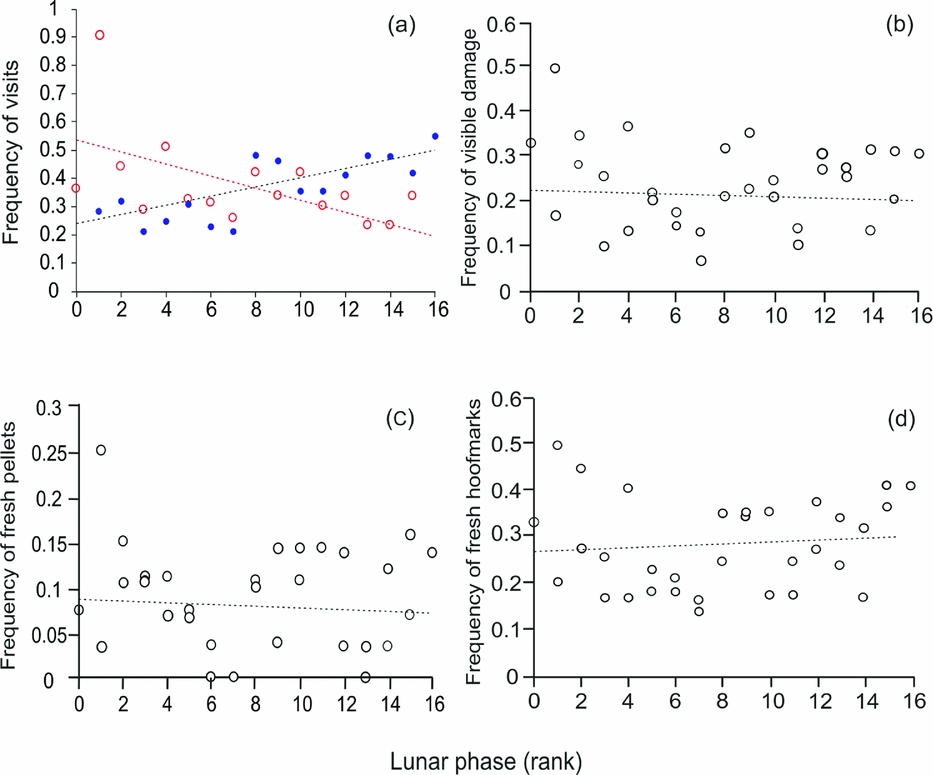
The experimental farm observations were grouped as with and without moonlight. Cloudy and therefore variably moonlit nights were excluded from the analysis. There were significant correlations between the lunar phase and the number of crop-raiding visits during the observation window. In the waning phase, the correlation was negative (Kendall's τ = −0.38, P = 0.04) and in the waxing phase it was positive (Kendall's τ = 0.53, P = 0.006) (Figure 7a). Since the observation window was in the first half of the night, in the waning phase it received progressively less moonlight whereas it received progressively more moonlight in the waxing phase. From these data it appears that nilgai actually preferred moonlit hours for raiding crops. However, a likely bias in these observations is that the chance of failing to observe could be greater in moonless hours. In the data on indirect signs of a nilgai visit seen the following morning, in the form of hoofmarks, fresh pellets and visible crop damage no correlations were significant (Figure 7b–d). It is possible that the frequency of crop-raiding per night does not depend on the lunar phases but within a given night they prefer moonlit hours. In any case the patterns observed are marginal and inconsistent, therefore moonlight cannot be said to be a major factor in determining crop-raiding behaviour by nilgai.
Trends in crop-raiding frequency of the nilgai with lunar phases (ranked) observed on experimental farm in Tadoba–Andhari Tiger Reserve: Direct observations in terms of frequency of visits, where red open circles represent waning phase (Kendall's τwaning = −0.38, nwaning = 15, P = 0.004) and blue solid circles represent waxing phase (Kendall's τwaxing = 0.53, nwaxing = 15, P = 0.006) (a); visible damage to the cultivated crops (Kendall's τ = −0.002, n = 30, P = 0.98) (b); fresh pellets (Kendall's τ = −0.025, n = 30, P = 0.83) (c); fresh hoofmarks (Kendall's τ = 0.112, n = 30, P = 0.36) (d). All the dotted lines represent regression lines, red dotted line is regression line for frequency of visits in waning phase.
In order to ensure that none of the patterns resulted from pseudoreplications, we repeated the analysis after removing the three occasions of a second scan followed by focal-animal sampling. This correction did not affect any of the observed patterns (data not shown).
DISCUSSION
A number of behavioural parameters of nilgai were significantly different while foraging in forest versus farms. It is possible that while raiding crops nilgai herds break into smaller groups which presumably reunite when they take to forest cover again. Alternatively the smaller groups may have a greater tendency to raid crops. What is more interesting is that at least in our limited sampling, the adult sex ratio changed substantially in the forest and farm. Males were seen less frequently raiding crops. This can be viewed in contrast to elephant species in which males have been reported to raid crops more frequently (Chiyo et al. Reference CHIYO, LEE, MOSS, ARCHIE, HOLLISTER-SMITH and ALBERTS2011, Sukumar & Gadgil Reference SUKUMAR and GADGIL1988). The reason for female-biased crop-raiding is not known at present. Newborn individuals were seen on farms disproportionately less often which may be a strategy to avoid exposing them to risks. These observations point to distinctly different herding behaviour on farms and forests. It has been observed in wide diversity of herbivore species that juvenile individuals ‘freeze’ or remain motionless to reduce detection from a potential predator (Huang et al. Reference HUANG, KANWAL, JIANG, LONG, LUO, YUE, GU and FENG2015, Jarman Reference JARMAN1974, Johnsingh Reference JOHNSINGH1980, Reference JOHNSINGH1983; Laurel & Brown Reference LAUREL and BROWN2006, Mouritsen Reference MOURITSEN1992). On farms, ‘freezing’ may not provide effective camouflage and it might be a better strategy to keep them away from farms.
The nilgai is known to use common latrines to defecate (Mehta Reference MEHTA2014, Singh Reference SINGH1995) and such heaps could be found almost exclusively in or near forests. Large and composite dung pile heaps were never detected in agricultural land although a substantial part of foraging was done there. This indicates that they treat the two foraging grounds very differently.
A number of observations related to vigilance behaviour are remarkable. There is an apparent contradiction in the scan versus focal-animal sampling data. Although individuals seemed to be spending proportionately more time in vigilant posture on the farms than in the forest, durations for which no animal in a herd was vigilant were fewer in forest than on the farm. The contradiction is likely to be because of difference in herd size and also possibly because of different levels of synchrony in behaviours in the two habitats. In forest they appear to be vigilant more in a ‘turn by turn’ mode and on farms more synchronously.
Perhaps most interesting is the difference in the vigilance frequency and unit scan duration in forest and farm. The nature of risk between farms and forests is qualitatively different. It was observed that roe deer (Capreolus capreolus) and red deer (Cervus elaphus) show different anti-predatory response to ambush and coursing predators (Wikenros et al. Reference WIKENROS, KUIJPER, BEHNKE and SCHIMDT2015). In the presence of lynx, red deer leave the foraging sites but stay and become more vigilant in the presence of wolf. Our study indicates a different dimension of anti-predatory response of the nilgai while foraging on farms by showing higher vigilance frequency and lesser unit scan duration compared with forest.
The tiger is the main predator of nilgai in the study area and it only occasionally roams over agricultural lands, whereas the main threat on agricultural lands is farmers who want to protect their crops which they do by shouting and driving away animals whenever possible. The observed behavioural plasticity over the two habitats demonstrates that nilgai have differentially adapted to the contrasting risks in appropriate ways. It is necessary to have acute watchfulness to detect presence of an ambush predator such as the tiger that occurs in low density. In contrast, the density of humans on agricultural lands is much higher and their objective is to make themselves prominently visible and try to drive away animals. As a result frequency rather than acuteness of detection matters on farmlands. Therefore it appears appropriate to increase the vigilance frequency but decrease the unit scan duration while foraging on agricultural lands. Since the tiger crawls and freezes in response to the feeding-vigilance cycles of herbivores, greater proportion of time when at least one individual is vigilant is adaptive in forest. This may lose its importance on farmlands.
For a well-camouflaged ambush predator there is safety in numbers since detection of a predator by a single individual can alert the entire group (Roberts Reference ROBERTS1996). In contrast, detection of nilgai by farmers is more crucial in agricultural lands and by dividing into smaller groups this probability can be reduced. Therefore aggregating into larger and more compact groups in the wild and breaking into smaller groups and dispersing during crop-raiding can be adaptive strategies. Nilgai feeding on agricultural crops is a widespread phenomenon throughout the Indian peninsula and it is presumably an old phenomenon too. Therefore it is possible that the animals have fine-tuned their strategies to the different nature or challenges. Individuals appear to perceive the risks as qualitatively different. In the last few decades, there are hardly any instances of farmers killing nilgai, however such practices might have existed in history. The greater total scan duration and avoidance of bringing newborn individuals to farmlands indicate that they do perceive a risk on agricultural lands although the probability of getting killed is currently negligibly small while foraging on farms as compared with forests.
Contrary to our expectation nilgai did not seem to avoid moonlight for crop-raiding in spite of the observation that farmers are more active in guarding their farms and driving away animals during moonlight hours. This can also be viewed in contrast to many other species that rather avoid moonlit nights for any foraging activity (Barnes et al. Reference BARNES, DUBIURE, DANQUAH, BOAFO, NANDJUI, HEMA and MANFORD2006, Daly et al. Reference DALY, BEHRENDS, WILSON and JACOBS1992). It is rather surprising since all other observations show that they make subtle changes in behaviour to adapt to a given context. Nevertheless, it has been observed that ungulates may also utilize open fields on moonlit nights to avoid the ambush predators (Brown et al. Reference BROWN, BRYNTESSON, COOPER, NYHOLM, ROBERTSON, BEDFORD, HENDRICKS, KLIPPENSTEIN, POTAPOV, DIVISION, COLLEGE and ATHYN2011, Kie Reference KIE1999), which could be a plausible explanation for this observed nilgai behaviour. With the exception of response to moonlight, the study shows that nilgai have subtle behavioural plasticity in their adaptive response to the context of habitat and risk variation which is reflected in many different behavioural traits simultaneously.
Although herbivores are known to respond to different levels of risk by altering their vigilance behaviour (Beauchamp Reference BEAUCHAMP2015, Ghosal & Venkataraman Reference GHOSAL and VENKATARAMAN2013, Hunter & Skinner Reference HUNTER and SKINNER1998, Johnsingh & Manjrekar Reference JOHNSINGH and MANJREKAR2015, Lima Reference LIMA1992, Reference LIMA1995; Underwood Reference UNDERWOOD1982, Zollner & Lima Reference ZOLLNER and LIMA2005), to the best of our knowledge, this is the first clear demonstration that a given population of herbivores gives different behavioural responses to two qualitatively different types of risks.
ACKNOWLEDGEMENTS
We sincerely thank Dr Uttara Lele for her help in manuscript preparation. We also thank Department of Science and Technology (DST), India and Rajeev Gandhi Science and Technology Commission, (RGSTC), Maharashtra, India for partial funding.