1 Introduction
In daily life, individuals are shaped by the people, places, and institutions they encounter—their milieus. Many studies argue that factors such as neighborhood racial and ethnic composition influence a variety of attitudes and behaviors (e.g., Key Reference Key1949; Huckfeldt Reference Huckfeldt1986; Oliver and Mendelberg Reference Oliver and Mendelberg2000; Hopkins Reference Hopkins2010). Yet, others contend that “contextual influence is more the exception than the rule” (Hopkins Reference Hopkins2013: 2). King (Reference King1996: 160) argues that “after we control for what we have learned about voters, there isn't much left for contextual effects.” Other studies suggest that geographic context is simply a proxy for social networks, which, they argue, are the actual cause of political behavior (Eulau and Rothenberg Reference Eulau and Rothenberg1986).
We argue that much scholarship in this vein uses measures of racial and ethnic context that fail to capture the theoretical concept of a milieu—the experience that an individual has in her environment while moving through space. The inability to measure the foundational concept of context compromises conclusions that these studies might draw. One study found that defining context as, for example, census tracts of residence instead of city can lead scholars to draw opposite conclusions about the effect of ethnic context (Cho and Baer Reference Cho and Baer2011).
We document this problem and propose a potential solution through improved data collection. To begin, we demonstrate that quantifications of racial and ethnic context suffer from two measurement problems. The first problem stems from the researcher's choice of level, and the other—a less well-studied one—from measures’ static nature. Though we focus on racial and ethnic context, our analysis is just as applicable to other studies of contextual effects across disciplines.Footnote 1
Early in a study of contextual effects, researchers choose the geographic containers that will define their subjects’ contexts. Though researchers seek the characteristics of an individual's milieu, they are limited to characteristics of predetermined units like the ZIP code or census tract in which a respondent resides. Once the container is chosen, all of its characteristics are ascribed to the respondent as her contextual experience. Sometimes these containers are small, like a single census block group, and other times they are expansive, like an entire state. Small geographies may arbitrarily constrain an individual's measures to a few city blocks, while large geographies unrealistically assume an individual experiences an entire American state. Even the smallest state is hundreds of thousands of times larger than a city block, yet studies pick either container to measure the same context. Often, decisions about which container to use may be “choices driven by convenience and data availability” (Cho and Baer Reference Cho and Baer2011: 418).
Recent research in measuring racial and ethnic context deepens our understanding of perceptions versus objective measures (Wong et al. Reference Wong, Bowers, Williams and Simmons2012, Reference Wong, Bowers, Rubenson, Fredrickson and Rundlett2013, Reference Wong, Bowers, Rubenson, Fredrickson and Rundlett2015, Reference Wong, Bowers, Rubenson, Fredrickson and Rundlett2020; Velez and Wong Reference Velez and Wong2017; Hjorth et al. Reference Hjorth, Dinesen and Sønderskov2016) and overlapping residential communities (Baybeck Reference Baybeck2006). However, we argue that even those researchers interested in objective rather than perceptual measures should employ individualized, precise, dynamic measures when possible. Below, we review approaches to measuring different contexts, arguing that traditional measures can be systematically misleading. Section 3 presents original individual-level geolocation data from over 400 individuals that we began recruiting in July 2013. Section 4 shows how the natural variation in individual experiences in our data belies static, aggregate measures. We evaluate particular levels of geographic aggregation and provide advice for scholars without access to dynamic measures. Finally, we detail the large individual variation in geographic context, even within particular American metropolitan areas.
2 Measuring racial and ethnic context
The existing census measures of racial and ethnic context have limited decades of studies using static geographic containers. As a result, measures of context may significantly misrepresent the local dynamic experiences that are posited to influence individuals’ political behaviors and attitudes. Many applications measure context at the county level, for example.Footnote 2 However, the demographics and political environment of a respondent's county may differ greatly from those of the part of the county she actually lives in, works in, drives through, or experiences during her day. American counties are as large as 20,000 square miles—San Bernardino County, California, is larger than Costa Rica, Bosnia and Herzegovina, and Denmark—and encapsulate many different kinds of areas. As such, county-level averages likely misrepresent the experiences of many individuals. The average county includes about 1000 square miles; an average measure taken over a 50-mile by 20-mile area will significantly distort many individual experiences. We show several examples in Section 5.
Contextual factors are hypothesized to drive a number of attitudes related to prejudice. One seminal theoretic divide is whether in-group interactions with out-group members increase hostility or empathy toward the out-group. For example, Dinesen and Sønderskov (Reference Dinesen and Sønderskov2015: 550) finds that “residential exposure to ethnic diversity reduces social trust.” This work frequently uses static geographic containers including counties (Giles and Evans Reference Giles and Evans1986; Fosset and Kiecolt Reference Fosset and Kiecolt1989; Glaser Reference Glaser1994; Taylor Reference Taylor1998; Stein et al. Reference Stein, Post and Rinden2000; Dixon Reference Dixon2006); cities or standard metropolitan statistical areas (SMSAs) (Fosset and Kiecolt Reference Fosset and Kiecolt1989; Bledsoe et al. Reference Bledsoe, Welch, Sigelman and Combs1995; Taylor Reference Taylor1998; Oliver and Mendelberg Reference Oliver and Mendelberg2000; Oliver and Wong Reference Oliver and Wong2003; Dixon Reference Dixon2006); and states (Hero and Tolbert Reference Hero and Tolbert2004). Lower levels of geography are also used, including housing projects (Ford Reference Ford1973), ZIP codes (Oliver and Mendelberg Reference Oliver and Mendelberg2000; Gilliam et al. Reference Gilliam, Valentino and Beckmann2002; Cho and Baer Reference Cho and Baer2011; Weber et al. Reference Weber, Lavine, Huddy and Federico2014), and neighborhoods (Bledsoe et al. Reference Bledsoe, Welch, Sigelman and Combs1995; Stolle et al. Reference Stolle, Soroka and Johnston2008; Cho and Baer Reference Cho and Baer2011). Rarely, very low levels such as census blocks are used (Oliver and Wong Reference Oliver and Wong2003). As we show, each of these containers consistently mismeasures context when compared to individuals’ actual dynamic experiences.Footnote 3
Geographic contexts have also been connected to other political behaviors, such as state to turnout (Solt Reference Solt2010), neighborhood to turnout (Cho et al. Reference Cho, Gimpel and Dyck2006), county to views on Ronald Reagan (MacKuen and Brown Reference MacKuen and Brown1987), cities and census blocks to attitudes toward local government and one's neighborhood (Baybeck Reference Baybeck2006), and neighborhood to various forms of participation (Huckfeldt Reference Huckfeldt1979). Mutz and Mondak (Reference Mutz and Mondak2006) compares the workplace as a locus of political discussion with other contexts like the neighborhood and household. Baybeck and Huckfeldt (Reference Baybeck and Huckfeldt2002) and Berry and Baybeck (Reference Berry and Baybeck2005) deploy GIS data to demonstrate that geographic distance strongly predicts the density of political discussion networks and that interstate competition drives lottery adoptions (but not welfare benefit levels), respectively.
A small body of research takes a more circumspect approach to conceptualizing their measures of geography (Cho and Baer Reference Cho and Baer2011; Reeves and Gimpel Reference Reeves and Gimpel2012; Wong et al. Reference Wong, Bowers, Rubenson, Fredrickson and Rundlett2013; Christiansen et al. Reference Christiansen, Sønderskov and Dinesen2016; Gimpel et al. Reference Gimpel, Lovin, Moy and Reevesforthcoming). Analyzing economic attitudes, Reeves and Gimpel (Reference Reeves and Gimpel2012) considers states, media markets, and counties, and then constructs multiple geographic regions based on social, political, and economic similarities of adjacent counties. Christiansen et al. (Reference Christiansen, Sønderskov and Dinesen2016) argues that national economic perceptions are driven by extremely local conditions—unemployment rates within 80 m of home, but not unemployment within larger radii, such as 2500 m. Cho and Baer (Reference Cho and Baer2011) analyzes racial attitudes of blacks as a function of, among other things, multiple measures of racial context including census tract, ZIP code, neighborhood, and city. The study finds that the proportion of Latinos in a respondent's census tract is negatively associated with attitudes toward Latinos; however, these same attitudes are positively associated with the proportion of Latinos measured at the city level. Using ZIP code or neighborhood measures yields statistically insignificant relationships between the same variables. Cho and Baer (Reference Cho and Baer2011) then shows that incorporating nearby census tracts (as well as a measure of socioeconomic status) yields consistent results across geographic levels. Cho et al. (Reference Cho, Gimpel and Shaw2012) similarly employs nearby geographic units in their spatial analyses.
The important finding of Cho and Baer (Reference Cho and Baer2011) is consistent with our work here, but there are differences. First, our sample here is geographically broader, touching every American state. Second, we dynamically measure the racial and ethnic milieus through which individuals actually pass, rather than statically assign them to a single set of nested geographic containers. Third, the lowest level of geography we employ is the census block, of which there are about 200 times as many as ZIP codes.
Even work that considers multiple levels of geography assumes that static measures—whatever their level—capture racial or economic experiences. As we demonstrate below, static measures of any level may not capture dynamic contexts, such as those of two people who live in the same block, but travel through different parts of a city during their daily lives.
We build on work in geography by Kwan (e.g., Reference Kwan2009, Reference Kwan2012) which asserts that contextual measures of exposure should be “people-based,” rather than “place-based.” Kwan argues that environmental influences on health and behavior unfold over the course of the day and depend on the places passed through, rather than being defined by the single place we live. This holds whether we define where we live broadly, as in a US state, or narrowly, as in a single census block.
2.1 How aggregate census measures obscure static locations
Large geographies could represent their smaller constituent geographies quite well. For example, if a county was 60 percent white, each of the census blocks within that county could also be 60 percent white. However, larger geographies can also significantly misrepresent the demographics individuals encounter within them. A county that was 60 percent white could be a mixture of census blocks that were 100 percent white and 0 percent white. Further, where the county average misrepresents the nature of many blocks, we would not expect very different blocks to lie next to each other. American residential segregation (Massey and Denton Reference Massey and Denton1993) implies that demographically similar blocks are likely to cluster. Thus, where block demographics vary within a county, we expect county measures to be a poor representation of individuals’ much more localized experiences.Footnote 4
For example, consider the city of Saint Louis, Missouri. The city is 48.5 percent black, but 35 percent of the city's census blocks are over 90 percent white or black.Footnote 5 If an individual was to experience all census blocks in the city, then 48.5 percent could be an accurate measure of her racial milieu. However, if she remained primarily in homogeneous black or white census blocks, then this summary measure would be a misleading characterization of her interaction with other racial groups. To address this, we define context dynamically, based on the characteristics of the areas through which an individual travels.
2.2 Toward low-level, dynamic measures of geography
Consider datasets commonly employed in social scientific research and the static geographic identifiers they sometimes make available. The American National Election Studies (ANES) makes available state and Congressional district indicators; it restricts access to county and ZIP code. The Cooperative Congressional Election Study (CCES) includes respondent region, state, county, Congressional district, and ZIP code, but ZIP code is missing for 60 percent of the sample in 2011. The General Social Survey (GSS) provides respondent region, but restricts access to census tract, as well as to higher levels of aggregation, including state, SMSA, and county.
By contrast, consider the geographic experience of the two individuals whose travels are plotted in Figure 1. These are two real people both of whom were observed in Los Angeles County, California, from data we describe in Section 3. The two individuals occupy strikingly different parts of the county—information that would be completely obscured by static measures of county. Despite both living in Los Angeles County, their milieus are distinct. Person 1, whose path is plotted with gray triangles (△), primarily occupies the West Los Angeles area. Person 2, whose path is plotted with black circles (◯), is centered in the La Crescenta-Montrose community. These two individuals’ paths differ spatially, but also represent distinct racial and ethnic experiences.
The paths of two individuals in Los Angeles County. Person 1 (△) is concentrated in West Los Angeles and Person 2 (◯) in La Crescenta-Montrose.

Table 1 displays our measures of the racial and ethnic contexts these two individuals experience in the first and third columns. We then compare these contexts to several different geographic containers into which scholars might typically assign them—a census tract, Los Angeles County, and the state of California. We see that these Angelenos’ different spatial patterns imply different contexts, as well. Person 1's movement through Los Angeles County leads her to experience places where, overall, about 26 percent of inhabitants are white, 19 percent percent are Hispanic, 14 percent percent are black, and 12 percent are Asian. Person 2's experience is very different. Person 2 experiences places where most of the inhabitants are white (64 percent) with the next largest group being Asians (19 percent). If a survey researcher only had these respondents’ county of residence, then the researcher would assume they have identical contextual experiences. While the county-level measures might reasonably approximate the experience of Person 1, they would mischaracterize the racial and ethnic context of Person 2. Whether each person's static local tract represents their experience better than the county is unclear; for some race/ethnicities tract is better, for others the county is better.
Geographic experiences of two people in Los Angeles County

Cells contain percentage of geography of given race/ethnicity. Los Angeles County represents the milieu of Person 1 (△) fairly well, but not that of Person 2 (◯). Population estimates from the West LA Census Tract (2696.02) and Montrose Census Tract (3005.02) are reported from the American Community Survey, 2008 to 2012 and estimates for Los Angeles County and California are based on the 2010 decennial census.
Comparing the patterns of these two individuals highlights three challenges in measuring contextual experiences. First, these individuals spend much of their time in different parts of the same county, a geographic context frequently used by studies measuring racial or ethnic composition. Second, these individuals do not exist in a single ZIP code, census block, or census tract. If we assume that their racial and ethnic experience matches even these lower levels of geography, we ignore the extent to which individuals may experience heterogeneity of conditions, though they might live in homogeneous neighborhoods. Third, neither of these individuals travels through the entire 5000 square miles of Los Angeles County, much less the entire state of California. Even these two individuals traveling through the southwestern part of Los Angeles County have markedly different experiences.
3 A new approach: racial and ethnic context via mobile geolocation
In order to create a dynamic measure of racial and ethnic context based on individual milieus, we rely on location data collected for over 400 users of a smartphone application, which automatically records users’ latitude and longitude based on Global Positioning System (GPS) hardware embedded in their mobile phones.Footnote 6 Specifically, we obtain a sample of users of the OpenPaths application, developed and maintained by the Research and Development Lab at the New York Times Company. The Lab describes OpenPaths as a “secure data locker for personal location information” that allows the user to maintain geographic records of their daily travels. To use OpenPaths, the user downloads the application onto an iOS- or Android-based smartphone and signs up for an OpenPaths account either through the application or on the Internet. The Lab requires an email address to sign up. To successfully record data, then, a participant must have a smartphone, download the application, and sign in. The data are then encrypted and stored, so that the user can access it and control whether others can access it.Footnote 7
Once the user begins using OpenPaths, the application runs in the background of their mobile phone and updates when there is “significant change.”Footnote 8 The GPS in smartphones relies on several services, including GPS satellites, nearby Wi-Fi hotspots, and cellular towers, to pinpoint the user's coordinates.Footnote 9 Geolocations are still estimated with some uncertainty, and application developers must trade off between location accuracy and battery life. Zandbergen (Reference Zandbergen2009), for example, finds that the median measurement error for the iPhone 3G (introduced in 2008) was between 74 and 600 m depending on the source of the information.
3.1 Our sample
The creators of OpenPaths allow researchers to request users’ permission to access their geolocated data. We submitted a description of our project to the developers of OpenPaths, and they approved our project. We were then able to solicit users for permission to access their data. The users can approve, deny, or ignore the request, and they may revoke access at any time. We confined our requests to individuals who recorded coordinates within the United States. Every OpenPaths user who met this criterion was sent an email from OpenPaths requesting access for our project to their GPS coordinates. Approximately 8000 requests were made with 446 participants allowing us access to their data, 162 rejecting our request, and the remainder not responding. Included with the GPS coordinates are unique and randomly generated identification strings for each user, a timestamp, and information about the user's device, operating system, and version of the application. Thus, our sample is limited to individuals with smartphones who have self-selected into being geotracked for personal means and who are willing to share their personal data with researchers. No additional information is available and we have no way to contact these users for additional information.
Our sample of OpenPaths users includes 2.6 million data points from 446 individuals. Figure 2 displays all of these points. The number of GPS points for each individual range from 1 to over 111,000 with the median number of coordinate pairs being about 3200. On average, we have about a year's worth of geolocation for the individuals (364.4 days) with a maximum of over 4 years’ worth of data. For just over 1 percent of our respondents, we have less than a day's worth of geolocations. We place each geographic coordinate into a 2010 US Census block indicated by a 15-digit Federal Information Processing Standards (FIPS) code, which uniquely identifies the point's census block, census block group, census tract, county, and state. We record coordinates in all fifty states and the District of Columbia. Even sparsely-represented states include a few hundred observed points (North Dakota: 203; Nebraska: 899; and South Dakota: 974), and the more commonly-observed states include hundreds of thousands of points (Pennsylvania: 6 percent of the total, or 174,693; New York: 12 percent or 312,129; and California: 22 percent or 569,175). Online appendix Figure 1 displays the distribution of coordinates by state. Despite the scope of geographic coverage, we again note that we have no way to access covariate data to determine if the sample is demographically nationally representative.
The OpenPaths sample. The roughly 2.6 million GPS coordinates for all individuals in our OpenPaths sample. Every state is represented; coordinates are concentrated in the Northeast and West Coast. Darker shading represents areas with more observations.

3.2 Summarizing dynamic geographies
For our OpenPaths sample, we define the racial and ethnic context users experience by using their geolocated data to identify the characteristics of the census blocks where the respondent actually spends her time. Specifically, we calculate a population-weighted average of the racial and ethnic profile of all census blocks she travels through. This summary reduces the distribution of characteristics in the visited blocks to a single measure of context. This measure is a useful summary; as we show below, however, we can leverage a great deal more information about the distribution of blocks each individual experiences.
4 How static measures fail to capture dynamic contexts
We compare our dynamic measure of context to a wide variety of static measures, representing a range of approaches scholars have adopted in describing racial and ethnic context. In doing so, we arrive at two core conclusions. First, static measures are poor proxies for individuals’ dynamic experiences. This mismeasurement persists even at the census block level, the lowest geography for which data are available. Second, low levels of static geography can be used to estimate dynamic experiences, but not uniformly across racial and ethnic groups.
4.1 Describing the mismeasurement
For each OpenPaths participant, we designate modal geographies. These geographies, in which the participant appears most, represent our estimates of the geographic containers (block, block group, tract, county, and state) into which a survey researcher measuring context would place the respondent. These geographies serve as static measures that we compare to the participant's dynamic context. To summarize the dynamic context, we take the mean percentage of residents of a given race in the census blocks through which the participant travels, weighted by block population.
Figure 3 plots our dynamic measure of white racial context on the y-axis against a static measure on the x-axis.Footnote 10 Each figure compares measures for one racial or ethnic group, and each panel compares the dynamic measure to a different level of geography. If static measures of geography were perfect proxies for respondents’ experiences, then every point would lie on the black y = x line in each panel. Clearly, this is not the case, and there are important systematic differences between the two measures. Where points fall above the y = x line, the static measure understates the individual's experience with members of that racial or ethnic group; where they fall below, the static measure overstates their experience.
Dynamic versus static measures of percent white. Panels show block, block group, tract, county, and state contexts. Modal location for a geography on x-axis; mean of dynamic contexts on y-axis. Respondents’ dynamic experiences are more diverse than their static county where points lie above y = x. Linear regression (black dashed line) and loess smooths (white dashed line) are displayed.

First, individual experiences of racial and ethnic context are typically more moderate than static measures suggest. When a respondent's modal census block has a small percentage of a given racial or ethnic group, static representation understates how much the individual experiences members of that race or ethnicity. At the extreme, for example, for participants whose modal block is 0 percent white (those at the very left-hand side of the first panel in Figure 3), the static measure underestimates their average experience of whites, who actually comprise between 25 and about 80 percent of the census blocks these participants experience.Footnote 11 The y-intercept of the bivariate linear regression line gives a sense of the average “bias” in the static measure at this point—about 34 percentage points (Tufte Reference Tufte1973). At the other extreme, static blocks that are majority white tend to overrepresent participants’ average experience of whites; most points at the right side of the panel fall below the y = x line.
Second, it does not appear that the dynamic measure is simply the static measure “regressed to the mean.” Comparing our dynamic block-level milieu to the typical static county measure, for example, over two-thirds of the sample has its dynamic diversity understated by the static measure.
Third, the comparison of dynamic to static measures at the same low level of geography (the census block) demonstrates that the mismeasurement of geographic context is not merely a problem caused by high levels of aggregation, but also a failure to account for how individuals travel through their environments. We observe the same pattern across racial and ethnic groups and geographies, though with a few exceptions. As the last panel of online appendix Figure 4 shows, for example, static state measures nearly always underestimate the percentage of Asians in the blocks participants travel through.
The intercept of each regression line indicates the bias in static measures for those whose modal location for a given geography lacks members of a particular race or ethnicity. The slopes provide guidance for how to translate from static measures to dynamic ones. For example, the slope in the first panel of Figure 3 is 0.4, indicating that on average, an individual from a block 10 percentage points more white than another actually only experiences about 4 percentage points more whites. We provide coefficient estimates for the full set of linear models in online appendix Table 1.
5 Individual variation in racial and ethnic context
We can further explore the experiences of an individual by examining the distribution of their contextual experiences. Figures 4 and 5 present the distribution of the racial and ethnic composition of the census blocks individuals travel through, grouped by modal county. The x-axis is the percent non-white, where densities farther to the right indicate more diverse (less white) racial and ethnic contexts. For each plot, the percent of the county population that is non-white is indicated by a vertical line.
Racial experiences that are unimodal and bimodal. For some individuals, county captures both the mean and modal experience of the individual (left and center panels). For others (right panel), the county obscures the distribution of racial experiences. Panels show the distributions of racial and ethnic composition of the census blocks that individuals travel through, grouped by modal county. The x-axis is the percent non-white; densities farther to the right indicate more diverse (less white) racial and ethnic contexts. Vertical lines represent the percent of the county population that is non-white.

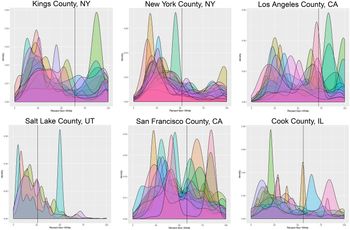
Examples of racial experiences in select metropolitan counties. Individuals living in the same county have disparate racial experiences. Panels show the distribution of the racial and ethnic composition of the census blocks that individuals travel through, grouped by modal county. The x-axis is the percent non-white; densities farther to the right indicate more diverse (less white) racial and ethnic contexts. Vertical lines represent the percent of the county population that is non-white.

Consider the participants from Buncombe County, North Carolina and Jefferson County, Colorado shown respectively in the left and center panels of Figure 4. These individuals spend most of their time in relatively homogeneous census blocks that match the characteristics of their counties as a whole. These distributions differ starkly from that of the individual from Wake County, North Carolina, who travels through a bimodal set of census blocks, represented in the right panel of Figure 4. This participant spends time in places that are either majority white or majority non-white, with less time spent in racially or ethnically mixed places. A static measure, even at the census block level, would clearly miss the variation in his or her experience. For example, the distribution of percent white in the census blocks our median respondent experiences has a standard deviation of about 21 percentage points, indicating that respondents tend to travel through heterogeneous groups of areas.
Bimodal variation in experiences is not confined to Wake County, North Carolina. Figure 5 displays the distributions of racial and ethnic experiences for several metropolitan counties for which we have multiple respondents. This figure illustrates the variation of experiences within a single geographic locality (in this case, county). If these individuals were part of a survey that measured context at the county level, their distributions would all collapse to the point on the x-axis at the vertical line. But as we see in Figure 5, the modal experience of one individual in Salt Lake County, Utah, whose mode is at about 50 percent non-white or Hispanic, is more diverse than most of the modal racial and ethnic experiences of our respondents from Brooklyn (Kings County), New York.
As with Figure 4, these plots also often reveal multimodal distributions of racial and ethnic experiences. We provide an example of a multimodal census block distribution within a county elsewhere, showing that even if an individual experienced every census block in her county, the summary measure could still mask extreme experiences (Moore and Reeves Reference Moore, Reeves, Bachner, Wagner Hill and Ginsberg2017). How might the attitudes of someone who spends their time in one type of census blocks vary from those of an individual who travels from one contextual extreme to another, even if their average experiences are the same?
6 Discussion
We demonstrate that static measures of lived experience, usually defined by residence at a single level of geography, fail to capture the variety of experiences that individuals are often posited to have. In some cases, these systematic misrepresentations represent a form of measurement error that plagues estimates of the effects of racial and ethnic context (e.g., Cho and Baer Reference Cho and Baer2011).
Where scholars only have access to traditional measures of context, future modeling efforts may enable researchers to map these measures onto the likely dynamic contexts that typical residents of a geography experience. If one could collect dynamic geolocations and residential locations for a large set of Americans, for example, one could model dynamic context as a function of static contexts. If the predictions from such a model were sufficiently precise, then perhaps static block, block group, tract, county, or state measures from traditional surveys could be used to impute dynamic experiences. We think such an approach has promise, but would require a large, dense network of Americans to be reliable.
For many contextual effects, research is still limited by what administrative data are available. We employ the lowest level of geography available in the census, the block, in our description of each individual's milieu. While we would prefer an even finer and more dynamic measure, we do not yet have, for example, a measure of the people within a participant's field of vision. Currently, we are limited to the characteristics of a milieu that are collected at that administrative level. Despite this limitation, we argue that the dynamic collection of relatively small administrative contexts approximates the actual environment one experiences better than current practices. In the future, we could develop additional dynamic measures by defining age contexts, for example, using block level data. Any time researchers have geographic data, dynamic contexts could be defined using the variables available for that container.
Our data collection strategy reflects larger trends toward exploiting geographic social scientific data. Significant geolocation efforts stand to revolutionize the study of disease patterns, for example, and the study of racial and ethnic contextual effects should follow. Scholars have long been interested in the effects of milieus on a variety of outcomes. However, only recently has the ability to precisely, dynamically measure where individuals travel in their daily lives become affordable and unintrusive enough to be feasible for large social scientific samples. With the ability to collect frequent individual geolocations, political science can better link empirical measures to theoretical concepts like racial and ethnic milieus.
Supplementary material
To view supplementary material for this article, please visit https://doi.org/10.1017/psrm.2020.10.
Data
All data and information necessary to replicate the results in this article are available in the Harvard Dataverse at https://dataverse.harvard.edu/dataset.xhtml?persistentId=doi:10.7910/DVN/G3YJXY.
Acknowledgments
We thank Brady Baybeck, Michael Kellermann, Hyun Woo Lim, Melissa Sands, Allen Settle, Stuart Soroka, Steven Webster, and participants of the Toronto Political Behaviour Workshop, the Women's and Minority Representation conference of McGill University's Centre for the Study of Democratic Citizenship, and the American University Government Research Seminar for comments and suggestions on earlier drafts.