Cover crop–based organic rotational no-till soybean production uses fall-planted winter cereal cover crops (such as cereal rye, Secale cereale L.) that are mechanically terminated with a roller-crimper in the spring to create a layer of mulch. Soybean is then no-till–planted through the thick mulch; this practice serves as the primary form of weed suppression. Farmers can combine cover crop termination and planting operations in a single pass by mounting the roller-crimper to the front of their tractor and no-till planting soybean simultaneously. Designed around an ecological weed management strategy that reduces soil erosion (Bernstein et al. Reference Bernstein, Posner, Stoltenberg and Hedtcke2011) as well as labor and fuel consumption (Mirsky et al. Reference Mirsky, Ryan, Curran, Teasdale, Maul, Spargo, Moyer, Grantham, Weber, Way and Camargo2012), this system is a model for sustainable agriculture. In addition to protecting soil from erosion, cover crop–based organic rotational no-till soybean management can be used to minimize other deleterious effects of crop production on the environment while also providing an alternative to animal products for protein. For example, the fall-planted cover crop can help prevent water contamination and eutrophication by reducing soil nitrate leaching and phosphorus runoff (Brandi-Dohrn et al. Reference Brandi-Dohrn, Dick, Hess, Kauffman, Hemphill and Selker1997; Eckert Reference Eckert1991; Villamil et al. Reference Villamil, Bollero, Darmody, Simmons and Bullock2006). However, management recommendations must be developed specifically for cover crop–based organic rotational no-till soybean production if this system is to be widely adopted among farmers.
Managing weeds is often one of the most challenging aspects of crop production for organic farmers (Bàrberi Reference Bàrberi2002; Bond and Grundy Reference Bond and Grundy2001). It can be particularly difficult for growers to achieve adequate weed suppression if they reduce tillage without using synthetic herbicides (Peigné et al. Reference Peigné, Ball, Roger-Estrade and David2007; Smith et al. Reference Smith, Barbercheck, Mortensen, Hyde and Hulting2011). Weed management in traditional organic soybean production typically consists of multiple tillage and cultivation events, whereas the rolled cover crop reduces or eliminates the need for cultivation in organic no-till–planted soybean production through physical (e.g., light interception), chemical (e.g., allelopathy), and biological (e.g., providing weed seed predator habitat) mechanisms of weed suppression (Mirsky et al. Reference Mirsky, Ryan, Teasdale, Curran, Reberg-Horton, Spargo, Wells, Keene and Moyer2013; Wortman et al. Reference Wortman, Francis, Bernards, Blankenship and Lindquist2013). Although not unique to cover crop–based organic rotational no-till soybean, combining multiple cultural weed management practices is of particular importance in the absence of chemical or mechanical weed control.
Cultural weed management tactics that are compatible with organic soybean production practices include high planting rates, narrow row spacing (<76 cm), and the selection of cultivars that possess strong weed suppressive ability (Jannink et al. Reference Jannink, Orf, Jordan and Shaw2000; Jordan Reference Jordan1993; Place et al. Reference Place, Reberg-Horton, Carter and Smith2011; Rose et al. Reference Rose, Burnside, Specht and Swisher1984). Increasing crop planting rates can contribute to weed suppression via faster canopy closure and enhanced weed–crop competition (Doll Reference Doll1997; Mohler Reference Mohler1996; Murphy et al. Reference Murphy, Yakubu, Weise and Swanton1996). When the relationship between increasing plant density and crop yield is asymptotic (i.e., yield begins to plateau as density increases) rather than parabolic (i.e., yield declines above an optimum density), higher plant populations can be used to improve weed suppression (Weiner et al. Reference Weiner, Griepentrog and Kristensen2001). As large-seeded crop seedlings are typically greater in size than weed seedlings immediately following germination (Mohler Reference Mohler1996), increasing crop density can potentially enhance the competitive size asymmetry (Schwinning and Weiner Reference Schwinning and Weiner1998; Weiner Reference Weiner1990) that exists between the crop and weed population, resulting in greater weed suppression at elevated crop densities compared with lower densities (Weiner et al. Reference Weiner, Griepentrog and Kristensen2001). At higher soybean populations, Arce et al. (Reference Arce, Pedersen and Hartzler2009) observed inconsistent effects on weed densities, but end-of-season weed biomass decreased linearly as soybean population increased. Place et al. (Reference Place, Reberg-Horton, Dunphy and Smith2009) found that increased soybean planting rates decreased percent weed cover at three of the five sites in their experiment.
As canopy closure can be considered a prerequisite for maximum soybean yield under certain environmental conditions (Ball et al. Reference Ball, Purcell and Vories2000a, Reference Ball, Purcell and Vories2000b, Reference Ball, McNew, Vories, Keisling and Purcell2001; Shibles and Weber Reference Shibles and Weber1966; Wells Reference Wells1991), management practices that hasten canopy formation provide the benefits of both enhanced weed suppression and greater yield potential. Previous research has suggested that yield gains from narrow row spacing and high plant populations might be associated with increased light interception during reproductive growth (Board et al. Reference Board, Harville and Saxton1990; Board and Harville Reference Board and Harville1993; Parvez et al. Reference Parvez, Gardner and Boote1989; Shibles and Weber Reference Shibles and Weber1965). A review of field studies in more northern regions, where environments receive a limited number of heat units, indicated that narrow row spacing and higher populations tend to improve soybean yield (Lee Reference Lee2006). This positive yield response was primarily attributed to the relationship between maximum light interception and rapid canopy development. However, drawbacks to using higher planting rates include higher seed costs, increased lodging (Cooper Reference Cooper1971a, Reference Cooper1971b; Costa et al. Reference Costa, Oplinger and Pendleton1980; Oplinger and Philbrook Reference Oplinger and Philbrook1992), and greater incidence of some diseases, such as Sclerotinia stem rot [Sclerotinia sclerotiorum (Lib.) de Bary] (Lee et al. Reference Lee, Renner, Penner, Hammerschmidt and Kelly2005).
Soybean planting rates that maximize yield do not necessarily result in maximum economic return. In conventional soybean production systems, the high cost of genetically engineered seed and increased adoption of fungicide and insecticide seed treatments have prompted researchers to recommend lower planting rates in an effort to increase profitability for farmers (Cox and Cherney Reference Cox and Cherney2014; De Bruin and Pedersen Reference De Bruin and Pedersen2008b; Epler and Staggenborg Reference Epler and Staggenborg2008; Esker and Conley Reference Esker and Conley2012; Gaspar et al. Reference Gaspar, Mitchell and Conley2015; Harder et al. Reference Harder, Sprague and Renner2007; Lee et al. Reference Lee, Egli and TeKrony2008; Norsworthy and Oliver Reference Norsworthy and Oliver2001). Under organic management practices, the operational costs and soybean market price can differ substantially from conventional production. Although labor and fuel costs tend to be higher in organic systems (Archer et al. Reference Archer, Jaradat, Johnson, Weyers, Gesch, Forcella and Kludze2007; Crowder and Reganold Reference Crowder and Reganold2015), the price premium for organic soybean has been approximately double the price received for conventional soybean since national organic soybean prices were recorded and archived in 2008 (USDA-AMS 2016; USDA-NASS 2016). For instance, the average price received for conventional feed-grade soybean in 2014 was $0.47 kg−1 (USDA-NASS 2016), compared with $0.93 and $1.04 kg−1 for feed- and food-grade organic soybean, respectively (USDA-AMS 2016). Given the differences between organic and conventional soybean management practices and market prices, economically optimal planting rates likely differ as well. Place et al. (Reference Place, Reberg-Horton, Dunphy and Smith2009) noted that previous economic analyses for conventional soybean production are likely inappropriate for organic growers due to the differences in seed costs, weed management practices, on-farm weed pressure, and soybean price received. In addition to price premiums and economic advantages over conventional production, cover crop–based organic rotational no-till soybean management can reduce diesel fuel use by 27% and labor requirements by 33% compared with tillage-based organic soybean production (Mirsky et al. Reference Mirsky, Ryan, Curran, Teasdale, Maul, Spargo, Moyer, Grantham, Weber, Way and Camargo2012).
In this research, we compared a wide range of planting rates in organic no-till–planted soybean. Planting rates of more than double the recommended rate of 321,000 seeds ha−1 in 76-cm-wide rows for conventional production in New York (Cox and Cherney Reference Cox and Cherney2011; Orlowski et al. Reference Orlowski, Cox, DiTommaso and Knoblauch2012) were used to overcome potential seed placement challenges that can be common in rolled cover crop systems, and to ensure an asymptotic relationship between planting rate and yield. By reaching a yield plateau (or decline due to lodging or severe intraspecific competition), we can estimate the economically optimal planting rate. Whereas the economically optimal planting rate in conventional soybean production is often lower than the rate associated with the greatest yield (De Bruin and Pedersen Reference De Bruin and Pedersen2008b; Lee et al. Reference Lee, Egli and TeKrony2008; Norsworthy and Oliver Reference Norsworthy and Oliver2001), we hypothesized that the economically optimal planting rate in organic no-till–planted soybean would closely correspond to the rate at which the greatest yield is obtained.
The objectives of this study were to quantify the effect of planting rate on 1) weed suppression, 2) soybean yield, and 3) partial economic return in cover crop–based organic rotational no-till soybean production.
Materials and Methods
Site Description and Experimental Design
A field experiment was conducted in 2014 at the Cornell University Musgrave Research Farm in Aurora, New York (42.73°N, 76.66°W), and at the Hudson Valley Farm Hub in Hurley, New York (41.91°N, 74.10°W). The soil in Aurora is a Honeoye silt loam (fine-loamy, mixed, semiactive, mesic Glossic Hapludalf) with 2.5% organic matter (mass loss on ignition at 500 C) and a pHwater of 7.5, and the soil in Hurley is a Unadilla silt loam (coarse-silty, mixed, active, mesic Typic Dystrudept) with 1.7% organic matter and a pHwater of 6.1. Prior to this experiment, the fields at both farms were managed conventionally. Commodity grains, including corn, soybean, and wheat, composed the crop rotation in Aurora, and weeds were managed with synthetic herbicides. The crop rotation and management were similar in Hurley, except sweet corn was grown instead of grain corn.
In this experiment we compared five soybean planting rates, arranged in a randomized complete block design at both field sites. Although we targeted the same five planting rates, actual planting rates differed slightly between sites due to equipment limitations. The five rates were 195,000; 420,000; 605,000; 777,000; and 906,000 seedsha−1 in Aurora, and 198,000; 420,000; 618,000; 778,000; and 914,000 seeds ha−1 in Hurley. There were five replicate blocks in Aurora and four replicate blocks in Hurley. Plots consisting of a single soybean planting rate within a given block measured 3.0 by 9.1 m in Aurora and 6.1 by 91.4 m in Hurley.
In Aurora, a mixture of cereal rye, barley (Hordeum vulgare L.), and triticale (×Triticosecale Wittm. ex A. Camus) was no-till drill-seeded (John Deere 1590) 2.5 cm deep at a rate of 126 kg ha−1 on October 3, 2013. In Hurley, a mixture of cereal rye and triticale was broadcast (Willmar 600 spreader) at a rate of 220 kgha−1, and shallow disking (John Deere 637) was used to improve the seed-to-soil contact and facilitate germination. This seeding operation also occurred on October 3, 2013. Although the seeding method, rate, and species composition of the cover crop mixtures differed between sites, this experiment was not designed to compare cover crop performance.
In cover crop–based organic rotational no-till–planted soybean production, the timing of cover crop termination is often determined based on cover crop phenology. As adequate mechanical control is achieved when winter cereal cover crops are rolled no earlier than anthesis (Ashford and Reeves Reference Ashford and Reeves2003; Mirsky et al. Reference Mirsky, Curran, Mortensen, Ryan and Shumway2009), termination was delayed until triticale—the latest-maturing species in both mixtures—reached at least Zadoks 60 growth stage (Zadoks et al. Reference Zadoks, Chang and Konzak1974). At both sites, this occurred in early June 2014. The cover crops were terminated with a 3-m-wide roller-crimper (I & J Manufacturing), which weighed 1,195 kg when filled with water. In Aurora, the cover crops were rolled perpendicular to the direction they were sown to eliminate gaps between rows, thereby creating more uniform ground cover. As the cover crop seed was broadcast in Hurley, rolling was not constrained to a particular direction. On the same day that rolling-crimping took place (June 8 in Aurora and June 10 in Hurley), ‘IA 2053’ food-grade soybean (yellow hilum, 2.0 relative maturity) was no-till–planted (John Deere 7200 MaxEmerge 2 in Aurora, John Deere 1760 NT MaxEmerge XP in Hurley) through the cover crop mulch in 76-cm rows at a depth of 3.8 cm for all five planting rates. Due to hard, dry soil conditions in Aurora, 318 kg of additional weight was distributed across the no-till planter units in an effort to improve soil penetration and achieve the desired planting depth.
Immediately prior to rolling-crimping on June 8 in Aurora and June 10 in Hurley, the winter cereal cover crops were clipped at the soil surface within randomly-placed quadrats. Cover crop biomass was assessed by oven-drying the samples at 50 C for 1 week and then weighing the dried vegetation. In both Aurora and Hurley, one 0.5-m2 quadrat was harvested per block. Weed biomass samples were collected approximately 11 weeks after soybean planting; visual estimates of weed cover indicated that this was the time of peak biomass accumulation during the transition from vegetative to reproductive growth stages for the most abundant species. Weed biomass was clipped at the soil surface from within a single 0.5-m2 quadrat per plot in Aurora, whereas two 0.25-m2 quadrats were harvested per plot in Hurley for better representation of the larger plot size. Weed biomass samples were dried and weighed as described for the cover crop samples. Soybean population was evaluated at the same time as weed biomass collection by counting the number of soybean plants within each quadrat. Soybean yield was measured with a two-row plot combine (ALMACO SP20) in Aurora on November 3, 2014. In Hurley, soybean plants were hand-harvested within two 0.25-m2 quadrats per plot on October 29, 2014, and then threshed, weighed, and subsampled to determine moisture content. Soybean yields were adjusted to 13% moisture for both sites.
Statistical Analyses
All data were analyzed using R version 3.2.4 (R Core Team 2016), and diagnostic procedures were performed to ensure that the errors exhibited independence, normality, and homoscedasticity. In Hurley, the data collected in two 0.25-m2 quadrats per plot were treated as subplots and averaged. To test for relationships between soybean planting rate and population, we used linear mixed-effects models (lme function in the nlme package in R; Pinheiro et al. Reference Pinheiro, Bates, DebRoy, Sarkar and Core Team2016) with block as a random effect and the intercept set at 0. For these models, we used the r.squaredGLMM function (MuMIn package; Bartoń Reference Bartoń2016) to calculate marginal
 $\left( {R_{m}^{2} } \right)$
and conditional
 $\left( {R_{c}^{2} } \right)$
coefficients of determination. The proportion of response variance that is associated with fixed effects only is represented by
 $R_{m}^{2} $
, whereas the variance explained by both fixed and random effects is described by
 $R_{c}^{2} $
(Nakagawa and Schielzeth Reference Nakagawa and Schielzeth2013).
A rectangular hyperbolic model (Baumann et al. Reference Baumann, Bastiaans and Kropff2001; Spitters Reference Spitters1983) was used to assess the relationship between weed biomass and soybean population, and can be described as
 $$B_{w} \, {\equals}\, {{M_{w} } \over {1{\plus}i_{w} P_{s} }},$$
where B w is weed biomass (kg ha−1); M w is mean weed biomass (kgha−1) at the lowest soybean planting rate; i w is the reduction in weed biomass per soybean plant (hectares per plant), which describes the initial slope of the relationship; and P s is soybean population (plants per hectare), which has been adjusted by subtracting the lowest soybean population (by site) from the measured population in each plot. The lowest populations were 100,000 and 180,000plantsha−1 in Aurora and Hurley, respectively. In the absence of a weedy check (i.e., 0 seeds ha−1 planting rate) treatment, this adjusted soybean population allows us to estimate the initial reduction in weed biomass from increasing soybean planting rates above the lowest rate tested.
The rectangular hyperbolic model is commonly used to assess the relationship between weed density and yield loss (Cousens Reference Cousens1985a, Reference Cousens1985b). To quantify the effect of weed biomass on crop yield, the hyperbolic model can be modified (Ryan et al. Reference Ryan, Smith, Mortensen, Teasdale, Curran, Seidel and Shumway2009) to
 $$Y_{s} \, {\equals}\, {{{1 \over {a_{0} }}P_{s} } \over {1{\plus}i_{w} B_{w} }},$$
where Y s is soybean yield (kg ha−1); a 0 is the reciprocal of the yield of an individual soybean plant (plants kg−1) at the lowest observed weed biomass level, which determines the maximum possible soybean yield (i.e., y-intercept); P s is soybean population (plants ha−1); i w is the initial soybean yield loss per unit weed biomass (ha kg−1), which determines the slope of the relationship; and B w is weed biomass (kg ha−1).
An asymptotic model that has been modified to pass through the origin (Pinheiro and Bates Reference Pinheiro and Bates2000) was used to describe the relationship between soybean planting rate and yield. Constraining the model through the origin is biologically realistic as there will be no soybean yield at a planting rate of 0 seeds ha−1. This model was constructed as
 $$Y_{s} \, {\equals}\, a\left( {1{\minus}e^{{\left( {{\minus}e^{b} R_{s} } \right)}} } \right),$$
where Y s is soybean yield (kg ha−1); a represents the horizontal asymptote; b denotes the natural logarithm of the rate constant; and R s is soybean planting rate (seeds ha−1). The b parameter also corresponds to the half-life (ln2/e b ), which represents the soybean planting rate at which half of the maximum (asymptotic) yield is reached. The nlme function in R (nlme package; Pinheiro et al. Reference Pinheiro, Bates, DebRoy, Sarkar and Core Team2016) was used for all three nonlinear mixed-effects models, with block as a random effect.
A partial budget analysis was conducted to assess profitability across the range of soybean planting rates. Partial returns were calculated as
 $$P_{r} \, {\equals}\, \left( {Y_{s} \cdot M_{p} } \right){\minus}\left( {R_{s} \cdot C_{s} } \right),$$
where P r is the partial return ($ ha−1); Y s is soybean yield (kg ha−1); M p is the mean market price of $1.04 kg−1 for organic food-grade soybean in 2014 (USDA-AMS 2016); R s is soybean planting rate (seeds ha−1); and C s is the soybean seed cost of $0.0004 per seed (4,630 seeds kg−1 at $1.85 kg−1, or $56 for a unit of 140,000 seeds). A quadratic mixed-effects model best described the relationship between soybean planting rate and partial return (lme function in the nlme package in R; Pinheiro et al. Reference Pinheiro, Bates, DebRoy, Sarkar and Core Team2016).
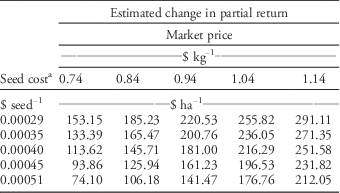
Estimated changes in partial return were also calculated for a range of soybean seed costs ($0.00029 to $0.00051 per seed) and market prices ($0.74 to $1.14 kg−1). The estimated change in partial return reflects the economic loss or gain from planting soybean at 687,000 seeds ha−1 (the average of the predicted economically optimal planting rates from both sites), rather than at the recommended rate of 321,000 seeds ha−1 for conventional soybean planted at 76-cm row spacing (Cox and Cherney Reference Cox and Cherney2011; Orlowski et al. Reference Orlowski, Cox, DiTommaso and Knoblauch2012). The predicted yield advantage of 349 kg ha−1 when planting at 687,000 seeds ha−1 instead of 321,000 seeds ha−1 was used for Y s , and the additional number of seeds (366,000 seeds ha−1) required at the higher planting rate was used for R s in Equation 4.
Results and Discussion
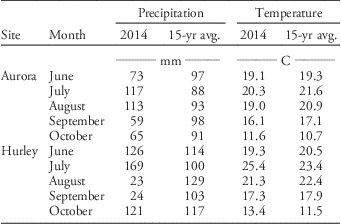
Monthly precipitation and temperature in 2014 differed considerably between Aurora and Hurley (Table 1) (Northeast Regional Climate Center 2016). Compared with the 15-year average, Aurora received 25% less precipitation during June, with above-average precipitation in July and August. In Hurley, excessive rainfall in June and July were followed by droughty conditions in August and September. The average temperatures from June through October were 17.2 C in Aurora and 19.3 C in Hurley, which were close to their respective long-term averages of 17.9 and 19.1 C. Also, mean cover crop biomass production (±SE) was 3,426±257 kg ha−1 in Aurora and 8,544±747 kg ha−1 in Hurley.
Total precipitation and average temperature by month at Aurora and Hurley, New York, during the 2014 soybean growing season.

Relationship Between Soybean Planting Rate and Population
As a percentage of the planting rates, soybean population in August was lower on average in Aurora (74%, P<0.001) compared with Hurley (78%, P<0.001) (Figure 1). In Aurora, soybean population decreased from 78% at the lowest planting rate (195,000 seeds ha−1) to 72% at the highest planting rate (906,000 seeds ha−1). Soybean population also decreased from the lowest to the highest rate in Hurley, ranging from 101% to 68%. These reduced populations at higher planting rates are likely due to greater self-thinning (intraspecific competition). Other factors that might have affected establishment across planting rates include insufficient soil moisture, inadequate seed placement, and poor seed-to-soil contact.
Relationship between soybean planting rate (seeds ha−1; x) and population (plants ha−1; y), as described by a linear mixed-effects model with block as a random effect and the intercept set at 0. In Aurora, y=0.74x (
 $R_{m}^{2} $
=0.81,
 $R_{c}^{2} $
=0.85, P<0.001), and in Hurley, y=0.78x (
 $R_{m}^{2} $
=0.73,
 $R_{c}^{2} $
=0.80, P<0.001). The diagonal dotted line represents 90% germination, which corresponds to the certified germination test for the IA 2053 soybean seed used in this experiment.

Transpiration prior to cover crop termination and following incomplete termination can markedly reduce soil moisture (Ashford and Reeves Reference Ashford and Reeves2003; Liebl et al. Reference Liebl, Simmons, Wax and Stoller1992; Moschler et al. Reference Moschler, Shear, Hallock, Sears and Jones1967; Munawar et al. Reference Munawar, Blevins, Frye and Saul1990). Below-average precipitation in June at Aurora (Table 1), exacerbated by the impact of pretermination transpiration losses, likely inhibited soybean germination and emergence (Ashford and Reeves Reference Ashford and Reeves2003; Helms et al. Reference Helms, Deckard, Goos and Enz1996; Wells et al. Reference Wells, Brinton and Reberg-Horton2015) and increased seedling desiccation and mortality (Eckert Reference Eckert1988) owing to dry soil conditions. This might help explain the lower soybean populations in Aurora compared with Hurley, which received above-average precipitation in June.
In addition to low soil moisture conditions, no-till planter configuration and poor seed placement can also reduce soybean populations. Despite evenly distributing 318 kg of additional weight among the no-till planter units, it was still difficult to achieve the targeted planting depth due to the hard, dry soil conditions in Aurora. The no-till planter was outfitted with wavy coulters, which are less effective at penetrating dry soils than other types, such as ripple or smooth coulters (Mirsky et al. Reference Mirsky, Ryan, Curran, Teasdale, Maul, Spargo, Moyer, Grantham, Weber, Way and Camargo2012). Furthermore, no-till planting through thick cover crop mulch can be particularly challenging due to hair-pinning, which occurs when residue is pressed into the seed furrow and adequate seed-to-soil contact is prevented (Hovermale et al. Reference Hovermale, Camper and Alexander1979; Williams et al. Reference Williams, Mortensen and Doran2000). Hair-pinning was observed at both sites, and nongerminated seeds were found on top of cover crop residue, especially when furrow closure was incomplete. Although cover crop production was substantially lower in Aurora, hair-pinning was not more prevalent in Hurley.
Row cleaners can minimize hair-pinning by shifting the cover crop residue away from the double-disk openers (Wells et al. Reference Wells, Brinton and Reberg-Horton2015), but their effectiveness is diminished if the row cleaner wheels become tangled by residue (Mirsky et al. Reference Mirsky, Ryan, Curran, Teasdale, Maul, Spargo, Moyer, Grantham, Weber, Way and Camargo2012). Although creating a within-row gap in the mulch would reduce the weed suppression provided by the rolled cover crops, faster emergence and higher soybean populations (Mirsky et al. Reference Mirsky, Ryan, Curran, Teasdale, Maul, Spargo, Moyer, Grantham, Weber, Way and Camargo2012) could potentially compensate by enhancing soybean competitiveness (Place et al. Reference Place, Reberg-Horton, Dunphy and Smith2009; Wells et al. Reference Wells, Brinton and Reberg-Horton2015). Our no-till planter setup did not include row cleaners, but the soybean populations in our experiment were similar to those reported under conventional no-till management from previous research in New York (Cox and Cherney Reference Cox and Cherney2011; Orlowski et al. Reference Orlowski, Cox, DiTommaso and Knoblauch2012), as well as other studies in the United States (De Bruin and Pedersen Reference De Bruin and Pedersen2008a; Ethredge et al. Reference Ethredge, Ashley and Woodruff1989; Lee et al. Reference Lee, Egli and TeKrony2008; Walker et al. Reference Walker, Mengistu, Bellaloui, Koger, Roberts and Larson2010). Still, further modifications to no-till planters will be helpful for improving seed placement and potentially lowering recommended planting rates, if the performance of such configurations is consistently demonstrated.
Weed Response to Soybean Population
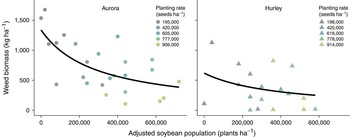
Plot-level weed biomass ranged from 107 to 1,676 kg ha−1 in Aurora and from 3 to 1,128 kg ha−1 in Hurley. Increasing the soybean population effectively reduced weed biomass at both sites (Figure 2). Results obtained using a rectangular hyperbolic model (Equation 1) and subtracting the lowest observed soybean population by site from each observed population in each plot (i.e., setting the lowest observed soybean population at each site to 0 plants ha−1) showed that weed biomass decreased nonlinearly in both Aurora (i w =3.45 ×10⁻⁶ hectares per plant, P<0.001) and Hurley (i w =2.55×10⁻⁶ hectares per plant, P=0.1) as the adjusted soybean population increased (Figure 3).
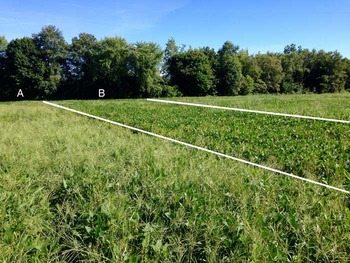
Visible difference in weed suppression at the (A) 198,000 and (B) 778,000 seeds ha−1 planting rates in Hurley, New York. Large crabgrass is visibly abundant at the 198,000 seeds ha−1 planting rate, whereas few weeds can be seen over the soybean canopy at the higher planting rate. The photograph was taken on the same day as weed biomass sampling, approximately 11 weeks after soybean planting.

Effect of adjusted soybean population (plants ha−1) on weed biomass (kg ha−1) at approximately 11 weeks after planting. Using a rectangular hyperbolic model with block as a random effect (Equation 1), the lowest observed soybean population at each site was set to 0 plants ha−1. Mean weed biomass (M w ) at the lowest soybean plating rate was 1,338 and 619 kg ha−1 in Aurora and Hurley, respectively. Representing the reduction in weed biomass per soybean plant, the initial slope (i w ) was 3.45 × 10⁻⁶ hectares per plant (P<0.001) in Aurora and 2.55 × 10⁻⁶ hectares per plant (P=0.1) in Hurley. Symbol colors correspond to planting rates, which differed slightly by site.

Our results are consistent with those of other studies demonstrating that high soybean planting rates contribute to weed suppression through interspecific competition (Monks and Oliver Reference Monks and Oliver1988; Weber and Staniforth Reference Weber and Staniforth1957). Though shading is the primary mechanism by which weeds are suppressed with this cultural practice (Bastiaans et al. Reference Bastiaans, Paolini and Baumann2008), higher soybean planting rates have the potential to enhance competition for other resources (Arce et al. Reference Arce, Pedersen and Hartzler2009). In organic no-till–planted soybean, increasing planting rates have also been shown to interact synergistically with increasing cover crop mulch rates (Ryan et al. Reference Ryan, Mirsky, Mortensen, Teasdale and Curran2011). High soybean planting rates, often in conjunction with narrower row spacing, have long been used to hasten canopy closure and enhance shading (Ball et al. Reference Ball, Purcell and Vories2000a, Reference Ball, Purcell and Vories2000b; Place et al. Reference Place, Reberg-Horton, Dunphy and Smith2009; Wax et al. Reference Wax, Nave and Cooper1977), which is advantageous for minimizing the germination of later-emerging annual weeds (Burnside and Colville Reference Burnside and Colville1964; Mickelson and Renner Reference Mickelson and Renner1997; Peters et al. Reference Peters, Gebhardt and Stritzke1965; Wax and Pendleton Reference Wax and Pendleton1968; Yelverton and Coble Reference Yelverton and Coble1991). As observed in our experiment, shaded subcanopy conditions can reduce weed biomass (Mohler and Callaway Reference Mohler and Callaway1995; Tharp and Kells Reference Tharp and Kells2001). Because fecundity is directly correlated with biomass production (Conley et al. Reference Conley, Binning, Boerboom and Stoltenberg2002; Hartzler et al. Reference Hartzler, Battles and Nordby2004), more rapid canopy formation can decrease weed seed production and minimize contributions to the weed seedbank (Arce et al. Reference Arce, Pedersen and Hartzler2009). Although weed seed production was not measured in our research, high soybean planting rates have the potential to contribute to both short- and long-term weed management.
Influence of Weed Biomass on Soybean Yield
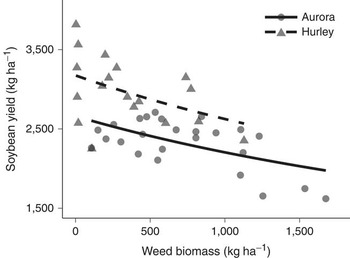
Congruent with previous research showing that weed interference in soybean reduces the number of pods per plant and negatively impacts other yield components (Burnside and Moomaw Reference Burnside and Moomaw1977; Harris and Ritter Reference Harris and Ritter1987; Knake and Slife Reference Knake and Slife1969; Krausz et al. Reference Krausz, Young, Kapusta and Matthews2001; Monks and Oliver Reference Monks and Oliver1988; Young et al. Reference Young, Wyse and Jones1982), soybean yield decreased as weed biomass increased in our experiment (Figure 4). However, we cannot completely separate the effects of increasing weed biomass and decreasing soybean density on soybean yield. Visual assessments revealed that the dominant weed species (collectively >80% weed cover) in Aurora were broadleaf weeds, common ragweed (Ambrosia artemisiifolia L.), and black medic (Medicago lupulina L.), whereas large crabgrass [Digitaria sanguinalis (L.) Scop.], fall panicum (Panicum dichotomiflorum Michx.), and barnyardgrass [Echinochloa crus-galli (L.) Beauv.] were most prevalent in Hurley (Figure 2). Although the two sites contained different weed communities, the initial reduction in soybean yield associated with increasing weed biomass was very similar in Aurora (i w =2.10 ×10⁻⁴ ha kg−1, P=0.007) and Hurley (i w =2.10×10⁻⁴ ha kg−1, P=0.1). This indicates that weeds exerted a consistent competitive effect across sites. However, other soybean studies have shown that broadleaf weeds, and common ragweed in particular, are more competitive than grass weeds (Coble et al. Reference Coble, Williams and Ritter1981; Cowbrough et al. Reference Cowbrough, Brown and Tardif2003; Hock et al. Reference Hock, Knezevic, Martin and Lindquist2006; McWhorter and Hartwig Reference McWhorter and Hartwig1972; Nave and Wax Reference Nave and Wax1971; Weaver Reference Weaver2001).
Response of soybean yield (kg ha−1) to weed biomass (kg ha−1). A rectangular hyperbolic model with block as a random effect (Equation 2) was used to describe this nonlinear relationship. The parameter estimate for the reciprocal of the weed-free yield of an individual soybean plant (a 0) was 161 plants kg−1 (P<0.001) in Aurora and 155 plants kg−1 (P<0.001) in Hurley. The soybean yield loss per unit weed biomass (i w ) was 2.10×10⁻⁴hakg−1 (P=0.007) in Aurora and 2.10×10⁻⁴hakg−1 (P=0.1) in Hurley.

Soybean Yield Response to Planting Rate
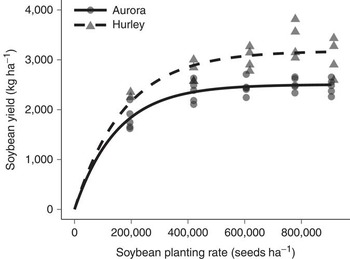
Soybean yield at the plot level ranged from 1,620 to 2,709 kg ha−1 in Aurora and 2,250 to 3,815 kg ha−1 in Hurley (Figure 5). Soybean yields were comparable to those previously observed in the long-term Cornell Organic Cropping Systems Experiment (Caldwell et al. Reference Caldwell, Mohler, Ketterings and DiTommaso2014), indicating little to no yield difference relative to tillage-based soybean production practices. The nonlinear model (Equation 3) shows that the predicted asymptote was 2,504 kg ha−1 in Aurora (P<0.001) and 3,178 kg ha−1 in Hurley (P<0.001), and that the parameter estimate for the natural logarithm of the rate constant (b) was −11.9 in Aurora (P<0.001) and −12.1 in Hurley (P<0.001). Although the b parameter relates to the soybean planting rate at which half of the maximum yield is obtained (i.e., the half-life, ln2/e b ), a comparison of half-lives between sites is not particularly useful given the difference in the asymptotes (i.e., the half-life in Aurora is shorter because the asymptote is lower and it is reached at a lower planting rate than it is in Hurley).
Relationship between soybean planting rate (seeds ha−1) and yield (kg ha−1). An asymptotic model constrained to pass through the origin (Equation 3) was used, with block as a random effect. In Aurora, the horizontal asymptote (a) was predicted at 2,504 kg ha−1, and the natural logarithm of the rate constant (b) was −11.9. In Hurley, a=3,178 kg ha−1 and b=−12.1. Both parameter estimates at each site were significant (P<0.001).

It is well established that at less-dense populations, soybean can maintain yield per unit area through increased partitioning of dry matter to branches, a greater number of seeds per plant, and other forms of compensatory growth (Board Reference Board2000; Carpenter and Board Reference Carpenter and Board1997; Lueschen and Hicks Reference Lueschen and Hicks1977; Pedersen and Lauer Reference Pedersen and Lauer2002; Weber et al. Reference Weber, Shibles and Byth1966; Wells Reference Wells1991). Consequently, yield gains from higher planting rates have been inconsistent, which corresponds to the variability introduced through interactions among cultivar genetics, environmental conditions, and management practices (Salado-Navarro et al. Reference Salado-Navarro, Sinclair and Hinson1986). Numerous researchers have reported that yield initially increases in response to increasing plant populations, but then it will remain static or decline above a certain population level (Ball et al. Reference Ball, Purcell and Vories2000a, Reference Ball, Purcell and Vories2000b; Duncan Reference Duncan1986; Egli Reference Egli1988; Norsworthy and Oliver Reference Norsworthy and Oliver2001; Weber et al. Reference Weber, Shibles and Byth1966; Wiggans Reference Wiggans1939). In our experiment, soybean yield increased nonlinearly as the planting rate increased, eventually reaching a plateau at higher planting rates. This asymptotic relationship between increasing planting rate and yield has been attributed to reduced radiation use efficiency (Purcell et al. Reference Purcell, Bass, Reaper and Vories2002), as well as more intense intraspecific competition (Egli Reference Egli1988) resulting in diminishing yield gains (Edwards and Purcell Reference Edwards and Purcell2005) or constant yield (Duncan Reference Duncan1986).
Higher populations also tend to result in taller plants (Hicks et al. Reference Hicks, Pendleton, Bernard and Johnston1969; Johnson and Harris Reference Johnson and Harris1967; Wilcox Reference Wilcox1974), which can contribute to an increased incidence of lodging (Cooper Reference Cooper1971b; Costa et al. Reference Costa, Oplinger and Pendleton1980; Weber et al. Reference Weber, Shibles and Byth1966). When lodging is not severe, soybean yield is often the same across a range of populations (Cooper Reference Cooper1971b), or optimum populations can be higher (Probst Reference Probst1945). Above optimum populations, an increase in lodging—especially when it occurs during early pod fill (Cooper Reference Cooper1971a)—can result in lower yields (Weber et al. Reference Weber, Shibles and Byth1966). Despite populations exceeding 700,000 plants ha−1, minimal lodging was observed in our experiment, neither slowing harvest nor reducing yield. Feedback from organic farmers in New York indicated that the cover crop mulch can even expedite soybean harvest by producing less friction than bare soil (K Martens, personal communication, 2015). By allowing farmers to guide the head of their combine on top of the rolled mulch, this system can also help farmers avoid damaging their combine head on protruding rocks that are common in soybean fields where inter-row cultivation is used (K Martens, personal communication, 2015). This damage is a major concern for many soybean producers farming shallow, rocky soils (T Oechsner, personal communication, 2015).
Partial Profitability
In Aurora, the quadratic model predicted a maximum partial return of $2,357 ha−1 at a planting rate of 646,000 seeds ha−1, whereas in Hurley, the predicted maximum partial return was $3,010 ha−1 at a rate of 728,000 seeds ha−1 (Figure 6). These two predicted economically optimal planting rates correspond to average late summer soybean populations of 476,000 and 565,000 plants ha−1 in Aurora and Hurley, respectively (Figure 1). At planting rates above the predicted optimum levels, partial returns begin to decline as the increase in seed cost is not offset by a significant increase in yield (Figure 5). Using an average planting rate (687,000 seeds ha−1) calculated and based on the economically optimal rates from both sites, the estimated changes in partial return are positive across all seed cost and market price combinations (Table 2) due to the substantial predicted yield advantage (349 kgha−1) obtained when planting at 687,000seedsha−1 instead of 321,000 seeds ha−1.
Partial return ($ ha−1, y) as a function of soybean planting rate (seeds ha−1, x). As described in Equation 4, this response is augmented by soybean seed cost ($0.0004 per seed) and the mean market price for organic food-grade soybean in 2014 ($1.04 kg−1). A quadratic model with block as a random effect represents this relationship at both sites. In Aurora, the equation is y=−(2.53×10−9)x
2+(3.27×10⁻³)x+1,301 (
 $R_{m}^{2} $
=0.48,
 $R_{c}^{2} $
=0.78; first-degree term, P<0.001; second-degree term, P<0.001). In Hurley, y=−(2.65×10−9)x
2+(3.86×10⁻³)x+1,604 (
 $R_{m}^{2} $
= 0.34,
 $R_{c}^{2} $
=0.58; first-degree term, P=0.03; second-degree term, P=0.1). Vertical lines indicate the recommended planting rate for conventional soybean production at 76-cm-wide rows (321,000 seeds ha−1, dotted line), and the predicted economically optimal planting rates in both Aurora (646,000 seeds ha−1, solid line) and Hurley (728,000 seeds ha−1, dashed line).

The estimated change in partial return ($ ha−1) across a range of market prices and seed costs for planting at 687,000 seeds ha−1 (the average economically optimal rate based on both sites), rather than planting at the conventional recommended soybean planting rate of 321,000 seeds ha−1 (76-cm row spacing in both cases). Estimated change in partial return was calculated by multiplying the yield advantage (349 kg ha−1) by the market price ($ kg−1), and then subtracting the product of the seed cost ($ per seed) and the number of additional seeds (366,000 seeds ha−1) required for the higher planting rate of 687,000 seeds ha−1.

a Based on 4,630 seeds kg−1, these seed costs correspond to $1.35, $1.60, $1.85, $2.10, and $2.35 kg−1.
Although high planting rates have been associated with enhanced weed suppression and greater yields in some instances, higher rates do not consistently improve profitability due to the concomitant increase in seed costs. In an experiment conducted by Harder et al. (Reference Harder, Sprague and Renner2007), increasing the population from approximately 300,000 to 445,000 plants ha−1 did not significantly increase soybean yield, and resulted in lower profit due to the increased seed cost. As another example, Norsworthy and Oliver (Reference Norsworthy and Oliver2001) found that higher soybean planting rates sometimes required only one application of glyphosate, whereas lower rates of 185,000 and 247,000 seeds ha−1 required three glyphosate applications to maintain 90% control of weed species. However, the reduced costs associated with fewer herbicide applications at high planting rates were negated by technology fees and the high cost of herbicide-resistant soybean seed; as a result, maximum gross profit margin was achieved at the lowest planting rate. In our analysis, the substantial partial returns at the high planting rates of 646,000 and 728,000 seeds ha−1 depend on correspondingly high yields and the considerable price premium obtained for organic food-grade soybean. It is important to acknowledge that the market price of organic feed-grade soybean is lower than that of organic food-grade soybean, but it is still often double the price of conventional feed-grade soybean (USDA-AMS 2016; USDA-NASS 2016). Although organic feed-grade soybean commands a lower price, yields are typically greater than those of food-grade soybean cultivars.
The economic advantage of planting soybean at 687,000 seeds ha−1 decreases as seed cost increases or market price decreases, but farmers would still realize an increase in partial returns of $74.10 ha−1 (before hauling costs) at the highest seed cost and lowest market price in Table 2. Notably, the average food-grade market price for organic soybean from 2008 to 2014 was $0.92 kg−1 (USDA-AMS 2016). As a relatively high cost of $0.0004 per seed ($1.85 kg−1; 4,630 seeds kg−1) was used for the partial return calculations (Equation 4, Figure 6), farmers that save their own seed or source less-expensive seed would realize even greater returns (see the complementary analysis in Table 2). The two highest seed costs of $0.00045 and $0.00051 per seed were included in the analysis so that we could estimate partial returns at highly unfavorable seed cost–market price combinations. If lodging does not result in yield losses at harvest or economic losses due to slower harvesting, our results indicate that a high planting rate of between 646,000 and 728,000 seeds ha−1 optimizes profitability in cover crop–based organic rotational no-till soybean production.
Management Considerations
Narrow row spacing can improve groundcover and increase shading by means of earlier canopy closure than wider row spacing (Bradley Reference Bradley2006). However, the use of grain drills tends to result in less uniform seed depth and more variable within-row distance between seeds compared to the use of row crop planters (Bertram and Pedersen Reference Bertram and Pedersen2004), negatively affecting emergence and reducing final stand uniformity (Cox and Cherney Reference Cox and Cherney2011). Unless cover crop biomass levels are relatively low, the use of planters is recommended in organic no-till–planted soybean production to achieve better seed placement through the thick layer of mulch (Mirsky et al. Reference Mirsky, Ryan, Teasdale, Curran, Reberg-Horton, Spargo, Wells, Keene and Moyer2013). We planted soybean on 76-cm row spacing primarily because it facilitates inter-row high-residue cultivation if weed suppression from the cover crop is insufficient. A high-residue cultivator can be a very effective tool for managing weeds that have broken through the mulch between the rows (Nord et al. Reference Nord, Ryan, Curran, Mortensen and Mirsky2012). Furthermore, soybean with wider row spacing has been shown to perform better than soybean with narrow row spacing when soil moisture is limited (Alessi and Power Reference Alessi and Power1982; Devlin et al. Reference Devlin, Fjell, Shroyer, Gordon, Marsh, Maddux, Martin and Duncan1995), and lodging tends to be reduced with wider row spacing compared to narrower spacing when the planting rate is elevated (Cooper Reference Cooper1971b).
As a compromise between narrow drilled rows (e.g., 19 cm) and wide planted rows (≥76 cm), a split-row planter for 38-cm rows provides the improved seed placement and stand uniformity of a row crop planter, as well as earlier canopy closure, enhanced shading, and potentially higher yields because of the narrower row spacing (Bertram and Pedersen Reference Bertram and Pedersen2004; Costa et al. Reference Costa, Oplinger and Pendleton1980; De Bruin and Pedersen Reference De Bruin and Pedersen2008a). Although high-residue cultivation would not be possible at this row spacing, greater shading from the narrower soybean rows might help reduce the need for this practice.
At both sites, increasing the soybean planting rate resulted in lower weed biomass and higher soybean yields, and the greatest partial returns were attained at planting rates nearly double the recommended rates used by most conventional and tillage-based organic soybean producers. When high planting rates do not reduce yield via lodging or other deleterious effects, such rates can provide some “insurance” against poor seed germination (Duncan Reference Duncan1986). Given the price premium for organic soybean, high planting rates for cover crop–based organic rotational no-till soybean are relatively cheap insurance when the benefits of improved weed suppression and higher yields are taken into consideration. As our experiment was carried out with one cultivar during a single year on fields that had not yet completed the transition to certified organic, further research should be conducted on certified organic land to assess the consistency of our results under different environmental conditions. If subsequent research also evaluates the performance of numerous cultivars, regional planting rate recommendations can be developed specifically for organic no-till–planted soybean production.
Acknowledgements
We would like to thank Chris Pelzer and Brian Caldwell for their assistance with in-field data collection, as well as Paul Stachowski and his staff for their help with field operations in Aurora, and John Gill and his crew for their assistance with rolling and planting in Hurley. We would also like to thank Fulbright Canada, the Natural Sciences and Engineering Research Council of Canada, and Hatch funding (2013-14-425, Expanding the Role of Cover Crops in Sustainable Cropping Systems) for financially supporting this research.