I. INTRODUCTION
Graphene is the basic building block of mineral graphite. It is a flat monolayer of carbon atoms tightly packed into a two-dimensional-honeycomb lattice. Reference Rao, Biswas, Subrahmanyam and Govindaraj1 Thus, it is characterized as the thinnest material in our universe. Reference Geim and MacDonald2 Recently, graphene has attracted enormous worldwide interest, Reference Zhu, Murali, Stoller, Ganesh, Cai and Ruoff3–Reference Wang, Shi, Huang, Ma, Wang, Chen and Chen5 due to its extremely large specific surface area and unique electrical, optical, mechanical, and thermal properties. Reference Avouris, Chen and Perebeinos6–Reference Geim and Novoselov8 It is also known of anomalous quantum Hall effect. Reference Novoselov, Geim, Morozov, Jiang, Katsnelson, Grigorieva, Dubonos and Firsov9 The unusual properties of graphene make it a radical key for modern technology in a wide range of applications. Miniaturized nanoelectronic components, photovoltaic cells, chemical and biological sensors, hysteretic magnetoresistance, Reference Geim and Novoselov8 transparent conducting electrodes, supercapacitors, and electromechanical resonators Reference Tang, Li, Ji, Teng, Tai, Ye, Wei and Lau10 are the major potential applications. Nevertheless, several of these applications are still not feasible because the large-scale production of high-quality graphene remains challenging. This is due to the lack of a facile, cost-effective and eco-friendly method for the mass production of high-quality graphene, yet to date. Reference Tang, Li, Ji, Teng, Tai, Ye, Wei and Lau10,Reference Gao, Alemany, Ci and Ajayan11
Currently, micromechanical exfoliation of graphite, Reference Novoselov, Geim, Morozov, Jiang, Zhang, Dubonos, Grigorieva and Firsov12 chemical vapor deposition, Reference Mattevi, Kima and Chhowall13 epitaxial growth on SiC, Reference Kellar, Alaboson, Wang and Hersam14 and chemical exfoliation of graphite Reference Park, An, Jung, Piner, An, Li, Velamakanni and Ruoff15 have been widely pursued to prepare graphene. Compared to the first three methods, chemical exfoliation of graphite is considered to be the most effective and economical way to prepare high throughput of graphene nanosheets in the form of fine powder. Reference Stankovich, Dikin, Piner, Kohlhaas, Kleinhammes, Jia, Wu, Nguyen and Ruoff16 It is a top-down method, proceeded through several approaches. The most common one is a three step process involving, oxidation of graphite into graphite oxide, followed by exfoliation into graphene oxide (GO), and finally chemical or thermal reduction to graphene. In such process, graphite oxide is prepared by treating graphite with hazard strong oxidizing agents through either Brodie's, Reference Brodie17 Hummers' Reference Hummers and Offeman18 or modified Hummers' methods. Reference Becerril, Mao, Liu, Stoltenberg, Bao and Chen19–Reference Shi, Ai, Chen, Cui and Fu21 Further, highly reduced GO can be only obtained, when thermal reduction of GO is performed at extremely high temperatures 900–1100 °C (Refs. Reference Ganguly, Sharma, Papakonstantinou and Hamilton22–Reference Zhan, Ni, Chen, Sun, Luo, Lai, Yu, Wee and Shen25) or hazard strong reducing agents, such as hydrazine, Reference Stankovich, Dikin, Piner, Kohlhaas, Kleinhammes, Jia, Wu, Nguyen and Ruoff16,Reference Krishnamoorthy, Kim and Kim26–Reference Zhou, Bao, Tang, Zhong and Loh28 are utilized for the chemical reduction of GO. Excessive thermal energy and hazard chemicals lead to significant structural disorder into the aromatic sp 2 C-network of the produced graphene. Otherwise, partially reduced GO is obtained, when eco-friendly weak reducing agents such as ammonia, Reference Zhou, Bao, Tang, Zhong and Loh28,Reference Bai, Rakhi, Chen and Alshareef29 galactose, Reference Krishnamoorthy, Veerapandian, Mohan and Kim30 and Na2CO3 Reference Jin, Huang, Zhang, Jia and Hu31 are utilized for the chemical reduction of GO. Thus, the main drawbacks of this approach are (i) the use of many hazard chemicals for both humans and environment; (ii) multistep and time-consuming; (iii) excessive thermal energy may be implemented; and (iv) presence of numerous defects in the microstructure of the produced powdery graphene nanosheets, which in turn, result in noticeable declines in the unique properties of graphene. Reference Tang, Li, Ji, Teng, Tai, Ye, Wei and Lau10,Reference Kuila, Khanra, Hoon, Kuk, Joong and Hee32 Another approach for the chemical exfoliation of graphite involves intercalation of graphite with alkali metals, such as potassium Reference Viculis, Mack, Mayer, Hahn and Kaner33 and lithium, Reference Xu, Sun, Shen, Yang, Que, Zhang and Song34 followed by exfoliation of such graphite intercalated compounds into few-layer graphene nanosheets. This approach is significantly more facile and economical than the former one. However, it is time-consuming and hazard strong acids are utilized throughout the process. This negatively affects the quality, productivity, and economy of the produced powdery graphene nanosheets.
Recently, Tang et al. Reference Tang, Li, Ji, Teng, Tai, Ye, Wei and Lau10 have reported a one-step novel bottom-up self-assembly technique for the preparation of powdery GO nanosheets from glucose as a sole reagent, via hydrothermal route. It is a facile, safe, controllable, environmentally friendly, and low-cost method. Accordingly, it can be of great potential in the mass production of high-quality GO. Herein, Tang's method has been modified and used for the first time, for one-step gram-scale preparation of reduced graphene oxide (RGO), which has significantly lower O-concentration than GO, from glucose precursor. This has been accomplished by increasing the vapor/liquid (V/L) ratio and addition of ammonia to the reaction medium, within the Teflon-lined autoclave system. The optimum hydrothermal RGO output, regarding structural quality and productivity, has been then thermally annealed at various temperatures under inert atmosphere, to prepare powdery graphene-like nanosheets in gram-scale. All the prepared samples were thoroughly characterized to confirm their structure and morphology and consequently determine the graphene-like nanosheets sample of the most remarkable structural characteristics. It is defined as the sheet-like structured sample with the minimal content of oxide functional groups, structural defects and number of stacked layers. Thus, the present study is an attempt to provide a new facile, cost effective, and eco-friendly route for large-scale production of powdery graphene-like nanosheets with remarkable structural characteristics, which may broaden the graphene practical applications.
II. EXPERIMENTAL
The approach for gram-scale production of powdery graphene-like nanosheets involves synthesis of powdery RGO-like nanosheets via hydrothermal treatment of glucose, followed by thermal annealing under inert atmosphere.
A. Hydrothermal treatment of glucose
1. Materials
Anhydrous crystalline D-glucose (99.5%) and ammonium hydroxide (NH4OH, 33% NH3) were obtained from Cargill (Cairo, Egypt) and Sigma-Aldrich (Lyon, France), respectively. Both chemical reagents were of analytical grade and used as received without further purification. Doubly distilled water was used throughout the experiments.
2. Hydrothermal synthesis of RGO
First, glucose as a sole reagent has been hydrothermally treated. In a typical procedure, 0.5 M aqueous glucose solution was sealed in a 250 mL Teflon-lined autoclave, heated at 200 °C for 4 h, and then slowly cooled to room temperature. A dark slurry was formed in the Teflon tube. It was filtered, washed several times with distilled water and then dried in vacuum oven at 70 °C for two days. The internal pressure within the autoclave system was manipulated via varying the volume of glucose solution, which in turn, affects the gaseous (vapor) volume within the Teflon tube. The investigated V/L volumetric ratios were 1/4, 2/3, 3/2 and 4/1. The optimum V/L ratio, regarding structural quality and productivity of the hydrothermal product, has been determined. Later on, few milliliters of ammonia were added to the aqueous glucose solution until pH reached ∼11. The mixture was then hydrothermally treated under the same conditions indicated above, keeping the V/L ratio within the autoclave system fixed at its optimum value. The resultant dark fluffy precipitate was filtered, washed several times with distilled water and then dried in vacuum oven at 70 °C for two days.
B. Thermal annealing of hydrothermally prepared RGO
The hydrothermally prepared samples at the optimum V/L ratio, from glucose as a sole reagent and glucose combined with ammonia, were thermally annealed under inert atmosphere. Samples were thermally treated in a Carbolite tube furnace at different temperatures 500, 600, 700, and 900 °C for 1 h under a flow of nitrogen gas (500 mL/min).
C. Characterizations
X-ray diffraction (XRD) was used to identify the produced powder samples and characterize their crystallographic structure. XRD patterns were obtained using a Shimadzu XRD-7000 diffractometer (30 kV, 30 mA, Cu Kα + Ni-filtered radiation, λ = 0.15406 nm; Shimadzu Corporation, Tokyo, Japan). The analysis was performed over a 2θ range 4–90°, at a scanning rate of 4°/min and a scanning step of 0.02°.
Fourier Transform Infrared (FTIR) spectroscopy was utilized to investigate the degree of oxidation of the powder samples, using a Bruker ALFA FTIR spectrometer (Bruker Corporation, Ettlingen, Germany). The spectra were recorded over the wavenumber range 600–4000 cm−1, with a resolution of 4 cm−1 and 25 scans.
Raman spectroscopy is known as a powerful nondestructive technique for characterizing carbon nanostructures. It provides information on in-plane crystallite size, crystal disorder, the extent of chemical modification and distinguishes single layer graphene or nanotubes from multilayer ones. Reference Ganguly, Sharma, Papakonstantinou and Hamilton22 Raman spectra of powder samples were recorded on Bruker SENTERRA Raman Microscope (Bruker Corporation), with 532 nm laser excitation. The spectral range was 500–4000 cm−1.
The morphology was analyzed by a scanning electron microscope (SEM, Model JSM 6360 LA; JEOL Ltd., Tokyo, Japan) and a high resolution transmission electron microscope (HR-TEM, JEOL JEM-2100; JEOL Ltd.), operating at 20 and 200 kV, respectively. SEM images were captured for the solid powder. HR-TEM samples were prepared by dropping a colloidal suspension of the powder sample in ethanol, on a carbon coated copper grid and letting the solvent to evaporate.
III. RESULTS AND DISCUSSION
A. Characteristics of hydrothermally prepared RGO
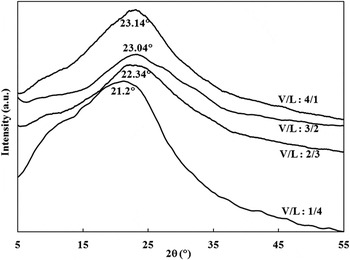
On the use of glucose as a sole reagent, the color of the produced powder changes from shiny brown to blackish brown with the increase of V/L ratio, i.e., internal pressure within the autoclave system, as shown in Fig. S1 in the Electronic Supplementary Material (ESM). This suggests reduction of the carbonaceous powder O-content with the increase of V/L ratio. XRD patterns of the powder samples, prepared at various V/L ratios, are shown in Fig. 1. A single broad peak, corresponding to the lattice plane (002) of graphitic materials, Reference Cao, Xu, Liang, Wu and Wei35 is observed at about 21–23°. The broad nature of the peak suggests the exfoliation of graphitic structure. A possible mechanism that explaining the bottom-up layer by layer synthesis of graphitic structure has been reported in Tang et al.'s research. Reference Tang, Li, Ji, Teng, Tai, Ye, Wei and Lau10 Briefly under hydrothermal conditions, glucose molecules unceasingly dehydrate and undergo cyclic polymerization, forming a monolayer of graphitic structure. A second layer of graphitic structure is then grown, taking the first layer as substrate, and thus a bi-layer graphitic structure is formed. Subsequently, tri-layer and multilayer graphitic structure can be produced.
XRD patterns of the hydrothermally produced powder at various V/L ratios.

The appearance of the (002) peak in between ∼11°, corresponding to pure GO, and ∼26°, corresponding to pure graphene, reveals that the hydrothermally produced powder is mainly RGO, Reference Huh and Mikhailov23,Reference Seresht, Jahanshahi, Rashidi and Ghoreyshi24,Reference Kuila, Khanra, Hoon, Kuk, Joong and Hee32 regardless of the used V/L ratio. However, the presence of a great shoulder around 12°, for the sample prepared at the lowest V/L ratio (1/4), reveals that a considerable fraction of GO is present in such graphitic samples. Obviously, the shoulder diminishes with the increase of V/L ratio, indicating further domination of RGO at the expense of GO within graphitic samples. Thus, the sample produced at the highest V/L ratio (4/1) seems to have traces of GO as the shoulder can be hardly seen in the corresponding XRD pattern. Moreover, the increase of V/L ratio results in a shift in the (002) peak to higher angle and a decrease in the interlayer spacing between (002) planes (d 002), illustrating less oxidation of RGO fraction within the graphitic samples. Peaks at angels (21.2, 22.34, 23.04, and 23.14°) with d-spacing (0.419, 0.397, 0.386, and 0.384 nm) are corresponding to V/L ratio of (1/4, 2/3, 3/2, and 4/1), respectively. Such phenomena can be ascribed to the higher internal pressure generated within the autoclave system due to the increased V/L ratio. Increased pressure promotes extensive dehydration of glucose molecules while being cyclically polymerized into graphitic structure, leading to more removal of oxygen functional groups and eventually formation of less oxidized graphitic structure. It is worth noting that the sample that corresponds to a V/L ratio of 3/2 exhibits a very weak GO shoulder and a (002) peak at extremely close diffraction angle to that of the sample that corresponds to a V/L ratio of 4/1. This implies that both samples possess a very close oxidation state.
The average RGO crystallite size, perpendicular to the (002) plane; expressing thus the staking height of RGO layers (D002) has been calculated using Sherrer's equation, Reference Cullity36 which is expressed by:
 $${D_{002}} = {{K\lambda } \mathord{\left/ {\vphantom {{K\lambda } {B\cos \theta }}} \right. \kern-\nulldelimiterspace} {B\,\cos\, \theta }}\quad ,$$
where K is a constant dependent on the crystallite shape (0.89), λ is the x-ray wave length, B is the full width at half maximum, and θ is the scattering angle of the (002) peak. The average number of RGO staked layers (NGL) has been subsequently obtained using the following equation Reference Huh and Mikhailov23,Reference Seresht, Jahanshahi, Rashidi and Ghoreyshi24 :
 $${\rm{NGL}} = {{{D_{002}}} \mathord{\left/ {\vphantom {{{D_{002}}} {{d_{002}}}}} \right. \kern-\nulldelimiterspace} {{d_{002}}}}\quad .$$
Estimated NGL values are 2.5, 3.2, 2.9, and 2.6 for graphitic samples produced at V/L ratios 1/4, 2/3, 3/2, and 4/1, respectively. This suggests the formation of few-layer RGO, consisting of 3–4 layers in average.
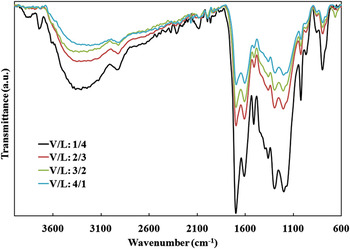
FTIR spectra of the powder samples, prepared at various V/L ratios, are shown in Fig. 2. For comparison, the baseline has been unified for all the spectra. The graphitization of glucose molecules under hydrothermal conditions can be confirmed due to the appearance of IR absorption peak at 1610 cm−1 corresponding to the in plane C=C vibration, which is intrinsic characteristic of sp 2 graphitic materials. In addition, the FTIR spectra show the presence of oxygen functional groups in the graphitic structure, as evident from the peaks at 3300, 1700, 1200, and 1022 cm−1, which are ascribed to the stretching vibration of intercalated free H2O molecules, C=O of carboxyl groups, epoxy C–O–C, and alkoxy C–O, respectively. Reference Huh and Mikhailov23,Reference Krishnamoorthy, Kim and Kim26 The presence of bound H2O molecules is also evidenced by the peaks at 1500, 1360, and 1295 cm−1, originated from bending vibration of –OH functional groups. Reference Tang, Li, Yu, Rafiee, Rafiee, Yavari and Koratkar37
FTIR spectra of the hydrothermally produced powder at various V/L ratios.

Obviously, the peaks attributed to oxygen functional groups, in specific those due to free H2O molecules and C=O of carboxyl groups, are getting weaker with the increase of V/L ratio. This is in agreement with the powder color and XRD analysis, confirming less oxidation of graphitic samples with the increased V/L ratio, internal pressure, within the autoclave system. However, the effect of V/L ratio on the oxidation state of graphitic powder cannot be considered significant, as none of the peaks attributed to oxygen functional groups disappear with the increased V/L ratio. Further, such effect becomes trivial beyond a V/L ratio of 3/2, as evidenced from the high similarity between XRD patterns and FTIR spectra of the graphitic samples produced at V/L ratios of 3/2 and 4/1.
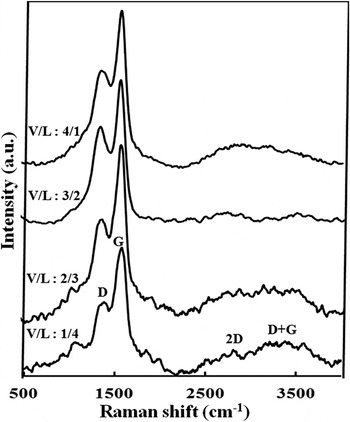
Figure 3 presents Raman spectra of the graphitic samples prepared at various V/L ratios. The Raman spectra of all samples exhibit four characteristic peaks assigned to the D (∼1310–1430 cm−1), G (∼1570–1595 cm−1), 2D (∼2500–2800 cm−1), and D + G (∼3000 cm−1) modes of graphitic materials. The G band originates from the in-plane vibration of aromatic sp 2 carbon. The 2D band is a second-order Raman feature, indicative of crystalline graphitic materials and sensitive to the aromatic C-structure. The D and D + G bands are lattice disorder-induced Raman features. Reference Zhan, Ni, Chen, Sun, Luo, Lai, Yu, Wee and Shen25,Reference Krishnamoorthy, Veerapandian, Mohan and Kim30,Reference Pimenta, Dresselhaus, Dresselhaus, Cancado, Jorio and Saito38 Graphitic lattice disorder is originated from defects associated with vacancies, grain boundaries, amorphous carbon species, sp 3 carbon species, and O-incorporation within the aromatic sp 2 C-network. Reference Kuila, Khanra, Hoon, Kuk, Joong and Hee32
Raman spectra of the hydrothermally produced powder at various V/L ratios.

Besides the main four bands, three minor Raman features can be also observed in the spectrum corresponding to the graphitic sample prepared at the lowest V/L ratio (1/4). These include two weak sets of Raman bands in the range of 980–1060 and 1700–1800 cm−1, attributed to sp 3 carbon Reference Ferrari and Robertson39 and aliphatic sp 2 carbon chain Reference Ferrari and Robertson39,Reference Casari, Li Bassi, Baserga, Ravagnan, Piseri, Lenardi, Tommasini, Milani, Fazzi, Bottani and Milani40 vibrations, respectively. In addition, the D peak exhibits a shoulder at ∼1200 cm−1, attributed to the stretching vibration of sp 2–sp 3 bonded carbon. Reference Krishnan, John and Manoj41 This reveals the presence of considerable fraction of sp 3 and aliphatic sp 2 carbon (amorphous carbon) within the graphitic sample prepared at a V/L ratio of 1/4 due to the incomplete graphitization of glucose molecules at such a low V/L ratio. Therefore significant degree of disorder dominates the aromatic sp 2 C-network of such samples. The three Raman features, related to amorphous carbon within the aromatic sp 2 C-network, are decreased in intensity when the V/L ratio increased to 2/3 and become trivial upon further increase in V/L ratio, suggesting improved degree of graphitization within the hydrothermally prepared powder i.e., reduced content of sp 3 and aliphatic sp 2 carbon accompanied by increased content of aromatic sp 2 carbon. Most probably, the extensive dehydration of glucose molecules with increased internal pressure within the autoclave system, results in generation of more aromatic sp 2 carbon domains at the expense of sp 3 and aliphatic sp 2 carbon. Thus, reduced amorphous carbon concentration, eventually, improves the structural order within the aromatic sp 2 C-network of graphitic sample.
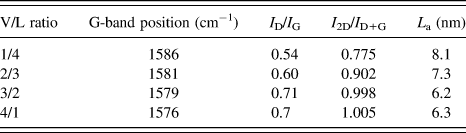
To further characterize the effect of V/L ratio on the structural disorder and defect levels within graphitic powder, the G band position and intensity ratios of I D/I G and I 2D/I D+G have been estimated at various V/L ratios, using OPUS software. In addition, the average in-plane crystallite size (lateral size) of aromatic sp 2 domains (L a) has been calculated using the Tuinstra and Koenig relation, Reference Tuinstra and Koenig42 which is indicated below:
 $${L_{\rm{a}}}{\rm{\ }} = {\rm{\ }}C\left( \lambda \right){\rm{\ }}{\left( {{{{I_{\rm{D}}}} \mathord{\left/ {\vphantom {{{I_{\rm{D}}}} {{I_{\rm{G}}}}}} \right. \kern-\nulldelimiterspace} {{I_{\rm{G}}}}}} \right)^{ - 1}}\quad ,$$
where the coefficient C(λ) is a wave length dependent prefactor (∼4.4 nm). Reference Tuinstra and Koenig42 The data are listed in Table I.
Raman data of the hydrothermally produced powder at various V/L ratios.

The table indicates that the G peak is shifted toward lower wavenumber with the increase of V/L ratio. It can be also noted that both of I D/I G and I 2D/I D+G ratios increase, as the V/L ratio increases. According to the literature, Reference Ganguly, Sharma, Papakonstantinou and Hamilton22,Reference Zhan, Ni, Chen, Sun, Luo, Lai, Yu, Wee and Shen25,Reference Krishnamoorthy, Kim and Kim26 the downward shifting of the G band and the increase of I 2D/I D+G (order-disorder) ratio can be considered powerful indicators of improved structural order interior the aromatic sp 2 crystallites (domains) of graphitic powder, upon the increase of V/L ratio. This can be attributed to the formation of graphitic structure of less amorphous carbon and oxygen concentrations with the increased internal pressure within the autoclave system. Higher I D/I G (disorder-order) ratio with increased V/L ratio, however, does not contradict with the above conclusion. This is because, Tuinstra and Koenig Reference Tuinstra and Koenig42 assigned the D band to the first order scattering from a zone boundary phonon activated by disorder due to the finite crystallite size, i.e., disorder localized at crystallite edge. Accordingly, I D/I G ratio can be considered as a measure of a specific type of sp 2 lattice disorder denoted as sp 2-edge disorder, i.e., disorder localized at the edges of sp 2 crystallites (domains) but not the interior of them. Thus, the higher I D/I G ratio is indicative of the propagation of sp 2-edge disorder within graphitic powder, as the V/L ratio increases. This interpretation is in consistence with Raman analyses of graphite based systems, reported in a previous study. Reference Pimenta, Dresselhaus, Dresselhaus, Cancado, Jorio and Saito38 Higher internal pressure within the autoclave system not only results in higher degree of glucose dehydration and consequently the formation of less oxidized graphitic structure but also accelerates the glucose dehydration and cyclic polymerization into graphitic structure as well. Higher dehydration and polymerization rates of glucose molecules lead to the formation of higher number of aromatic sp 2 domains with smaller average domain size, as seen in Table I. Accordingly, higher density of grain boundaries dominates the graphitic structure, leading to significant sp 2-edge disorder. Finally, it is worth mentioning that Raman analysis reveals high structural similarity for graphitic samples produced at V/L ratios of 3/2 and 4/1, as well as XRD and FTIR analyses.
According to XRD, FTIR and Raman analyses, it is concluded that the graphitic powder prepared at the highest V/L ratio (4/1) represents the RGO sample of the best structural quality among all the hydrothermally produced graphitic samples at various V/L ratios. This is because, it is a well graphitized sample characterized as highly pure few-layer RGO with small GO and amorphous carbon concentrations. Further, it exhibits minimum oxidation of the RGO fraction and best structural order interior of the aromatic sp 2 domains. The analyses also indicate that the quality of the graphitic powder prepared at a V/L ratio of 3/2 is very close to that of the one prepared at a V/L ratio of 4/1. The produced amount of the graphitic powder at a V/L ratio of 3/2, however, is almost twice that at a V/L ratio of 4/1. Therefore, a V/L ratio of 3/2 is considered the optimum, regarding quality and productivity of the graphitic powder.
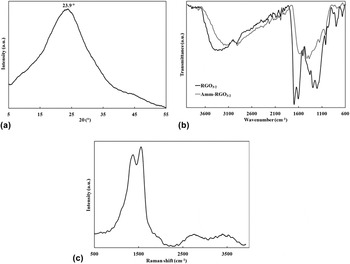
The graphitic samples prepared at the optimum V/L ratio, from glucose as a sole reagent and glucose combined with ammonia are denoted as RGO3/2 and Amm–RGO3/2, respectively. It is observed that Amm–RGO3/2 is much darker than RGO3/2; it possesses a shiny black color compared to a dark brown color of RGO3/2, Fig. S2 in the ESM. This suggests the formation of less oxidized RGO, when ammonia was added to the hydrothermal reaction medium. Figure 4 illustrates the XRD pattern (a), FTIR spectrum (b) and Raman spectrum (c) of Amm–RGO3/2. For comparison, the FTIR spectrum of RGO3/2 is also displayed in Fig. 4(b).
(a) XRD pattern, (b) FTIR spectrum, and (c) Raman spectrum of Amm–RGO3/2.

The XRD pattern indicates that the shoulder, attributed to GO, disappeared. In addition, the interlayer spacing between (002) planes, d 002, is decreased to 0.372 nm and the diffraction angle of the corresponding (002) peak is upshifted by about 1°, compared to RGO3/2. This reveals that the Amm–RGO3/2 sample is pure RGO of less oxidation state than that of RGO3/2. The average staking height of RGO layers is ∼1.1 nm, according to Sherrer's equation. Thereby, NGL values 3.1 for Amm–RGO3/2, suggesting that the sample is consisting of 3–4 RGO layers in average.
The formation of less oxidized RGO, when ammonia was added to the hydrothermal reaction medium, is further confirmed by the FTIR analysis. As transfer from the FTIR spectrum of RGO3/2 to that of Amm–RGO3/2, two peaks attributed to oxygen functional groups disappear; one is due to C=O of carboxyl groups at 1700 cm−1 and the other is due to bound H2O molecules at 1500 cm−1. In addition, the peak attributed to epoxy around 1200 cm−1 appears much weaker. Peaks of other oxygen functional groups also become considerably weaker. Furthermore, the peak corresponding to the in plane C=C vibration of graphitic structure, is shifted downward from 1610 to 1580 cm−1. All these observations are indicative of the significant reduced nature of Amm–RGO3/2 compared to RGO3/2. The crucial role of ammonia in reducing the O-concentration of the hydrothermally produced RGO can be attributed to the evolution of H2 gas within the autoclave system due to the partial decomposition of ammonia under hydrothermal conditions. Evolved H2 gas through the reaction medium effectively deoxygenates the aromatic sp 2 domains constituting the graphitic structure of Amm–RGO3/2. It is known that ammonia is thermally dissociated into its constituents (H2 and N2 gases) and the complete dissociation occurred around 450 °C at atmospheric pressure. Reference Hacker, Kordesch, Vielstich, Lamm and Gasteiger43
Raman analysis reveals significant structural changes within the aromatic sp 2 C-network of Amm–RGO3/2 compared to RGO3/2. The G band is shifted toward lower wavenumber (1565 cm−1) and the I 2D/I D+G is increased to 1.051, indicating improved structural order interior of the aromatic sp 2 domains of Amm–RGO3/2. On the other hand, the average lateral size of aromatic sp 2 domains is decreased to 5 nm, leading to increased grain boundary area and consequently sp 2-edge disorder within the aromatic sp 2 C-network of Amm–RGO3/2. Therefore, as compared to the Raman spectrum of RGO3/2, the spectrum of Amm–RGO3/2 exhibits significantly higher I D/I G ratio (0.89). Such structural changes are due to the less O-concentration within the aromatic sp 2 C-network of Amm–RGO3/2 compared to RGO3/2.
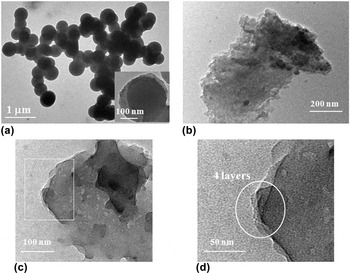
HR-TEM micrographs of RGO3/2 and Amm–RGO3/2 are presented in Fig. 5. The micrographs show a spherical morphology for RGO3/2, Fig. 5(a), while a flake (sheet)-like morphology for Amm–RGO3/2, Fig. 5(b). Obviously, the flake-like architecture of Amm–RGO3/2 is a thin multi-layered nanostructure extended laterally. The SEM images, displayed in Fig. S3 in the ESM support the HR-TEM observations as they indicate that RGO3/2 is composed of spherical particles while Amm–RGO3/2 is composed of thick flakes. Impressively, the flakes in Fig. S3(b) have large lateral dimensions ranging from few micrometers to ∼70 μm, indicating high surface area of Amm–RGO3/2. The real reason, that made the two samples possessing different morphologies, is not clear. However, the phenomenon informs that ammonia not only plays a critical role in reducing the O-concentration of the hydrothermally produced RGO, but also gives it the characteristic sheet-like morphology of graphene. Such sheet-like morphology offers graphene its distinctive high surface area. Magnified SEM micrographs of Amm–RGO3/2, Fig S4 in the ESM, reveal that each thick flake is a fluffy agglomeration of much thinner flakes i.e., it is an exfoliated graphitic structure. Reference Seresht, Jahanshahi, Rashidi and Ghoreyshi24,Reference Bai, Rakhi, Chen and Alshareef29,Reference Srinivas, Zhu, Piner, Skipper, Ellerby and Ruoff44 Deeply, the magnified HR-TEM image of Amm–RGO3/2, displayed in Fig. 5(c) shows that the architecture of Amm–RGO3/2 is a several-layered self assembled stack of very thin flat-like nanosheets of thickness 1–2 nm. The magnified view of the area within the white square, Fig. 5(d), indicates that the RGO under view is a four-layered nanostructure. Other HR-TEM images at various regions in the Amm–RGO3/2 sample reveal the presence of two-layered, three-layered and five-layered RGO-like nanosheets. This is in far agreement with XRD analysis. Thus, HR-TEM observations confirm that Amm–RGO3/2 is few-layer RGO-like nanosheets, consisting of 2–5 layers.
HR-TEM micrographs of (a) RGO3/2, (b) Amm–RGO3/2, and (c and d) magnified views for Amm–RGO3/2.

At this point, owing to its spherical architecture, RGO3/2 may be regarded as an amorphous carbonaceous material like soot, black carbon, etc. We donot think so, however, for the following reasons. The characteristic XRD pattern of soot and black carbon shows usually two distinct peaks; a prominent (002) peak assigned to the crystalline graphitic carbon and another minor peak known as γ band at ∼20° assigned to the amorphous carbon within the sample. Reference Krishnan, John and Manoj41,Reference Mohan and Manoj45 In addition, their characteristic Raman spectrum exhibits highly noisy and broad D and G bands, indicating significantly disturbed graphitic lattice. Also, other distinctive bands at ∼1200, 1500, and 1600–1700 cm−1, originated from amorphous carbon fraction, are present. Reference Krishnan, John and Manoj41,Reference Mohan and Manoj45–Reference Dikio47 Since most of these features are absent in the XRD and Raman spectra of RGO3/2, it is believed that such sample can be discontinued grown few-layer RGO species, see the inset in Fig. 5(a), containing some extent of amorphous carbon.
B. Characteristics of thermally annealed RGO
RGO3/2 has been thermally annealed at 500, 700, and 900 °C and the annealed samples are denoted as RGO3/2-500, RGO3/2-700, and RGO3/2-900, respectively. On the other hand, Amm–RGO3/2 has been thermally annealed at 500, 600, and 700 °C and the annealed samples are denoted as Amm–RGO3/2-500, Amm–RGO3/2-600, and Amm–RGO3/2-700, respectively. All the thermally annealed RGO samples are black colored, Fig. S5 in the ESM.
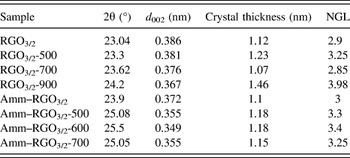
XRD structural parameters of the thermally annealed RGO samples are indicated in Table II. In general, the thermal annealing of RGO3/2 and Amm–RGO3/2 under inert atmosphere, results in decreased d 002 accompanied by up-shifted 2θ toward 26°, which reveal reduced O-content within both of RGO samples.
XRD structural parameters of the thermally annealed RGO3/2 and Amm–RGO3/2 samples.

When RGO3/2 has been annealed at 500 °C, d 002 and 2θ are slightly changed; d 002 is decreased by 0.005 nm and 2θ is up-shifted by 0.26°. Then, considerable decrease in d 002 and up-shift in 2θ occur when the annealing temperature has been increased to 700 °C and such behavior is continued with the further increase of annealing temperature to 900 °C. This informs that thermal annealing of RGO3/2 is effective in reducing its O-content, only at very high temperatures ≥700 °C. On contrary, upon annealing Amm–RGO3/2 at 500 °C, d 002 and 2θ are sharply changed; d 002 is decreased by 0.017 nm and 2θ is upshifted by 1.18°. Then, a further decrease in d 002 and up-shift in 2θ occur as the annealing temperature increases to 600 °C but such structural changes level off, when the annealing temperature exceeds 600 °C. This reveals that, unlike RGO3/2, thermal annealing of Amm–RGO3/2 significantly reduces its O-content at moderate annealing temperatures 500–600 °C. Accordingly, XRD analysis suggests that the maximum degree of reduction in O-content has been achieved at much lower annealing temperature for Amm–RGO3/2 (600 °C) than for RGO3/2 (900 °C). Furthermore, Amm–RGO3/2-600 seems to contain significantly lower O-content than RGO3/2-900, as evidenced from the values of d 002 and 2θ for both samples. Thus, Amm–RGO3/2-600 can be considered highly pure graphene-like nanosheets because its d 002 (0.349 nm) and 2θ (25.5°) values are very close to those of pure graphene; ∼0.34 nm and ∼26°, respectively. Reference Huh and Mikhailov23,Reference Seresht, Jahanshahi, Rashidi and Ghoreyshi24,Reference Kuila, Khanra, Hoon, Kuk, Joong and Hee32 On the other hand, the NGL values of RGO3/2-900 and Amm–RGO3/2-600 are very close. This recommends that both samples are few-layered structures, consisting of 3–4 layers in average.
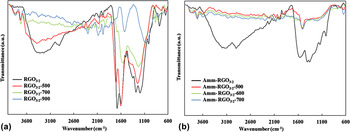
Figure 6 presents the FTIR spectra of the thermally annealed RGO3/2 (a) and Amm–RGO3/2 (b) samples. As compared to the FTIR spectrum of RGO3/2, the spectra of the corresponding thermally annealed RGO samples exhibit bands of suppressed oxygen functional groups and a down-shift in the wavenumber of C=C band, which confirm the reduction of RGO3/2 upon thermal annealing under inert atmosphere. In the spectrum of RGO3/2-500, the peaks attributed to bound H2O molecules and alkoxy group become shoulders, the one attributed to C=O in carboxylic group becomes considerably weaker and those due to free H2O molecules and epoxy group are slightly decreased in intensity. Further, in the spectra of RGO3/2-700 and RGO3/2-900, the peaks attributed to bound H2O molecules and alkoxy group completely disappear and those attributed to free H2O molecules and C=O in carboxylic group become very weak. The one due to epoxy group, however, is still significant. The suppression in bands of oxygen functional groups is more pronounced for RGO3/2-900. On the other hand, the C=C peak for RGO3/2-500 is coincided with that for RGO3/2 at about 1610 cm−1, while it is shifted downward to 1580 and further 1545 cm−1 for RGO3/2-700 and RGO3/2-900, respectively. Such observations agree well with the XRD analysis. They confirm significant removal of oxygen species from the graphitic structure only, when RGO3/2 has been annealed at high temperatures ≥700 °C. Thus, RGO3/2-900 is one of the minimal O-content among all the thermally annealed RGO3/2 samples. However, its partially reduced state, evidenced from XRD and FTIR analyses, reveals that thermal reduction of RGO3/2 is not well proceeded even at such high temperature (900 °C).
FTIR spectra of the thermally annealed (a) RGO3/2, and (b) Amm–RGO3/2 samples.

Interestingly, all the bands of oxygen functional groups disappeared in the FTIR spectra of the thermally annealed Amm–RGO3/2 samples, as seen in Fig. 6(b). Only, a very small hop corresponding to epoxy group can be observed at ∼1200 cm−1. It can be also noted that C=C peak is remarkably shifted downward from 1580 to 1519 cm−1, upon thermal annealing of Amm–RGO3/2 regardless of the annealing temperature. Again, such observations agree well with the XRD analysis, indicating highly reduced nature of the thermally annealed Amm–RGO3/2 samples, which can be considered highly pure graphene-like nanosheets. This implies intensive removal of oxygen species from the graphitic structure when Amm–RGO3/2 has been annealed at moderate temperatures, down to 500 °C. Although no significant difference can be detected between the FTIR spectra of the thermally annealed Amm–RGO3/2 samples, Amm–RGO3/2-600 is considered one of the minimal O-content, since this is supported by the XRD analysis.
It is speculated that RGO3/2 and Amm–RGO3/2 behaved differently upon thermal annealing under inert atmosphere, as evidenced from XRD and FTIR analyses, due to significant structural differences between both of them. Most probably, ammonia with its reducing capabilities under hydrothermal conditions leads to the formation of graphitic structure having oxygen functional groups concentrated at the edges of the aromatic sp 2 domains rather than interior of them. This is supported by Raman analyses of RGO3/2 and Amm–RGO3/2, which reveal improved structural order interior of the aromatic sp 2 domains but higher sp 2 edge disorder for Amm–RGO3/2 compared to RGO3/2. Since chemical bonds in the edge (grain boundary) regions are usually much weaker than interior of the crystallites, this may interpret the ease of removal of O-species upon thermal annealing of Amm–RGO3/2 compared to RGO3/2. In addition, higher surface area of the sheet-like architecture dominated Amm–RGO3/2, as compared to the spherical architecture dominated RGO3/2, which contributes to the easier thermal reduction of the former sample.
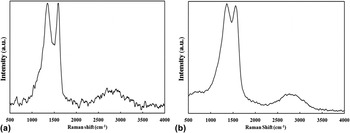
The Raman spectra of RGO3/2-900 and Amm–RGO3/2-600 are illustrated in Figs. 7(a) and 7(b), respectively. RGO3/2-900 exhibits a noisy Raman spectrum. Many small pulses prior to the D band, beyond the G band and in between both bands are present. In addition, a noisy broad split peak attributed to 2D and D + G bands is also observed. It is also found that the G band is shifted toward higher wavenumber in RGO3/2-900 (1589 cm−1) compared to RGO3/2 (1579 cm−1). The pulses in the range of 980–1060 and 1700–1800 cm−1 as well as the shoulder in the D band at ∼1190 cm−1 and the small pulse in between D and G bands at ∼1490 cm−1 can be assigned to the amorphous carbon. Reference Ferrari and Robertson39–Reference Krishnan, John and Manoj41,Reference Ungar, Gubicza, Ribarik, Pantea and Zerda46 Thus, considerable amorphous carbon fraction is present in RGO3/2-900. This implies cracking of a significant portion of C=C bonds within the aromatic sp 2 C-network, when RGO3/2 has been annealed at such high temperature (900 °C). On the other hand, the noisy 2D band and the upward shifting of G band are indicative of increased disordering interior of the sp 2 domains of RGO3/2-900 compared to that of RGO3/2. Thus, despite the extensive deoxygenation of graphitic structure in this temperature range, C=C cracking leads to increased amorphous carbon fraction and subsequently significant structural disorder interior the sp 2 domains of RGO3/2-900. It is also clearly indicative that RGO3/2-900 possesses higher sp 2 edge disorder than RGO3/2, as evidenced from the increased I D/I G ratio for RGO3/2-900 (0.98) compared to RGO3/2 (0.71). This is because, the removal of oxygen species upon thermal annealing of RGO3/2 at 900 °C leads to decreased average lateral crystallite size to 4.5 nm, which in turn results in higher density of grain boundaries within the graphitic structure.
Raman spectra of (a) RGO3/2-900 and (b) Amm–RGO3/2-600.

In sharp contrast to RGO3/2-900, Amm–RGO3/2-600 exhibits a smooth Raman spectrum. In which, the G band is shifted to lower wavenumber (1557 cm−1) and the D + G band disappears, as compared to the Raman spectrum of Amm–RGO3/2. This implies uncracking of C=C bonds of the aromatic C-structure, when Amm–RGO3/2 has been annealed at moderate temperature (600 °C). Therefore, no evidences of the presence of considerable amorphous carbon fraction within Amm–RGO3/2-600 and subsequently significant structural order is manifested in the interior of the aromatic sp 2 domains of such sample. On the other hand, the sample records the highest sp 2 edge disorder throughout the study. This is because it possesses the maximum ID/IG ratio (1.02) and the minimum average lateral crystallite size (4.3 nm), among all the prepared graphitic samples. The sp 2 edge disorder, however, is not that much propagated in Amm–RGO3/2-600 with respect to Amm–RGO3/2, as evidenced from the values of I D/I G and L a for both samples.
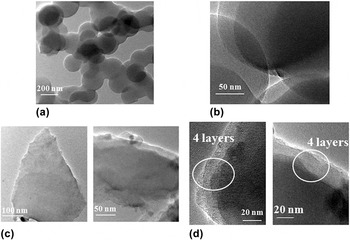
HR-TEM images of RGO3/2-900 and Amm–RGO3/2-600 are displayed in Fig. 8. Again, the images show a spherical morphology for RGO3/2-900 while a sheet-like morphology for Amm–RGO3/2-600, as above recorded for RGO3/2 and Amm–RGO3/2, respectively. This is also supported by the corresponding SEM micrographs, presented in Figs. S6(a) and S6(b) in the ESM, respectively. Clear detection of the Raman bands assigned to amorphous carbon and the spherical morphology of RGO3/2-900 recommend that such sample is a highly disordered graphitic material containing considerable fraction of amorphous carbon species. In contrast, Amm–RGO3/2-600 can be regarded as highly ordered graphitic material due to the absence of Raman bands assigned to amorphous carbon and its sheet-like architecture. It is composed of very thin flat graphene-like nanosheets, even at the ends, with a thickness of about 1–2 nm, as seen in Fig. 8(c). On the other hand, Fig. S6(b) indicates that the lateral dimensions of the sheet-like architecture are very large up to 70 μm. This informs that Amm–RGO3/2-600 possesses a distinctive high surface area, of course, much larger than that for RGO3/2-900. The magnified images of RGO3/2-900 and Amm–RGO3/2-600, illustrated in Figs. 8(b) and 8(d), respectively, indicate a four-layered nanostructure, which is in far agreement with XRD analysis. Fig. S7 in the ESM shows further HR-TEM images of Amm–RGO3/2 and Amm–RGO3/2-600, indicating two-layered, three-layered, five-layered, and six-layered graphitic nanostructure.
HR-TEM micrographs of (a and b) RGO3/2-900 and (c and d) Amm–RGO3/2-600.

Overall, Amm–RGO3/2-600 is of much lower O-content and larger surface area than RGO3/2-900. Unlike RGO3/2-900, it does not suffer cracking in C=C bonds, containing thus a negligible fraction of amorphous carbon and therefore exhibits significant structural order interior of the aromatic sp 2 domains. On the other hand, both samples have almost comparable sp 2 edge disorder and are few-layer graphitic nanostructure, consisting of up to ∼6 layers. Accordingly, the structural quality of Amm–RGO3/2-600 is significantly remarkable than that of RGO3/2-900. Moreover, Amm–RGO3/2-600 has been obtained at significantly lower annealing temperature than RGO3/2-900, which is economically potential due to less energy consumption. Thus, introducing ammonia into the reaction medium for graphene synthesis from glucose has enabled preparation of few-layer graphene-like nanosheets with good structural quality, at reduced production costs. This highlights the important role of ammonia in the synthesis of graphene-like nanosheets from glucose.
At this point, Amm–RGO3/2-600 is considered as the graphene-like nanosheet sample of the most remarkable structural characteristics out of the study, regarding oxygen and amorphous carbon contents, structural order within the aromatic sp 2 C-network and morphological geometry that controls surface area of the graphitic nanostructure. It is a highly pure graphene with few structural defects and distinctive large surface area due to the few-layered flat nanosheet-like morphology. This proves that the study does not only provide a new facile and economical route for gram-scale synthesis of powdery graphene-like nanosheets but a product of good structural characteristics as well.
IV. CONCLUSIONS
The approach for powdery graphene-like nanosheet synthesis from glucose precursor involves one-step hydrothermal synthesis of RGO, followed by thermal annealing under inert atmosphere. In the hydrothermal process, increased V/L ratio of aqueous glucose solution within the autoclave system has lead to the formation of RGO-rich graphitic powder with less GO and amorphous carbon concentrations and lower oxidation state of the RGO fraction. Therefore, improved structural order has been manifested within the aromatic sp 2 C-network. Lower amount of the graphitic powder, however, is produced with the increased V/L ratio. Thus, an intermediate V/L ratio of 3/2 is considered the optimum, regarding product structural quality and productivity. When ammonia has been introduced into the reaction medium at the optimum V/L ratio, pure RGO graphitic powder with significantly lower oxidation state and improved structural order interior of the aromatic sp 2 domains (Amm–RGO3/2), as compared to that obtained in the absence of ammonia (RGO3/2), is produced. Further, Amm–RGO3/2 exhibits few-layered flat nanosheet-like morphology, possessing thus distinctive larger surface area than RGO3/2, which demonstrates spherical morphology. Interestingly, few-layer graphene-like nanosheets with slight oxygen and amorphous carbon contents and few structural defects are produced when annealing Amm–RGO3/2 at 600 °C. While, RGO3/2 is just partially reduced when it has been annealed at 900 °C and the product contains considerable fraction of amorphous carbon. Thus, RGO3/2-900 is characterized by significantly disordered sp 2 C-network and spherical architecture. This is revealed the great role of ammonia in the synthesis of powdery graphene-like nanosheets from glucose, regarding product structural quality and economy. Overall, in the present research, powdery few-layer graphene-like nanosheets with good structural characteristics have been prepared in gram-scale, via hydrothermal treatment of aqueous solution containing just glucose and ammonia followed by moderate-temperature thermal annealing under inert atmosphere. Compared to the conventional chemical exfoliation of graphite for gram-scale graphene synthesis, the new approach is facile, easily scalable, fast, and economical. Accordingly, it is promising for industrial-scale production of graphene-like nanosheets and might prompt the graphene practical applications.
Supplementary Material
To view supplementary material for this article, please visit http://dx.doi.org/10.1557/jmr.2016.25.
Supplementary material (The photographs of hydrothermal and thermally annealed graphitic products, SEM micrographs of RGO3/2, Amm–RGO3/2, RGO3/2-900 and Amm–RGO3/2-600 and further HR-TEM images for Amm–RGO3/2 and Amm–RGO3/2-600) is available in the online version of this article.
ACKNOWLEDGMENTS
The authors deeply appreciate Eng. Ahmed Kamel, Sales Manager, Egypt, Bruker Optics, for facilitating FTIR analysis. Financial support for this research has been provided by City of Scientific Research and Technological Applications (SRTA City). This is an Egyptian governmental university, in which three of the authors are staff members.