INTRODUCTION
The large rivers of the Pacific Northwest U.S. have been shaped by a variety of cataclysmic and hydroclimatic processes over the Quaternary. Extreme floods capable of extensive landscape modification can quickly and effectively erode evidence of hydroclimate change recorded in the pre-event fluvial geomorphology of river systems. Although the role that large catastrophic floods (i.e., megafloods) plays in the geomorphology of fluvial systems has been widely studied in the Pacific Northwest (e.g., Malde, Reference Malde1960; Baker, Reference Baker1973; O'Connor et al., Reference O'Connor, Baker, Waitt, Smith, Cannon, George and Denlinger2020; Denlinger et al., Reference Denlinger, George, Cannon, O'Connor, Waitt, Waitt, Thackray and Gillespie2021), little to no research has documented the post-flood fluvial-geomorphic history and associated hydroclimatic conditions along the major rivers altered by the megafloods.
The erosion and deposition produced by megafloods limit the preservation potential of post-flood fluvial terraces because the primary flood routes are commonly scoured to bedrock or armored by thick deposits of immovable boulders to blocks, such as along many confined reaches of the Snake River in Idaho that have been altered by a single pluvial lake outburst flood (Bonneville Flood) at ca. 18 ka (e.g., Malde, Reference Malde1960, Reference Malde1968; O'Connor, Reference O'Connor1993). The scarcity of studies documenting the complete sequence of post-Bonneville Flood fluvial terraces along the Snake River has limited our knowledge of the effects of regional hydroclimate variability on the Snake River fluvial system. This is in contrast to alpine lake records within the watershed (e.g., Larsen et al., Reference Larsen, Crump and Blumm2020) or nearby pluvial lake records in the northern Great Basin (e.g., Hudson et al., Reference Hudson, Hatchett, Quade, Boyle, Bassett, Ali and de los Santos2019), which have been used to infer the timing, duration, and magnitude of latest Pleistocene and Holocene hydrologic change in the region.
In this study, we investigated the fluvial geomorphology along a reach of the middle Snake River at Bancroft Springs near King Hill, Idaho, to better understand post-Bonneville Flood geomorphic processes in the Snake River, as well as to develop a fluvial record that could be used to support other paleoclimate records in the region (Fig. 1). Prior to our study, the relation of the lowest fluvial terraces and deposits that are present along the Bancroft Springs reach to the Bonneville Flood was uncertain (e.g., O'Connor, Reference O'Connor1993), which made interpreting the landscape problematic during previous fluvial-geomorphic and archaeological investigations along the flood path. The primary goal of our investigation is to establish the post-Bonneville Flood fluvial-geomorphic history of the Snake River by documenting the geomorphology, sequence stratigraphy, and age of the fluvial terraces preserved at Bancroft Springs. Our objectives are four-fold: (1) present geomorphic and stratigraphic evidence, plus radiocarbon (14C) and luminescence ages for six previously undated fluvial terraces; (2) perform an independent evaluation of the accuracy of published reservoir corrections for 14C ages from fossil aquatic mollusk shells by comparing them with luminescence ages from the same fluvial terrace deposits; (3) document the fluvial-geomorphic development of the Snake River since the Bonneville Flood; and (4) develop a new fluvial record for the latest Pleistocene and Holocene to assess hydroclimate variability in the region.
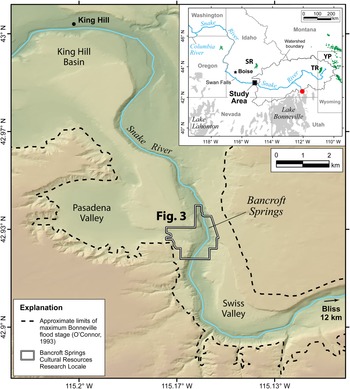
Map of the middle Snake River at Bancroft Springs showing the boundaries of the Idaho Power Company's Bancroft Springs Cultural Research Locale and the area of detailed mapping and analysis (Fig. 3). The approximate limits of the maximum Bonneville Flood (ca. 18 ka) stage and associated flood deposits are also shown along the canyon rim above Swiss and Pasadena valleys and King Hill Basin. Inset map shows the boundary of the middle and upper Snake River watershed and tributary streams, along with the extent of modern glaciers (green polygons) and late Pleistocene pluvial lakes (gray polygons) in the northern Great Basin mentioned in text. Square is location of study area near the town of King Hill and solid red circle is the location of the Red Rock Pass overflow channel of pluvial Lake Bonneville. Major physiographic and hydrologic features: SR = Sawtooth Range; TR = Teton Range; YP = Yellowstone Plateau.

STUDY AREA
The study site is within the Bancroft Springs Cultural Resources Research Locale, a ~15.3 km2 property managed by the Idaho Power Company as part of the mitigation requirements of the federally licensed Bliss Hydroelectric Project (Kimball and Baker, Reference Kimball and Baker2010). The site is located between Bliss and King Hill, south-central Idaho, and encompasses a north-south trending 1.8 km reach of the middle Snake River within a ~275 m wide and ~80 m deep canyon incised into the western Snake River Plain (Fig. 1).
The watershed of the Snake River upstream from the study area is 92,230 km2 and drains parts of the northern Rocky Mountains (Smoky Mountains, Boulder Range, Pioneer Range, Lost River Range, Lemhi Range) to the north, the Bitterroot Range of southwest Montana, the Teton Range and Yellowstone Plateau in northwest Wyoming, and parts of the northern Great Basin province in northern Nevada and northwest Utah along the southern margin of the watershed (Fig. 1). The highest point in the watershed is Grand Teton at ~4200 m elevation and the river in the study area at Bancroft Springs is at ~768 m.
The Snake River watershed is a snow-dominated mountain hydrologic system. The Teton Range and Yellowstone Plateau were heavily glaciated during the Pleistocene (e.g., Licciardi and Pierce, Reference Licciardi and Pierce2008, 2018) and many small glaciers and snowfields persist in sheltered cirques at high elevations in the region (Raub et al., Reference Raub, Racoviteanu, Khalsa, Helm, Armstrong and Arnaud2007; Fig. 1). Surface flow in the Snake River is primarily supported by seasonal distributions of snowmelt runoff from the Rocky Mountains and significant groundwater baseflow contributions from the Snake River Plain regional aquifer system (Kjelstrom, Reference Kjelstrom1995; Lindholm, Reference Lindholm1996). Historical stream flow in the watershed has been regulated by dams for hydropower generation and water supply since AD 1901 (Miller et al., Reference Miller, Glanzman, Sherill, Parkinson, Buffington and Milligan2003).
GEOLOGIC AND HYDROLOGIC SETTING
Bonneville Flood along the middle Snake River
A single megaflood passed down the Snake River at ca. 18 ka when rapid erosion of a narrow drainage divide at Red Rock Pass in southeastern Idaho caused pluvial Lake Bonneville in Utah to spill (e.g., Gilbert, Reference Gilbert1890; Janecke and Oaks, Reference Janecke and Oaks2011; Miller et al., Reference Miller, Wahl, McGeehin, Rosario, Oviatt, Anderson and Presnetsova2015; Fig. 1). The sudden breach and rapid incision of 108–125 m through the sill resulted in half the total lake volume released into the Snake River watershed, causing catastrophic flooding (e.g., O'Connor, Reference O'Connor1993; Janecke and Oaks, Reference Janecke and Oaks2011). The Bonneville Flood occurred ca. 18,100 cal yr BP based on radiocarbon dating of lacustrine deposits of the Provo shoreline of Lake Bonneville (Benson et al., Reference Benson, Lund, Smoot, Rhode, Spencer, Verosub, Louderback, Johnson, Rye and Negrini2011; Miller et al., Reference Miller, Oviatt and McGeehin2013, Reference Miller, Wahl, McGeehin, Rosario, Oviatt, Anderson and Presnetsova2015; Oviatt, Reference Oviatt2015). Despite several studies of the Bonneville Flood (e.g., Malde, Reference Malde1960, Reference Malde1968; O'Connor, Reference O'Connor1993, Reference O'Connor, Oviatt and Shroder2016), few have investigated the post-flood fluvial stratigraphy and geomorphology along the flood path. Most geologic and geomorphic studies along the lower Snake River have focused on the Late Holocene to historical stratigraphy and soils within the Snake River Islands at Deer Flat National Wildlife Refuge (Osterkamp, Reference Osterkamp1998; McDonald and Bullard, Reference McDonald and Bullard2001), and downstream within lower Hells Canyon to resolve the latest Holocene paleoflood history of the river (Allen, Reference Allen2020), or have been related to regional geologic mapping near the study site in the Pasadena Valley and Bliss-Hagerman areas (e.g., Malde and Powers, Reference Malde and Powers1972; Othberg and Kauffman, Reference Othberg and Kauffman2005; Othberg et al., Reference Othberg, Gillerman and Kauffman2005, Reference Othberg, Kauffman, Gillerman and Garwood2012; Fig. 1).
The Snake River follows the southern edge of the Quaternary lava fields of the Snake River Plain. The Snake River Plain is a broad region of uplift and predominately Quaternary volcanism associated with the northeast track of the Yellowstone hotspot (e.g., Pierce and Morgan, Reference Pierce, Morgan, Link, Kuntz and Platt1992; Beranek et al., Reference Beranek, Link and Fanning2006). No active (<15,000 yr) faults are known within the Snake River Plain, however, a few active fault segments bound range fronts within the southern Sawtooth Range (e.g., U.S. Geological Survey and Idaho Geological Survey, 2018). The majority of the middle Snake River in the study area is confined in a deep canyon developed through a thick section of intra-canyon Quaternary lavas of the McKinney Basalt along the eastern canyon wall. The western canyon wall is composed of the Glenns Ferry Formation, a thick sequence of Miocene–Pliocene valley-fill of bedded lacustrine and fluvial sediment with interbedded basalt flows (e.g., Covington and Weaver, Reference Covington and Weaver1990).
Study reach landforms
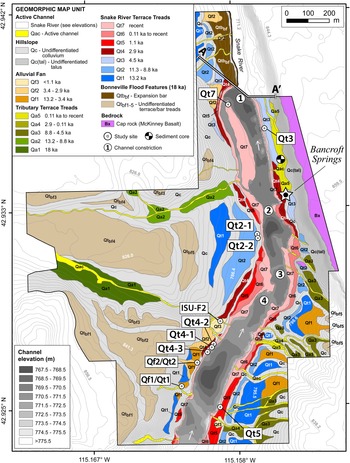
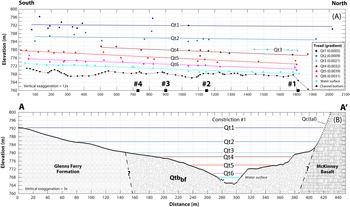
Landforms within the study site include a suite of fluvial terraces and alluvial fans, plus mass-wasting features (Figs. 2, 3). The modern Snake River through the 1.8-km-long Bancroft Springs reach is up to ~5 m deep, has a width ranging from ~35–150 m, and a water surface that descends 5.2 m between the elevations of 768.3–773.5 m, yielding a gradient of 0.0030 in the study area (Fig. 4). The channel is characterized by relatively low-gradient reaches with pools separated by short, steep drops at four channel constrictions. Immovable blocks and slabs of basalt plucked from canyon walls during the Bonneville Flood form rapids within the channel constrictions (Figs. 2, 3). Most Bonneville Flood features and the deposits associated with them have been isolated ~25–30 m above the Snake River since the flood. The lowest post-flood fluvial terraces (Qt1–Qt7) at heights from 20–1 m above the Snake River are inset within Bonneville Flood landforms and are the focus of this study (Figs. 3, 4).
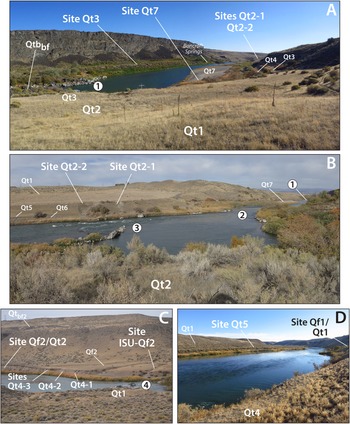
Site photographs within the Bancroft Springs study area (Figs. 1, 3). (A) View upstream to the southeast of the sequence of Qt1–Qt4, Qt6, and Qt7 terrace treads near channel constriction #1 (numbered white circle) composed of boulder-rich Bonneville Flood expansion bar (Qtbbf) in the northern reach of river showing steep canyon walls on east bank composed of intra-canyon lava flows and more subdued walls on west bank composed of the Glenns Ferry Formation consisting of interbedded siltstone and sandstone with lava flows. Stratigraphic study sites Qt2-1, Qt2-2, Qt3, and Qt7, along with Bancroft Springs are also shown. (B) View downstream to the north-northwest from east bank on Qt2 terrace showing the prominent terrace tread Qt2 and sites Qt2-1 and Qt2-2 near narrow channel constriction #2 and Bonneville Flood debris that form rapids at channel constriction #3. Terraces Qt1, Qt5–Qt7, and channel constriction #1 are also shown. (C) View across river to the west-southwest showing the canyon wall along west bank of river with inset Qt4 terrace overlain by Qf2 alluvial fan deposit near channel constriction #4 composed of Bonneville Flood debris that forms rapids. Bonneville Flood terrace Qtbf2, and fluvial Qt1 and Qt2 terraces, along with sites Qf2/Qt2, Qt4-1, Qt4-2, Qt4-3, and ISU-Qf2 are also shown. (D) View upstream to the south-southeast from the west bank on Qt4 terrace showing reaches of Snake River in study area with planar Qt5 terrace tread below Qt1 terrace on east bank of river. Study sites Qf1/Qt1 and Qt5 on bluff exposures are also shown.

Geomorphic map of the Bancroft Springs Cultural Research Locale (Fig. 1) showing the age and spatial distribution of a sequence of Bonneville Flood (ca. 18 ka) terraces and post-flood active channel, alluvial fan, alluvial, fluvial, hillslope, and bedrock landform feature types. Age control is from directly dated fluvial terrace and alluvial fan deposits, as well as from cross-cutting relations with undated landforms. The locations of ten stratigraphic study sites, channel constrictions #1–4, archeological site ISU-F2 (Lohse, Reference Lohse2013), and sediment core site within a marsh near Bancroft Springs (McWethy et al., Reference McWethy, Alt and Lee2018) are shown. Bathymetry of the Snake River channel and transect of the transverse geologic cross section (A–A′; see Fig. 4) at channel constriction #1 are also shown.

Snake River fluvial terrace elevation profiles. (A) North-south longitudinal profile showing fill terrace treads (Qt1–Qt6), water surface, and channel bottom; and (B) transverse geologic cross section at constriction #1 (A–A′; Fig. 3) showing strath terraces cut on rocks of the Glenns Ferry Formation and Bonneville Flood expansion bar deposits (Qtbbf). Tread surfaces (Qt1–Qt6) grade to strath terraces at constriction #1. Channel constrictions #1–4 mentioned in text are shown as black squares on the longitudinal profile. Elevation of terrace treads were identified from geomorphic mapping and topographic data at 0.61 m contour interval derived from 0.15 m resolution photogrammetric analysis. Elevation of channel bottom is from sonar surveys below an elevation of ~673 m. Slope of line and gradient of each terrace tread are derived from fitting tread elevation and longitudinal distance with a linear regression model.

METHODS
Geomorphic mapping
A geomorphic map is the basis for interpreting the spatial and temporal distribution of post-Bonneville Flood fluvial terraces within the study site (Fig. 3). Map unit boundaries were digitized in ArcGIS using photogeologic mapping techniques, including contrasts in tonal qualities of different surfaces, cross-cutting relations, and landform morphology (e.g., Weeden and Bolling, Reference Weeden, Bolling, Siegal and Gillespie1980). Imagery included aerial photography at 20 cm resolution, USDA NAIP imagery at 0.5–1.0 m resolution, and Bing Imagery available from ArcGIS. A fixed map scale of 1:3000 was used given the size of the area of interest and the high-resolution imagery. Topographic data at 0.61 m contour interval derived from 0.15 m resolution imagery and photogrammetric analysis combined with channel bathymetry from sonar surveys provided the basis for topographic profiles and cross sections.
We mapped six primary landforms: active channel, alluvial fan, alluvial terrace, fluvial terrace, hillslope, and bedrock. The primary feature types were further separated into 30 distinct geomorphic map units with a corresponding surface age (Fig. 3). Abbreviated descriptors for Quaternary feature types (e.g., Qt, fluvial terrace; Qf, alluvial fan; Qa, alluvial terrace) were numbered sequentially to represent oldest (1) to youngest geomorphic surfaces.
Stratigraphic analysis
We described the alluvial and fluvial stratigraphy in natural exposures at 10 sites (Figs. 2, 3) and used sequence stratigraphy analysis to allow us to identify and discriminate similar stratigraphic units of different ages and develop the geomorphic chronology. Sequence stratigraphy is the study of sedimentary relationships within a chronostratigraphic framework of repetitive and genetically related strata bounded by surfaces of either erosion, deposition, or their correlative contacts. The fundamental starting point for sequence stratigraphy is the sedimentary facies, which is a lithostratigraphic body characterized by distinct lithological (lithofacies) or fossil characteristics that reflect a certain origin. A group of sedimentary facies genetically linked by common processes and environments comprises a depositional system. These depositional systems can be grouped together within a framework of unconformity-bounded stratigraphic packages called sequences (McLaughlin, Reference McLaughlin, Selley, Robin, Cocks and Plimer2005). Lithofacies and facies associations were classified in the field according to grain size, sedimentary structure, fossils, and by lateral and vertical stratigraphic position (e.g., Einsele, Reference Einsele2000). The sequence stratigraphy procedure used in our study is similar in concept to alloformation mapping, which is another procedure previously used to objectively differentiate Holocene fluvial terraces in the Gulf Coast of the U.S. by integrating geomorphic, sedimentologic, and pedologic data into stratigraphic models (e.g., Autin, Reference Autin1992).
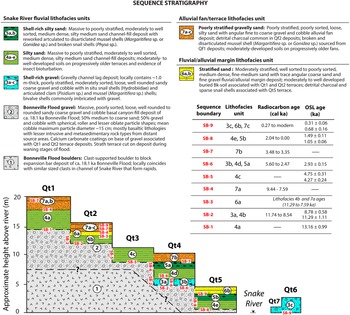
The sequence stratigraphy for the study area consists of several fluvial cut-and-fill cycles of the Snake River and subsequent deposition from tributary alluvial processes. Three facies associations were identified that represent the following depositional environments: (1) fluvial, which represents areas of deposition within the river channel; (2) fluvial/alluvial, representing deposition along a low-gradient floodplain margin; and (3) alluvial fan/terrace, which represents alluvial deposition in the form of fans and inset alluvial terraces associated with small tributaries (Fig. 5). Seven total lithofacies units (i.e., stratigraphic units) correspond to different depositional environments. Lithofacies were identified with numbers similar to geomorphic map units, but also were assigned alphanumeric descriptors of increasing letters (e.g., a to d), representing oldest to youngest stratigraphic subunits (Fig. 5). This approach afforded the identification of different aged units with identical sedimentology (i.e., lithofacies), so that stratigraphic units could be mapped independent of fluvial terrace tread or geographical location.
Schematic, composite stratigraphic model of the sequence of cut-and-fill cycles of post-Bonneville fluvial terraces (Qt1–Qt7) and alluvial fan and fluvial/alluvial margin deposition on the middle Snake River at Bancroft Springs. Terrace tread heights, plus stratigraphic and geochronologic relations are developed from natural exposures at 10 study sites (Fig. 3). The radiocarbon and luminescence ages of lithofacies units and sequence boundaries (SB) are also shown.

Sequence boundaries were used to separate specific lithofacies units at all stratigraphic study sites to determine the number of cut-and-fill cycles from observed stratigraphy and morpho-stratigraphic position of terrace surfaces (Fig. 5). A sequence boundary is a conceptual boundary that represents a composite of multiple physical stratigraphic surfaces and defines a single fluvial entrenchment surface formed from valley cut, fluvial planation, and interfluve exposure (e.g., Galloway, Reference Galloway1989). Sequence boundaries maybe marked by incised fluvial channels, by a paleosol, or by non-fluvial facies such as alluvial fan deposits (Abbott and Carter, Reference Abbott, Carter and Elias2007). A defining characteristic of a sequence boundary is the vertical position of specific lithofacies units, their ages, and depositional environments. A sequence boundary in this study can be either an erosional unconformity or a depositional boundary. Ultimately, a given cut-and-fill cycle is recorded by a recognizable sedimentary sequence and, in places, an unconformity, both of which can be correlated in certain sections by identifying distinct sequence boundaries throughout the study area.
Field data collected at terrace units (Qt1–Qt7) included tread height, stratigraphy, and soils exposed in vertical banks and bluffs, along with recording the position and morphology of exposed immovable blocks and slabs of basalt across the width of the channel at four prominent channel constrictions (Figs. 2–4). Modern channel configuration, back edge of terraces, and the elevation of contacts between the gravelly and fine-grained units of terraces and corresponding tops of eroded basalt slabs at channel constrictions were also used to provide constraining limits for reconstruction of paleochannels at defined points. Terrace elevations measured in the field were relative to modern bankfull stage during the field period, which was controlled by outflows from Bliss Dam averaging ~230 m3/s (~8000 cfs) at the time of field visits.
Geochronology
Soils-geomorphologic analysis
Relative age dating involved using soil-geomorphic analysis of natural exposures of fluvial terrace and alluvial fan deposits. Soil-geomorphic information included standard soil profile descriptions and describing geomorphic and environmental information at the site (slope, aspect, drainage, vegetation, parent material) (e.g., Birkeland et al., Reference Birkeland, Machette and Haller1991; Birkeland, Reference Birkeland1999). Soil profile information included genetic soil horizon designation (e.g., A, B, Bw, C), thickness of soil horizon, dry color of each horizon determined from Munsell Soil Color charts, soil structure, field texture based on field measures of consistency, presence, and location of pedogenic clay films, pores, estimate of gravel, accumulations of secondary salts (e.g., calcium carbonate [k]), and horizon boundary. These data are summarized in tabular form for the fluvial terraces Qt2–Qt5 in the Supplemental Material.
Radiocarbon analysis
Numerical age dating techniques applied in the study included 14C dating of detrital charcoal and aquatic mollusk shells. 14C dating of gastropod and bivalve shells from living specimens was also performed to evaluate the reservoir correction established by Osterkamp et al. (Reference Osterkamp, Green, Reid and Cherkinsky2014) for sites downstream of the study area to account for the effects of ambient 14C-depleted carbon in dated shell material. Datable materials consisted primarily of burned organic matter and detrital charcoal within overbank deposits from the lowest fluvial terraces. Mollusk shells exposed in stream banks also were collected from gravel- and silty sand-rich fluvial deposits.
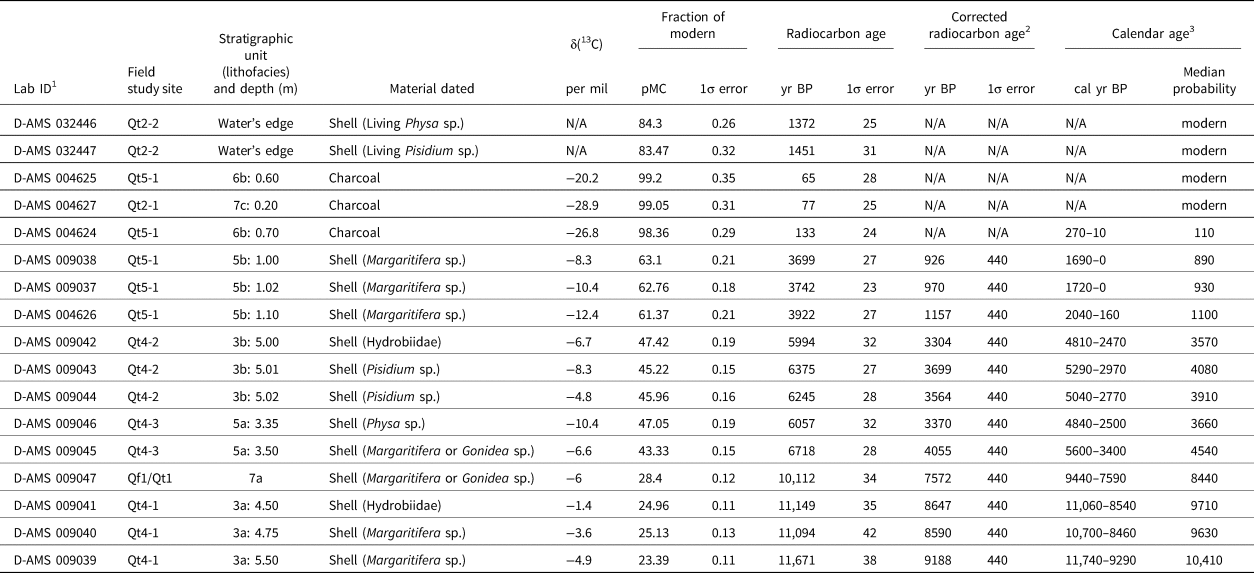
Fifteen accelerator mass spectrometry (AMS) 14C dates from charcoal and shell exposed in natural exposures provided ages for deposits associated with fluvial terraces Qt2, Qt4, and Qt5 and alluvial fan Qf1 (Table 1; Fig. 3). Five different types of aquatic gastropod and bivalve shells were dated. Gastropod samples included individuals in the taxonomic family Hydrobiidae (mud snail) and individuals in the genus Physa. Bivalve samples included a clam in the genus Pisidium and mussels in the genera Margaritifera and Gonidea (Table 1).
Radiocarbon dating results, corrections, and calibrations.

Note: N/A = not applicable.
1 Radiocarbon age determinations performed by DirectAMS (D-AMS). Bothell, WA.
2 Radiocarbon age is corrected for reservoir effect based on linear regression model of radiocarbon ages on shell/charcoal pairs from sites along the Snake River (Osterkamp et al., Reference Osterkamp, Green, Reid and Cherkinsky2014; see Fig. 6A).
3 Radiocarbon age is calibrated at 2σ using CALIB 8.2 (Stuiver et al., Reference Stuiver, Reimer and Reimer1993) with INTCAL20.14c dataset (Reimer et al., Reference Reimer, Austin, Bard, Bayliss, Blackwell, Bronk and Butzin2020). The full 2σ range is shown relative AD 1950.
Luminescence analysis
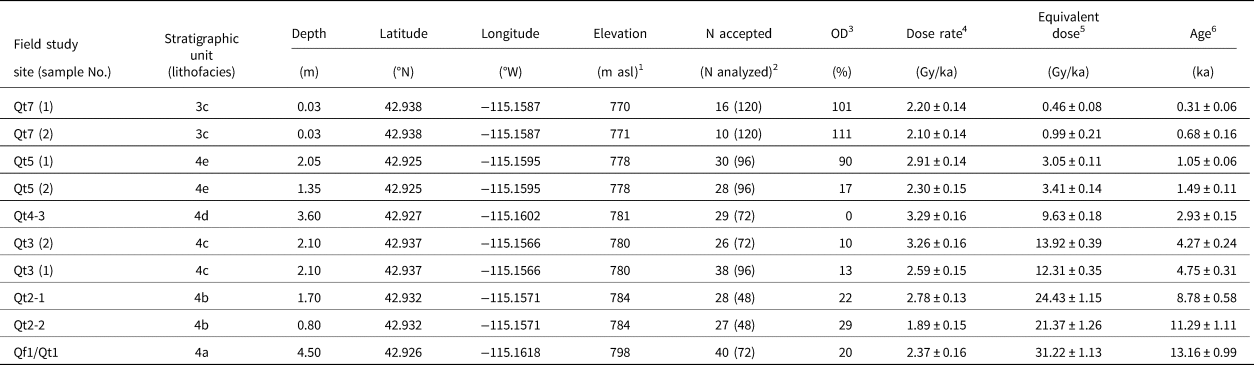
Luminescence dating determines the most recent period of sediment exposure to sunlight and therefore enables the direct determination of sediment depositional age (e.g., Rhodes, Reference Rhodes2011). We applied optically stimulated luminescence (OSL) dating to 10 samples of fine-grained quartz sand extracted from seven stratigraphic study sites (Table 2; Fig. 3). OSL ages from fluvial deposits can be affected by incomplete sun exposure of grains (partial bleaching) during transport, which may lead to age over-estimates (Rittenour, Reference Rittenour2008). In this study, the potential for partial bleaching of samples is assessed through examination of sample equivalent dose (De) distributions (see Supplemental Material for details), as well as by OSL dating of modern deposits in the river channel (e.g., Murray et al., Reference Murray, Olley and Caitcheon1995; Neudorf et al., Reference Neudorf, Roberts and Jacobs2014). Two samples of historical deposits were collected from a large depositional gravel bar of the lowest and active fluvial terrace (Qt7) near constriction #1 to provide information on the potential for partial bleaching of fluvial deposits in the study area (Table 2; Figs. 2B, 3).
Luminescence ages for samples from sites along the middle Snake River near Bancroft Springs.

1 Surface elevation of study sites. Elevation derived from photogrammetry of 0.5 meter resolution color aerial photographs acquired in 2005.
2 “N accepted” refers to the number of multi-grain aliquots measured in the sample that pass rejection criteria. See Supplementary Material for details.
3 “OD” refers to the overdispersion of the De distribution as calculated using the Central Age Model of Galbraith et al. (Reference Galbraith, Roberts, Laslett, Yoshida and Olley1999).
4 Dose rates (Gy/ka) were calculated using the conversion factors of Liritzis et al. (Reference Liritzis, Singhvi, Feathers, Wagner, Kadereit, Zacharias and Li2013) and are shown to 2 decimal places; ages were calculated prior to rounding. Measured water contents of 1–11% (expressed as the percentage of the mass of dry sediment) were used in age calculations. See Supplementary Material for details.
5 The Db value of all samples, except for samples Qt5(1), Qt7(1), and Qt7(2) was calculated using the Central Age Model of Galbraith et al. (Reference Galbraith, Roberts, Laslett, Yoshida and Olley1999). Ages for samples Qt5(1), Qt7(1), and Qt7(2) were calculated using the Minimum Age Model (Galbraith et al., Reference Galbraith, Roberts, Laslett, Yoshida and Olley1999).
6 Ages are rounded to the nearest 10 years and are reported in thousands of years before AD 2018.
Samples were extracted at each site either by driving a sample tube into sediments or by extracting a block of sediment. In two cases, at sites Qt4-3 and Qt3-1, the density of sediments necessitated carving blocks from the exposure face and wrapping the blocks in light-opaque, black-plastic sheeting. OSL dating was conducted using multi-grain aliquot quartz measurements following a modified single aliquot regenerative (SAR) protocol (Murray and Wintle, Reference Murray and Wintle2000, Reference Murray and Wintle2003) (see Supplemental Material for details).
Radiocarbon reservoir corrections
Many varieties of aquatic mollusks in lakes and springs grow their shells in waters with an initial 14C deficiency, and consequently give 14C ages older than the actual age of shell formation, commonly by several hundred years (e.g., Brennan and Quade, Reference Brennan and Quade1997). A large 14C-reservoir effect in the Snake River needs to be accounted for when interpreting 14C dates from riverine mollusks because a large component of the Snake River streamflow derives from persistent spring discharge from groundwater stored in basalt layers (e.g., Kjelstrom, Reference Kjelstrom1995; Maupin, Reference Maupin1995; Lindholm, Reference Lindholm1996; Osterkamp et al., Reference Osterkamp, Green, Reid and Cherkinsky2014). A study by Osterkamp et al. (Reference Osterkamp, Green, Reid and Cherkinsky2014) developed two empirical equations from linear regression analysis of paired conventional 14C dates of bivalve shells and charcoal from archeological sites ranging from ca. 1100–10,270 yr BP to estimate the 14C-reservoir effect on the Snake River. The empirical equations were derived from sites along two reaches of the Snake River downstream of Bancroft Springs between Swan Falls, Idaho and southeastern Washington (Fig. 1).
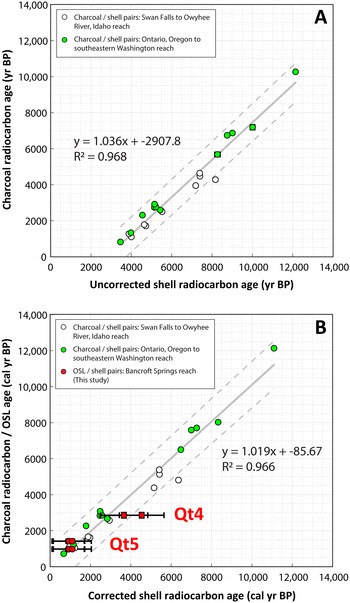
The 14C ages of aquatic gastropods and bivalves collected within our study area were corrected for reservoir effects using an empirical equation derived from a linear regression model and all the Osterkamp et al. (Reference Osterkamp, Green, Reid and Cherkinsky2014) paired sample dates (Fig. 6A). The corrected 14C shell age (Dcorr, yr BP) can be estimated as:

where Dshell (yr BP) is the conventional 14C age of the dated mollusk shell (R2 = 0.968, P <0.001). The regression analysis yielded standard errors for the slope of the line and y-intercept of 0.042 and 285.0, respectively. The 1σ uncertainty of corrected mollusk dates is ±440 yr. All radiocarbon dates (14C yr BP) including the corrected mollusk dates have been calibrated at 2σ to calendar years before present (cal yr BP) using the CALIB 8.2 program (Stuiver et al., Reference Stuiver, Reimer and Reimer1993) with the INTCAL20 dataset (Reimer et al., Reference Reimer, Austin, Bard, Bayliss, Blackwell, Bronk and Butzin2020) (Table 1).
Plots showing linear regression analyses. (A) Linear regression model and empirical equation used to correct bivalve and gastropod shell radiocarbon ages of this study for reservoir effects in the middle Snake River. Shell and charcoal radiocarbon ages of paired samples from two reaches on the Snake River downstream of Bancroft Springs of Osterkamp et al. (Reference Osterkamp, Green, Reid and Cherkinsky2014) were used in the model. (B) Comparison between corrected and calibrated shell radiocarbon and optically stimulated luminescence (OSL) ages of paired samples from silty sand deposits of the Qt4 and Qt5 terraces of this study and a linear regression model of corrected and calibrated shell radiocarbon and charcoal radiocarbon ages of paired samples of Osterkamp et al. (Reference Osterkamp, Green, Reid and Cherkinsky2014). Dashed lines show 95% prediction interval.

We performed an independent assessment of the reservoir correction by comparing the corrected and calibrated 14C charcoal/shell pairs of Osterkamp et al. (Reference Osterkamp, Green, Reid and Cherkinsky2014) used in the regression analysis with our OSL/14C shell pairs from Late Holocene terrace deposits. The paired OSL/14C shell ages from our study are from the fine-grained deposits of fluvial terraces Qt4 and Qt5. Corrected and calibrated shell 14C ages from Qt4 lithofacies 5a (2 pairs) and Qt5 lithofacies 5b (3 pairs) deposits were paired with OSL ages from Qt4 lithofacies 4d (1 pair) and Qt5 lithofacies 4c (2 pair) sediment, respectively (Tables 1, 2). Linear regression analysis shows five of the six median ages and all six of the 2σ uncertainties of the OSL/14C shell pairs of this study fall within the 95% prediction interval of the corrected and calibrated 14C charcoal/shell pairs of the Osterkamp et al. (Reference Osterkamp, Green, Reid and Cherkinsky2014) dataset (Fig 6B).
Our assessment indicates the reservoir effect at Bancroft Springs has been similar to other sites between 95–670 river km downstream from ca. 1000–12,000 cal yr BP. Even with the potential for partial bleaching, the luminescence ages of fluvial sediment from Qt4 and Qt5 deposits provided independent information to evaluate the accuracy of the reservoir corrections applied to mollusk shells (Fig. 6B). This provides confidence in the reservoir-corrected 14C ages of riverine mollusk shells in our study and suggests that Equation 1 is suitable for shells older than 1000 yr BP along the Bancroft Springs reach of the Snake River.
Radiocarbon dating of modern shell samples
Samples of living mollusks, Pisidium sp. (clam) and Physa sp. (snail), were collected at the water's edge on the Qt7 terrace in the vicinity of stratigraphic site Qt2-2 to evaluate the modern reservoir effect in the study area (Fig. 3). The bivalve and gastropod specimens were also collected to evaluate any differences in the reservoir effect between different classes of mollusks. The samples yielded 14C ages of 1451 ± 31 yr BP for Pisidium sp. and 1372 ± 25 yr BP for Physa sp. (Table 1). The older ages demonstrate the modern 14C reservoir effect is ca. 1400 yr within the Bancroft Springs reach of the Snake River. The small difference between the two ages also indicates that the intake of 14C by the two classes of mollusk is similar, a result that has been observed with dated mollusk classes from other downstream reaches (e.g., Osterkamp et al., Reference Osterkamp, Green, Reid and Cherkinsky2014).
The modern ca. 1400 yr reservoir effect is nearly half the ca. 2980 yr estimated from Equation 1 of this study for an equivalent contemporary age of −68 yr (AD 1950 − 2018) for the modern specimens. The difference demonstrates that the reservoir correction is not appropriate to use with modern mollusks, because the youngest paired shell age used to develop Equation 1 is ca. 3460 yr BP (Fig. 6A). The disparity between the reservoir effect from living organisms and shells older than ca. 3460 yr BP is likely associated with the combined effects of: (1) changes in rates of mixing between groundwater and surface waters influenced by a reduction in groundwater recharge across the watershed from a long-term increase in aridity during the Holocene (e.g., Shuman and Marsicek, Reference Shuman and Marsicek2016), and (2) historical impacts to the hydrologic system from groundwater pumping and water storage in reservoirs.
RESULTS
Geomorphology of study site
Geomorphic mapping documented a suite of seven fluvial treads (Qt) rising from 1 m above the Snake River to 130 m or higher, nearly reaching the canyon rim. Although not the primary focus of the study, we mapped five undifferentiated terraces/bars formed from the Bonneville Flood (Qtbf1–Qtbf5) to identify the highest level of post-flood terraces in the study area. The seven terraces (Qt1–Qt7) are inset into the Bonneville flood deposits, thereby post-dating the 18.1 ka flood (Fig. 3).
In addition to the post-flood fluvial deposits, we also mapped deposits derived primarily from local sources, including three alluvial fan units (Qf1–Qf3) and five alluvial terrace units flanking local tributaries and inset into older surfaces (Qa1–Qa5). Hillslope features were mapped as undifferentiated colluvium (Qc) derived from Bonneville Flood deposits and rocks of the Glenns Ferry Formation. The Qc unit also includes fluvial terrace risers. A cobble to boulder talus Qc(tal) sourced from basalt along steep canyon walls, plus active tributary channels (Qac), were also mapped (Figs. 2, 3). Alluvial fan units (Qf) from tributary basins are prominent along the west bank in the southern part of the study. There, vertical cut banks provide natural exposures of the stratigraphy and show the relations between alluvial fans and fluvial terraces. The oldest alluvial fan unit (Qf1) is found to overlie only Qt1 terraces, but it also is buried in places by younger Qf2 alluvial fan deposits. The Qf2 unit locally overlies Qt3 and Qt4 terraces (Figs. 2C, 3).
Active channels (Qac) are small ephemeral tributaries to the Snake River, commonly flanked by narrow and discontinuous alluvial terraces (Qa1–Qa5), which are inset to either alluvial fans or Snake River fluvial terraces (Fig. 3). The highest Qa1 surface is the largest in the area and grades to elevations that coincide with the lowest Bonneville Flood Qtbf5 feature, whereas the Qa2 surface grades to elevations as low as the post-flood Qt2 terrace (Fig. 3). The younger alluvial terraces also grade to the elevations of lower fluvial terraces with corresponding pairs including: Qa3 surface grading to Qt4 treads; Qa4 surface grading to Qt5 treads; and Qa5 surfaces grading to Qt6 treads (Fig. 3).
Four constrictions in the Snake River likely aided preservation of fluvial treads in the study area (Figs. 3, 4). Three of the four constrictions (#1, #3, and #4) are composed of extremely large (>7–10 m) angular to subrounded, boulders to blocks of basaltic rock plucked from the canyon rim and walls during the Bonneville Flood (Fig. 2). The heights of the obstructions closely coincide with adjacent, upstream terraces, which grade to, bury, or terminate at the obstructions. These channel obstructions also show strong evidence of channel erosion and scour (i.e., beveling) at specific elevations that closely coincide with the heights of nearby fill-terrace treads.
A large basaltic-boulder deposit forms prominent channel constriction #1. These boulders were likely derived from the canyon wall, transported to the canyon bottom, and deposited within an expansion bar during the Bonneville Flood (Qtbbf) (e.g., Malde, Reference Malde1968; O'Connor, Reference O'Connor1993) (Figs. 2A, 3). This bar has distinct steps descending to the modern Snake River (cross section A–A′; Fig. 4). The prominent steps likely formed during the waning stages of the Bonneville Flood while flow strength was still sufficient to move the boulders. Each step on the boulder bar, however, corresponds with the heights of adjacent fluvial treads and tread heights as much as ~1.6 km upstream near stratigraphic site Qt5 (Figs. 3, 4). Given the immense sizes of the boulders in the expansion bar at channel constriction #1, the bar has likely influenced post-flood terrace distribution in the study area.
Site sequence stratigraphy
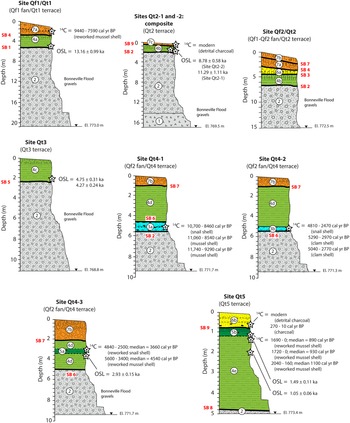
All terrace treads below the lowest Bonneville Flood terrace/bar (Qtbf5) are inset, and thus formed after ca. 18 ka, which is an inference confirmed by the geochronology. Nine sequence boundaries (SB-1 to SB-9, from oldest to youngest) represent mostly unconformable contacts between lithofacies units. The sequence boundaries in this study are used to define episodes of aggradation at the site (Figs. 5, 7).
Stratigraphic columns of measured sections of exposed stratigraphy of post-Bonneville Flood fluvial terraces (Qt1–Qt7) and alluvial fans (Qf1–Qf3). The positions of radiocarbon and luminescence sample sites and dates (stars), lithofacies units (circled numerals) (see Fig. 5), and sequence boundaries are also shown and referred to in text.

In general, the lower parts of the terrace stratigraphy consist of a thick section of uniformly sorted, sandy gravel to boulder facies with mostly basaltic lithologies (lithofacies 1 and 2). These lithofacies are interpreted to be tractive deposits of the Bonneville Flood (e.g., O'Connor, Reference O'Connor1993). The elevations of the erosional contacts on the Bonneville Flood gravel decreases toward the Snake River beneath Qt1–Qt5 terraces in at least five discrete steps, which represent strath surfaces cut on the deposits. The discrete steps resemble the steps identified on the Bonneville Flood expansion bar at constriction #1 (Fig. 4B). Contacts on the basal Bonneville Flood gravel (lithofacies 2) are represented by horizontal and buttress unconformities. These contacts are used to identify the extent of fluvial aggradation and alluvial deposition, and are represented by sequence boundaries. Sequence boundaries (SB-) 1, 2, 5, 6, 8, and 9 define the beginning of fluvial deposition of channel fill and gravelly lag lithofacies, whereas sequence boundaries 3, 4, and 7 define alluvial deposition of fan and channel-margin lithofacies (Figs. 5, 7).
The basal Bonneville Flood gravels are overlain by post-flood Snake River channel facies consisting of either a shell-rich, sandy gravel lag (lithofacies 3), a massive silty sand channel-fill (lithofacies 4), or shell-rich silty sand channel-fill (lithofacies 5). The majority of the Qt1–Qt5 terraces are overlain by either fluvial/alluvial margin facies (lithofacies 6) and/or alluvial fan/terrace facies (lithofacies 7) (Fig. 5). Sequence boundaries 3, 4, and 7 represent erosional boundaries between Snake River fluvial deposits and facies composed of alluvial fan/terrace and fluvial/alluvial margin deposits. Sequence boundary 7 within Qt4 terrace deposits, however, is a conformable boundary between similarly aged Snake River fluvial and alluvial fan deposits, but delineates a sharp change to a non-fluvial depositional environment (Figs. 5, 7).
The massive, silty fine-grained sand channel-fill facies (lithofacies 4) comprises the upper sections of Qt1–Qt5 terrace deposits and exhibits a progressive increase in thickness associated with each successively younger terrace. The shell-rich gravel lag facies (lithofacies 3) and both the massive and shell-rich silty sand channel-fill facies (lithofacies 4 and 5) were dated by either 14C, OSL, or both to provide age control of terraces Qt1–Qt5 and Qt7. One to three stratigraphic sites were sampled at each terrace (Tables 1, 2; Figs. 3, 7).
POST-FLOOD GEOMORPHIC HISTORY
The mapping, stratigraphic analysis, and geochronology enable interpretation of the post-flood geomorphic history of this reach of the Snake River. Detailed descriptions of study site stratigraphy, soil descriptions, and geochronology are given in the Supplemental Material.
Qt1 terrace (ca. 13.2 ka)
Terrace Qt1 surfaces at heights of ~20 m above the channel occur as relatively narrow and poorly preserved treads along the entire west bank of the river, whereas on the east bank of the river, surfaces have wider treads and continuous lengths in areas upstream of channel constriction #2 (Figs. 2, 3). The Qt1 treads are deeply incised and commonly buried by alluvial fan Qf1 deposits, especially where they are adjacent to steep canyon walls. A natural exposure at site Qf1/Qt1 was described on a south-facing slope adjacent to a small tributary channel and ~100 m west of the bank of the Snake River (Figs. 2D, 3). Site Qf1/Qt1 contains evidence of fluvial gravel deposition during the Bonneville Flood and post-flood fluvial aggradation and alluvial fan deposition during the latest Pleistocene to Early Holocene.
Luminescence analysis of a sample from near the base of lithofacies 4a at a depth of 4.5 m returned an OSL age of 13.16 ± 0.99 ka (Table 2). A mussel shell recovered from colluvium at ~2 m below the top of the exposure and coinciding with the middle section of alluvial fan lithofacies 7a was also dated to provide an additional age constraint (Fig. 7). The poorly preserved sample consisted of 50% whole shell and yielded a reservoir-corrected 14C age of 9440–7590 cal yr BP (Table 1; Fig. 7). Although the mussel shell is clearly not in situ, the 14C date provides a maximum age for the middle section of lithofacies 7a to Early Holocene. The stratigraphy and ages at the site indicate two episodes of aggradation: first, Snake River fluvial aggradation culminating by ca. 13.2 ka, followed by alluvial fan deposition spanning 8.4 ka (Fig. 8A).
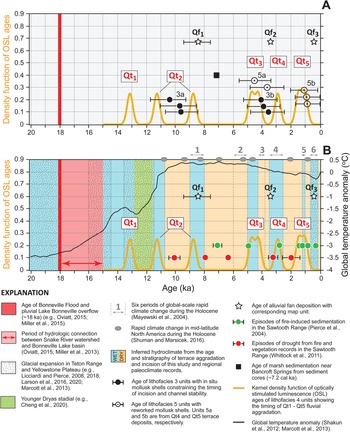
Chronology of post-Bonneville Flood fluvial terrace aggradation and incision along the Bancroft Springs reach of the middle Snake River. Plots showing: (A) kernel density function of optically stimulated luminescence (OSL) ages of Qt1–Qt5 terrace lithofacies 4 deposits in relation to corrected and calibrated radiocarbon ages of shells from lithofacies 3 and 5 deposits, the age of alluvial fan (Qf1–Qf3) deposition, and the age of marsh sedimentation near Bancroft Springs (McWethy et al., Reference McWethy, Alt and Lee2018) are also shown; and (B) kernel density function of OSL ages of Qt1–Qt5 aggradation in relation to six periods of global-scale rapid climate change during the Holocene (Mayewski et al., 2004), centennial-scale periods of rapid climate change in mid-latitude North America (Shuman and Marsicek, Reference Shuman and Marsicek2016), and global mean temperature anomaly from 20 ka to present day (Shakun et al., Reference Shakun, Clark, He, Marcott, Mix, Liu, Otto-Bliesner, Schmittner and Bard2012; Marcott et al., Reference Marcott, Shakun, Clark and Mix2013). Corresponding periods of rapid climate change in the Snake River watershed are assigned either wet (blue columns) or dry (orange columns) hydroclimatic conditions in this study based on the ages of terrace aggradation and intervening periods of incision and channel stability, respectively. The duration of hydrologic connection between the Snake River watershed and Lake Bonneville basin from ca. 18–15 ka is shown. The timing of glacial expansion in the Yellowstone Plateau and Teton Range, along with the Younger Dryas stadial are also shown. Episodes of fire-induced sedimentation and droughts during the Holocene based on paleoclimate records in the Sawtooth Range are shown in relation to the age of Qt2–Qt5 aggradation (Pierce et al., Reference Pierce, Meyer and Jull2004; Whitlock et al., Reference Whitlock, Briles, Fernandez and Gage2011).

Qt2 terrace (ca. 11.3–8.8 ka)
Terrace Qt2 surfaces, lying ~16 m above the channel, form wide treads along the west bank of the river upstream of channel constriction #1, and narrow, continuous treads on the east bank in areas upstream of channel constriction #2 (Figs. 2, 3). The Qt2 treads are deeply incised and locally buried by alluvial fan Qf1 and Qf2 deposits. Three natural bluff exposures at sites Qt2-1, Qt2-2, and Qf2/Qt2 were described along the west bank of the river (Fig. 3). Sites Qt2-1 and Qt2-2 are located on the riser of the broadest and most extensive terrace in the study area (Fig. 2B). The sites are ~11 m apart and contain Bonneville Flood basal gravels overlain by a section of Early Holocene fine-grained channel-fill deposits.
Luminescence analysis of samples from sites Qt2-1 and Qt2-2 near the base of channel fill (lithofacies 4b) deposits at depths of 1.7 m and 0.8 m returned OSL ages of 8.78 ± 0.58 ka and 11.29 ± 1.11 ka, respectively (Table 2; Fig. 7). Although the De distributions from these samples suggest that both have been sufficiently bleached prior to deposition, and the two ages are from depths near the base of lithofacies 4b, the 1σ uncertainties of the ages do not overlap. Taken together, the OSL ages indicate two episodes of Qt2 aggradation centered at ca. 11.3 and 8.8 ka. However, no stratigraphic or pedologic evidence for two episodes of aggradation was observed at sites Qt2-1 and Qt2-2.
Despite direct stratigraphic evidence for two episodes of aggradation at the OSL sample sites, there is supporting evidence for periods of landscape stability punctuated by at least two episodes of fluvial deposition from correlative deposits at sites Qt4-1 and Qf2/Qt2. Evidence of incision between ca. 11.3 and 8.8 ka is supported by the age of three mollusk shells sampled from shell-rich gravel lag facies (lithofacies 3a) along the base of Qt4 terrace deposits at site Qt4-1 (Figs. 3, 7). The in situ and well-preserved shells in lithofacies 3a returned reservoir-corrected 14C ages between 11,740 cal yr BP and 8460 cal yr BP, indicating the river was much lower and supported a diverse mollusk population structure at this time (Table 1). The median ages of the mollusks fall within the gap of the 1σ uncertainties between the two OSL ages and collectively indicate at least one cut-and-fill cycle between ca. 11.3–9.6 ka (Fig. 8A).
The stratigraphy and soils geomorphology at site Qf2/Qt2 in areas upstream of the OSL sample sites and site Qt4-1 support at least two episodes of Qt2 aggradation. Evidence of numerous buried soils indicating periods of geomorphic stability and soil formation punctuated by fluvial depositional events were observed within lithofacies 4b and 6a units (Fig. 7). A ~6 m difference in the height of sequence boundary SB-2 between sites Qt2-1, Qt2-2, and site Qf2/Qt2 also indicates a wide range of vertical aggradation during Qt2 terrace formation (Fig. 7). The degree of soil development of buried soils at site Qf2/Qt2 suggests an Early Holocene age for lithofacies 4b and 6a deposits, which is supported by a minimum constraining age of 9440–7590 cal yr BP from overlying sequence boundary SB-4 and alluvial fan (lithofacies 7a) deposits (Figs. 5, 7; Supplemental Material). Given the supporting evidence for multiple Early Holocene fluvial depositional events within Qt2 terrace deposits at site Qf2/Qt2 and low channel positions from mollusk dates in Qt4 deposits, we accept the OSL ages and interpret two episodes of Qt2 aggradation (Fig. 8A).
In addition, an age constraint for recent alluvial fan deposition on the Qt2 terrace is from 14C analysis of detrital charcoal within thin alluvial fan deposits at site Qt2-1 (Fig. 7). The charcoal yielded a modern date (Table 1). The modern date indicates the youngest Qf3 alluvial fan unit, represented by lithofacies 7c deposits, is actively being deposited in the study area.
Qt3 terrace (ca. 4.5 ka)
Terrace Qt3 surfaces lie ~11–12 m above the channel as narrow and continuous treads along both river banks downstream of channel constriction #2 (Fig. 3). The Qt3 treads are commonly buried by alluvial fan Qf2 deposits adjacent to steep canyon walls and grade to the top of the Bonneville Flood expansion bar (Qtbbf) at channel constriction #1 (Figs. 3, 4A). A natural bluff exposure at site Qt3 was described on a well-preserved tread near Bancroft Springs to characterize sediments and sample for luminescence analysis (Figs. 2A, 3).
Two luminescence samples, separated by ~40 cm, were taken at a depth of 2.1 m near the base of silty sand channel fill (lithofacies 4c) deposits that directly overlie Bonneville Flood deposits and returned OSL ages of 4.76 ± 0.31 ka and 4.27 ± 0.24 ka (Table 2; Fig. 7). The 1σ uncertainties of the two ages overlap and result in a mean age of 4.5 ± 0.4 ka. Site Qt3 shows evidence of Snake River aggradation resulting in the tread of Qt4 forming at ca. 4.5 ka during the Middle–Late Holocene transition (Fig. 8A).
Qt4 terrace (ca. 2.9 ka)
Terrace Qt4 surfaces lie ~10 m above the channel downstream of channel constriction #2 on the east bank of the river near Bancroft Springs, and form narrow and continuous treads along the entire west bank of the river (Fig. 3). The Qt4 treads grade to a prominent step on the Bonneville Flood expansion bar (Qtbbf) at channel constriction #1 and are commonly buried by alluvial fan Qf2 deposits (Figs. 2, 4). Natural exposures along a ~40 m-length of bluff at sites Qt4-1, Qt4-2, and Qt4-3 were described on the west bank of the river upstream of channel constriction #3 (Figs. 2C, 3). At the sites, Snake River fluvial sand and gravel overlie Bonneville Flood gravel. At least two post-flood cut-and-fill cycles are inferred from mollusk and OSL ages from Qt4 deposits, along with morpho-stratigraphic position between Qt3 and Qt5 terraces. These cycles are defined by episodes of Early Holocene incision followed by channel stability and Late Holocene fluvial aggradation and alluvial fan deposition.
Radiocarbon analyses were performed on eight mollusk shells within Qt4 deposits. An older shell-rich gravelly lag facies (lithofacies 3a) with in situ shells, previously mentioned, yielded three dates ranging from 11,740–8460 cal yr BP at site Qt4-1. A younger shell-rich gravelly lag facies (lithofacies 3b) with in situ and well-preserved shells, yielded three dates with a combined range from 5290–2470 cal yr BP at site Qt4-2. Two additional ages were obtained from an overlying shell-rich, silty sand channel fill facies (lithofacies 5a), giving a combined range from 5600–2500 cal yr BP at site Qt4-3 (Table 1; Fig. 7). The snail and mussel shells from the fine-grained lithofacies 5a deposits are likely reworked because both species of mollusks prefer a substrate habitat composed of gravel. Their ages are consistent with this by having dates close in age to other shells sampled from the underlying shell-rich gravelly lag (lithofacies 3b) deposits with a diverse mollusk assemblage (Fig. 8A).
The luminescence sample collected at site Qt4-3 provides a direct age determination of the silty sand channel fill facies (lithofacies 4d) and age of Qt4 aggradation (Figs. 3, 7). The luminescence analysis gives an OSL age of 2.93 ± 0.15 ka for lithofacies 4d (Table 2). The OSL age falls within the 2σ uncertainties of four out of five 14C dates on shells from bounding lithofacies 3b and 5a units (Fig. 8A). The OSL age and median age of the youngest shell date from lithofacies 3b, however, collectively provide a confident age constraint of Late Holocene Qt4 aggradation between ca. 3.6–2.9 ka.
Additional support of a Late Holocene age for Qt4 terrace deposits is from archeological investigations by Idaho State University (ISU) at a site underlain by Qf2 and Qf3 alluvial fan deposits. The ISU site (ISU-F2; Lohse, Reference Lohse2013) is on the Qf3 map unit and ~100 m downstream of our site Qt4-3 (Figs. 2C, 3, 7). Radiocarbon dates from charcoal sampled from two separate alluvial fan stratigraphic units at the ISU archaeological site yielded ages of ca. 3500–3300 cal yr BP and ca. 490–300 cal yr BP (Lohse, Reference Lohse2013), which constrain the ages of our Qf2 and Qf3 alluvial fan units, respectively (Figs. 3, 8A). The ca. 3.4 ka age for the deeper Qf2 deposits at the ISU site falls within the age constraint of Qt4 aggradation between ca. 3.6–2.9 ka (Fig. 8A).
Qt5 terrace (ca. 1.1 ka)
Terrace Qt5 surfaces lie ~5 m above the channel as narrow and discontinuous treads along the west bank of the river downstream of channel constriction #3, and as a narrow and continuous tread on the east bank upstream of channel constriction #3 (Fig. 3). The Qt5 treads are commonly well preserved and locally buried by Qf3 deposits. The Qt5 surface also grades to the top of basalt boulders and blocks that form rapids near channel constriction #3 and a corresponding step on the Bonneville Flood expansion bar (Qtbbf) at channel constriction #1 (Figs. 2B, 4B). A natural exposure along a ~20 m-length of bluff at site Qt5 was described on the east bank of the river to characterize sediments and to sample for 14C and luminescence analyses (Figs. 2D, 3). Site Qt5 contains evidence of mostly fine-grained channel fill deposited by the Snake River during the latest Holocene, followed by historical fluvial/alluvial margin deposition.
The age of Qt5 terrace deposits is based on 14C analyses of two samples of detrital charcoal and three samples of shell, along with two luminescence analyses (Fig. 7). Detrital charcoal samples were collected from interbedded fluvial/alluvial margin (lithofacies 6b) deposits and have 14C ages of 270–10 cal yr BP and modern (Table 1; Fig. 7). The 14C dates constrain the age of lithofacies 6b to the last 300 yr.
Additional 14C analyses were performed on three poorly preserved shells collected from a shell-rich silty sand channel-fill (lithofacies 5b) deposit containing abundant disarticulated mussel shells. The mussel shells from the fine-grained lithofacies 5b deposits are likely reworked because of their poor preservation and because that species of mollusk prefers a substrate habitat composed of gravel. The 14C analysis gives reservoir-corrected median ages ranging from 1100–890 cal yr BP (Table 1; Fig. 7). Two luminescence samples were collected stratigraphically below the lithofacies 5b deposit and provide a direct age determination of the silty sand channel-fill facies (lithofacies 4e) of 1.49 ± 0.11 ka and 1.05 ± 0.06 ka (Table 2; Fig. 7). The OSL ages are not in stratigraphic agreement, even considering their 1σ uncertainties (Fig. 7). The OSL samples exhibit different levels of bleaching based on their De distributions. Sample Qt5 (1) shows a positively skewed De distribution with a tail of high De values suggestive of incomplete bleaching, while sample Qt5 (2) exhibits a much more symmetrical De distribution suggesting that partial bleaching effects are relatively minor in the shallower and older sample (see Fig. S2 in Supplemental Materials). Nonetheless, the OSL ages constrain the age of the upper section of lithofacies 4e to latest Holocene, with a mean age of 1.3 ± 0.1 ka, consistent with the younger reworked shell median ages in the overlying lithofacies 5b. Collectively, the 14C and OSL ages indicate a single and rapid episode of latest Holocene aggradation at ca. 1.1 ka, followed by fluvial/alluvial margin deposition after ca. 270 cal yr BP (Fig. 8A).
Qt6 and Qt7 terraces (<0.11 ka)
Terraces Qt6 and Qt7 are the lowest fluvial surfaces in the study area, with heights of ~2–3 and 1–2 m above bankfull, respectively (Figs. 2A, B, 4). They occur as narrow and continuous treads along both banks of the river, grade to the top of basalt boulders and blocks that form rapids at channel constrictions #3 and #4, and grade to corresponding steps above the river on the Bonneville Flood expansion bar (Qtbbf) at channel constriction #1 (Figs. 2B, 4). Both terraces exhibit signs of historical to recent flood plain inundation in areas devoid of dense vegetation and in areas with fresh woody debris near channel constrictions #3 and #4, indicating the surfaces consist of active modern channel and floodplain deposits (Fig. 2A, B).
Luminescence analysis of two samples taken from ~1 m above the water's edge on the active bank and ~2 m above the water's edge near the top of the depositional bar at site Qt7 confirm the youthfulness of gravelly (lithofacies 3c) deposits (Figs. 2A, 3, 5). The lowest sample from the active bank returned an OSL age of 0.31 ± 0.06 ka. The other sample from sandy facies of the gravel bar containing partially buried pieces of plywood and plastic yielded an OSL age of 0.68 ± 0.16 ka (Table 2). The ages are in morpho-stratigraphic agreement and within their 1σ uncertainties, but due to high aliquot rejection rates, must be interpreted with caution (see Supplemental Materials). The maximum age constraint of the Qt7 terrace sediments containing modern plastic and plywood debris suggest that OSL ages from fluvial sediments in the Snake River system have the potential to be partially bleached, yielding ages up to ca. 840 yr older if the hydrologic and sedimentologic factors that controlled modern deposition were similar to pre-historical conditions.
DISCUSSION
Overall timing and possible controls on fluvial aggradation and incision on the middle Snake River
The terrace distribution and ages enable inferences regarding past geomorphic and hydrologic conditions. The absolute maximum depth of incision between episodes of aggradation is confidently constrained by the present-day Snake River channel configuration at constrictions #1, #3, and #4 (Figs. 3, 4A). At these constrictions, immovable boulders, blocks, and slabs of basalt have likely limited the position of the paleothalweg since the flood to its present-day configuration. We infer that base level within the reach also has not changed since the flood and is controlled at construction #1 where large boulders of the Bonneville Flood expansion bar are present in the modern channel bed at an elevation ~665 m (Figs. 2A, 4). The lateral margins of post-flood aggradation have been confined within the limits of canyon walls, as well as inset to Bonneville Flood gravelly canyon-fill deposits with strath terraces (Figs. 4B, 5).
The four channel constrictions in combination with the strath terraces have influenced the distribution and preservation of Qt1–Qt7 terraces. The heights of the well-defined steps on the Glenns Ferry Formation and Bonneville Flood expansion bar at channel constriction #1 coincide with the projection of post-flood fill-terrace tread gradients (Fig. 4B). Although the Late Holocene Qt3–Qt6 terraces grade to distinct elevations on the expansion bar deposit, no obvious obstructions that could have controlled the river elevation of the higher Qt1 and Qt2 terrace treads with gentler gradients were identified in the study area. As a result, it is likely Qt1 and Qt2 aggradation was influenced by a combination of enhanced upstream sediment supply and downstream base-level controls during the latest Pleistocene and Early Holocene.
We have presented confident ages for episodes of Qt1–Qt5 aggradation, however, there is uncertainty in estimating the magnitude of total aggradation associated with each terrace, as well as the net incision of the underlying Bonneville Flood gravelly canyon-fill (lithofacies 2) deposits. The use of sequence boundaries (SB-1, SB -2, SB -5, SB -6, SB -8, and SB -9) to determine the amount and timing of incision associated with each strath terrace is problematic because the sequence boundaries only identify the vertical position of the lower contact of a dated unconformity-bounded stratigraphic package (Fig. 5). Evidence of the positions of paleo-channel bottoms associated with each terrace tread likely either have been eroded or were not observed in the field, thereby limiting our ability to place lower boundary positions for incision prior to and during episodes of aggradation.
Given a lack of direct age control of the gravelly canyon-fill deposits below sequence boundaries, we present at least two hypotheses for the formation of the strath terraces: (1) the strath terraces are flood-formed benches developed on Bonneville Flood gravelly canyon-fill deposits during the waning stages of the flood that have consequently influenced the formation and preservation of the unconformable sequence of post-flood fill terraces at corresponding elevations; or (2) the strath terraces initially formed as a conformable sequence of post-flood cut-and-fill gravel terraces overlain by fill deposits that are inset to the Bonneville Flood gravelly canyon-fill deposits by prolonged erosion and aggradation of the Snake River. We consider the first hypothesis as the more plausible interpretation because of the sedimentology of the canyon-fill deposits, which consist of a massive sequence of uniformly sorted and graded sandy gravel, consistent with deposits previously identified as tractive deposits of the Bonneville Flood (e.g., O'Connor, Reference O'Connor1993). If the gravel deposits were related to post-flood cut-and-fill terraces, we would expect the sedimentology to be stratified with sands and gravels, similar in character to the gravelly channel lag (lithofacies 3) deposits identified at study sites, as well as the modern depositional gravel bars of the Snake River (Fig. 5).
In light of our preferred conceptual model of the formation of Qt1–Qt5 terraces, the trend of cut-and-fill cycles since 13 ka is reflected by short episodes of aggradation and by long periods of degradation followed by channel stability (Fig. 8A). Periods of degradation were interrupted by six episodes of fine-grained aggradation at ca. 13.2, 11.3, 8.8, 4.5, 2.9, and 1.1 ka (Fig. 8A). Incision since the post-flood aggradation at 13.2 ka likely owes to long-term reduction in sediment supply. Periods of incision are inferred to have stripped the bulk of post-flood channel-fill deposits to the immovable boulders at channel constrictions and the gravelly canyon-fill deposit, leaving behind preserved terrace deposits along channel margins during each subsequent episode of degradation.
Confident estimates of the position of the paleochannel during two periods of channel stability are from the elevations of shell-rich gravel lag (lithofacies 3a and 3b) deposits at sites Qt4-1 and Qt4-2 (Figs. 3, 5). The two mollusk assemblages indicate presence of a shallow and stable channel margin depositional environment from ca. 10.4–9.6 ka and ca. 4.1–3.6 ka (Fig. 8A). The different ages of the shell-rich gravel beds in similar environments and at nearly identical stage heights supports the conceptual model of repeated episodes of cut and fill within the confined limits of the paleochannel originally formed by the Bonneville Flood (Fig. 5). The inset positions between Qt4 and Qt5 terrace deposits provides additional evidence of repeated cut-and-fill cycles relative to modern bankfull (Fig. 5). Up to ~8–9 m of incision occurred following aggradation of the Qt4 terrace at ca. 2.9 ka. The most recent episode of aggradation is recorded within Qt5 terrace deposits, where ~4 m of aggradation and subsequent incision occurred since ca. 1.1 ka (Fig. 7).
In addition to alluvial fan deposition, other hillslope processes are currently contributing fine-grained sediment to the middle Snake River. The channel fill facies (lithofacies 4), which is common to all the terrace deposits, is likely derived from the Glenns Ferry Formation. The Glenns Ferry Formation consists mostly of interbedded massive siltstone and flaggy sandstone, which is exposed along canyon walls and is highly susceptible to landsliding (e.g., Covington and Weaver, Reference Covington and Weaver1990; Othberg et al., Reference Othberg, Gillerman and Kauffman2005). For example, large-scale rotational and earthflow landslides originating in the Glenns Ferry Formation and Yahoo Clay in areas ~20–40 km upstream between Bliss and Hagerman have contributed large volumes of fine-grained sediment to the river throughout the late Pleistocene and Holocene (Malde and Powers, Reference Malde and Powers1972; Covington and Weaver, Reference Covington and Weaver1990; Gillerman, Reference Gillerman2001; Othberg et al., Reference Othberg, Gillerman and Kauffman2005). These large landslides likely have been a source of Qt1–Qt5 fine-grained deposits, with the landsliding driven by periods of increased precipitation in the region.
Significance of regional and global climate variability on terrace development
Correlation of channel aggradation and incision to periods of climate change has been demonstrated throughout much of the arid to semi-arid western U.S. (e.g., Waters and Haynes, Reference Waters and Haynes2001; Pierce et al., Reference Pierce, Meyer and Rittenour2011). The terrace chronology for the Snake River at Bancroft Springs supports a similar conclusion of climate-driven fluvial response. Since the Bonneville Flood, variations in effective moisture and sediment supply influenced six episodes of fine-grained channel aggradation that reached stages as high as 20 m above modern bankfull. The episodes of fluvial aggradation and incision coincided with regional latest Pleistocene glacial and pluvial lake expansion, and approximately corresponds to six periods of global-scale rapid climate change during the Holocene. The periods of rapid climate change span the time periods 9.0–8.0 ka, 6.0–5.0 ka, 4.2–3.8 ka, 3.5–2.5 ka, 1.2–1.0 ka, and 0.6–0.15 ka and were identified from the analysis of 50 globally distributed paleoclimate proxy records for polar cooling, tropical aridity, and major atmospheric circulation changes (Mayewski et al., 2004; Fig. 8B). Rapid changes in climate at centennial scales have also been documented from 40 paleoclimate datasets from mid-latitude North America, including temperature- and moisture-sensitive proxy records, which generally correspond to global-scale sequences during the Holocene (Shuman and Marsicek, Reference Shuman and Marsicek2016; Fig. 8B). Not all the records used in paleoclimate reconstructions respond synchronously or equally during rapid climate change events, despite their continental and global extents (Mayewski et al., 2004; Shuman and Marsicek, Reference Shuman and Marsicek2016). To account for this, we assign either a wet or dry hydroclimatic condition to corresponding periods of global-scale rapid climate change to develop a site-specific paleoclimate record for the Snake River watershed based on the terrace chronology at Bancroft Springs (Fig. 8B). A wet assignment is from the age of terrace aggradation that we interpret to reflect an increase in sediment supply in response to wet hydroclimatic conditions. Conversely, a dry assignment is based on the age of intervening periods of incision and channel stability that we infer were influenced by a reduction in sediment supply in response to a more arid hydroclimate (Fig. 8B). We also correlate a variety of regional paleoclimatic proxy records to the terrace chronology to support our inferences of wet and dry hydroclimate assignments for each episode of fluvial aggradation and incision.
Latest Pleistocene (last glacial to 11.7 ka)
The upper parts of the Snake River watershed during the last glaciation supported the greater Yellowstone-Teton glacial system that developed from highly variable spatial and temporal patterns of glacier behavior within a restricted segment of the Rocky Mountains (Licciardi and Pierce, Reference Licciardi and Pierce2008). Glacier extent on the western margin of the glacial system was controlled by the physiographic configuration of the Snake River Plain that funneled moisture-laden westerly storm tracks, as well as a strong orographic effect that collectively influenced the formation of a large ice cap on the Yellowstone Plateau and alpine glaciers in the Teton Range (Foster et al., Reference Foster, Brocklehurst and Gawthorpe2010; Licciardi and Pierce, Reference Licciardi and Pierce2018).
The last glacial maximum in the watershed is recorded in moraines produced by a glacial advance at ca. 22–18 ka, followed by minor glacial retreat at ca. 18–16 ka (Licciardi and Pierce, Reference Licciardi and Pierce2008, Reference Licciardi and Pierce2018). Glacial retreat at ca. 18 ka in the watershed coincides with the age of ca. 18.1 ka for the Bonneville Flood from catastrophic breach of the spillway of Lake Bonneville during a rapid rise in water level in response to increased precipitation in the lake basin (Benson et al., Reference Benson, Lund, Smoot, Rhode, Spencer, Verosub, Louderback, Johnson, Rye and Negrini2011; Miller et al., Reference Miller, Oviatt and McGeehin2013; O'Connor et al., Reference O'Connor, Baker, Waitt, Smith, Cannon, George and Denlinger2020; Quirk et al., Reference Quirk, Moore, Laabs, Plummer and Caffee2020). Lake Bonneville likely continued to overflow for ca. 3 kyr after peak flood discharge and ceased sometime before ca. 14–14.5 ka when water levels receded below the overflow channel (Bright, Reference Bright1966; Godsey et al., Reference Godsey, Currey and Chan2005; Miller et al., Reference Miller, Wahl, McGeehin, Rosario, Oviatt, Anderson and Presnetsova2015; Oviatt, Reference Oviatt2015). The end of overflow maybe coeval with major retreat of mountain glaciers in the lake basin ca. 15 ka in response to rapid warming despite increases in precipitation at this time (Quirk et al., Reference Quirk, Moore, Laabs, Plummer and Caffee2020; Fig. 8B).
The first evidence of post-flood aggradation is the Qt1 terrace, which reached a stage height of up to ~20 m above bankfull at 13.2 ± 1.0 ka. This aggradation post-dates pluvial Lake Bonneville overflow (Fig. 8B). The Qt1 terrace age coincides with the latter half of glacial expansion in the Snake River watershed at 16–13 ka (Licciardi and Pierce, Reference Licciardi and Pierce2008, Reference Licciardi and Pierce2018; Laabs et al., Reference Laabs, Licciardi, Leonard, Munroe and Marchetti2020) and highstand water levels of pluvial Lake Chewaucan in southeastern Oregon at 14.6–12.8 ka (Hudson et al., Reference Hudson, Hatchett, Quade, Boyle, Bassett, Ali and de los Santos2019), which indicate relatively cooler and wetter climate at this time. The mean age of ca. 13.2 ka for the Qt1 terrace also coincides with minor alpine glacial expansion in the Teton Range at ca. 13.5 ka inferred from sediment lake-core evidence of Jenny Lake (Larsen et al., Reference Larsen, Finkenbinder, Abbott and Ofstun2016). Multiple proxy records from several other mountain lakes in the Yellowstone Plateau region indicate cool conditions and an increase in winter precipitation between ca. 14.0 and 11.5 ka (e.g., Whitlock, Reference Whitlock1993; Krause and Whitlock, Reference Krause and Whitlock2013). The age of Qt1 aggradation in the Snake River and aggradation within other large rivers systems in the Pacific Northwest (e.g., Gilmour et al., Reference Gilmour, Butler, O'Connor, Davis, Culleton, Kennett and Hodgins2015) also coincide with the onset of a period of global-scale cooling during the Younger Dryas stadial between 12.9–11.7 ka (Cheng et al., Reference Cheng, Zhang, Spötl, Baker, Sinha, Li and Bartolomé2020; Fig. 8B).
Early Holocene (11.7–8.2 ka)
The ages and stratigraphy of the post-glacial Qt2–Qt5 terraces of the middle Snake River indicate several periods of aggradation followed by channel incision during the Holocene (Fig. 8B). Changes in solar insolation, increased temperatures, and variable precipitation patterns in high-elevation parts of the Snake River watershed caused a reduction in alpine glacier and perennial snow extent during the Early Holocene (e.g., Foster et al., Reference Foster, Brocklehurst and Gawthorpe2010). Sediment lake-core evidence from high-elevation cirque lakes in the Teton Range also indicate reduced meltwater influx in the Early Holocene from ca. 10.0–6.3 ka (Larsen et al., Reference Larsen, Crump and Blumm2020). The long-term decline in alpine snowpack from the combined effects of increased sublimation and decrease in snowmelt runoff in the Early Holocene would have produced a coupled reduction of flow in the Snake River and groundwater baseflow compared to the latest Pleistocene.
Geochronology of Qt2 terrace deposits indicates two episodes of aggradation at the time of the Pleistocene-Holocene boundary (11.5 ka) and the Early-Middle Holocene boundary (8.2 ka). We infer that the ages, stratigraphy, and soils of Qt2 terrace and lithofacies 3a deposits provide evidence for two episodes of aggradation culminating at ~16 m above modern bankfull with an intervening period of incision and lower channel positions up to 6 m above modern bankfull (Figs. 5, 8A). The timing of aggradation at ca. 11.3 ka coincides with the termination of major glacial expansion in the Snake River watershed and the Younger Dryas stadial in response to a sharp increase in global temperatures (Fig. 8B). Paleoclimate records from the Yellowstone Plateau region also support continued warming in the region between ca. 11.5–10.8 ka (Whitlock, Reference Whitlock1993) and a change from wet to dry climate at ca. 11.5 ka (Krause and Whitlock, Reference Krause and Whitlock2013). An increase in sediment supply in the Snake River and aggradation at ca. 11.3 ka was likely driven by enhanced runoff in the watershed from either the melting of glaciers, increased precipitation, or both.
The intervening period from ca. 11.3–8.8 ka is interpreted from the terrace chronology to represent a change to more arid hydroclimate (Fig. 8B). A rapid shift in climate at ca. 10.8 ka is reflected in paleoclimate records in the mid-latitude of North America (Shuman and Marsicek, Reference Shuman and Marsicek2016; Fig. 8B). Local sediment and pollen records from a mountain lake on the southeastern Snake River Plain also show low lake levels and shifts in vegetation patterns indicating reduced moisture availability in the region between ca. 12.0 ka and 8.3 ka (Davis et al., Reference Davis, Sheppard and Robertson1986). Aridity in the region north of Bancroft Springs after ca. 10.8 ka is supported by fire and vegetation records from a mountain lake in the Sawtooth Range that show evidence for drought at ca. 10.5–9.7 ka (Whitlock et al., Reference Whitlock, Briles, Fernandez and Gage2011) (Fig. 8B). We infer there was a major shift in climate at ca. 10.8 ka that defines the termination of wet conditions in the Snake River watershed.
The timing of Qt2 aggradation at ca. 8.8 ka coincides with the first period of global-scale rapid climate change between 9 ka and 8 ka, which we interpret as a return to wet hydroclimatic conditions in the region at this time (Mayewski et al., 2004; Fig. 8B). In addition to fluvial aggradation, the age of Qf1 alluvial fan deposition at ca. 8.4 ka also coincides with the ca. 8.8 ka episode of Qt2 aggradation (Fig. 8B). The ages of fluvial aggradation and alluvial fan deposition are coincident with a global cooling event at ca. 8.4–8.0 ka identified in Greenland ice-core proxies (e.g., Alley et al., Reference Alley, Mayewski, Sowers, Stuiver, Taylor and Clark1997), demonstrating a potential link between atmospheric circulation patterns in the region and climatic teleconnections of cool conditions in the North Atlantic and wet conditions in the western U.S. during the Early Holocene (e.g., Steponaitis et al., Reference Steponaitis, Andrews, McGee, Quade, Hseih, Broecker, Shuman, Burns and Cheng2015). The global cooling event is also reflected in paleoclimate records from the mid-latitude of North America as a period of rapid climate change at ca. 8.3 ka (Fig. 8B). Wet conditions inferred from Qt2 aggradation at ca. 8.8 ka are not reflected in the alpine glacial lake record (Larsen et al., Reference Larsen, Crump and Blumm2020), likely because alpine hydroclimate at the time was influenced by nearly maximum Holocene global temperatures (Fig. 8B). Paleoclimate records from the Yellowstone Plateau region, however, indicate high winter precipitation between 9.8–8.2 ka, with a steady trend of drier conditions after ca. 8.5 ka (Whitlock et al., Reference Whitlock, Dean, Fritz, Stevens, Stone, Power, Rosenbaum, Pierce and Bracht-Flyr2012; Krause and Whitlock, Reference Krause and Whitlock2013). Paleoenvironmental records from lower elevation sites in the eastern Snake River Plain inferred from stable isotope analyses of small mammals also indicate increasing warmth and/or aridity and a possible increase in summer moisture between 10.0–7.0 ka (Commendador and Finney, Reference Commendador and Finney2016).
Middle Holocene (8.2–4.2 ka)
The latter half of the Middle Holocene, commonly referred to as the Mid-Holocene Warm Period, corresponds to the second period of global-scale rapid climate change between 6–5 ka, as well as rapid climate changes in the mid-latitude of North America at 7 ka and 5.5–5.2 ka (Mayewski et al., Reference Mayewski, Rohling, Stager, Karlén, Maasch, Meeker and Meyerson2004; Shuman and Marsicek, Reference Shuman and Marsicek2016; Fig. 8B). The absence of fluvial terraces or deposits with ages of ca. 8.0–5.0 ka in the study area may reflect an overall reduction in sediment supply and streamflow in the Snake River during the Middle Holocene. Radiocarbon dates on bulk sediment from a previous investigation of marsh deposits adjacent to Bancroft Springs provide information to assess the position of the channel during the Middle Holocene. Several cores up to 1.3 m depth and extracted from wetlands returned a maximum 14C date of ca. 7.2 cal ka BP (McWethy et al., Reference McWethy, Alt and Lee2018) from an equivalent stage height of ~12 m above bankfull in areas east of the Qt3 terrace and within the Qa5 alluvial terrace map units (Fig. 3). The date and elevation constrain the eastward extent of the Qt3 terrace deposits and the vertical position of the Snake River to an elevation below the core site (Fig. 8A). It is plausible that degradation in the study area was the dominant river response during the Middle Holocene. The Snake River during this time was likely supported by groundwater baseflow and had reduced sediment supply promoting a shift to channel incision followed by channel stability. Therefore, the entire period ca. 8.0–5.0 ka, including the second period of global-scale rapid climate change from 6.0–5.0 ka, is assigned a dry hydroclimate condition (Fig. 8B). Paleoclimate records from the Yellowstone Plateau support a dry hydroclimate assignment and collectively suggest a warm and dry climate between ca. 10.8–5.7 ka (Whitlock, Reference Whitlock1993) and less snowpack, cool springs, and warm dry summers during the Middle Holocene (Whitlock et al., Reference Whitlock, Dean, Fritz, Stevens, Stone, Power, Rosenbaum, Pierce and Bracht-Flyr2012). Furthermore, the fire records from the Sawtooth Range show evidence for two episodes of drought at ca. 8.2–7.9 ka and 6.5–6.3 ka (Whitlock et al., Reference Whitlock, Briles, Fernandez and Gage2011), as well as small sedimentation events related to low- to mixed-fire severity at 7.4–6.8 ka and ca. 5 ka (Pierce et al., Reference Pierce, Meyer and Jull2004). The timing of drought and fire-related sedimentation in the Sawtooth Range closely corresponds with the termination of the first and beginning of the second periods of global-scale rapid climate change, as well as rapid shifts in climate in mid-latitude North America (Fig. 8B).
Late Holocene (4.2 ka to present day)
The ages of the Qt3–Qt5 terraces and intervening periods of incision generally coincide with Late Holocene periods of global-scale rapid climate change (Fig. 8B). Local paleoclimate proxy records indicate the second and third periods of rapid climate change correspond to drier climatic conditions in the region (Fig. 8B). A change to generally wet conditions and increased snowmelt runoff is indicated in the Sawtooth Range at ca. 5.5–5 ka (Pierce et al., Reference Pierce, Meyer and Rittenour2011), which corresponds to termination of the second period of global-scale rapid climate change and Mid-Holocene Warm Period by ca. 5 ka (Fig. 8B). The ca. 4.5 ka age of Qt3 aggradation falls within the interval between the periods of global-scale rapid climate change, as well as coincides with a period of rapid climate change at 4.7 ka based on paleoclimate records in the mid-latitude of North America (Fig. 8B). Aggradation of the Qt3 terrace reached as high as ~11–12 m above modern bankfull and is inferred to have formed in response to wet conditions at ca. 4.5 ka (Fig. 8). Sediment lake-core records in the northern Rocky Mountains also indicate wet conditions at this time that were followed by a period of sustained aridity from ca. 4.4–3.7 ka (Shuman et al., Reference Shuman, Henderson, Colman, Stone, Fritz, Stevens, Power and Whitlock2009). Aridity at this time is coeval with the third period of global-scale rapid climate change between 4.2 ka and 3.8 ka (Fig. 8B). A period of aridity is also reflected in the Bancroft Springs reach between ca. 4.6–3.6 ka based on the ages of in situ and reworked shells from the gravelly lag (lithofacies 3b and 5a) deposits of the Qt4 terrace, which indicate incision and stable channel conditions up to ~6 m above modern bankfull at this time (Figs. 5, 8A). The age of incision and stable channel conditions also coincides with high-energy fluvial erosion at ca. 3.8 ka in the upper Snake River Plain (Keene, Reference Keene2016).
An increase in sediment supply is inferred from aggradation of the Qt4 terrace that reached a stage height of up to ~10 m above modern bankfull. The age of Qt4 aggradation is from an OSL age of 2.93 ± 0.15 ka from channel-fill deposits (Figs. 5, 8A). The ages of fluvial and alluvial deposits at all Qt4 study sites provide evidence for a change from low and stable channel positions to aggradation between ca. 3.6–2.9 ka. Aridity during this time is reflected nearby in the Sawtooth Range, which shows evidence for drought at ca. 3.6–2.9 ka (Whitlock et al., Reference Whitlock, Briles, Fernandez and Gage2011) and sedimentation related to fires at ca. 3.0–2.8 ka (Pierce et al., Reference Pierce, Meyer and Jull2004) (Fig. 8B). The drought and sedimentation records from the Sawtooth Range provide evidence for possible termination of drought conditions by ca. 2.9–2.8 ka, which corresponds closely with the age of Qt4 aggradation at ca. 2.9 ka (Fig. 8). The age of Qt4 aggradation also coincides with the fourth period of rapid climate change between 3.5 ka and 2.5 ka, which we assign a wet hydroclimate condition (Fig. 8B). This assignment is supported by additional paleoclimate records in the region that indicate predominately wet climate during this time. Although some lake records in the northern Rocky Mountains indicate variable lake levels from 3.9–2.4 ka (e.g., Shuman et al., Reference Shuman, Henderson, Colman, Stone, Fritz, Stevens, Power and Whitlock2009), other lake records from the same region contain biological evidence indicative of relatively wet conditions between ca. 3.2–2.3 ka (Stone et al., Reference Stone, Saros and Pederson2016). Furthermore, the alpine lake-core record from the Teton Range also indicates glacier expansion at ca. 2.8 ka (Larsen et al., Reference Larsen, Crump and Blumm2020). The timing of glacier expansion following Qt4 aggradation at ca. 2.9 ka suggests a coupled response of the fluvial and glacial systems of the Snake River watershed to either cooler temperatures, increased precipitation, or both at this time.
Wet conditions in the Snake River watershed likely ceased by ca. 2.5 ka coinciding with termination of the fourth period of global-scale rapid climate change and a change to a dry hydroclimate (Fig. 8B). Termination of wet conditions at ca. 2.5 ka generally coincides with extended drought across the central Great Basin from 2.8–1.9 ka, inferred from pollen records, and is referred to as the Late Holocene Dry Period (Mensing et al., Reference Mensing, Sharpe, Tunno, Sada, Thomas, Starratt and Smith2013). A rapid shift in climate at 2.1 ka is also suggested in mid-latitude North America paleoclimate records (Fig. 8B). Local alpine lake-core records indicate prominent retreat of the Teton Glacier between 2.4–1.0 ka (Larsen et al., Reference Larsen, Crump and Blumm2020), likely in response to an overall reduction in precipitation and an increase in global temperature anomalies between ca. 1.6–1.4 ka (Fig. 8B). Fire records in the Sawtooth Range also show extended drought at ca. 2.7–1.5 ka (Whitlock et al., Reference Whitlock, Briles, Fernandez and Gage2011) and fire-related sedimentation at ca. 1.5 ka and 1.2 ka (Pierce et al., Reference Pierce, Meyer and Jull2004), further demonstrating a change to dry climate during this period.
A change in the fluvial system behavior of the Snake River is inferred from another cut-and-fill cycle and aggradation of the Qt5 terrace that reached a stage height of up to ~5 m above modern bankfull. The age of the Qt5 terrace (1.1 ± 0.15 ka) coincides with a fifth and short period of global-scale rapid climate change between 1.2–1.0 ka (Fig. 8B). A period of incision associated with generally wet conditions and increased snowmelt runoff is indicated in the mountains of the Sawtooth Range at ca. 1.3–1.0 ka (Pierce et al., Reference Pierce, Meyer and Rittenour2011). Fluvial aggradation in the Snake River at ca. 1.1 ka is inferred to represent a rapid switch to wet conditions and increased sediment supply at this time (Fig. 8B).
Prolonged incision of the Qt5 terrace is inferred after ca. 1.1 ka based on a lack of younger fine-grained fill terraces in the study area. A period of persistent drought across the western U.S. during the Medieval Climatic Anomaly (MCA) between ca. 1.1–0.65 ka (e.g., Stine, Reference Stine1994; Cook et al., Reference Cook, Seager, Heim, Vose, Herweijer and Woodhouse2010) coincides with a return to mostly dry climate and reduced runoff in the watershed after ca. 1.1 ka (Fig. 8B). A period of rapid climate change at 0.9 ka associated with the MCA is also reflected in paleoclimate records from the mid-latitude of North America (Shuman and Marsicek, Reference Shuman and Marsicek2016; Fig. 8B). Locally, modest aggradation and channel stability in the mountain catchments of the Sawtooth Range occurred from ca. 1.0–0.7 ka and correspond with large fire-related debris flows during the MCA (Pierce et al., Reference Pierce, Meyer and Jull2004, Reference Pierce, Meyer and Rittenour2011) (Fig. 8B).
The MCA was terminated by a period of colder temperatures during the Little Ice Age (LIA) from ca. 0.65–0.10 ka when decreased temperatures coupled with greater effective moisture promoted glacier growth reaching Holocene maximum extents in the Teton Range and western U.S. (Solomina et al., Reference Solomina, Bradley, Jomelli, Geirsdottir, Kaufman, Koch and McKay2016; Larsen et al., Reference Larsen, Crump and Blumm2020; Fig. 8B). The sixth and last period of global-scale rapid climate change coincides with the LIA (Mayewski et al., Reference Mayewski, Rohling, Stager, Karlén, Maasch, Meeker and Meyerson2004). The beginning of the LIA is reflected locally in the Sawtooth Range by a period of incision associated with wet conditions and increased snowmelt runoff at ca. 0.5 ka (Pierce et al., Reference Pierce, Meyer and Rittenour2011; Fig. 8B), as well as increased fluvial deposition in the upper Snake River Plain after ca. 0.75 ka (Keene, Reference Keene2016). Evidence of increased discharge in the Snake River during the LIA is from the date of detrital charcoal in overbank (lithofacies 6b) deposits on the Qt5 terrace with a median probability 14C age of ca. 0.11 ka (Fig. 7). The age of overbank deposition indicates the Snake River attained a flood stage at a similar height of ~5 m as Qt5 aggradation prior to the MCA. Multiple 14C dates ranging from ca. 0.4–0.1 ka from detrital charcoal mixed with Qf3 alluvial fan deposits on the Qt2 and Qt4 terraces also show widespread alluvial deposition coinciding with the LIA (Fig. 8).
The episode of overbank flooding and local alluvial deposition at Bancroft Springs occurred near the end of the LIA. The age of flooding and alluvial deposition along channel margins at ca. 0.11 ka in the study area coincides with prominent glacier maxima at ca. 0.1 ka in the Teton Range (Larsen et al., Reference Larsen, Crump and Blumm2020). Post-LIA streamflow in the Snake River has been confined below the Qt5 terrace, but the Qt6 and Qt7 terraces have been frequently inundated by historical to modern overbank flooding during a period of increasing temperatures and controlled outflows from Bliss Dam (Fig. 8B). If any LIA fill terraces developed at stage heights less than ~5 m, it is likely that they have since been eroded by large historical to recent discharge events.
CONCLUSIONS
We characterized the latest Pleistocene and Holocene fluvial-geomorphic history of the middle Snake River at Bancroft Springs by mapping, as well as 14C and luminescence dating of a previously unstudied suite of fluvial terraces that formed after the Bonneville Flood (ca. 18 ka). The geomorphology and stratigraphy described for seven fill terraces situated up to 20 m above modern bankfull provide evidence of numerous cut-and-fill cycles that occurred after the Lake Bonneville hydrologic system was separated from the Snake River watershed by ca. 15–14.5 ka. The distribution and preservation of the post-flood terrace sequence were controlled by variations in sediment supply, as well as local base-level changes associated with prominent steps on landforms and deposits formed by the flood.
The age of fluvial and alluvial aggradation and incision can be linked to periods of continental- and global-scale rapid climate change. Episodes of latest Pleistocene and Holocene aggradation generally coincide with wetter and perhaps cooler climate during the onset of the Younger Dryas stadial (ca. 13.2 ka), deglaciation and termination of the Younger Dryas stadial (ca. 11.3 ka), Early Holocene cooling event (ca. 8.8 ka), and Neoglacial (ca. 4.5, 2.9, 1.1 ka). Six periods of incision followed by channel stability may coincide with reductions in sediment supply, drier climatic conditions, or both during the Pleistocene-Holocene transition (ca. 13.1–11.4 ka), Early Holocene (ca. 11.2–8.9 ka), Middle Holocene (ca. 8.7–4.6 ka), and Late Holocene megadroughts (ca. 4.4–3.0, 2.8–1.2 ka), including the Medieval Climate Anomaly at ca. 1.0–0.6 ka. Identifying the spatial and temporal changes of landform development furthers our attempt to place geomorphic events along the middle Snake River within a paleohydrological context and characterize the pattern of hydroclimate variability in the region during the past ca. 13,000 yr.
Acknowledgments
Funding for this work was primarily provided by Idaho Power Company contracts 123407-2, 123407-3, 175096-1, and 175096-2, with additional contributions from the General Frederick Lander Endowment at the Desert Research Institute. C. Neudorf was partially supported by NSF Grant 1914566. The authors acknowledge Don Sada for assistance with mollusk species identification. We thank the late Waite Osterkamp for discussions on the radiocarbon reservoir effects of the Snake River. We also thank Amanda Keen-Zebert and the Desert Research Institute E.L. Cord Luminescence Laboratory. The authors thank Kyle House, Spencer Wood, and Barbara Mauz, along with Quaternary Research Editors, in particular Jim O'Connor, for providing constructive and thoughtful reviews that greatly improved the manuscript.
Supplementary materials
The supplementary material for this article can be found at https://doi.org/10.1017/qua.2022.60