1. Introduction
Our knowledge of biological systems is strongly fueled by the progress in optical microscopy over the last few decades, and in particular, by the development of optical probes such as organic dye molecules (Zhang et al. Reference Zhang, Campbell, Ting and Tsien2002; Waggoner, Reference Waggoner2006), metal–ligand complexes (Mason, Reference Mason1999; Lakowicz, Reference Lakowicz2006), lanthanide chelates (Hemmila & Laitala, Reference Hemmila and Laitala2005), semiconductor quantum dots (Alivisatos, Reference Alivisatos1996; Weller, Reference Weller1998), fluorescent proteins (Shaner et al. Reference Shaner, Steinbach and Tsien2005), or nitrogen-vacancies in diamond, etc. (Kurtsiefer et al. Reference Kurtsiefer, Mayer, Zarda and Weinfurter2000; Jelezko & Wachtrup, Reference Jelezko and Wachtrup2006; Chang et al. Reference Chang, Lee, Chen, Chang, Tsai, Fu, Lim, Tzeng, Fang, Han, Chang and Fann2008). The discovery of naturally fluorescent materials, e.g. minerals such as fluorite marked the early stages of the utilization of fluorescence contrast. Although, intrinsic fluorescence of proteins can arise from weakly fluorescent aminoacids such as tryptophan and tyrosine, only few cellular building blocks provide strong fluorescence properties, e.g. cholophyll, rhodopsine, etc., and thus, are directly optically accessible. However, the majority of proteins, lipids, and nucleic acids, do not exhibit strong spectroscopic responses upon excitation by light, e.g. photoluminescence, Rayleigh-scattering, absorption or Raman-scattering. Thus, optical spectroscopy or microscopy cannot directly address these components on a molecular level due to lack in sensitivity. In order to make these entities accessible to biophysical studies as well as medical diagnostics, secondary labeling techniques have been developed, which take advantage of the strong optical properties of chemically designed quantum emitters, genetically encoded probes, and also of naturally fluorescent materials. The progress in fluorescence-related methods over the last few decades has accomplished a set of modern labeling strategies, which nowadays allows for multiple staining of various cellular organelles. Selective detection of these labels enables life cell imaging on a level of single molecule detection. Thus, fluorescence markers are of great importance in various fields, such as for the identification of nucleotides, aminoacids, drugs, pollutants, the determination of ion concentrations and the pH in cellular organelles, and also in diagnostics of diseases. Several sophisticated techniques based on the use of fluorescence signatures such as brightness, lifetime, anisotropy or their spectrum have been developed, including time-resolved measurements such as fluorescence correlation spectroscopy (FCS) (Schwille et al. Reference Schwille, Haupts, Maiti and Webb1999), fluorescence anisotropy (Jähnig, Reference Jähnig1979), fluorescence lifetime measurements (Verveer et al. Reference Verveer, Wouters, Reynolds and Bastiaens2000), Förster resonant energy transfer (FRET; Förster, Reference Förster, Mielczarek, Knox and Greenbaum1948), and also multiphoton fluorescence excitation (Xu et al. Reference Xu, Zipfel, Shear, Wiliams and Webb1996), etc. These techniques can provide far more information on a biological system than its spatial and chemical organization and its molecular environment. They make use, e.g., of temporal fluctuations or modifactions of the fluorescence intensity, and can reveal molecular concentrations and molecular dynamics on the nanosecond timescale, e.g. to investigate the transport of substrates through cellular membranes, lateral diffusion of membrane compounds such as proteins and lipids, lipid rafts and caveolea, conformational changes, and binding kinetics. All in common, these techniques make use of specific photophysical properties of the quantum emitters and/or their modification in different environments.
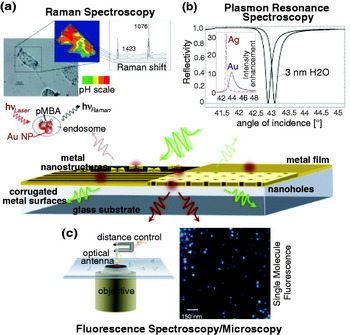
Although, far-field fluorescence microscopy has been in particular very successful in biological science due to its extraordinary sensitivity, high specificity, and versatility, research in this field is still driven by the demand for brighter and optically more stable probes with minimized toxicity and reduced dimensions as well as by the demand for higher detection sensitivity and optical resolution. In terms of these demands, metal enhanced fluorescence opens up new strategies by utilizing the plasmonic nature of metallic structures on the nanometer scale. Plasmonic nanostructures can boost the light–matter interaction, and thus have impact on processes such as the light absorption, emission, and also light localization. Figure 1 displays possible plasmonic structures, which are employed for the amplification of spectroscopic responses and the detection of molecules and molecular interaction.
Plasmon-mediated spectroscopy and microscopy. (a) Surface enhanced Raman spectroscopy of 4-mercaptoencoic acid (pMBA) on gold nanoparticle aggregates for pH probing in live cells. Modified from Kneipp et al. (Reference Kneipp, Kneipp, Wittig and Kneipp2007) with the permission of the American Chemical Society. (b) Localized plasmon resonance spectroscopy: induced shift in the SPP resonance by a water layer of 3 nm on a Ag surface. The inset shows the angle of incidence dependence on the intensity enhancement near Ag and Au surfaces. (c) Sketch of the principle of antenna-assisted microscopy by means of a finite plasmonic nanoantenna and high-resolution fluorescence image of individual dye molecules with random orientation of their transition dipole moment.

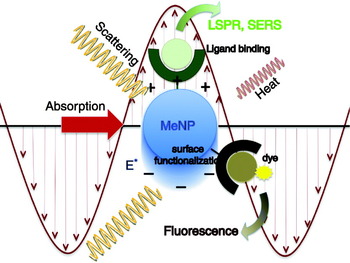
The aim of this review article is to provide a detailed understanding of the processes involved in metal-enhanced biological sensing, detection, and imaging. To keep the discussion in bounds, we will restrict ourselves to fluorescence-based interactions. We will point out the principles of plasmon-enhanced fluorescence, its impact on current limitations in the field of nanobiophotonics, and we will discuss representative results. Nanoplasmonic structures provide also great potential for label-free detection of biomolecules, such as in (localized) surface plasmon resonance (L)(SPR) spectroscopy for bioaffinity reactions or surface enhanced Raman scattering (SERS) (cf. Fig. 1), which also may pave the way for new high-resolution imaging techniques. For detailed information on these techniques, we refer to recently published review articles (Homola et al. Reference Homola, Yee and Gauglitz1999; Willets & Duyne, Reference Willets and Duyne2007; Kneipp et al. Reference Kneipp, Kneipp, Itzkan, Dasari and Feld2002).
2. Principles of fluorescence
The chemical structure of a molecule is directly connected to its optical properties, e.g. its ability to emit fluorescence. Fluorescence occurs naturally in minerals, bacteria, and plant cells, and is encountered also in synthetically engineered materials. These classes of intrinsic, e.g., aromatic amino acids, neurotransmitters, porphyrins, green fluorescent protein (GFP), and extrinsic fluorophores, such as organic dye molecules, are characterized by conjugated carbon chains or aromatic rings.
2.1 Excitation and emission of a quantum emitter
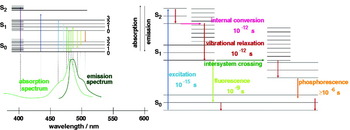
The conjugated delocalized π electrons of chromophores lead to electronic states with transition frequencies in the UV or visible spectral range. The electronic states are split into vibrational and rotational sub-levels. The Jablonski diagram in Fig. 2 shows the relaxation pathway of an excited molecule. The relaxation pathway involves internal conversion from higher vibrational states to the lowest vibrational level of the first excited singlet state within picoseconds. This is followed either by radiative or non-radiative decay to the electronic ground state within nanoseconds. Radiative decay involves the emission of a fluorescence photon whose frequency is redshifted with respect to the wavelength of the excitation frequency. On the other hand, in non-radiative decay, the energy difference between excited and ground state is dissipated to heat via molecular collisions and vibrations. In rare instances, intersystem crossing to a triplet state can occur, leading to the emission of phosphorescence. As typical triplet state lifetimes are in the millisecond range, intersystem crossing leads to dark periods in the fluorescence emission of a molecule (fluorescence blinking). Biological research often demands for quantum emitters with high quantum efficiency, which is given by the probability of transitioning from excited to ground state by emitting a fluorescence photon.
Jablonski diagram showing the energy levels of an organic dye molecule. Spontaneous emission of the molecule is accomplished by its excitation and subsequent internal conversion and vibrational relaxation the ground state of the first excited state, followed by the radiative decay to the ground state of the molecule. Competing decay routes comprise non-radiative decay via dissipation into heat and the intersystem crossing to a triplet state with long lifetime.

In the regime of weak excitation, far from saturation of the excited state, the fluorescence emission rate γem0 can be considered as a sequence of two sequential processes, namely the excitation from ground state to excited state and the subsequent relaxation back to the ground state via emission of a fluorescence photon, i.e.

where γexc0 is the excitation rate and Q i0 is the quantum yield. The superscripts ‘0’ specify that the molecule is in free space and does not couple to the local environment. The subscript ‘i’ indicates that the quantum yield is defined by the intrinsic properties of the molecule.
As indicated before, Q i0 is the probability of relaxing from excited to ground state by emission of a fluorescence photon. In terms of the radiative decay rate γr0 and the non-radiative decay rate γnr0 we can express the intrinsic quantum yield as

If we change the local environment of the molecule we will affect its excitation and decay rates. Thus, Eqs. (1) and (2) get modified as

and

Here, γabs accounts for dissipation to heat in the environment and γm accounts for coupling to non-radiative electromagnetic modes. The total decay rate γ=γr+γnr defines the lifetime τ=1/γ of the excited state. In general, the fluorescence emission is not only a function of the molecular properties but also of external parameters accounting for the local environment of the molecule (Lichtman & Conchello, Reference Lichtman and Conchello2005). In later sections, we will discuss factors that influence the excitation rate enhancement (γexc/γexc0) and quantum yield enhancement (Q/Q i0).
2.2 Influence of the environment
In conventional fluorescence microscopy, the design of brighter and more stable probes aims at the minimization of the internal and environmentally conditioned non-radiative processes, yielding a higher spontaneous-emission rate. Probably the most fascinating example for such an optimization is given by nature itself. The GFP exhibits a chromophore consisting of three aminoacids, which are common also for many other proteins with non-fluorescent properties (Shimomura et al. Reference Shimomura, Johnson and Saiga1962; Tsien, Reference Tsien1998). What makes this chromophore in GFP fluorescent is its protected location within the protein structure; hosted in a β-barrel, the chromophore is shielded from its environment. Only the precise arrangement and orientation of the chromophore in this protein enable its fluorescence properties. Slight deviations of the optimized conformational form can lead to complete loss of fluorescence. Nowadays, biochemical modifications of GFP and other fluorescent proteins have established a spectrum of genetically encoded probes spanning the UV and visible range, with higher quantum efficiency and photostability comparable with their wild-type counterparts (Shaner et al. Reference Shaner, Campbell, Steinbach, Giepmans, Palmer and Tsien2004). Engineering of genetically encoded fluorescent probes has become an extensive and highly dynamic field of research, which requires a detailed understanding of the involved internal photochemical processes as well as of the energy dissipation in the local chemical environment. The high sensitivity to modifications in the environment of GFP can be used for sensing of local refractive index changes or variations in the chemical composition. For example, local refractive index changes can be extracted from fluorescence lifetime measurements. Fluorescence lifetime imaging of GFP is being used for live cell imaging of ligands and receptors in cellular membranes (Suhling et al. Reference Suhling, Siegel, Phillips, French, Leveque-Fort, Webb and Davis2002).
The fact that the local environment of a fluorophore can have significant effects on its photophysical properties is known since Purcell's studies on the spontaneous emission probability of a free atom in a high-Q cavity in 1946 (Purcell, Reference Purcell1946). Since then, his theoretical considerations have been verified in various experiments studying the modification of the fluorescence lifetime for molecules near metal and semiconductor interfaces, in microcavities and photonic crystals, etc. (Drexhage et al. Reference Drexhage, Fleck, Shafer and Sperling1966; Drexhage, Reference Drexhage and Wolf1974; Kleppner, Reference Kleppner1981; Lodahl et al. Reference Lodahl, van Driel, Nikolaev, Irman, Overgaag, Vanmaekelbergh and Vos2004; Rigneault et al. Reference Rigneault, Lemarchand and Sentenac2000; Danz et al. Reference Danz, Waldhausl, Brauer and Kowarschik2002). This pioneering work stimulated the intent to control the emission rate of a fluorophore by modifying its local environment and has led to intensive research on the fundamental processes responsible for molecular fluorescence near structured surfaces. For molecules near metal surfaces, fluorescence lifetime changes are due to modifications of both the radiative and the non-radiative decay rates. This is in contrast to conventional fluorescence microscopy, where the fluorescence lifetime depends mostly on non-radiative decay channels, such as in FRET, low quantum-yield DNA markers, or pH- and ion-sensitive fluorophores (Förster, Reference Förster, Mielczarek, Knox and Greenbaum1948; Tsien et al. Reference Tsien, Ernst, Waggoner and Pawley2006; Slavik, Reference Slavik1982; Rye et al. Reference Rye, Yue, Wemmer, Quesada, Haugland, Mathies and Glazer1992; Cohen & Salzberg, Reference Cohen and Salzberg1978).
The main reason for coupling fluorophores to metal structures is to control γr and γexc in addition to γnr. The optimization of these competing processes requires a fundamental understanding of the influence of the material properties and the geometry on the light–metal–molecule interaction (Novotny, Reference Novotny1996; Barnes, Reference Barnes1998; Ford & Weber, Reference Ford and Weber1984; Chance et al. Reference Chance, Prock and Silbey1973; Novotny, Reference Novotny1997; Gersten, Reference Gersten, Geddes and Lakowicz2005). In the following we will summarize the major processes affecting the total ascertainable fluorescence signal. In addition to excitation and emission rate enhancements, the fluorescence intensity can also be affected by changes of the angular emission pattern and hence the detection efficiency.
2.3 Theoretical description
We consider a molecule characterized by its transition dipole μ located at r 0. For weak excitation fields, we can describe the excitation and emission processes in terms of first-order perturbation theory. The molecule's fluorescence rate is then described by a two-step process according to Eq. (3). The local electric field E has typically two contributions, namely the incident excitation field E 0 and the field originating from structures in the local environment E. The excitation rate is proportional to the absolute square of E along the direction of the absorption dipole moment and thus, is described by

The molecule's dipole moment is defined by the quantum wavefunctions and hence by the molecule's internal potential. For weak excitation fields, it is not affected by the local field E. As the local environment changes the excitation field from E 0 to E, the excitation rate enhancement becomes
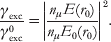
Here, nμ denotes the unit vector in the direction of μ. Thus, the enhancement of the local field by metal structures leads to an increase of the molecule's excitation rate. Note that the direction of the local field E is not necessarily in the direction of the excitation field vector E 0.
In the next step, we calculate the total decay rate from excited state to ground state, which can be related to the local density of states (Novotny & Hecht, Reference Novotny and Hecht2006). For a two-level system, the rate of spontaneous decay from the excited state |i〉 with energy E i=ħωi to a set of final states of equal energies E f=ħωf is given by Fermi's golden rule:

where  denotes the interaction Hamiltonian in the dipole approximation. Because of the continuous distribution of the final states, the sum in Eq. (7) reduces to an integral. The latter can be easily solved because of the delta function δ(ωi−ωf). The result can be represented in terms of the partial local density of states ρ as (Novotny & Hecht, Reference Novotny and Hecht2006):
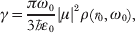
where ω0=ωi−ωf and ρ can be expressed in terms of the system's dyadic Green's function  as (Novotny & Hecht, Reference Novotny and Hecht2006)

The Green's function has two parts, namely  , with
 being the Green's function of free space and
 accounting for structures in the local environment. Thus, metal structures in the local environment alter the local density of states ρ and lead to a modification of the molecule's decay rate γ.
The same result for γ can be obtained from a purely classical perspective, where the molecule is treated as a harmonically oscillating dipole with angular frequency ω0 and dipole moment μ (Chance et al. Reference Chance, Prock, Silbey, Prigogine and Rice1978). In free space, the dipole oscillation satisfies

with γ0 being the free-space decay rate. To account for an inhomogeneous environment, i.e. structures with which the molecule interacts, we need to add a secondary source term to the right-hand side, namely

Here, E scatt is the dipole's field that acts back on the dipole after it has been scattered from the environment. Evidently, E scatt=0 in free space because there are now structures that would cause the field to be scattered back to the dipole. Note that E scatt≠E S. While E S denotes the scattered part of the excitation field E responsible for the excitation of the molecule according Eq. (5), E scatt is the field emitted by the molecule that acts back on itself. In the regime of weak damping (γ<<ω 0) the solution for the normalized decay rate becomes (Novotny & Hecht, Reference Novotny and Hecht2006)

where Q i0 is the intrinsic quantum yield introduced earlier and k=(ω0/c)n, with n being the index of refraction. The ratio γ/γ0 is identical to P/P 0, which is the ratio of powers emitted by an oscillating dipole in an homogeneous and inhomogeneous environment, respectively. It can be shown that this classical result is identical with the result in Eq. (8), which justifies the phenomenological classical approach originally introduced by Chance, Prock and Silbey in 1978 (Chance et al. Reference Chance, Prock, Silbey, Prigogine and Rice1978). This model has been successfully used to explain lifetime changes of molecules and ions in inhomogeneous environments, e.g. for Eu3+ ions in the vicinity of a silver surface (Drexhage, Reference Drexhage1970).
3. Fluorescence emission near planar interfaces
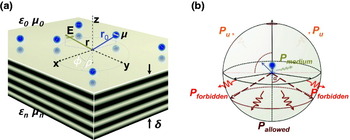
In the previous section, the alteration of fluorescence emission through its environment has been described in an abstract way, without referring to a particular experimental situation. It has been shown that the decay rate is dictated by the local density of states. In this section, we apply the established theoretical framework to a molecule near a material with a planar surface, as illustrated in Fig. 3. The parameters of this configuration are the dielectric properties of the material ∊, the distance of the molecule from the surface z 0, and the orientation of the molecule's dipole moment μ relative to the surface normal.
Fluorescence emission near planar interfaces. (a) A fluorescent molecule is located at a distance of z 0 above a planar interface with an orientation of its dipole moment μ. The dielectric properties of the surrounding medium and the interface are given by ∊0 and ∊n. (b) Possible contributions to the radiated power for a quantum emitter near a planar metal surface: light emission in reflection or transmission, e.g. allowed and forbidden light, and non-radiative decay routes via coupling to phonons, surface phonon polaritons, SPPs, and generation of heat.

An excited molecule near a planar surface can relax to its ground state via several decay mechanisms. Radiative decay can occur via emission of light in reflection or transmission, depending on the transparency of the material, and non-radiative decay can be mediated by coupling to phonons and generation of heat or the coupling to bound electromagnetic modes, such as surface phonon polaritons or surface plasmon polaritons (SPPs). For transparent materials, such as glass, fluorescence photons can be emitted into angles within the critical angle of total internal reflection (TIR) ( ) or beyond θc. In the former case, one refers to ‘allowed light’ and in the latter case to ‘forbidden light’ (Novotny & Hecht, Reference Novotny and Hecht2006). This terminology stems from the fact that for large molecule–surface distances d there is no forbidden light. To evaluate Eq. (12), we need to calculate the field E scatt emitted by the dipole μ that is reflected from the planar surface and sent back to the origin r 0 of the dipole. This exercise can be performed in terms of Cartesian or cylindrical coordinates and dates back to 1909 when Arnold Sommerfeld calculated the radiation of a dipole antenna over lossy ground. In terms of the Fresnel reflection coefficients for s-polarization r s and p-polarization r p (Born & Wolf, Reference Born and Wolf1999) the result can be represented as (Novotny, Reference Novotny1997):

where k 1=ω0/c and  . The location of the molecule is r 0=(x 0, y 0, z 0) and its dipole moment is μ=(μx, μy, μz). We also assumed that Q i0=1 and that the planar surface is at z=0, that is z 0 is the molecule–surface separation. Equation (13) demonstrates that the spontaneous emission rate clearly depends on the orientation of the molecule's dipole moment. The enhancement for a molecule with a parallel orientation of the transition dipole moment will be smaller than for a perpendicular orientation. Based on the relation between the spontaneous emission rate and the rate of energy dissipation, the alterations in the electromagnetic environment, induced by a nearby interface on the quantum emitters, affect the normalized lifetime. Thus, these changes can be calculated by means of Eq. (13).
If we evaluate Eq. (13) as a function of distance z 0 we will observe oscillations in γ/γ0 due to phase variations of the reflected field E S at the position of the dipole. These oscillations are observed for separations z 0>λ, where λ=2πc/ω0 is the emission wavelength (Barnes, Reference Barnes1998). The behavior for shorter distances is dominated by non-propagating near-field components for which s z>1. In this regime, the ratio γ/γ0 can be strongly enhanced or suppressed, depending on the dielectric function ∊ of the material. Generally, one refers to the modification of the spontaneous emission rate due to variation of the inhomogeneous environment of a quantum emitter as radiative decay engineering (Lakowicz, Reference Lakowicz2005).
In the case of a dielectric surface, e.g. a glass slide, one observes only a weak, but noticeable change in the fluorescence emission rate due to the weak reflection of the fields at the surface. Despite this, the collection efficiency through the interface is considerably increased with respect to the situation of a free quantum emitter in a homogeneous environment. The radiation pattern of a dipole emitter placed above a dielectric interface is strongly modified relative to the radiation pattern of a dipole in free space. Most of the fluorescence photons are emitted in an angular range centered around the critical angle of TIR θc. The redirection of the radiation in the direction of the critical angle originates from the discontinuity of the refractive index at the interface. For small z 0<<λ, a considerable part of the emitted fluorescence is redirected toward angles beyond θc, the so-called forbidden-light region. This supercritical light arises only from the near-field interaction of the dipole and the surface. As a consequence of the localized nature of the near-field interaction, forbidden light is not generated for distances z 0>>λ. The strong distance dependence imposes a restriction on the detection volume near the interface (Enderlein et al. Reference Enderlein, Ruckstuhl and Seeger1999) and has led to the development of sensors for biological moieties, e.g. ligand–receptor systems, based on the principle of surface-induced forbidden light generation, generally referred to as supercritical angle microscopy (Ruckstuhl & Verdes, Reference Ruckstuhl and Verdes2004).
Much stronger variations of γ/γ0 are observed for molecules near metal surfaces. Metals are characterized by a negative dielectric constant and thus, by a high reflectivity at optical frequencies. The origin for this property is based on the interaction of the electromagnetic radiation with the free conduction electrons in the metal. The higher reflectivity of the metal surface not only influences the decay rate γ but also the excitation rate γexc (cf. Eq. 5). Interference of the excitation field E 0 with its reflected field E S generates a standing wave, which provides high axial selectivity. Fluorescence interference contrast microscopy uses this effect to determine the distance of moieties to a substrate with nanometer accuracy (Braun & Fromherz, Reference Braun and Fromherz1998; Moiseev et al. Reference Moiseev, Ünlü, Swan, Goldberg and Cantor2006). The higher reflectivity also accounts for a stronger influence on the decay rate of the molecule, due to the interaction of the molecule with its own reflected field E scatt. This can lead either to an enhancement or an inhibition of the spontaneous emission rate. ‘Mirror substrates’ find application in biosensors to increase the detection sensitivity to traces of surface bound biomolecules, which are recognized via fluorescence emission. The generally observed enhancement of the fluorescence signal in the presence of metal surfaces is of the order of 10. Recently, it has been shown that Ag-coated slides combined with standard epi-fluorescence detection can lead to fluorescence enhancement even on micrometer thick cells. In this case, the fluorescence enhancement originates mostly from an increased excitation rate and detection efficiency, yielding an average signal enhancement of ~4 (Moal et al. Reference Moal, Fort, Leveque-Fort, Cordelieres, Fontaine-Aupart and Ricolleau2007).
Metal surfaces yield much stronger fluorescence enhancement than dielectric surfaces. The major difference between dielectric and metal surfaces is observed in the near-field regime, where the interaction between molecule and surface is dominated by evanescent waves. The near-field interaction can increase the molecule's decay rate for both dielectric and metal surfaces. But for very short distances z 0, the lossy nature of metals causes the non-radiative decay rate to diverge. In this limit, the molecule's excitation energy is entirely dissipated to heat and the fluorescence is quenched. However, the non-radiative decay can be mediated by the excitation of guided and surface modes (Lukosz & Kunz, Reference Lukosz and Kunz1977a; Lukosz & Kunz, Reference Lukosz and Kunz1977b; Pockrand et al. Reference Pockrand, Brillante and Möbius1994), and by structuring the metal surface, the energy associated with these modes can be redirected, which improves the overall fluorescence efficiency of the molecule. The excitation of plasmon polaritons in metals opens up new strategies to control the light–matter interaction on the nanometer scale. The properties of plasmons in thin films and corrugated surfaces are the subject of the next section. Their benefits to sensing, diagnostic, and imaging applications will be discussed in detail.
4. Interaction of light with metals
As shown above, the fluorescence rate of a molecule is influenced by the excitation rate γexc and by the spontaneous decay rate γ. The latter is the sum of radiative decay rate γr and the non-radiative decay rate γnr. The different processes depend critically on the properties of the local environment, such as the geometry and material composition of structures placed nearby. In this section, we review the electromagnetic properties of metals in the optical frequency regime in order to understand how they can be employed to control molecular fluorescence.
4.1 Optical properties of metals
In the optical frequency regime, most metals behave like a plasma, that is, incident radiation primarily interacts with the free conduction electrons. However, there are also negligible interband transitions associated with bound electrons. The latter are responsible for the particular color of metals, for example, the yellowish appearance of gold. Since interband transitions lead to enhanced absorption, it is desirable to operate at frequencies where the light–metal interaction is dominated by the free electrons and where the optical response is described by the Drude–Sommerfeld theory (Ashcroft & Mermin, Reference Ashcroft and Mermin1976). In this model, the incident electromagnetic field causes an oscillation of the free electrons that is 180° out-of-phase with respect to the incident electromagnetic field. The theory yields the following expression for the dielectric function of the metal

Here, ωp denotes the plasma frequency of the metal and &Ggr; is the damping rate, which is defined by the Fermi velocity v F and the mean-free path of the electrons l as &Ggr;=v F/l. As a consequence of the negative dielectric constant, metals exhibit a strong imaginary part of the refractive index, which results in their high reflectivity. Note that the plasma frequency is entirely defined by the electron density in the metal. It is often represented in terms of the plasma energy  , which is of the order of 9 eV for gold or silver.
4.2 Coupling to surface waves
The negative dielectric constant of metals allows for electromagnetic modes that are bound to the surface of the metal. These modes are referred to as SPPs, or surface plasmons for short. Surface plasmons are surface–charge–density oscillations coupled to the electromagnetic field. The latter is described by evanescent waves that decay exponentially in normal direction from the surface. While the decay length of the field into the metal is determined by the skin depth, which is of the order of 10 nm at optical frequencies, the field on the dielectric side penetrates up to a length of half a wavelength. For charges to accumulate at the interface, the electric field needs to be p-polarized, that is, there must be a driving force in the direction of the surface normal. SPPs are characterized by an in-plane propagation constant kx along the interface that is larger than the k vector in free space. Therefore, SPPs do not interact with free-propagating radiation. Instead they need to be excited by evanescent fields created by TIR or scattering at material structures. A straightforward calculation yields the following expression for the propagation constant

with kx denoting the in-plane wavevector and ∊d the dielectric function of the dielectric material that forms the interface with the metal.
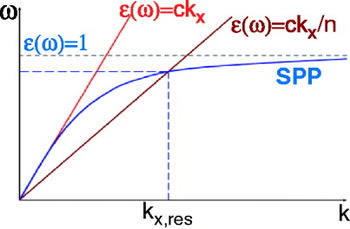
Due to the imaginary part of ∊m, the propagation distance of SPPs is limited. The finite propagation length is accounted for by an imaginary part of kx. Combining Eqs. (14) and (15) we obtain the dispersion curve shown in Fig. 4. The curve represents the real part of k x as a function of the frequency ω. We see that for a given frequency ω, the momentum of the surface plasmon (ħkx) is larger than the momentum of a free-propagating photon in the dielectric ( ). Therefore, surface plasmons cannot couple to propagating optical radiation and remain bound to the metal surface (Räther, Reference Räther1988). As will be discussed in the following, optical near-fields bound to quantum emitters, scattering particles, or optical antennas, possess the necessary momenta to couple to surface plasmons.
Dispersion relation of SPPs shown together with the light line in free-space and in a medium with refractive index n.

The power dissipated by a quantum emitter placed near a metal surface as a function of the normalized in-plane k-vector (u=k x/k d) can be analyzed (Barnes, Reference Barnes1998). Three distinct regimes can be identified: the regime of far-field radiation, near-field coupling, and coupling to surface plasmons as described by Eq. (15). Far-field radiation corresponds to the conversion of the emitter's energy to free-propagating radiation. In the regime of near-field coupling between emitter and metal, the energy bound to the emitter is mostly dissipated to heat and leads to fluorescence quenching. The relative ratio of these competing decay channels depends significantly on the emitter–metal separation. For distances smaller than 200 nm the excitation of SPPs, indicated by a resonance peak, becomes the prevailing process, whereas for even smaller distances the relaxation of the quantum emitter is rapidly dominated by local heating of the metal. The maximum emitter–metal coupling takes place for separations of ~20 nm.
Note that our considerations only take into account the bulk dielectric properties of the metal. Since the penetration depth of the electric field in the metal is of the order of 10 nm and more, interface effects can be neglected. In the case of thin interfaces, with dimensions comparable to the electron mean-free path, additional losses have to be considered.
4.3 Coupling to waveguide modes
A quantum emitter placed near a layered medium can additionally couple to waveguide modes. As in the case of SPPs, waveguide modes are resonant optical modes of the system that have propagation constants larger than the wavevector in the dipole's medium (u>1). Therefore, the emitter–waveguide coupling is mediated by evanescent fields, that is, by energy localized to the emitter. The contribution of competing non-radiative relaxation processes depends critically on the dimension of the waveguide. Variations in the width of the waveguide are correlated to the cut-off of the existing waveguide modes. These cut-offs lead to discontinuities in the power of the forbidden light, as soon as a waveguide mode becomes propagating and energy is coupled into the waveguide (Barnes, Reference Barnes1998). In addition, the coupling strength to different supported modes of the waveguide varies with the orientation of the emitting dipole. Waveguide modes can impact the radiation properties in the presence of spacer layers on a metal substrate, which often are introduced into a system to control the dipole–surface distance, e.g. Langmuir–Blodgett films, or when embedding quantum emitters in polymer matrices to control their dipole orientation or photophysical properties, e.g. fluorescence blinking or bleaching.
4.4 Conversion of non-propagating modes to far-field radiation
The fluorescence efficiency of a quantum emitter can be increased if it is coupled to structured metal surfaces. In order for this process to happen, the near-field energy (u>1) coupled to the metal has to be converted into propagating radiation, that is, the non-radiative decay rate needs to be made radiative. In the following, we will discuss strategies for improving the sensitivity in fluorescence spectroscopy and microscopy by increasing the radiative emission rate.
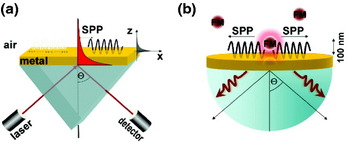
As pointed out before, free-propagating radiation cannot couple to surface plasmons because of a momentum mismatch. It is therefore necessary to modify the configuration and move away from the single interface geometry. The simplest approach is to introduce a second interface, a strategy that underlies the famous Otto and Kretschmann configurations (cf. Fig. 5a). In the Kretschmann configuration, the metal is in the form of a thin film featuring two interfaces. One of the two interfaces supports a surface plasmon with wavevector defined by Eq. (15). The other interface is bordered by a medium with a dielectric constant ∊n that is larger than ∊d. Under these circumstances, it is possible to excite a SPP with a plane wave incident from the medium with ∊n at an angle Θsp from the surface normal. Θsp is generally referred to as the Kretschmann angle. A change of the dielectric constant ∊d, for example due to molecular binding to the surface, will affect the surface plasmon propagation constant (cf. Eq. 15), which in turn will shift the Kretschmann angle. Thus, the angle Θsp can be used to monitor molecular processes at the metal surface. The high sensitivity of this technique has led to the development of multifold sensors for the detection of biomolecular binding assays, reaching submonolayer accuracy (Liedberg et al. Reference Liedberg, Nylander and Lundstrom1983; Homola et al. Reference Homola, Yee and Gauglitz1999; Hanken et al. Reference Hanken, Jordan, Frey and Corn1998; Ivarsson & Malmqvist, Reference Ivarsson, Malmqvist, Gizeli and Lowe2002; Cooper, Reference Cooper2002). The high sensitivity originates from the fact that the electromagnetic field associated with SPPs is strongly enhanced at the metal interface.
Excitation of SPP: (a) Kretschmann configuration and (b) coupling of an excited fluorescent molecule to a SPP mode.

The possibility of being able to excite a SPP on a metal film by free-propagating radiation implies that an excited surface plasmon must also decay by emitting radiation, a consequence of the principle of reciprocity. This radiation is referred to as ‘leakage radiation’ and is used to optically study surface plasmon propagation on metal films. Leakage radiation has implications for spontaneous decay of a quantum emitter near a metal film: surface plasmons excited by the emitter will now partially decay by emitting radiation (Weber & Eagen, Reference Weber and Eagen1979; Calander, Reference Calander2004). Thus, a non-radiative decay channel is turned into a radiative decay channel, which boosts the emitted fluorescence intensity. As shown in Fig. 5b, a molecule near a metal film supported by a glass substrate emits its fluorescence into a narrow angular range centered at the Kretschmann angle Θsp. As Θsp depends on the wavelength of the emitted radiation, the fluorescence spectrum of the molecule will appear spatially dispersed. The wavelength dependence of the angular spectrum provides a high spectral sensitivity. A metal film is a prototype structure for the conversion of non-propagating modes to far-field radiation and the same principle holds for more complicated configurations. By structuring the metal film, it is possible to enhance the fluorescence rate by orders of magnitude.
4.5 Applications
Surface-plasmon-mediated signal enhancement has led to the introduction of surface plasmon fluorescence spectroscopy (SPFS; Liebermann & Knoll, Reference Liebermann and Knoll2000). One of the benefits of SPFS lies in its reduced axial excitation volume due to the evanescent nature of SPPs. SPFS is well suited for studying biochemical processes near the surface of the metal. Morigaki & Tawa (Reference Morigaki and Tawa2006) investigated the process of vesicle fusion by means of SPFS. By combined measurements of the SPFS signal and the surface plasmon angle, they were able to track the initial absorption of vesicles, the onset of rupture of the vesicles, and the transition to planar bilayers. The high sensitivity of SPFS has been demonstrated by the detection of femtomolar traces of PCR fragments (Yao et al. Reference Yao, Kim, Scholz, Nielsen, Sinner and Knoll2004) and single molecule imaging of fluorescence dyes attached to proteins (Yokota et al. Reference Yokota, Saito and Yanagida1998). Enhanced fluorescence from the interaction of quantum emitters with planar metal interfaces benefits mostly from the surface selectivity and the spectral sensitivity of the radiation from the recovered energy of induced surface and guided modes.
As pointed out before, the spontaneous decay of an excited quantum emitter involves radiative and non-radiative decay channels. As the high density of electromagnetic states ρ is associated with SPP modes or waveguide modes, a quantum emitter couples a significant portion of its energy to these modes. Conversion of these modes to free-propagating radiation not only enhances the overall fluorescence rate but can also significantly enhance the quantum yield of emitters with low intrinsic quantum yield. As discussed by Kuhn (Reference Kuhn1970), the presence of interfaces has also an impact on the photostability of quantum emitters. As a consequence of the large density of electromagnetic states near a metal surface, the decay rate of an excited molecule is increased and its excited-state lifetime is reduced. Competing chemical processes that involve the excited state are therefore reduced.
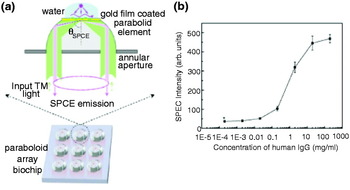
SPP coupled emission (SPCE) has outstanding capabilities for reducing auto-fluorescence in fluorescence microscopy. The autofluorescence background is often the limiting factor for the detection sensitivity in fluorescence-based analysis. The autofluorescence suppression is due to k-vector filtering by surface plasmons, that is, fluorescence at the Kretschmann angle originates only from molecules in the vicinity of the metal surface. SPP coupled fluorescence emission is strongly distance dependent and provides even higher surface selectivity than common TIR schemes. The surface selectivity can be further improved if the molecules are excited by laser radiation incident from the Kretschmann angle Θsp. The sensitivity of this dual-path configuration reaches down to the single molecule level (Stefani et al. Reference Stefani, Vasilev, Bocchio, Stoyanova and Kreiter2005). SPP enhanced TIR fluorescence (TIRF) microscopy has been applied for in situ studies of proteins and muscle fibers (Borejdo et al. Reference Borejdo, Gryczynski, Calander, Muthu and Gryczynski2006; Burghardt et al. Reference Burghardt, Charlesworth, Halstead, Tarara and Ajtai2006) as well as for live cell imaging (He et al. Reference He, Chang, Wu, Lin, Chiu, Su and Chen2006). An interesting aspect of surface plasmon-mediated emission is its distance dependence. SPCE is most efficient for molecules positioned at a distance of 10–100 nm above the metal surface, with the highest sensitivity at ~20 nm (Ray et al. Reference Ray, Szmacinski, Enderlein and Lakowicz2004). Combined with its high directional and spectral selectivity, surface-plasmon-mediated emission is very attractive for bioassays, since it also provides the potential for high throughput analysis of biomolecular interaction. Matveeva et al. (Reference Matveeva, Gryczynski, Malicka, Lukomska, Makowiec, Berndt, Lakowicz and Gryczynski2005) demonstrated the sensitivity of SPCE-based immunoassays in optically dense fluids such as blood. Recently, a human IgG immunoassay has been developed on a gold-coated, parabolic-array biochip. Figure 6 illustrates the principle of this approach (Yuk et al. Reference Yuk, Trnavsky, McDonagh and MacCraith2010). The device combines the advantages of the highly directional surface-plasmon-mediated emission profile and enhanced surface plasmon excitation with the high light-collection efficiency achieved using supercritical angle fluorescence (SAF). Due to the increased signal-to-noise ratio of this technique, a detection limit of 20 ng/ml has been reached. Surface enhanced fluorescence emission can also be applied for studying binding kinetics. For instance Liu et al. demonstrated the feasibility of light harvesting complex (LHC) binding to metal surfaces via incorporated histidine residues (Liu et al. Reference Liu, Lauterbach, Paulsen and Knoll2008) and energy transfer measurements in LHCs (Lauterbach et al. Reference Lauterbach, Liu, Knoll and Paulsen2010).
Surface-plasmon-mediated parabolic array sensor chip based on SAF detection. (a) Schematic representation of a single biosensor element for the detection of human IgGs based on SAF. (b) SAF sensitivty of the IgG sensor. From [Yuk et al. Reference Yuk, Trnavsky, McDonagh and MacCraith2010], reprinted with the permission of Elsevier B. V.

5. Structured metal surfaces
Instead of using a reverse Kretschmann configuration to recover the energy associated with non-radiative decay, we can also break the translational symmetry of the planar interface. This can be achieved by structured planar surfaces, such as periodic arrays of nano-objects, or gratings. Scattering of the non-propagating modes from surface structures couples localized modes to radiation. The additional reciprocal lattice vector required for momentum matching is provided by the surface corrugation and is related to the periodicity by k′x=k x±n2π/a with 2π/a denoting the Bragg wavevector and n being an integer. The excitation of the quantum emitter can be accomplished by direct illumination or through evanescent coupling (Knoll et al. Reference Knoll, Philpott and Swalen1981). Grating-based recovery of the energy transferred non-radiatively to the metal interface is exploited in thin-film applications, such as hybridization reactions, as well as in multilayer systems and live-cell imaging applications (Sullivan et al. Reference Sullivan, King, Sigg and Hall1994; Kim et al. Reference Kim, Kim, Cho, Suh, Huh and Kim2009a).
It has also been shown that the fluorescence rate of molecules near a metal film can be enhanced more than an order of magnitude if the SPP wavevectors on both sides of the metal interface are brought into resonance (Krishnan et al. Reference Krishnan, Thio and Kim2001). Note that the fluorescence rate of molecules near corrugated surfaces is not only enhanced by surface plasmon scattering but also by a modification of the radiative decay rate and fluorescence lifetime (Andrew & Barnes, Reference Andrew and Barnes2001). It has been demonstrated that the fluorescence emission from a corrugated metal surface can be about 50 times stronger than for a smooth planar surface (Wedge & Barnes, Reference Wedge and Barnes2004). Since the density of states of a periodically structured surface is different from a planar substrate, interfaces can be intentionally designed to support only specific modes and to block others. The band structure of periodical structures can be characterized by gaps corresponding to the formation of stationary waves when the period of the structure corresponds to half the effective wavelength of the mode (Barnes et al. Reference Barnes, Preist, Kitson and Sambles1996). Within the bandgap, the mode density will be zero, whereas at its edges the mode density will be high and thus, correlated to a large field enhancement. In summary, metals can be used as platforms for photonic bandgap materials, and to provide strong field enhancements due to the generation of localized modes near subwavelength features.
The prospect of structured metal surfaces lies in their ability to locally confine light in all directions, to provide large absorption cross sections, and to generate enhanced local electromagnetic fields (Barnes et al. Reference Barnes, Dereux and Ebbesen2003). Although these aspects are also relevant for planar interfaces, they become more important for rough metal films as well as for periodically structured surfaces and isolated nano-objects due to enhanced scattering of excited SPPs and strong localization of SPP modes (John, Reference John1990; Bozhevolnyi et al. Reference Bozhevolnyi, Volkov and Leosson2002). The strong field enhancements give rise to increased fluorescence rates for fluorophores deposited on the structured surfaces (Biteen et al. Reference Biteen, Pacifici, Lewis and Atwater2005). Moreover, periodic structures and arrays of isolated nanoparticles enable tuning of optical properties over a wide range. While light confinement at planar interfaces can be achieved only in one dimension, i.e. perpendicular to the metal interface, structured metal surfaces can achieve a nanoscopic three-dimensional confinement. In the following we focus on tiny nanoholes in planar metal surfaces, which are characterized by a number of interesting physical properties, such as extraordinary transmission, spectral sensitivity, nanoscopic light confinement, and localization as well as electromagnetic field enhancements (Ebbesen et al. Reference Ebbesen, Lezec, Ghaemi, Thio and Wolff1998; Genet & Ebbesen, Reference Genet and Ebbesen2007). We will first outline the principles and then present applications, where single holes and hole arrays are used for biosensing.
5.1 Light transmission through sub-wavelength holes
The transmission of light through holes and slits in opaque screens is typically described using different limits of diffraction theory. For example, for holes that are larger than the wavelength of light λ we commonly use Fraunhofer diffraction, which assumes that the field in the hole can be approximated by the incident field. However, this approximation fails once the hole size becomes smaller than λ because the rims of the hole significantly alter the incident field. The problem of light transmission through a subwavelength-sized hole was first tackled by Bethe (Bethe, Reference Bethe1944) who derived the following expression for the power transmission through a hole of radius R:

This shows that the transmission decreases as (R/λ)4, which amounts to an attenuation of four orders of magnitude for a hole of size λ/10. The transmission decreases further if the finite thickness of the metal film is taken into account. The hole must then be treated as a hollow metal waveguide of finite length. Such a waveguide has a propagation cut-off for radii R≈λ/4. For smaller R, the light throughput decreases exponentially. Thus, a sub-wavelength hole in a thick opaque metal screen must be treated as a truncated waveguide supporting an exponentially decaying field. The finite length of the waveguide leads to interferences between the in-coupled field and the field reflected from the back surface. These interferences will affect the fluorescence of a molecule placed above or inside the hole, respectively (Degiron et al. Reference Degiron, Lezec, Yamamoto and Ebbesen2004). Fluorescence lifetime measurements of a molecule placed in the cylindrical waveguide reveal a strongly reduced lifetime of the excited state, indicating an increase in the spontaneous emission rate and reduced quenching rates (Rigneault et al. Reference Rigneault, Capoulade, Dintinger, Wenger, Bonod, Popov, Ebbesen and Lenne2005a). In addition, the molecule will experience an increased excitation rate. Both effects will contribute to significant fluorescence enhancement (Popov et al. Reference Popov, Neviere and Bonod2005).
The field distribution at the surfaces of the film depends on the particular geometry, e.g. shape, symmetry, and aspect ratio of holes. Modifications of these parameters can have wide impact on the in-plane propagation properties and scattering cross sections of the surface plasmons (Degiron & Ebbesen, Reference Degiron and Ebbesen2004; Martín-Moreno et al. Reference Martín-Moreno, García-Vidal, Lezec, Degiron and Ebbesen2003; García-Vidal et al. Reference García-Vidal, Lezec, Ebbesen and Martín-Moreno2003a, Reference García-Vidal, Martín-Moreno, Lezec and Ebbesenb; Liu et al. Reference Liu, Mahdavi and Blair2005; Yu et al. Reference Yu, Lin, Chen, Chang, Huang, Liaw, Yeh, Liu, Yeh and Lee2005; Ishi et al. Reference Ishi, Fujikata and Ohashi2005). Thus, these alterations can cause changes in the field enhancement and transmission properties. Further modifications of the direct environment of the hole, e.g. nanostructures fabricated around the hole or coupling with neighboring holes, can improve light transmission and light beaming (Lezec et al. Reference Lezec, Degiron, Devaux, Linke, Martin-Moreno, Garcia-Vidal and Ebbesen2002). In the case of periodic hole arrays, the coupling between holes leads to extraordinary transmission. One of the origins of extraordinary light transmission is the generation of evanescent field components by incident light scattering at the periodic hole array. These evanescent waves possess the necessary imaginary wave vectors to efficiently couple to the waveguide modes of the holes. In addition to evanescent wave generation and enhanced coupling, there are three other effects involved: firstly, coupling to SPP modes at the irradiated metal surface; secondly, direct transmission of light through the hole followed by coupling to SPPs on the back surface; and thirdly, the interference of these effects. The transmission spectrum through the hole array features maxima and minima, related to constructive and destructive interferences (Degiron & Ebbesen, Reference Degiron and Ebbesen2005). For resonant excitation conditions, i.e. maximum transmission through the hole array, a significant fluorescence enhancement is observed for molecules placed near the holes. The fluorescence enhancement also implies an improved detection sensitivity.
5.2 Applications
The fact that holes and hole arrays in metal films can provide large electromagnetic field enhancements, extraordinary transmission, and a high sensitivity for changes in the refractive index, has motivated their use in high affinity sensing applications, clinical diagnostics, drug screenings, and also for single molecule detection. Progress in the development of these sensor platforms is also driven by combining such structures with lab-on-chip devices. The strong fluorescence enhancement makes it possible to reduce the detection volume without compromising the signal strength, thereby improving signal-to-background discrimination. Reduced observation volumes are of key importance in biological studies, since physiological conditions imply concentrations of biomolecules in the micromolar to millimolar range. The observation volume provided by confocal microscopes is diffraction limited to ~0·2 μm3, which corresponds to >105 molecules in the observation volume. To reduce this number to only a few molecules, one would need to decrease the analyte concentration into the sub-nanomolar range, and thus below relevant physiological concentrations in living cells. Thus, a reduction of the observation volume is key for studying biochemical processes under physiological conditions and on the single molecule level.
To date, the reduced observation volume achieved with milled-hole arrays has primarily been utilized for improving the detection sensitivity of FCS (Levene et al. Reference Levene, Korlach, Turner, Foquet, Craighead and Webb2003; Samiee et al. Reference Samiee, Foquet, Guo, Cox and Craighead2005, Reference Samiee, Moran-Mirabal, Cheung and Craighead2006; Rigneault et al. Reference Rigneault, Lemarchand and Sentenac2005b; Leutenegger et al. Reference Leutenegger, Gösch, Perentes, Hoffmann, Martin and Lasser2006; Wenger et al. Reference Wenger, Conchonaud, Dintinger, Wawrezinieck, Ebbesen, Rigneault, Marguet and Lenne2007; Wenger et al. Reference Wenger, Gérard, Lenne, Rigneault, Dintinger, Ebbesen, Boned, Conchonaud and Marguet2006a, Reference Wenger, Rigneault, Dintinger, Marguet and Lenneb; Bacia et al. Reference Bacia, Kim and Schwille2006; Eid et al. Reference Eid, Fehr, Gray, Luong, Lyle, Otto, Peluso, Rank, Baybayan, Bettman, Bibillo, Bjornson, Chaudhurim, Christians, Cicero, Clark, Dalal, de Winter, Dixon, Foquet, Gaertner, Hardenbol, Heiner, Hester, Holden, Kearns, Kong, Kuse, Lacroix, Lin, Lundquist, Ma, Marks, Maxham, Murphy, Park, Pham, Phillips, Roy, Sebra, Shen, Sorenson, Tomaney, Travers, Trulson, Vieceli, Wegener, Wu, Yang, Zaccarin, Zhao, Zhong, Korlach and Turner2009). Levene et al. introduced the concept of zero-mode waveguides for studying the activity of DNA polymerases. A zero-mode waveguide is a hole whose radius is below cut-off, that is, the field in the hole decays exponentially (Levene et al. Reference Levene, Korlach, Turner, Foquet, Craighead and Webb2003) and defines a zeptoliter detection volume.
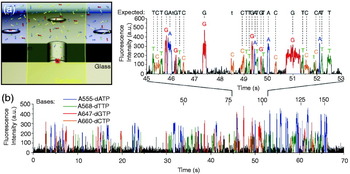
Recently, Eid et al. have demonstrated the potential of zero-mode waveguides for real-time multiplexed sequencing of DNA following the Sanger method, which uses DNA polymerase to incorporate nucleotides into a DNA strand (Eid et al. Reference Eid, Fehr, Gray, Luong, Lyle, Otto, Peluso, Rank, Baybayan, Bettman, Bibillo, Bjornson, Chaudhurim, Christians, Cicero, Clark, Dalal, de Winter, Dixon, Foquet, Gaertner, Hardenbol, Heiner, Hester, Holden, Kearns, Kong, Kuse, Lacroix, Lin, Lundquist, Ma, Marks, Maxham, Murphy, Park, Pham, Phillips, Roy, Sebra, Shen, Sorenson, Tomaney, Travers, Trulson, Vieceli, Wegener, Wu, Yang, Zaccarin, Zhao, Zhong, Korlach and Turner2009). Since this method requires millimolar concentration levels of nucleotides, single molecule detection can be achieved only by strong confinement of the detection volume. Discrimination of multiple nucleotides is achieved by fluorescence labeling with spectrally distinct dye molecules. Figure 7a schematically outlines the principle of this approach: a single DNA polymerase is immobilized at the bottom of a hole milled into an aluminum film supported by a silica substrate. Illumination of the hole from the silica side yields a zeptoliter observation volume and makes it possible to track individual fluorescently labeled nucleotides. Binding of the base-paired phospho-linked nucleotide at the polymerase active site results in a strong fluorescence signal. After cleavage of the phospho-linked dye from the incoporated nucleotide by phosphodiester bond formation catalyzed by the polymerase, the released dye molecule diffuses rapidly out of the detection volume (cf. Fig. 7b). Thus, sequencing of DNA is accomplished by analysis of the resulting pulse trains of spectroscopically distinguishable fluorescence signals (cf. Fig. 7c). In addition to sequencing, the real-time observation makes it possible to study enzymatic kinetics. Sequencing accuracies of up to 99·3% have been reported. Nevertheless, fluorescence enhancement and detection efficiency of molecules in metal film holes are limited by fluorescence quenching, metal photoluminescence, and non-specific biochemical binding. Note that zeptoliter observation volumes are also achieved with aperture-probe near-field microscopy (Herrmann et al. Reference Herrmann, Neuberth, Wissler, Perez, Gradl and Naber2009).
Real-time DNA sequencing from single polymerase molecules. (a) Schematic outline of the principle of zero-order waveguides for sensitive fluorescence signal detection in confined detection volumes. Implementation of dye-labeled nucleotides at the active site of the polymerase followed by cleavage of the tag and its subsequent diffusion out of the detection volume causes strong fluorescence signal bursts. (b) Typical fluorescence time trajectory of nucleotide-specific tags tracks the dynamics upon nucleotide binding and rapid diffusion of the cleaved dye molecule. From Eid et al. (Reference Eid, Fehr, Gray, Luong, Lyle, Otto, Peluso, Rank, Baybayan, Bettman, Bibillo, Bjornson, Chaudhurim, Christians, Cicero, Clark, Dalal, de Winter, Dixon, Foquet, Gaertner, Hardenbol, Heiner, Hester, Holden, Kearns, Kong, Kuse, Lacroix, Lin, Lundquist, Ma, Marks, Maxham, Murphy, Park, Pham, Phillips, Roy, Sebra, Shen, Sorenson, Tomaney, Travers, Trulson, Vieceli, Wegener, Wu, Yang, Zaccarin, Zhao, Zhong, Korlach and Turner2009) reprinted with the permission of American Association for the Advancement of Science.

6. Localized surface plasmons
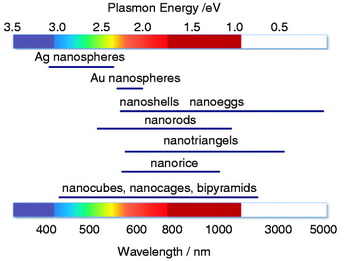
Surface plasmons are not restricted to plane interfaces. They are supported by any metal structure in a dielectric environment. However, the mode structure and the resonances depend on the particular geometry and material (see Fig. 8). The large field enhancements supported by nanoscale metal structures, such as nanoholes, nanoparticles, and arrangements thereof, are being explored for detection, light emission, and spectroscopy. Advances in chemical synthesis and advanced nanofabrication, such as focused ion-beam (FIB) milling and electron beam (e-beam) lithography make it possible to control and fabricate nanoscale structures with high accuracy and reproducibility, and to tune their resonances over the visible and near-infrared (NIR) spectral range. In the following, we will discuss localized plasmon resonances of `model’ nanoparticles, such as spheres and rods. We will highlight various applications, including sensing, imaging, and spectroscopy.
Spectral dependence of the plasmon resonance of differently shaped nanoparticles.

6.1 Optical properties of spherical nanoparticles
Localized surface plasmons can be described entirely by classical electrodynamics. The scattering of a plane wave at a spherical particle has been described by Gustav Mie in the early 20th century, in terms of multipole modes composed of spherical harmonics and Bessel functions. The scattering spectrum features distinct resonances, which are commonly referred to as Mie resonances (Bohren & Huffmann, Reference Bohren and Huffmann1983). For particles much smaller than the wavelength λ and smaller than the skin depth d S, it is legitimate to invoke the quasi-static approximation, in which the Helmholtz equation reduces to the Laplace equation. In the quasi-static limit, there is no retardation and the electromagnetic response of nanoparticles is dominated by the dipolar mode. For a particle described by a free-electron gas, the dipolar mode corresponds to a collective oscillation of the electron gas relative to the stationary ion lattice (cf. Fig. 9) (Kreibig & Vollmer, Reference Kreibig and Vollmer1995; Kelly et al. Reference Kelly, Coronado, Zhao and Schatz2003).
Interaction of light with a metal nanoparticle leads to absorption and scattering of the incident radiation. Schematic representation of the induced surface charge oscillations by an external light field and possible spectroscopic responses for sensitive biomolecular detection.

In the dipolar limit, the incident field E 0 induces a dipole in the particle according to μ=αE 0, with α being the polarizability. Disregarding radiation reaction, that is, the interaction of the particle with its own field, the polarizability of a spherical particle is

where R denotes the particle radius, and ∊m and ∊d are the dielectric functions of metal particle and the surrounding medium, respectively. To take the contribution of radiation reaction into account, and to satisfy the optical theorem, we need to replace α by the effective polarizability

Here,  is the unit dyad. The first term is simply the quasi-static polarizability, whereas the second term accounts for radiation damping.
The field scattered by the particle can now be expressed in terms of the induced dipole as

where  is the dyadic Green's function and r 0 is the location of the particle. The total field at a position r is E=E 0+E S. The ratio of scattered ∝|E S|2 to incident intensity ∝|E 0|2 is referred to as the scattering cross-section σscatt and is calculated as
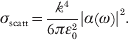
Here,  is the wavevector of the surrounding medium. Similarly, the absorption cross-section σabs is defined as the ratio of absorbed power to incident intensity and is given by

As α∝R 3, the scattering cross-section scales with R 6, whereas the absorption cross-section depends on R 3. Therefore, absorption dominates over scattering for small particles, whereas scattering dominates over absorption for large particles. Photothermal detection and imaging (Boyer et al. Reference Boyer, Tamarat, Maali, Lounis and Orrit2002), as well as photothermal cancer therapies (Huang et al. Reference Huang, El-Sayed, Qian and El-Sayed2003; Huang et al. Reference Huang, Jain, El-Sayed and El-Sayed2008b; El-Sayed et al. Reference El-Sayed, Huang and El-Sayed2006; O'Neal et al. Reference O'Neal, Hirsch, Halas, Payne and West2004; Loo et al. Reference Loo, Lowery, Halas, West and Drezek2005) make use of small nanoparticles. The dipolar SPR occurs at a frequency ωsp for which the denominator in the expression of α (Eq. 17) is minimized. Using Eq. (14) for the dielectric function of the metal particle and assuming that the damping constant &Ggr; is sufficiently small, we find
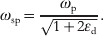
For particles in air (∊d=1) the SPR frequency is a factor  shorter than the plasma frequency. However, this calculation does not match experimental measurements. The reason is that the dielectric function in Eq. (14) does not account for interband transitions and one would need to add additional terms to Eq. (14) or use experimentally measured values for ∊m (Johnson & Christy, Reference Johnson and Christy1972) to be in accordance with experiments. Nevertheless, the result (22) demonstrates that the plasmon resonance red shifts if the dielectric constant of the surrounding medium (∊d) is increased, a property that is being exploited in biosensing and detection.
Under resonance conditions, surface plasmons in metal nanoparticles lead to light scattering that can be several orders of magnitude more intense than the fluorescence from efficient quantum emitters (Jain et al. Reference Jain, Lee, El-Sayed and El-Sayed2006). Typically, their brightness corresponds to an equivalent of up to one million dye molecules. Therefore, nanoparticles are employed as spectroscopic labels in sensing, imaging, and biomedical therapeutics (Yguerabide & Yguerabide, Reference Yguerabide and Yguerabide1998; Haes & Duyne, Reference Haes and Duyne2002; Haes et al. Reference Haes, Stuart, Nie and Duyne2004; El-Sayed et al. Reference El-Sayed, Huang and El-sayed2005). An additional advantage of metal nanoparticles is the absence of photobleaching and fluorescence blinking. On the other hand, metal nanoparticles are considerably larger than organic dye molecules (~10–100 nm in diameter), which poses limits with regard to labeling densities and translocation through biological membranes.
The plasmon resonance of non-spherical nanoparticles is no longer defined by ∊m(ω)+2∊d but by modified expressions. In general, the plasmon resonance of elongated particles is red-shifted with respect to the resonance of a spherical nanoparticle. The dependence of the plasmon resonance on parameters such as shape, size, material, dielectric function of the surrounding, and proximity to neighboring particles, enables precise tuning of the optical properties (Kreibig & Vollmer, Reference Kreibig and Vollmer1995; Kelly et al. Reference Kelly, Coronado, Zhao and Schatz2003; Jain et al. Reference Jain, Lee, El-Sayed and El-Sayed2006; Ghosh et al. Reference Ghosh, Nath, Kundu, Esumi and Pal2004; Rechberger et al. Reference Rechberger, Hohenau, Leitner, Krenn, Lamprecht and Aussenegg2003) and is being explored for biodiagnosis, biophysical studies, and medical therapy (Raschke et al. Reference Raschke, Kowarik, Franzl, Sönnichsen, Klar and Feldmann2003; Pierrat et al. Reference Pierrat, Hartinger, Faiss, Janshoff and Sönnichsen2009; Reinhard et al. Reference Reinhard, Sheikholeslami, Mastroianni, Alivisatos and Liphardt2007; Elghanian et al. Reference Elghanian, Storhoff, Mucic, Letsinger and Mirkin1997; Sokolov et al. Reference Sokolov, Follen, Aaron, Pavlova, Malpica, Lotan and Richards-Kortum2003; El-Sayed et al. Reference El-Sayed, Huang and El-sayed2005; Alivisatos, Reference Alivisatos2004; Haes & Duyne, Reference Haes and Duyne2002).
6.2 Spontaneous emission near metal nanoparticles
A spherical particle is a model system that allows for a quantitative comparison between theory and experiment (Bharadwaj & Novotny, Reference Bharadwaj and Novotny2007). It provides analytical results that reflect the dependence on parameters and strategies for optimization. In the following, we derive a theoretical model for spontaneous emission near a spherical metal nanoparticle and analyze the balance between radiative and non-radiative decay channels.
In section 2.3, we introduced expressions for the spontaneous decay rate γ (Eq. 8) and the density of states ρ (Eq. 9) of a two-level system based on the Green's function formalism. These expressions are valid for any environment and can be used for the special case of a quantum emitter near a spherical nanoparticle. In the dipolar approximation discussed in the previous section, the spherical particle can be treated as a dipole located at the center r m of the particle. The Green's function that specifies the field at r of a quantum emitter located at r 0 can then be expressed as (Novotny & Hecht, Reference Novotny and Hecht2006)

where  denotes the free-space Green's dyadic (absence of nanoparticle) and αeff the effective polarizability of the sphere. In terms of the Green's function, the field E emitted by the quantum emitter is given by
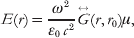
where μ is the emitter's dipole moment. To determine the total power P emitted to the far-field we can integrate |E|2 over a surface enclosing the quantum emitter and the particle. In the absence of the particle, the Green's function is given by  which, after inserting into Eq. (24), yields the field E 0 and the radiated power P 0. The normalized power P/P 0 is identical to the ratio of radiative decay rates γr/γr0. For small separations z between quantum emitter the particle surface, and for a dipole μ pointing in the direction of the particle center, one obtains (Bharadwaj et al. Reference Bharadwaj, Anger and Novotny2007)

Therefore, Eq. (25) is identical to the ratio  , where μm is the dipole induced in the metal particle. We find that the radiated power due to the particle's induced dipole scales with z −6. In addition, one has to consider an interference term arising from the coherence of the radiated fields of quantum emitter and particle. This interference term scales as z −3. For large particles, the radiative decay rate is dominated by the z −6 dependence (Chaumet et al. Reference Chaumet, Rahmani, de Fornel and Dufour1998).
A similar analysis can be carried out for the excitation rate enhancement γexc. Here, the field at the location of the dipole E(r 0) has a contribution due to the incident field and a contribution due to the field scattered by the particle. As reciprocity, the excitation rate enhancement turns out to be identical to the radiative decay enhancement (Bharadwaj et al. Reference Bharadwaj, Anger and Novotny2007)

This equivalence requires that the right-hand side and the left-hand side are evaluated at the same frequency. If the excitation frequency is different from the emission frequency we only need to substitute a different ω in Eq. (25). It is important to emphasize that the equivalence (26) holds only for the symmetry of a spherical nanoparticle and that it has to be corrected by the directivity for particles with a broken symmetry (Bharadwaj et al. Reference Bharadwaj, Deutsch and Novotny2009).
Having derived expressions for γexc and γr we now calculate the non-radiative decay rate γnr, the primary source of fluorescence quenching. According to Poynting's theorem, the rate of energy dissipation in the metal nanoparticle is  , where j is the induced polarization current and E is the local field. The integration runs over the particle volume. In the dipolar limit, j=−iωμδ(r−r 0). Furthermore, μ is an induced dipole moment, that is, μ=αE(r m), where E(r m) is calculated according Eq. (24). Assuming that the internal quantum yield is Q i0=1, and using P nr/P 0=γnr/γr0 we obtain the following expression for the normalized non-radiative decay rate

where k=ω/c. This equation is valid for very small separations between quantum emitter and particle (kr=1). For such small distances, the particle appears as a flat interface from the perspective of the quantum emitter, i.e. the particle curvature is not being noticed. This fact is represented by the term in the denominator, ∊m+∊d, which is characteristic for a plane interface (cf. Eq. (15)). This term is in difference to the denominator of the radiative decay rate in Eq. (25), that is ∊m+2∊d, which is characteristic for a spherical particle (cf. Eq. 17). The analytical results for the three rates, γr, γnr, and γexc, determine the fluorescence rate of a molecule near a metal nanoparticle (Eqs. 3 and 4). The expressions predict the dependence on material, emitter–particle separation, and frequency.
6.3 Fluorescence-based biosensing and bioimaging
According to the considerations in the previous section, fluorescence enhancement arises from an increased excitation rate due to an enhanced local field experienced by the fluorophore, and the electromagnetic coupling of the fluorophore with the near-by nanoparticle. These contributions are counter-balanced by energy losses due to non-radiative energy transfer to the metal nanostructure, which ultimately leads to dissipation to heat. The fluorophore–nanoparticle coupling opens up new strategies for biomolecular sensing and imaging of cellular structures. In the following, we will summarize recent applications.
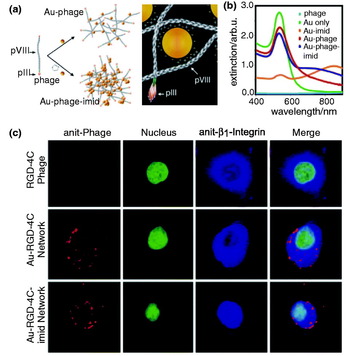
Networks of gold nanoparticles and bacteriophages have been used as biological sensors and cell-targeting agents because they preserve the biofunctional properties of the phage and the plasmonic properties of the gold particles, thereby enabling targeted cell detection (cf. Fig. 10). Souza et al. (Reference Souza, Christianson, Staquicini, Ozawa, Snyder, Sidman, Arap and Pasqualini2006) demonstrated that these networks can be applied for the investigation of ligand binding to cell surface receptors and also for receptor-mediated phage internalization in immunofluorescence-staining assays. The assembly of Au particles and phages is mediated by electrostatic charge interactions between the citrate-coated Au particles and the phage surface leading to imid formation (cf. Fig. 10a). These networks of Au-imid-phages are characterized by improved NIR absorption, as shown in Fig. 10b, and can be applied to visualizing different cellular structures. Specific targeting of these networks to the cell surface or innercellular structures can be achieved by modification of their fractal structure. Figure 10c shows confocal fluorescence images of KS1767 cells incubated with Au-nanoparticle-phage networks.
Biomolecular assemblies with engineered properties. (a) Principle of the assembly of the Au-particle-phage or Au-particle-imid-phage networks and illustration of the electrostatic interaction of the Au with the phage. The diameter of the Au spheres are ~40 nm, pVIII is the major capsid protein and pIII the minor capsid protein. (b) Light-absorption spectrum of purified and suspended Au-phage-imid and Au-phage demonstrating a large red shift of the extinction spectrum for the compact Au-imid-phage network solutions. (c) Confocal fluorescence images of KS1767 cells incubated with phage networks (i.e. RGD-4C, Au-RGD-4C and Au-RGD-4C-imid) and labeled with Cy3-tagged anti-fd bacteriophage. From Souza et al. 2006, reprinted with permission of the National Academy of Sciences.

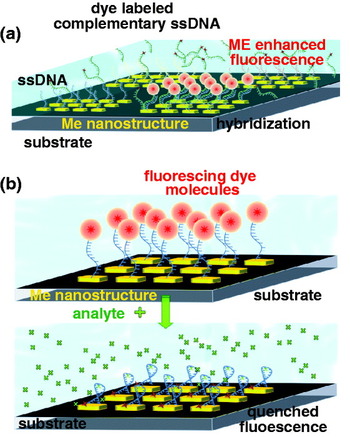
Similar to biosensors based on surface-plasmon coupled emission (SPCE) and plasmon-coupled fluorescence (PCF) near planar surfaces, nanoparticle-enhanced fluorescence can also be used for ultrasensitive detection of biomolecular interactions and binding reactions in various clinical antibody–antigen or nucleic acid immunofluorescence assays. In principle, two strategies are followed in this field, either by utilizing the strong signal enhancement upon specific binding of the analyte to the metal nanoparticle or by using fluorescence quenching as displayed in Fig. 11.
The enhanced readout signal generated by specific binding to the metal nanostructure can provide clear discrimination from the background signal of non-bound entities. This has been demonstrated by Lakowicz and co-workers for enzyme-linked immunosorbent assays (ELISA) based on silver island films (Szmacinski et al. Reference Szmacinski, Smith, Hanson, Kostov, Lakowicz and Rao2008). The high sensitivity of standard ELISA down to the sub-picomolar range, arises from multistep enzymatic amplification (Goldsby et al. Reference Goldsby, Kindt, Osborne and Kuby2003). Metal enhanced antibody–antigen assays can utilize the enhancement of the fluorescence signal, and also the excited-state lifetime reduction, for detecting molecular binding to the metal nanostructure. Based on intensity measurements, phase shifts and fluorescence modulation, the sensitivity of phase-modulation fluorometry has been increased by a factor of ~50, and has allowed protein concentrations to be determined over a large dynamic range (Ray et al. Reference Ray, Chowdhury, Zhang, Fu, Szmacinski, Nowaczyk and Lakowicz2009). A major advantage of this approach is that it does not require washing out of unbound analyte, and thus, clearly simplifies immunofluorescence assays. The higher signal levels also provide the potential for real-time monitoring of biomolecular interactions.
Similar strategies can be applied to generate signal enhancement for DNA-binding assays based on hybridization (Malicka et al. Reference Malicka, Gryczynski and Lakowicz2003; Oaewa et al. Reference Oaewa, Karoonuthaisirib and Surareungchaic2009) and for enzyme–substrate interactions, such as for enzymatic hydrolysis of organophosphate (OP) neurotoxins by OP hydrolase (OPH) (Simonian et al. Reference Simonian, Good, Wang and Wild2005). A surface-modified fluorescence assay has also been developed for the detection of prions based on the competitive binding of a fluorescent peptide to a nanoparticle-labeled prion-specific antibody. The prion-particle antibodies carry on average two to four 1·4 nm Au particles. Fluorescence modification upon binding of the peptide to the antibody yields information on recombinant prion proteins. The detection sensitivity has been pushed down to concentrations of only 2 nM (Henry, Reference Henry2004). Nanoparticle-enhanced FCS has been used for the detection of immune reactions of the α-fetoprotein (AFP) antigen and its antibody with a detection limit of 1·5 pM. It has enabled the determination of labeled AFP concentration in human serum samples (Tang et al. Reference Tang, Dong and Ren2010).
6.4 Modification of the radiative decay rate/quantum yield
In the previous section, we assumed that the intrinsic quantum yield Q i0 is one. As a consequence, the quantum yield cannot be enhanced and the only way to increase the fluorescence rate is by increasing the excitation rate through the local field. For Q i0≈1 situations, the spontaneous emission enhancement arises prevailingly from the excitation enhancement and yields at best a fluorescence enhancement of ~10 for a gold nanoparticle (Anger et al. Reference Anger, Bharadwaj and Novotny2006; Kühn et al. Reference Kühn, Hakanson, Rogobete and Sandoghdar2006). However, for molecules with low Q i0, we can enhance the quantum yield as
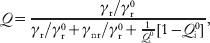
which follows from a straightforward decay rate analysis (Bharadwaj & Novotny, Reference Bharadwaj and Novotny2007). Thus, according to Eq. (3), the fluorescence rate can be increased by two channels, by enhancing the local excitation field and by enhancing the quantum yield (Wokaun et al. Reference Wokaun, Lutz, King, Wild and Ernst1983; Tam et al. Reference Tam, Goodrich, Johnson and Halas2007; Bharadwaj et al. Reference Bharadwaj, Deutsch and Novotny2009). This combined effect leads to much higher fluorescence enhancement factors, as demonstrated in experiments based on NIR dyes (Bardhan et al. Reference Bardhan, Grady, Cole, Joshi and Halas2009), fluorescent proteins (Fu et al. Reference Fu, Zhang and Lakowicz2008), and metallofullerenes (Bharadwaj & Novotny, Reference Bharadwaj and Novotny2010). Nevertheless, the different rates are strongly distance dependent and there is an optimum molecule–particle separation for which the fluorescence enhancement is at a maximum. Thus, the molecule–particle separation has to be controlled with nanometer accuracy, e.g. by implementation of molecular spacers.
6.4.1 NIR dyes
Many applications in medical diagnostics make use of the ability of light to penetrate deeply into biological tissue. For example, this is used for in vivo detection of imaging agents and for the detection of body fluids (Weissleder, Reference Weissleder2001). Typically, medical diagnostics is performed in the wavelength range of 700–900 nm – the so-called water window (Svoboda & Block, Reference Svoboda and Block1994), which demands for bright and stable biolabels emitting in the NIR spectral region. However, NIR fluorophores have a low quantum yield and also suffer from low photostability. This limits their applicability for tissue and cellular imaging. That is where the coupling to metal nanoparticles comes in: because of the low quantum yield of NIR dyes, a significant fluorescence rate enhancement can be achieved when they are coupled to metal nanostructures. Furthermore, the molecule–metal interaction reduces the photobleaching rate due to a decreased excited-state lifetime (Lakowicz, Reference Lakowicz2005). Thus, by engineering metal nanostructures with optimized plasmonic properties in the NIR, the sensitivity and stability of NIR quantum emitters can be significantly increased, which is key for diagnostic applications, such as identification of tumor cells and pathogens in biological tissue. Shifting the plasmon resonances to the NIR requires nanoparticles with elongated shapes, such as nanorods, or layered structures, such as nanoshells (Prodan et al. Reference Prodan, Radloff, Halas and Nordlander2003; Tam et al. Reference Tam, Goodrich, Johnson and Halas2007). By making use of the plasmonic enhancement of nanorods and nanoshells, Halas and co-workers have demonstrated that NIR dyes can be as efficient as organic dye molecules in the visible range (Bardhan et al. Reference Bardhan, Grady, Cole, Joshi and Halas2009; Tam et al. Reference Tam, Goodrich, Johnson and Halas2007). Recently, metal enhanced fluorescence has been applied in microfluidic chips to enhance the detection efficiency of NIR dye labels (Furtaw et al. Reference Furtaw, Lin, Wu and Anderson2009). Metal nanoparticles have also been employed in therapeutic applications, such as photothermal cancer therapy. The efficient and rapid heating of a nanoparticle makes it possible to selectively heat the local environment of a laser-irradiated nanoparticle. The local heating of biological tissue (hyperthermia) can cause cell damage, e.g. by protein denaturation (Huang et al. Reference Huang, Jain, El-Sayed and El-Sayed2008b). In addition, metal nanoparticles provide the ability to perform optical, magnetic, and therapeutic functionalities in parallel or in sequence (biomedical multiplexing). Combined with the possibility of carrier functionality, such as absorption and encapsulation of cargo, colloidal stability, and biocompartibility under physiological conditions, nanoparticles find wide application in high-sensitivity biomolecular and cellular imaging.
6.4.2 Naturally fluorescent proteins
The extinction coefficient of organic fluorophores in the visible spectral range is typically of the order of 100 000 M/cm2. Furthermore, these molecules have high quantum yields and undergo 106–108 excitation–emission cycles before irreversible photobleaching occurs. These properties allow them to be detected individually and is the reason for their wide use in biomolecular and cellular science. However, labeling of biological targets with fluorescent dyes is not always possible and it would be favorable if one could detect biomolecules by their intrinsic fluorescence. Unfortunately, such label-free detection is challenged by the weak extinction coefficients and low intrinsic quantum yields of most biomolecules. In addition, biomolecules often exhibit their strongest absorption in the UV.
Amino-acid residues of proteins with aromatic indol ring systems, such as phenylanaline, tyrosine, histidine, and tryptophan, are able to emit fluorescence. Although tryptophan residues are relatively rare in proteins, they have the highest quantum yield and have the strongest fluorescence emission. The absorption maximum is near 280 nm and the emission spreads over a spectral range of 300–350 nm. Tryptophan fluorescence depends strongly on the polarity of its direct environment. Metal nanostructures hold promise for improving the fluorescence yield of tryptophan containing proteins, e.g. bovine serum albumin (BSA), avidin, and others (Sun et al. Reference Sun, Wu, Ding, Zhao, Wang, Yang and Liu2009; Szmacinski et al. Reference Szmacinski, Ray and Lakowicz2009). Studies of the influence of Ag island films and Ag colloids on the fluorescence yield of BSA, which contains two tryptophan residues, clearly show that the presence of metal nanostructures leads to enhanced fluorescence emission and to increased photostability. Both effects are of great importance for the development of label-free biosensing applications. Improved fluorescence properties are expected also for the interaction of the GFP and other genetically encoded fluorescent proteins with metal surfaces. These classes of proteins mostly exhibit a weak intrinsic quantum yield and often suffer from rapid photobleaching. Thus, their detection sensitivity is rather limited especially, for low abundant protein samples. Genetic modification of the wild-type forms of these fluorescent proteins leads to improved fluorescence properties. Studies of GFP absorbed on Ag Island films showed moderate fluorescence enhancement and decreased excited-state lifetimes (Fu et al. Reference Fu, Zhang and Lakowicz2008).
Schematic representation of the two major strategies for the discrimination of binding restrictions in biosensors utilizing (a) metal enhanced fluorescence or (b) fluorescence quenching.

Quantum emitters are often embedded in an ensemble, such as in LHCs (Sanchez et al. Reference Sanchez, Novotny and Xie1999; Mackowski et al. Reference Mackowski, Wörmke, Maier, Brotosudarmo, Harutyunyan, Hartschuh, Govorov, Scheer and Bräuchle2008; Carmeli et al. Reference Carmeli, Lieberman, Kraversky, Fan, Govorov, Markovich and Richter2010; Nieder et al. Reference Nieder, Bittl and Brecht2010; Chowdhury et al. Reference Chowdhury, Ray, Aslan, Lakowicz and Geddes2007). These complexes operate as antennas that are composed of a large number of protein-embedded pigment molecules, e.g. chlorophyll or carotenoids. In a photosynthetic membrane, light is absorbed by these complexes over a broad spectral range, and is non-radiatively transferred to a reaction center. These LHCs have naturally a low quantum yield and define a model molecular system made of multiple fluorophores. Recently, Bujak et al. demonstrated plasmon-induced fluorescence enhancement by a factor of 6 for carotenoid-based LHCs, which absorb prevailingly in the spectral region from 450 to 550 nm (cf. Fig. 12) (Bujak et al. Reference Bujak, Pitkowski, Mackowski, Wörmke, Jung, Bräuchle, Agarwal, Kotov, Schulte, Hofmann, Brotosudarmo, Scheer, Govorov and Hiller2009). The silver island films and silver nanowires showed no influence on the fluorescence emission energy of the complex. Similar chlorophyll fluorescence enhancements have been observed for single LHCs interacting with gold nanoparticles at low temperatures. Maximum enhancement factors of 36 have been reported. In addition, significant changes in the excited-state lifetime and fluorescence emission spectrum were observed indicating altered energy transfer rates within the complexes (Nieder et al. Reference Nieder, Bittl and Brecht2010).
Plasmon enhanced fluorescence of LHCs. (a) Fluorescence spectra measured for the PCP complexes at ensemble concentrations on SIF (solid curve) and on glass (dashed curve) substrates. (b) Representative fluorescence spectra measured for single PCP complexes on SIF (solid curve) and on glass (dashed curve) substrates. (c) Representative transmission image obtained for PCP complexes mixed with Ag nanowires. (d) Fluorescence image of the same sample area as shown in (c). Modified from Bujak et al. (Reference Bujak, Pitkowski, Mackowski, Wörmke, Jung, Bräuchle, Agarwal, Kotov, Schulte, Hofmann, Brotosudarmo, Scheer, Govorov and Hiller2009) with the permission of the Polish Academy of Sciences.

6.5 Biosensing based on fluorescence quenching
FRET between molecules has proven to be a powerful tool in structural biology. For example, it is used for the identification of different protein-folding states and employed in sandwich immunoassays. Since FRET is restricted to interaction distances of the order of ~2–10 nm, the technique is mostly applied for intra-protein studies such as conformational changes. The detection of protein–protein interactions, e.g. antibody–antigen binding, turns out to be difficult. The distances involved in these binding assays are typically larger than the distances accessible by FRET. Larger energy transfer distances can be measured between molecules and metal nanoparticles, which is made possible by the large absorption cross-section of a nanoparticle near the plasmon resonance. Furthermore, energy transfer between a molecule and a metal nanoparticle can take place for any dipole orientation. Nanoparticle-mediated energy transfer is typically observed in terms of fluorescence quenching and is of interest for assays that involve distances larger than the distances accessible by FRET.
Figure 11b illustrates the capability of metal nanoparticles to quench the fluorescence emission of quantum emitters. Fluorescence quenching with gold nanoparticles of sizes less than 5 nm is approximately 100 times more efficient than fluorescence quenching with organic molecules. Quenching can be optimized by matching the emission spectrum of the fluorophore with the plasmon resonance of the particle, which can be accomplished by proper choice of particle geometry, size, and material.
Nanoparticle-mediated quenching has been employed in live cell investigations and in vivo studies for mRNA detection, transfection, drug screening, and protease activity determination (Rosi et al. Reference Rosi, Giljohann, Thaxton, Lytton-Jean, Han and Mirkin2006; Seferos et al. Reference Seferos, Giljohann, Hill, Prigodich and Mirkin2007; Tang et al. Reference Tang, Cao, Xu, Zhuo, Ge, Li and Yu2008; Lee et al. Reference Lee, Cha, Park, Lee, Hong, Sun, Kim, Choi, Kwon, Kim and Ahn2008; Kim et al. Reference Kim, Oh, Oh, Ko, Han and Kim2008; Oishi et al. Reference Oishi, Tamura, Nakamura and Nagasaki2009). In addition, a broad variety of in vitro biosensors has been developed based on this principle such as sandwich-immunosensors for medical diagnosis of clinical relevant proteins and hybridization biosensors for the detection of complementary DNAs, RNAs, and single base-pair mismatches in oligonucleotides (Dubertret et al. Reference Dubertret, Calame and Libchaber2001; Fan et al. Reference Fan, Wang, Hong, Bazan, Plaxco and Heeger2003; Oh et al. Reference Oh, Hong, Lee, Nam, Yoon and Kim2005; Sapsford et al. Reference Sapsford, Berti and Medintz2006; Ao et al. Reference Ao, Gao, Pan, He and Cui2006; Peng et al. Reference Peng, Chen, Jiang, Zhang, Shen and Yu2007; Cady et al. Reference Cady, Strickland and Batt2007; You et al. Reference You, Miranda, Gilder, Ghosh, Kim, Erdogan, Krovi, Bunz and Rotello2007; Wang et al. Reference Wang, Chen, Qian and Zhao2008; Gu et al. Reference Gu, Shen, Sun and Yan2008; Zheng et al. Reference Zheng, Seferos, Giljohann, Patel and Mirkin2009; Mayilo et al. Reference Mayilo, Kloster, Wunderlich, Lutich, Klar, Nichtl, Kürzinger, Stefani and Feldmann2009; Chhabra et al. Reference Chhabra, Sharma, Wang, Zou, Lin, Yan, Lindsay and Liu2009; Zhang et al. Reference Zhang, Wang, Zhang, Boey, Song and Fan2010). These biosensors are build up either in the form of activation or inhibition-based assays, and implement organic dye molecules, quantum dots, fluorescent particles, fluorescent polymers, molecular beacons, and others compounds as indicators. Activation or inhibition of the quenched state of these tags can be achieved by utilizing selective- or competitive-binding reactions to functional substrates (Kim et al. Reference Kim, Park, Oh, Oh and Kim2009b; Chen et al. Reference Chen, Cheng and Tseng2009), and by induced conformational changes of the target molecules (Maxwell et al. Reference Maxwell, Taylor and Nie2002; Wu et al. Reference Wu, Jiang, Fu, Shen and Yu2006; Mo et al. Reference Mo, Yang, Guo and Wen2007; Huang et al. Reference Huang, Chiu, Huang and Chang2007; Wang et al. Reference Wang, Chen, Qian and Zhao2008; Jin et al. Reference Jin, Li and Bai2009).
For instance, activation of the fluorescence emission requires to unlock the initially quenched state and can be accomplished by the release of either quantum emitter or nanoparticle. In cysteine sensors, the activation is initiated by a competitive-binding reaction of thiols (Shang et al. Reference Shang, Yin, Li, Jin and Dong2009). Similar approaches are used for the detection of glucose in serum (Tang et al. Reference Tang, Cao, Xu, Zhuo, Ge, Li and Yu2008), I− ions (Chen et al. Reference Chen, Cheng and Tseng2009), and for high throughput screening of glycoproteins (Kim et al. Reference Kim, Park, Oh, Oh and Kim2009b). The latter approach relies on the alteration of the energy transfer between lectin-conjugated quantum dots and carbohydrated Au nanoparticles in the presence of glycoproteins.
The use of quantum dots as a donor for energy transfer in a hybrid system takes advantage of their high quantum yield and photostability, and enables multiplexed sensing at a single excitation wavelength. Kim et al. (Reference Kim, Oh, Oh, Ko, Han and Kim2008) used this ability by introducing peptide-conjugated Au nanoparticle–quantum dots in order to measure the activity of proteases (c.f. Fig. 13). Initially, these conjugates show high-energy transfer from the excited donor QD to the metal nanoparticle, i.e. the fluorescence signal of the QD is efficiently quenched (cf. Fig. 13b(ii)). The peptide acts as a substrate for the protease. Consequently, the interaction of the protease with the peptide modulates the energy transfer. These alterations in the quenching rate can be used to quantitatively measure the activity of protease, as demonstrated in Fig. 13 for MMP-7, caspase 3, and thrombin. Alternative routes apply fluorescent polymers instead of quantum dots, e.g. to build up displacement sensor arrays. The latter enabled the selective detection of various proteins (You et al. Reference You, Miranda, Gilder, Ghosh, Kim, Erdogan, Krovi, Bunz and Rotello2007). The specific modification of the Au particle surface with hydrophobic, aromatic, or hydrogen-bonding functional groups provides the possibility to precisely tune the nanoparticle–protein and nanoparticle–polymer interaction.
Determination of the activity of proteases by means of peptide-conjugated Au nanoparticle quantum dots. (a) Calibration curves for (i) MMP-7, (ii) caspase-3, and (iii) thrombin. The protease activity represents the concentration of cleaved peptides/min (nM/min). (b) Multiplexed assay of proteases based on the use of QDs with different colors (SA-QD525, SA-QD605, and SA-QD655 from left to right). Biotinylated peptide substrates for MMP-7, caspase-3, and thrombin are conjugated to AuNPs. The resulting Pep-AuNPs are correlated with SA-QD525, SA-QD605, and SA-QD655, respectively. (i) SA-QDs only. (ii) SA-QDs+respective Pep-AuNPs. (iii) SA-QDs+Pep-AuNPs+MMP-7. (iv) SA-QDs+Pep-AuNPs+caspase-3. (v) SA-QDs+Pep-AuNPs+thrombin. (vi) QDs+Pep-AuNPs+mixture of the respective protease and its inhibitor. From Kim et al. (Reference Kim, Oh, Oh, Ko, Han and Kim2008), reprinted with the permission of the American Chemical Society.

DNA hybridization sensors utilize the specific binding of complementary DNA strands to achieve a high degree of selectivity. Several strategies have been developed to achieve discrimination of the formed complexes from unbound single stranded (ss)DNA. Induced quenching of fluorescently labeled target sequences upon hybridization to complementary strands, which are immobilized to a nanoparticle, enables the quantitative detection of an analyte by analyzing the decline in the fluroescence signal (Wu et al. Reference Wu, Jiang, Fu, Shen and Yu2006). Alternatively, the different binding affinities of ss-DNA and ds-DNA to citrate-coated Au nanoparticles provide a possibility to selectively detect DNA molecules based on hybridization reactions. Li & Rothberg (Reference Li and Rothberg2004a) demonstrated that this approach can be utilized to detect a specific target sequence in a complex mixture of DNA. Hybridization of these target strands to complementary sequences prevents binding of these ds-DNA complexes to the nanoparticles in contrast to the non-hybridized ss-DNA sequences. Hence, the fluorescence of these hybridized strands is preserved. The sensitivity provided by quenching-based hybridization sensors enables the identification of single base-pair mismatches (Li & Rothberg, Reference Li and Rothberg2004b). The same principle has been employed for RNA screening, e.g. for the detection of the hepatitis C virus (Griffin et al. Reference Griffin, Singh, Senapati, Rhodes, Mitchell, Robinson, Yu and Ray2009).
The identification of single base-pair mismatches can also be accomplished by means of molecular beacons, which are composed of ss-DNA or peptide molecules with a hairpin region. Conformational changes upon analyte binding induce distance changes, which are related to variations in the fluorophore–quencher molecule distance, and hence release the fluorophore from its initially quenched state. Originally implemented with organic quencher molecules, e.g. 4-((4′-(dimethylamino)phenyl)azo)benzoic acid (DABCYL), the ability to detect unlabeled single-base pair mismatches by means of this approach has been further increased by taking advantage of the 100 times more efficient quenching of Au particles (Dubertret et al. Reference Dubertret, Calame and Libchaber2001) compared with molecular quenchers. Multiplexing of different target sequences can be obtained by using spectrally distinguishable fluorescent tags (Ray et al. Reference Ray, Darbha, Ray, Hardy and Walker2007).
Immunosensors benefit from the existence of a broad spectrum of antibodies, which preserve their immuno-activity when bound to metal nanoparticles. In sandwich immunoassays, sensitive recognition of antigens is achieved by immunoreaction of the analyte protein with two monoclonal antibodies carrying either the donor quantum emitter or the nanoparticle acceptor. Both antibodies are directed to epitope-binding sequences on the analyte protein with a separation enabling efficient nanoparticle energy transfer from the donor to the acceptor. This type of immunosensing is applied, e.g. for the detection of human IgGs based on quenching of attached NIR-emitting quantum dots (Liang et al. Reference Liang, Pan, Li, Jiang, Zhang and Zhu2009), and cardiac troponin T (cTnT) detection based on simultaneous binding of Au nanoparticle-labeled M11·7 antibodies and fluorescence-labeled M7 antibodies with a detection sensitivity down to concentrations of 0·02 nm (Mayilo et al. Reference Mayilo, Kloster, Wunderlich, Lutich, Klar, Nichtl, Kürzinger, Stefani and Feldmann2009).
Alternatively, immunofluorescence assays, which quench the quantum emitter directly by Au nanoparticle-labeled antibodies have been established. In contrast to sandwich immunoreactions, these approaches do not require fluorescence labeling of a second antibody. Instead, this approach necessitates the separation of the formed sandwich complexes and Au nanoparticle-labeled antibodies (Ao et al. Reference Ao, Gao, Pan, He and Cui2006; Peng et al. Reference Peng, Chen, Jiang, Zhang, Shen and Yu2007). Ao et al. (Reference Ao, Gao, Pan, He and Cui2006) introduced an immunoassay based on this principle for the detection of α-fetoprotein (AFP, a serum biomarker of hepatocellular carcinoma (HCC). AFP-coated magnetic nanoparticles were used to separate the uncoated Au nanoparticles from the solution. The concentration of AFP is determined by the quenching level after reaction with fluorescein isothiocyanate (FITC).
A new class of turn-on target molecules exploited for quenching-related sensors are specific oligonucleotides. They can be designed to have a high-binding selectivity for specific target molecules, e.g. small molecules, metal ions, or even proteins. These apatmer assays made it possible to detect cancer marker proteins, thrombin, and a selection of quadruplex binding ligands (Wu et al. Reference Wu, Jiang, Fu, Shen and Yu2006; Jin et al. Reference Jin, Li and Bai2009; Mo et al. Reference Mo, Yang, Guo and Wen2007; Huang et al. Reference Huang, Chiu, Huang and Chang2007; Wang et al. Reference Wang, Chen, Qian and Zhao2008). Recently, aptamer nanoflares have been also employed to measure the concentration of intercellular analytes in live cells. Zheng et al. (Reference Zheng, Seferos, Giljohann, Patel and Mirkin2009) demonstrated the ability to detect adenosine triphosphate (ATP) with high selectivity compared to other nucleotide-triphosphate molecules such as guanosine triphosphate (GTP) (cf. Fig. 14). The sensitivity of this aptamer nanoflare approach enables tracking of changes in the APT concentration down to 0·1–3 mM. Compared to molecular beacons and other quenching-related nanoconjugates, these aptamer-nanoflares can be more easily infiltrated to live cells. Multiplex detection of two analytes has been demonstrated based on the simultaneous use of different quantum dot-labeled aptamers (Liu et al. Reference Liu, Lee and Lu2007). The sensitivity of nanoparticle-mediated fluorescence quenching assays is, in principle, limited by the fluorescence background. Improvements in sensitivity can be achieved by using quantum emitters with high quantum yield. High quantum yield emitters make it possible to reduce the labeling concentration and give rise to more efficient energy transfer to metal nanostructures. Further improvement can be achieved by optimizing the overlap between the donor's emission spectrum and the LSPR of the Au nanoparticle. It can be expected that the sensitivity of long-range Au nanoparticle quenching biosensors can be significantly increased over standard biosensors, which provides the prospect of quantitative analysis and high-throughput screening of molecules that inhibit or activate specific interactions between biomolecules.
(a) Solution fluorescence spectra of aptamer nano-flares treated with ATP (2 mM) and UTP, GTP, and CTP. (b) Fluorescence spectra of aptamer nano-flares in solutions with increasing concentrations of ATP (0·1–3·0 mM). Inset shows the peak intensity as a function of ATP concentration. From Zheng et al. (Reference Zheng, Seferos, Giljohann, Patel and Mirkin2009), reprinted with the permission of the American Chemical Society.

6.6 Plasmon rulers
We have discussed that the distance-dependent alteration of fluorescence by a metal nanostructure can be employed for the discrimination of bound and unbound analytes. However, energy transfer of a dipole emitter to a Au nanoparticle acceptor, often also denoted as nanometal surface energy transfer (NSET), provides also other sensing possibilities (Jennings et al. Reference Jennings, Schlatterer, Singh, Greenbaum and Strouse2006a, Reference Jennings, Singh and Strouseb; Yun et al. Reference Yun, Javier, Jennings, Fisher, Hira, Peterson, Hopkins, Reich and Strouse2005; Lu et al. Reference Lu, Schöps, Woggon and Niemeyer2008). For example, it makes it possible to quantify the distance between a fluorophore and a metal nanostructure. Hence, this process can be employed as a plasmon ruler, similar to distance measurements based on standard FRET, which makes use of organic dyes or quantum dots as donor–acceptor pairs. Donor–acceptor pairs composed of a quantum emitter and a metal nanoparticle can overcome several limitations of molecular FRET systems, which often suffer from low quantum efficiencies, narrow excitation, and broad emission bands.
The dependence of the spontaneous emission rate on the emitter–nanoparticle distance has been measured in several recent studies (Anger et al. Reference Anger, Bharadwaj and Novotny2006; Kühn et al. Reference Kühn, Hakanson, Rogobete and Sandoghdar2006; Seelig et al. Reference Seelig, Leslie, Renn, Kühn, Jacobsen, van de Corput, Wyman and Sandoghdar2007; Chhabra et al. Reference Chhabra, Sharma, Wang, Zou, Lin, Yan, Lindsay and Liu2009). The main difference between molecular FRET and nanoparticle-mediated energy transfer is the dependence of the energy-transfer efficiency on the separation between donor and acceptor (nanoparticle). Molecular FRET exhibits a 1/R 6 dependence, characteristic for a dipole–dipole interaction, whereas NSET exhibits a 1/R 4 dependence (Yun et al. Reference Yun, Javier, Jennings, Fisher, Hira, Peterson, Hopkins, Reich and Strouse2005). Besides the enlarged interaction range, NSET also exhibits lower chemical degradation and photobleaching. Thus, these plasmon rulers enable investigations of conformational changes of a protein upon substrate binding and tracking of biomolecular reactions, which are generally difficult to access by standard FRET. Recent NSET studies focused on RNA folding, DNA melting, and conformational changes (Yun et al. Reference Yun, Javier, Jennings, Fisher, Hira, Peterson, Hopkins, Reich and Strouse2005; Jennings et al. Reference Jennings, Schlatterer, Singh, Greenbaum and Strouse2006a; Lee et al. Reference Lee, Shai, Campolongo, Park and Luo2010). These studies have shown that NSET can be employed to determine DNA length and to track conformational changes upon protein binding in the length range of 3–20 nm (Yun et al. Reference Yun, Javier, Jennings, Fisher, Hira, Peterson, Hopkins, Reich and Strouse2005; Jennings et al. Reference Jennings, Schlatterer, Singh, Greenbaum and Strouse2006a). Conformational changes of BSA induced by variation of the pH level were uncovered by means of the same principle. In this study, fluorescence of BSA tryptophan residues function as donors and gold nanoparticles function as acceptors. Different degrees of quenching of tryptophan fluorescence were assigned to the E, N, and B form of BSA (Singh et al. Reference Singh, Jennings and Strouse2009).
Jennings et al. (Reference Jennings, Singh and Strouse2006b) employed NSET to study a hammerhead ribozyme, an RNA motif composed of a core loop and three adjacent stems. Mg2+ ions can catalyze the cleavage of the substrate strand by conformational rearrangement, i.e. by complex formation. Folding of the complex leads to a decrease of the fluorophore–nanoparticle distance and gives rise to donor quenching. Different conformational states were revealed, namely a free state, an annealed state, and a hammerhead state (cf. Fig. 15). The conformational states identified with NSET are in good agreement with the states resolved with molecular FRET. Time-resolved donor fluorescence measurements also uncovered the kinetics of substrate cleavage. Hence, the observed conformational states could be directly correlated with the optically measured binding and cleavage kinetics of the hammerhead ribozyme. In a similar study, Griffin & Ray (Reference Griffin and Ray2008) identified four separate states in the unfolding reaction of a two-way junction hairpin ribozyme by time-resolved nanoparticle-mediated energy transfer.
Investigation of the process of the hammerhead cleavage by means of photoluminescence quenching correlated to structural changes in the hammerhead ribozyme via energy transfer from fluorescein to 1·4 nm Au nanoparticles (NSET, part a) and from fluorescein to AlexaFluor647 molecules (FRET, part b). The most intense spectrum shows the intensity of the substrate alone and after annealing with quencher-bound ribozyme (blue). Finally, the solution is adjusted to 20 mM Mg2+ and PL is measured again (red). Modified from [Jennings et al. Reference Jennings, Singh and Strouse2006b], reprinted with the permission of the American Chemical Society.

The application of plasmonic rulers in cellular environments is a major challenge. Measuring distances of independent entities, in particular in vivo, necessitates separation of the donor and the acceptor in the cellular membranes, such that the interacting components can be labeled without cross-linking. A step toward such measurements was recently demonstrated by Chen et al. They introduced an approach to measure the distance between two binding sites of a membrane receptor in live cells (Chen et al. Reference Chen, ODonoghue, Huang, Kang, Phillips, Chen, Estevez, Yang and Tan2010). The principle of this approach is illustrated in Fig. 16a. It uses aptamer gold nanoparticle conjugates, which can be designed such that a broad range of donor–nanoparticle distances is covered. The interaction range can be varied either by changing the size of the gold nanoparticle acceptor or by different aptamer configurations (cf. Fig. 16c). The application of these plasmonic rulers in live cells enabled the determination of the distance between the aptamer-binding site and the antibody-binding site of the membrane protein PTK7 in the membrane of leukemia T-cells. A decrease of the fluorescence intensity with increasing size of the Au nanoparticle conjugate has been observed. The distance between the two binding sites in their natural environment has been determined to be ~13·4 nm (cf. Fig. 16b). Comparative molecular FRET measurements on the same system showed only weak efficiencies. This example demonstrates that nanoparticle-mediated energy transfer can be employed for the measurement of distances that are beyond the range of the dipole–dipole interaction of molecular FRET.
A plasmon ruler for distance measurements in cellular environments. (a) Schematic representation of a nanoruler based on NSET for the investigation of the distance between two binding sites in the PTK7 receptor in the plasma membrane of a live cell. (b) Binding site distance determination by means of the variations in the quenching efficiency Φ. (c) Fluorescence intensity modification observed of Alexa488-labeled anti-PTK7 in the presence of varying sizes of gold NP-aptamer conjugates in a live cell membrane. The fluorescence intensity is monitored using flow cytometry. Modified from Chen et al. (Reference Chen, ODonoghue, Huang, Kang, Phillips, Chen, Estevez, Yang and Tan2010) with the permission of the American Chemical Society.

6.7 Nanoscale imaging
The spatial resolution of conventional light microscopy is limited by diffraction to ~250 nm, which prevents inter-protein distances and many sub-cellular structures from being resolved. Therefore, optical imaging techniques that are diffraction unlimited are of major interest for molecular biology and biophysics. Several new fluorescence-based concepts have been established recently. Among them are stimulated emission depletion microscopy (STED), ground state depletion microscopy (GSD), stochastic optical reconstruction microscopy (STORM), photoactivable laser microscopy (PALM), and super-resolution optical fluctuation imaging (SOFI) (Hell, Reference Hell2007; Westphal et al. Reference Westphal, Rizzoli, Lauterbach, Kamin, Jahn and Hell2008; Huang et al. Reference Huang, Wang, Bates and Zhuang2008a; Heintzmann et al. Reference Heintzmann, Jovin and Cremer2002; Betzig et al. Reference Betzig, Patterson, Sougrat, Lindwasser, Olenych, Bonifacino, Davidson, Lippincott-Schwartz and Hess2006; Dertinger et al. Reference Dertinger, Colyer, Lyer, Weiss and Enderlein2009). Some of these techniques are able to provide resolutions of 20–30 nm and to image cells in vivo. However, they rely on prior knowledge about the fluorescent labels and do not provide any spectroscopic capabilities. Near-field microscopy based on plasmonic nanostructures, such as tip-enhanced near-field microscopy (TENOM), provides similar resolutions and is, in principle, not restricted to fluorescence imaging. However, near-field microscopy is restricted to surface imaging and cannot visualize processes inside a cell.
Several studies based on TENOM have demonstrated single molecule sensitivity (Gerton et al. Reference Gerton, Wade, Lessard, Ma and Quake2004; Frey et al. Reference Frey, Witt, Felderer and Guckenberger2004; Anger et al. Reference Anger, Bharadwaj and Novotny2006; Höppener & Novotny, Reference Höppener and Novotny2008b) and resolutions better than what is possible with aperture-type near-field microscopy (Pohl, Reference Pohl1984; Dunn, Reference Dunn1999; Hecht et al. Reference Hecht, Sick, Wild, Deckert, Zenobi, Martin and Pohl2000). In TENOM, fluorescent molecules emit in the proximity of a metal tip or any other metal nanostructure, which reduces the excited state lifetime of the molecules. As most photochemical reactions happen via excited states, the reduced molecular lifetime near a metal tip improves the photostability. Furthermore, the enhanced radiative decay rate of molecules near metals makes it possible to image weakly fluorescent molecules.
Near-field imaging based on plasmonic nanostructures relies on optimized geometries that provide high field enhancement and high light confinement. These nanostructures function as optical antennas, devices that efficiently convert free propagating radiation to localized energy, and vice versa (Bharadwaj et al. Reference Bharadwaj, Deutsch and Novotny2009). Optimization of these structures in the optical regime has to take into account the mutual coupling between antenna and molecule. Besides exploiting finite gold, silver, and aluminum nanostructures, silicon cantilever probes that are commonly used in conventional atomic force microscopy have also been used as nanoscopic light sources (Gerton et al. Reference Gerton, Wade, Lessard, Ma and Quake2004).
Near-field imaging is based on raster-scanning a sample in close proximity to an optical probe, such as an optical antenna or any other laser-irradiated nanostructure. A scan image is established by continuously recording an optical signal (fluorescence, scattered light, Raman scattering, etc.) originating from the probe–sample interaction (cf. Fig. 17a). The probe–sample distance is prevailingly controlled by sensing normal interaction forces or shear forces between probe and the sample, similar to atomic force microscopy (Karrai & Grober, Reference Karrai and Grober1995; Naber et al. Reference Naber, Maas, Razavi and Fischer1999). The probe–sample distance can be maintained within a few nanometers with high precision. Most commonly piezoelectric quartz tuning forks are employed as local force sensors. These tuning forks are driven near their natural resonance frequency. As the probe–sample interaction shifts the resonance to higher frequencies, the frequency shift can be calibrated against the probe–sample distance and used in a feedback circuit to maintain a constant probe–sample separation. The probe–sample distance control has been extended to liquid environments, which makes it possible to study biological samples under physiological conditions (Höppener & Novotny, Reference Höppener and Novotny2008a; Frey et al. Reference Frey, Paskarbeit and Anselmetti2009; van Zanten et al. Reference van Zanten, Lopez-Bosque and Garcia-Parajo2010). To ensure a high force sensitivity, it is necessary to operate the tuning fork at small oscillation amplitudes and to prevent it from interacting with the liquid. The latter can be accomplished by either immersing only the probe into the liquid (Höppener et al. Reference Höppener, Siebrasse, Peters, Kubitscheck and Naber2005) or by incorporating a diving bell (Koopman et al. Reference Koopman, Cambi, de Bakker, Joosten, Figdor, van Hulst and Garcia-Parajo2004). Both methods have been shown to control tip–sample distances with high accuracy and reliability even on samples with significant height changes.
Antenna-assisted fluorescence imaging. (a) Schematic representation of the principle of antenna-assisted microscopy. (b) Scanning electron graphs of different antenna concepts applied for membrane protein imaging. (i) Particle antenna composed of a single spherical Au particle fabricated by a bottom-up assembly technique. (ii) Monopole antenna directly fabricated on top of an aperture probe by FIB milling. (Bii) Modified from Taminiau et al. (Reference Taminiau, Moerland, Segerink, Kuipers and van Hulst2007) with the permission of the American Chemical Society.

An important aspect in near-field imaging with optical antennas is the antenna efficiency. By optimization of geometry and material, optical antennas can be designed to be resonant with the laser frequency, to provide strong field enhancement and to exhibit low radiative damping. The demand to fabricate these antenna structures at the foremost end of a sharply pointed tip or aperture probe requires sophisticated nanofabrication techniques, such as FIB milling or nanomanipulation techniques (Anger et al. Reference Anger, Bharadwaj and Novotny2006; Taminiau et al. Reference Taminiau, Moerland, Segerink, Kuipers and van Hulst2007; Farahani et al. Reference Farahani, Eisler, Pohl, Pavius, Fluckiger, Gasser and Hecht2007). Figure 17b shows scanning electron microscopy (SEM) images of two common antenna probes, a colloidal nanoparticle probe, and a tip-on-aperture probe. Colloidal metal nanoparticles are ideal building blocks for the bottom-up fabrication of optical antennas because their plasmon resonance can be tuned over a wide range by their size, geometry, and material. Their attachment to sharply pointed dielectric or metal tips has been optimized by surface functionalization with self-assembled monolayers of silanes or thiols. Figure 17b(i) shows a particle antenna composed of a single spherical Au particle with a diameter of ~80 nm. In principle, multiple nanoparticles of different size can be stacked together to improve the antenna efficiency. To efficiently excite these antennas it is favorable to use radially polarized laser beams. These beams exhibit a strong longitudinal electric field in the laser focus and hence the right symmetry for on-axis illumination (cf. Fig. 17a). An optical antenna consisting of a single 80 nm gold nanoparticle provides a fluorescence enhancement of ~8, which is sufficient for imaging isolated sample features, such as membrane proteins. Smaller nanoparticles provide lower fluorescence enhancement and larger nanoparticles have low field confinement. A way out is to use rod-shaped particles, where the long-axis provides the necessary polarizability for field enhancement and the short-axis defines the field confinement.
Gold nanoparticle antennas have been employed for high-resolution imaging of single dye molecules and for studying protein distributions in cellular membranes (Höppener & Novotny, Reference Höppener and Novotny2008a). As an example, Fig. 18c shows a near-field image of fluorescently labeled Ca2+ ion pump proteins (PMCAs) in the plasma membrane of a red blood cell. The gold nanoparticle antenna provides a spatial resolution of ~60 nm. For comparison, a standard confocal fluorescence image of the same area is shown in Fig. 18b and a confocal image of the entire cell membrane is rendered in Fig. 18a. The near-field image reveals that the PMCAs are uniformly distributed and that they have mean separations of less than 100 nm. Note that the external laser-irradiation of the gold nanoparticle antenna also leads to a direct illumination of the sample surface, which gives rise to background fluorescence as seen in Fig. 18c. This background obscures weak near-field signals in dense protein regions, but it can be suppressed by modulating the probe–sample distance and demodulating the fluorescence signal at the modulation frequency (Höppener & Novotny, Reference Höppener and Novotny2009). The fluorescence background can also be minimized by reducing the sample excitation area, for example, by irradiating the nanoparticle with light from a circular aperture. Instead of a nanoparticle, Taminiau et al. employed a short tip fabricated to the side of a near-field aperture probe, as shown in Fig. 17b(ii). These tip-on-aperture probes have been FIB milled from entirely aluminum-coated tapered-glass fibers (Taminiau et al. Reference Taminiau, Moerland, Segerink, Kuipers and van Hulst2007) and the length of the tip has been chosen to mimmick a monopole antenna. Illumination of this antenna is realized by direct excitation through the aperture probe. This near-field illumination scheme yields low background and a reduced photobleaching rate as compared with external illumination schemes. However, these advantages are offset by the technically challenging fabrication steps.
Antenna-assisted fluorescence imaging of the plasma membrane bound Ca2+-ATPase in red blood cells. (a) Confocal overview image of the entire cell surface. (b) Confocal fluorescence image of the same area imaged in (c) with an nanoparticle antenna. (c) Protein map of individual PMCAs recorded with an 60 nm spherical Au particle antenna.

Recently, van Zanten et al. (Reference van Zanten, Lopez-Bosque and Garcia-Parajo2010) used such tip-on-aperture probes for imaging of proteins and nanodomains in cell membranes. The recorded fluorescence maps of integrin LFA-1 transmembrane proteins expressed in functional membranes of monocytes revealed spatial aggregation of LFA-1. The spatial resolution was determined to be 30 nm and the signal-to-background ratio of the order of ~30, which clearly demonstrates the benefit of confined excitation.
Biological imaging using optical antenna probes is well suited for studying the complex protein organization in cellular membranes. Further improvements in the design and fabrication of antenna probes will improve the resolution and the local field enhancement, and thus make it possible to achieve a true protein resolution of ~5–10 nm. In addition, this high-resolution microscopic technique can be combined with time-resolved fluorescence spectroscopy for gaining dynamical information on membrane organization. Due to the employed distance control, this technique also provides simultaneous information on the membrane topology.
7. Summary
This review article summarized the wide application of plasmonic nanostructures in the fields of biosensing and bioimaging. Fluorescence contrast is of major importance in studies where the analyte concentration is restricted, and thus, too low to be measured by means of the shift in the plasmon resonance peak or by means of Raman scattering. Plasmon-mediated fluorescence biosensing and imaging take advantage of strong local field enhancements, three-dimensional light confinement, and the associated signal-to-noise gain. Besides the prospect of establishing a new class of bright and photostable probes by combining metal nanostructures and quantum emitters, plasmonic rulers have become an alternative to FRET for the investigation of molecular interactions and for distance measurements in cellular systems. Plasmonic rulers are most valuable for studying systems with large interaction ranges and for applications that demand long observation times. Plasmonic biosensors boost the sensitivity in biodetection and expand the possibilities of high throughput screening. Plasmon-mediated fluorescence provides also new prospects for nanoscale imaging, especially since the efficiency of weak emitters can be drastically enhanced. This ability will open up new strategies for imaging with true-protein resolution and for the identification of naturally fluorescent cellular entities.
Acknowledgments
C. H. thanks the ‘Ministerium für Wissenschaft, Innovation, Forschung und Technologie des Landes Nordrhein-Westfalen’ for their financial support. L. N. acknowledges financial support by the National Science Foundation (grant CBET-0930074).